Fife, WA Map & Demographics
Fife Map
Fife Overview
$36,226
PER CAPITA INCOME
$101,552
AVG FAMILY INCOME
$84,538
AVG HOUSEHOLD INCOME
17.3%
WAGE / INCOME GAP [ % ]
82.7¢/ $1
WAGE / INCOME GAP [ $ ]
$11,971
FAMILY INCOME DEFICIT
0.35
INEQUALITY / GINI INDEX
10,887
TOTAL POPULATION
5,693
MALE POPULATION
5,194
FEMALE POPULATION
109.61
MALES / 100 FEMALES
91.23
FEMALES / 100 MALES
32.5
MEDIAN AGE
3.3
AVG FAMILY SIZE
2.7
AVG HOUSEHOLD SIZE
6,263
LABOR FORCE [ PEOPLE ]
74.6%
PERCENT IN LABOR FORCE
3.8%
UNEMPLOYMENT RATE
Fife Zip Codes
Fife Area Codes
Income in Fife
Income Overview in Fife
Per Capita Income in Fife is $36,226, while median incomes of families and households are $101,552 and $84,538 respectively.
| Characteristic | Number | Measure |
| Per Capita Income | 10,887 | $36,226 |
| Median Family Income | 2,583 | $101,552 |
| Mean Family Income | 2,583 | $108,189 |
| Median Household Income | 4,011 | $84,538 |
| Mean Household Income | 4,011 | $96,107 |
| Income Deficit | 2,583 | $11,971 |
| Wage / Income Gap (%) | 10,887 | 17.29% |
| Wage / Income Gap ($) | 10,887 | 82.71¢ per $1 |
| Gini / Inequality Index | 10,887 | 0.35 |
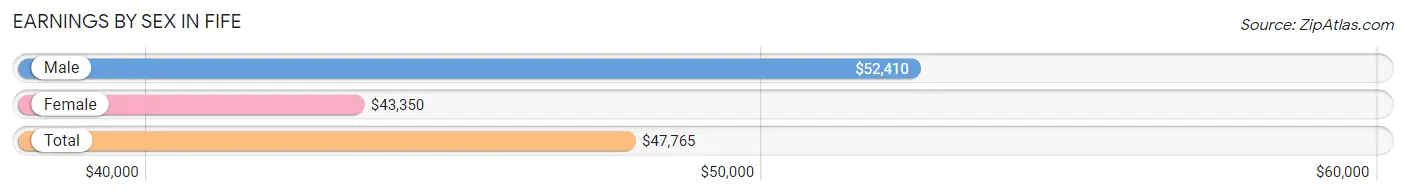
Earnings by Sex in Fife
Average Earnings in Fife are $47,765, $52,410 for men and $43,350 for women, a difference of 17.3%.
| Sex | Number | Average Earnings |
| Male | 3,433 (53.9%) | $52,410 |
| Female | 2,931 (46.1%) | $43,350 |
| Total | 6,364 (100.0%) | $47,765 |
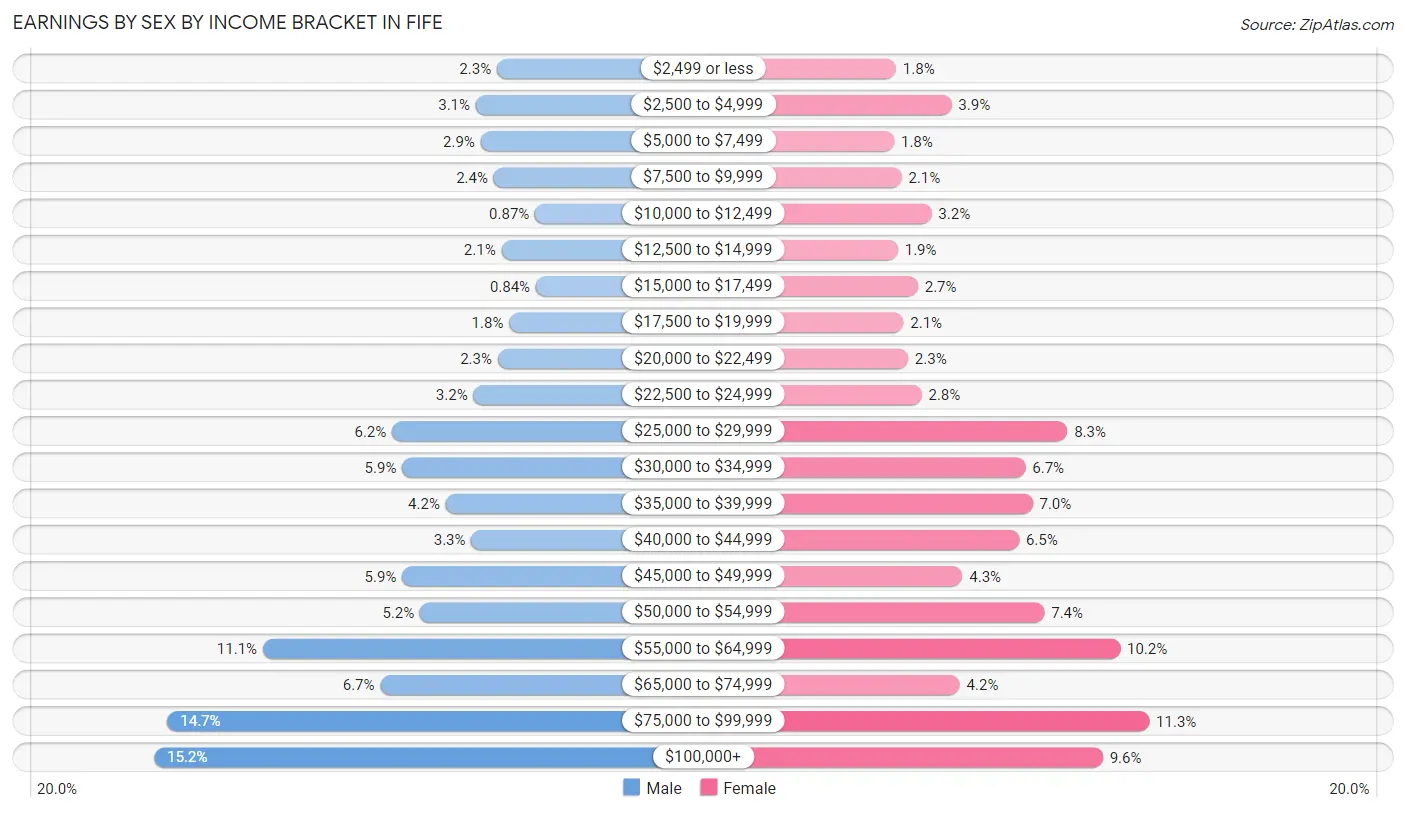
Earnings by Sex by Income Bracket in Fife
The most common earnings brackets in Fife are $100,000+ for men (520 | 15.1%) and $75,000 to $99,999 for women (332 | 11.3%).
| Income | Male | Female |
| $2,499 or less | 79 (2.3%) | 54 (1.8%) |
| $2,500 to $4,999 | 106 (3.1%) | 115 (3.9%) |
| $5,000 to $7,499 | 100 (2.9%) | 52 (1.8%) |
| $7,500 to $9,999 | 83 (2.4%) | 60 (2.1%) |
| $10,000 to $12,499 | 30 (0.9%) | 93 (3.2%) |
| $12,500 to $14,999 | 73 (2.1%) | 56 (1.9%) |
| $15,000 to $17,499 | 29 (0.8%) | 78 (2.7%) |
| $17,500 to $19,999 | 63 (1.8%) | 62 (2.1%) |
| $20,000 to $22,499 | 78 (2.3%) | 67 (2.3%) |
| $22,500 to $24,999 | 109 (3.2%) | 82 (2.8%) |
| $25,000 to $29,999 | 214 (6.2%) | 242 (8.3%) |
| $30,000 to $34,999 | 201 (5.9%) | 196 (6.7%) |
| $35,000 to $39,999 | 145 (4.2%) | 204 (7.0%) |
| $40,000 to $44,999 | 112 (3.3%) | 189 (6.5%) |
| $45,000 to $49,999 | 201 (5.9%) | 127 (4.3%) |
| $50,000 to $54,999 | 178 (5.2%) | 217 (7.4%) |
| $55,000 to $64,999 | 380 (11.1%) | 300 (10.2%) |
| $65,000 to $74,999 | 229 (6.7%) | 124 (4.2%) |
| $75,000 to $99,999 | 503 (14.6%) | 332 (11.3%) |
| $100,000+ | 520 (15.1%) | 281 (9.6%) |
| Total | 3,433 (100.0%) | 2,931 (100.0%) |
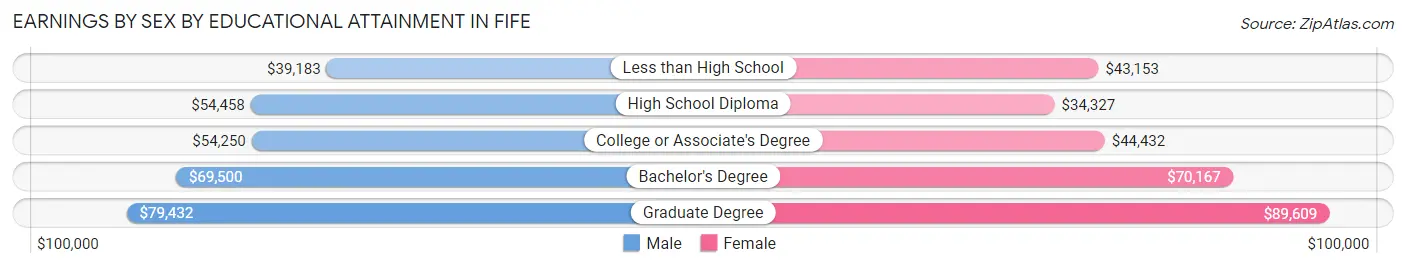
Earnings by Sex by Educational Attainment in Fife
Average earnings in Fife are $57,015 for men and $46,909 for women, a difference of 17.7%. Men with an educational attainment of graduate degree enjoy the highest average annual earnings of $79,432, while those with less than high school education earn the least with $39,183. Women with an educational attainment of graduate degree earn the most with the average annual earnings of $89,609, while those with high school diploma education have the smallest earnings of $34,327.
| Educational Attainment | Male Income | Female Income |
| Less than High School | $39,183 | $43,153 |
| High School Diploma | $54,458 | $34,327 |
| College or Associate's Degree | $54,250 | $44,432 |
| Bachelor's Degree | $69,500 | $70,167 |
| Graduate Degree | $79,432 | $89,609 |
| Total | $57,015 | $46,909 |
Family Income in Fife
Family Income Brackets in Fife
According to the Fife family income data, there are 832 families falling into the $100,000 to $149,999 income range, which is the most common income bracket and makes up 32.2% of all families. Conversely, the less than $10,000 income bracket is the least frequent group with only 36 families (1.4%) belonging to this category.
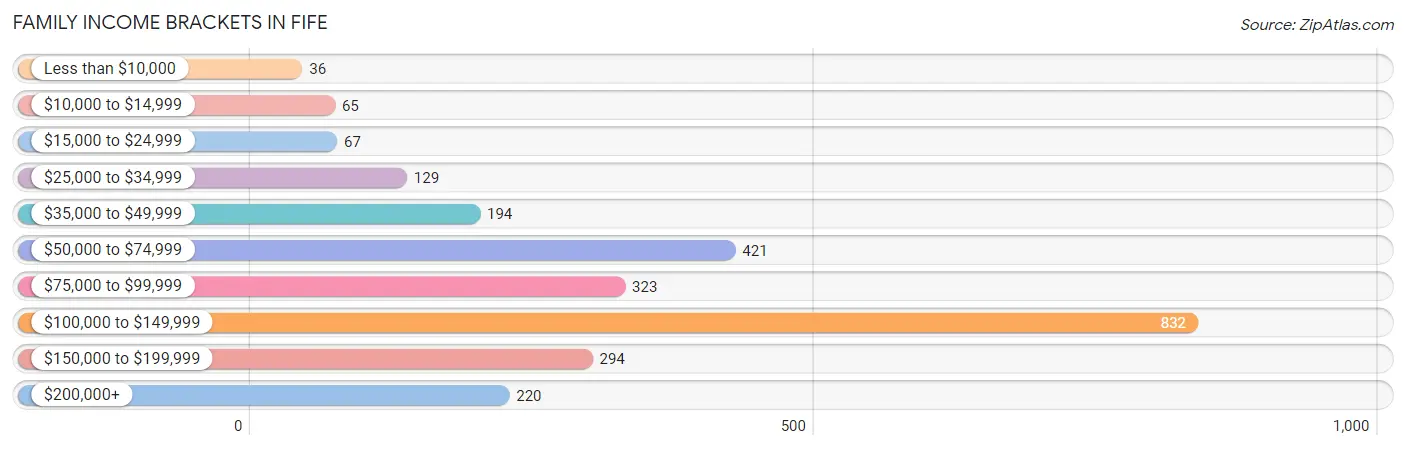
| Income Bracket | # Families | % Families |
| Less than $10,000 | 36 | 1.4% |
| $10,000 to $14,999 | 65 | 2.5% |
| $15,000 to $24,999 | 67 | 2.6% |
| $25,000 to $34,999 | 129 | 5.0% |
| $35,000 to $49,999 | 194 | 7.5% |
| $50,000 to $74,999 | 421 | 16.3% |
| $75,000 to $99,999 | 323 | 12.5% |
| $100,000 to $149,999 | 832 | 32.2% |
| $150,000 to $199,999 | 294 | 11.4% |
| $200,000+ | 220 | 8.5% |
Family Income by Famaliy Size in Fife
6-person families (62 | 2.4%) account for the highest median family income in Fife with $160,500 per family, while 2-person families (1,106 | 42.8%) have the highest median income of $41,704 per family member.
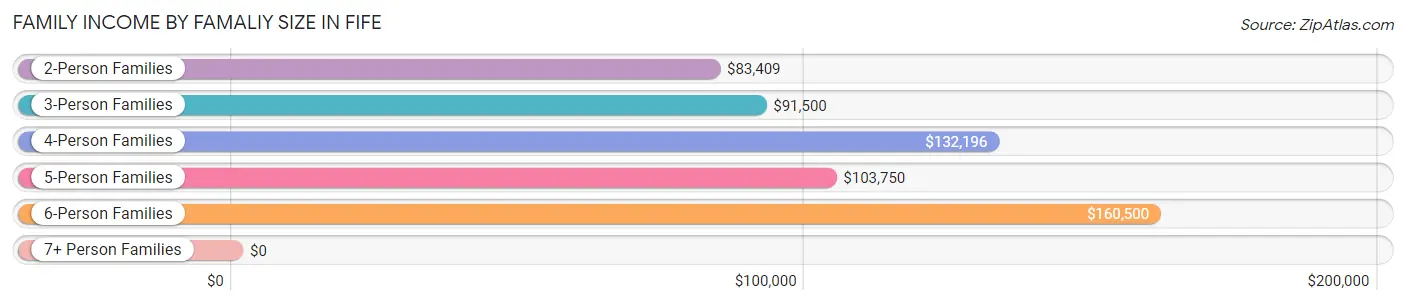
| Income Bracket | # Families | Median Income |
| 2-Person Families | 1,106 (42.8%) | $83,409 |
| 3-Person Families | 478 (18.5%) | $91,500 |
| 4-Person Families | 527 (20.4%) | $132,196 |
| 5-Person Families | 262 (10.1%) | $103,750 |
| 6-Person Families | 62 (2.4%) | $160,500 |
| 7+ Person Families | 148 (5.7%) | $0 |
| Total | 2,583 (100.0%) | $101,552 |
Family Income by Number of Earners in Fife
The median family income in Fife is $101,552, with families comprising 3+ earners (290) having the highest median family income of $141,400, while families with no earners (239) have the lowest median family income of $31,047, accounting for 11.2% and 9.2% of families, respectively.
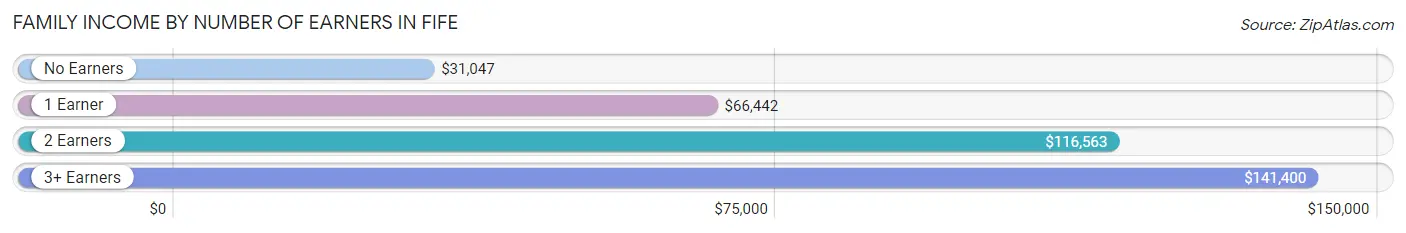
| Number of Earners | # Families | Median Income |
| No Earners | 239 (9.2%) | $31,047 |
| 1 Earner | 666 (25.8%) | $66,442 |
| 2 Earners | 1,388 (53.7%) | $116,563 |
| 3+ Earners | 290 (11.2%) | $141,400 |
| Total | 2,583 (100.0%) | $101,552 |
Household Income in Fife
Household Income Brackets in Fife
With 1,075 households falling in the category, the $100,000 to $149,999 income range is the most frequent in Fife, accounting for 26.8% of all households. In contrast, only 40 households (1.0%) fall into the $10,000 to $14,999 income bracket, making it the least populous group.
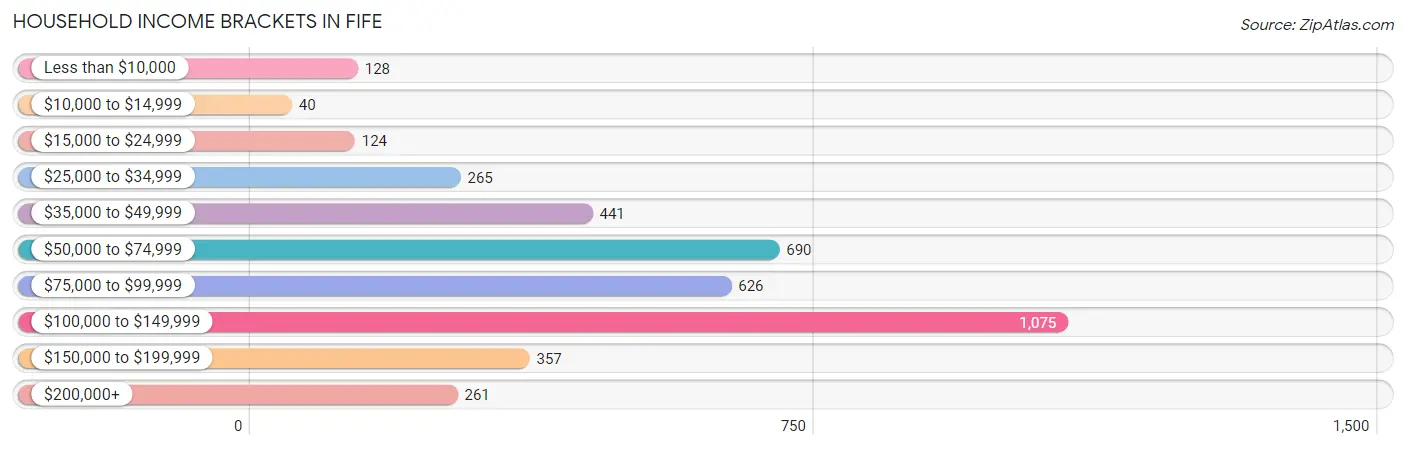
| Income Bracket | # Households | % Households |
| Less than $10,000 | 128 | 3.2% |
| $10,000 to $14,999 | 40 | 1.0% |
| $15,000 to $24,999 | 124 | 3.1% |
| $25,000 to $34,999 | 265 | 6.6% |
| $35,000 to $49,999 | 441 | 11.0% |
| $50,000 to $74,999 | 690 | 17.2% |
| $75,000 to $99,999 | 626 | 15.6% |
| $100,000 to $149,999 | 1,075 | 26.8% |
| $150,000 to $199,999 | 357 | 8.9% |
| $200,000+ | 261 | 6.5% |
Household Income by Householder Age in Fife
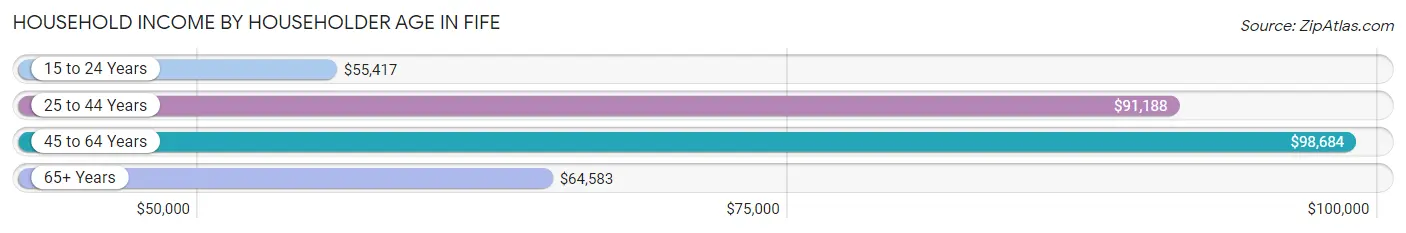
The median household income in Fife is $84,538, with the highest median household income of $98,684 found in the 45 to 64 years age bracket for the primary householder. A total of 1,262 households (31.5%) fall into this category. Meanwhile, the 15 to 24 years age bracket for the primary householder has the lowest median household income of $55,417, with 149 households (3.7%) in this group.
| Income Bracket | # Households | Median Income |
| 15 to 24 Years | 149 (3.7%) | $55,417 |
| 25 to 44 Years | 2,109 (52.6%) | $91,188 |
| 45 to 64 Years | 1,262 (31.5%) | $98,684 |
| 65+ Years | 491 (12.2%) | $64,583 |
| Total | 4,011 (100.0%) | $84,538 |
Poverty in Fife
Income Below Poverty by Sex and Age in Fife
With 10.5% poverty level for males and 13.1% for females among the residents of Fife, 55 to 64 year old males and 55 to 64 year old females are the most vulnerable to poverty, with 136 males (23.4%) and 167 females (28.7%) in their respective age groups living below the poverty level.
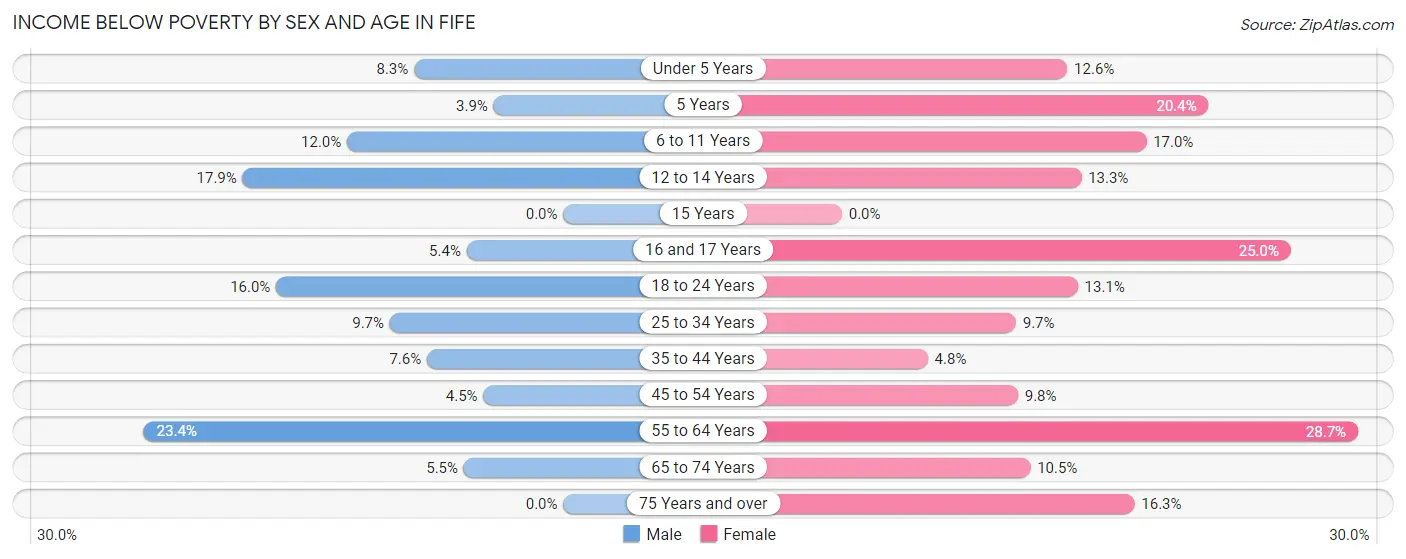
| Age Bracket | Male | Female |
| Under 5 Years | 36 (8.3%) | 32 (12.6%) |
| 5 Years | 8 (3.9%) | 39 (20.4%) |
| 6 to 11 Years | 56 (12.0%) | 79 (17.0%) |
| 12 to 14 Years | 35 (17.9%) | 18 (13.3%) |
| 15 Years | 0 (0.0%) | 0 (0.0%) |
| 16 and 17 Years | 5 (5.4%) | 28 (25.0%) |
| 18 to 24 Years | 83 (16.0%) | 55 (13.1%) |
| 25 to 34 Years | 128 (9.7%) | 109 (9.7%) |
| 35 to 44 Years | 67 (7.6%) | 38 (4.8%) |
| 45 to 54 Years | 23 (4.4%) | 54 (9.8%) |
| 55 to 64 Years | 136 (23.4%) | 167 (28.7%) |
| 65 to 74 Years | 17 (5.5%) | 34 (10.5%) |
| 75 Years and over | 0 (0.0%) | 29 (16.3%) |
| Total | 594 (10.5%) | 682 (13.1%) |
Income Above Poverty by Sex and Age in Fife
According to the poverty statistics in Fife, males aged 15 years and females aged 15 years are the age groups that are most secure financially, with 100.0% of males and 100.0% of females in these age groups living above the poverty line.
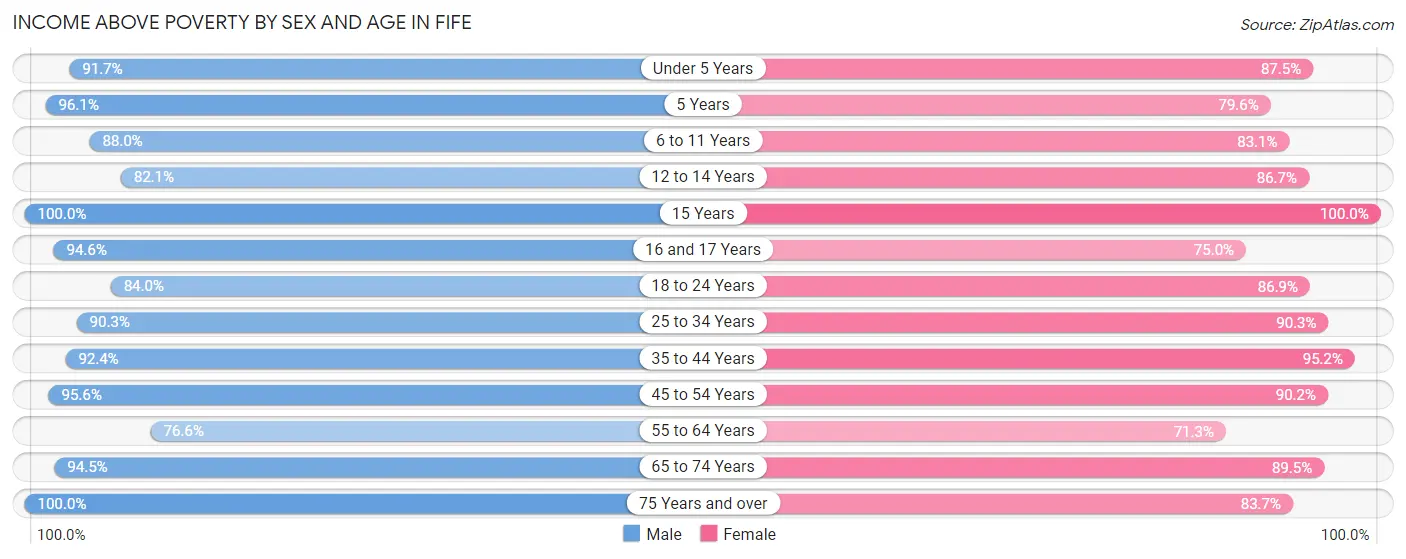
| Age Bracket | Male | Female |
| Under 5 Years | 397 (91.7%) | 223 (87.5%) |
| 5 Years | 198 (96.1%) | 152 (79.6%) |
| 6 to 11 Years | 409 (88.0%) | 387 (83.1%) |
| 12 to 14 Years | 161 (82.1%) | 117 (86.7%) |
| 15 Years | 64 (100.0%) | 62 (100.0%) |
| 16 and 17 Years | 88 (94.6%) | 84 (75.0%) |
| 18 to 24 Years | 436 (84.0%) | 364 (86.9%) |
| 25 to 34 Years | 1,197 (90.3%) | 1,016 (90.3%) |
| 35 to 44 Years | 816 (92.4%) | 757 (95.2%) |
| 45 to 54 Years | 494 (95.6%) | 497 (90.2%) |
| 55 to 64 Years | 446 (76.6%) | 414 (71.3%) |
| 65 to 74 Years | 290 (94.5%) | 290 (89.5%) |
| 75 Years and over | 79 (100.0%) | 149 (83.7%) |
| Total | 5,075 (89.5%) | 4,512 (86.9%) |
Income Below Poverty Among Married-Couple Families in Fife
The poverty statistics for married-couple families in Fife show that 2.2% or 41 of the total 1,851 families live below the poverty line. Families with 5 or more children have the highest poverty rate of 54.3%, comprising of 19 families. On the other hand, families with 1 or 2 children have the lowest poverty rate of 0.0%, which includes 0 families.
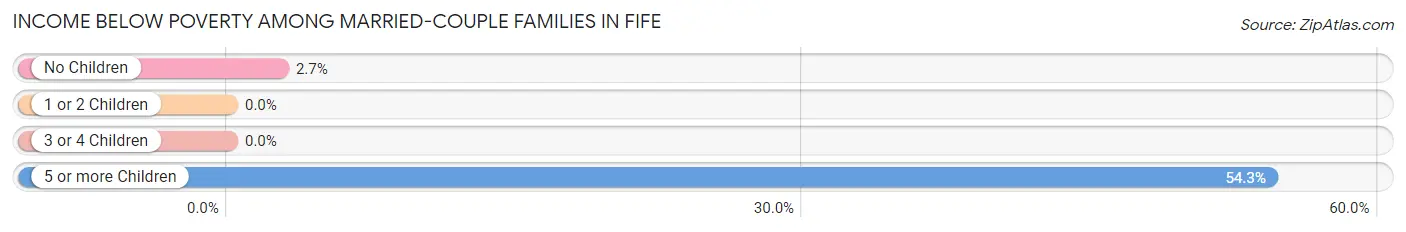
| Children | Above Poverty | Below Poverty |
| No Children | 805 (97.3%) | 22 (2.7%) |
| 1 or 2 Children | 784 (100.0%) | 0 (0.0%) |
| 3 or 4 Children | 205 (100.0%) | 0 (0.0%) |
| 5 or more Children | 16 (45.7%) | 19 (54.3%) |
| Total | 1,810 (97.8%) | 41 (2.2%) |
Income Below Poverty Among Single-Parent Households in Fife
According to the poverty data in Fife, 26.6% or 72 single-father households and 11.7% or 54 single-mother households are living below the poverty line. Among single-father households, those with no children have the highest poverty rate, with 58 households (56.3%) experiencing poverty. Likewise, among single-mother households, those with 3 or 4 children have the highest poverty rate, with 8 households (100.0%) falling below the poverty line.
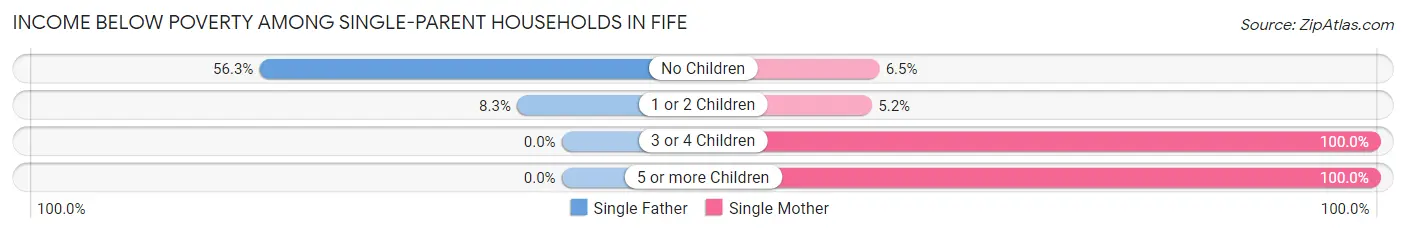
| Children | Single Father | Single Mother |
| No Children | 58 (56.3%) | 13 (6.5%) |
| 1 or 2 Children | 14 (8.3%) | 12 (5.1%) |
| 3 or 4 Children | 0 (0.0%) | 8 (100.0%) |
| 5 or more Children | 0 (0.0%) | 21 (100.0%) |
| Total | 72 (26.6%) | 54 (11.7%) |
Income Below Poverty Among Married-Couple vs Single-Parent Households in Fife
The poverty data for Fife shows that 41 of the married-couple family households (2.2%) and 126 of the single-parent households (17.2%) are living below the poverty level. Within the married-couple family households, those with 5 or more children have the highest poverty rate, with 19 households (54.3%) falling below the poverty line. Among the single-parent households, those with 3 or 4 children have the highest poverty rate, with 8 household (100.0%) living below poverty.
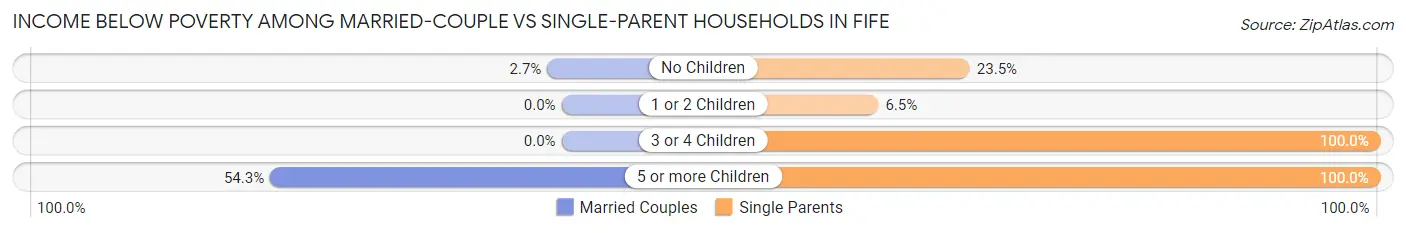
| Children | Married-Couple Families | Single-Parent Households |
| No Children | 22 (2.7%) | 71 (23.5%) |
| 1 or 2 Children | 0 (0.0%) | 26 (6.5%) |
| 3 or 4 Children | 0 (0.0%) | 8 (100.0%) |
| 5 or more Children | 19 (54.3%) | 21 (100.0%) |
| Total | 41 (2.2%) | 126 (17.2%) |
Race in Fife
The most populous races in Fife are White / Caucasian (4,758 | 43.7%), Asian (1,779 | 16.3%), and Hispanic or Latino (1,731 | 15.9%).
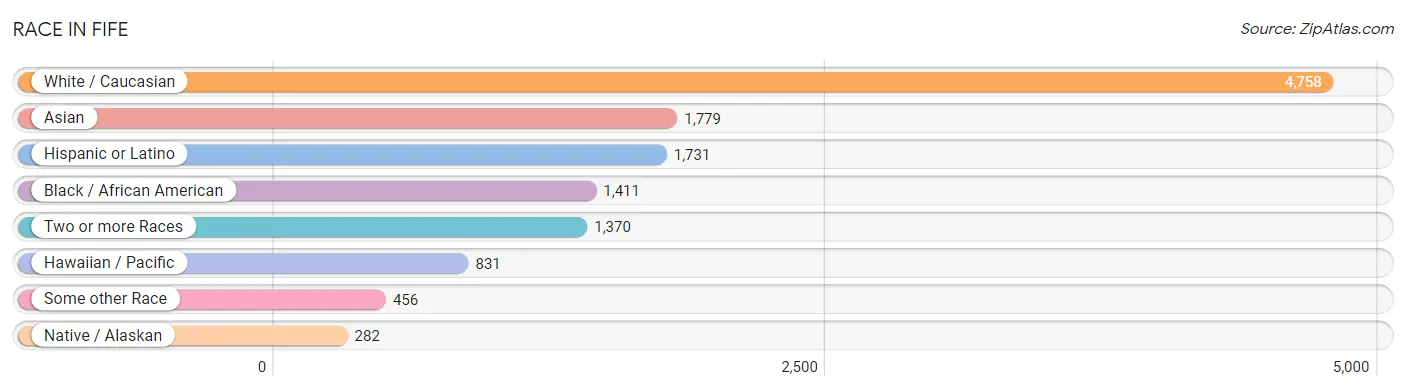
| Race | # Population | % Population |
| Asian | 1,779 | 16.3% |
| Black / African American | 1,411 | 13.0% |
| Hawaiian / Pacific | 831 | 7.6% |
| Hispanic or Latino | 1,731 | 15.9% |
| Native / Alaskan | 282 | 2.6% |
| White / Caucasian | 4,758 | 43.7% |
| Two or more Races | 1,370 | 12.6% |
| Some other Race | 456 | 4.2% |
| Total | 10,887 | 100.0% |
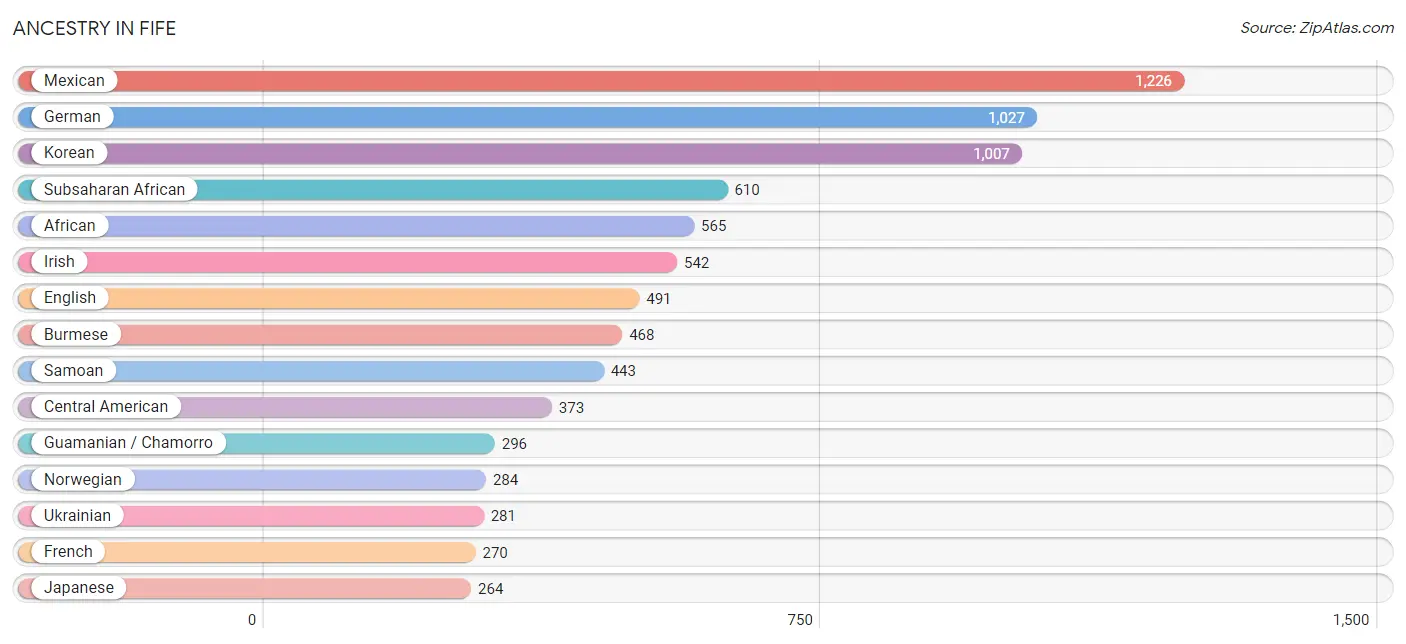
Ancestry in Fife
The most populous ancestries reported in Fife are Mexican (1,226 | 11.3%), German (1,027 | 9.4%), Korean (1,007 | 9.2%), Subsaharan African (610 | 5.6%), and African (565 | 5.2%), together accounting for 40.7% of all Fife residents.
| Ancestry | # Population | % Population |
| African | 565 | 5.2% |
| Alaskan Athabascan | 14 | 0.1% |
| Aleut | 20 | 0.2% |
| American | 223 | 2.1% |
| Arab | 19 | 0.2% |
| Austrian | 18 | 0.2% |
| Bangladeshi | 6 | 0.1% |
| Belgian | 17 | 0.2% |
| Bhutanese | 125 | 1.1% |
| Blackfeet | 70 | 0.6% |
| British | 27 | 0.3% |
| Bulgarian | 21 | 0.2% |
| Burmese | 468 | 4.3% |
| Canadian | 5 | 0.1% |
| Central American | 373 | 3.4% |
| Central American Indian | 7 | 0.1% |
| Cherokee | 4 | 0.0% |
| Chilean | 14 | 0.1% |
| Chippewa | 41 | 0.4% |
| Choctaw | 4 | 0.0% |
| Croatian | 7 | 0.1% |
| Czech | 39 | 0.4% |
| Danish | 15 | 0.1% |
| Dutch | 79 | 0.7% |
| Eastern European | 7 | 0.1% |
| English | 491 | 4.5% |
| European | 203 | 1.9% |
| Fijian | 86 | 0.8% |
| Filipino | 3 | 0.0% |
| Finnish | 13 | 0.1% |
| French | 270 | 2.5% |
| French Canadian | 34 | 0.3% |
| German | 1,027 | 9.4% |
| Greek | 11 | 0.1% |
| Guamanian / Chamorro | 296 | 2.7% |
| Guatemalan | 138 | 1.3% |
| Haitian | 14 | 0.1% |
| Hungarian | 20 | 0.2% |
| Indian (Asian) | 122 | 1.1% |
| Irish | 542 | 5.0% |
| Italian | 253 | 2.3% |
| Jamaican | 4 | 0.0% |
| Japanese | 264 | 2.4% |
| Kenyan | 44 | 0.4% |
| Korean | 1,007 | 9.2% |
| Mexican | 1,226 | 11.3% |
| Native Hawaiian | 165 | 1.5% |
| Northern European | 12 | 0.1% |
| Norwegian | 284 | 2.6% |
| Pakistani | 15 | 0.1% |
| Palestinian | 16 | 0.2% |
| Panamanian | 15 | 0.1% |
| Pennsylvania German | 6 | 0.1% |
| Peruvian | 8 | 0.1% |
| Polish | 136 | 1.3% |
| Portuguese | 33 | 0.3% |
| Puerto Rican | 72 | 0.7% |
| Puget Sound Salish | 126 | 1.2% |
| Russian | 91 | 0.8% |
| Salvadoran | 220 | 2.0% |
| Samoan | 443 | 4.1% |
| Scandinavian | 59 | 0.5% |
| Scotch-Irish | 25 | 0.2% |
| Scottish | 115 | 1.1% |
| Slovak | 9 | 0.1% |
| South African | 1 | 0.0% |
| South American | 22 | 0.2% |
| Spaniard | 30 | 0.3% |
| Sri Lankan | 249 | 2.3% |
| Subsaharan African | 610 | 5.6% |
| Swedish | 239 | 2.2% |
| Swiss | 15 | 0.1% |
| Thai | 64 | 0.6% |
| Turkish | 12 | 0.1% |
| Ukrainian | 281 | 2.6% |
| Welsh | 33 | 0.3% |
| West Indian | 6 | 0.1% | View All 77 Rows |
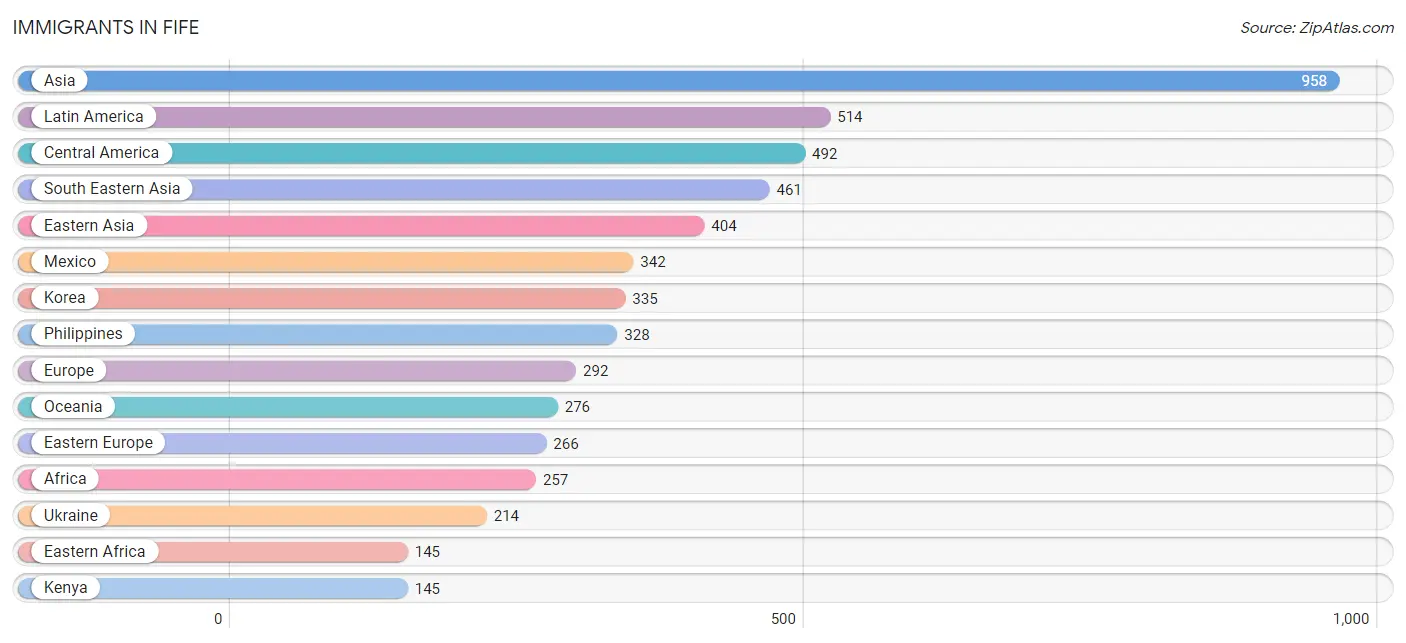
Immigrants in Fife
The most numerous immigrant groups reported in Fife came from Asia (958 | 8.8%), Latin America (514 | 4.7%), Central America (492 | 4.5%), South Eastern Asia (461 | 4.2%), and Eastern Asia (404 | 3.7%), together accounting for 26.0% of all Fife residents.
| Immigration Origin | # Population | % Population |
| Afghanistan | 37 | 0.3% |
| Africa | 257 | 2.4% |
| Asia | 958 | 8.8% |
| Bulgaria | 7 | 0.1% |
| Cambodia | 63 | 0.6% |
| Canada | 17 | 0.2% |
| Central America | 492 | 4.5% |
| Chile | 14 | 0.1% |
| China | 57 | 0.5% |
| Congo | 45 | 0.4% |
| Eastern Africa | 145 | 1.3% |
| Eastern Asia | 404 | 3.7% |
| Eastern Europe | 266 | 2.4% |
| El Salvador | 25 | 0.2% |
| Europe | 292 | 2.7% |
| Germany | 6 | 0.1% |
| Guatemala | 120 | 1.1% |
| India | 40 | 0.4% |
| Japan | 12 | 0.1% |
| Kenya | 145 | 1.3% |
| Korea | 335 | 3.1% |
| Laos | 14 | 0.1% |
| Latin America | 514 | 4.7% |
| Mexico | 342 | 3.1% |
| Micronesia | 30 | 0.3% |
| Middle Africa | 88 | 0.8% |
| Netherlands | 20 | 0.2% |
| Oceania | 276 | 2.5% |
| Panama | 5 | 0.1% |
| Peru | 8 | 0.1% |
| Philippines | 328 | 3.0% |
| Russia | 40 | 0.4% |
| Saudi Arabia | 16 | 0.2% |
| South Africa | 24 | 0.2% |
| South America | 22 | 0.2% |
| South Central Asia | 77 | 0.7% |
| South Eastern Asia | 461 | 4.2% |
| Taiwan | 20 | 0.2% |
| Ukraine | 214 | 2.0% |
| Vietnam | 56 | 0.5% |
| Western Asia | 16 | 0.2% |
| Western Europe | 26 | 0.2% |
| Zaire | 43 | 0.4% | View All 43 Rows |
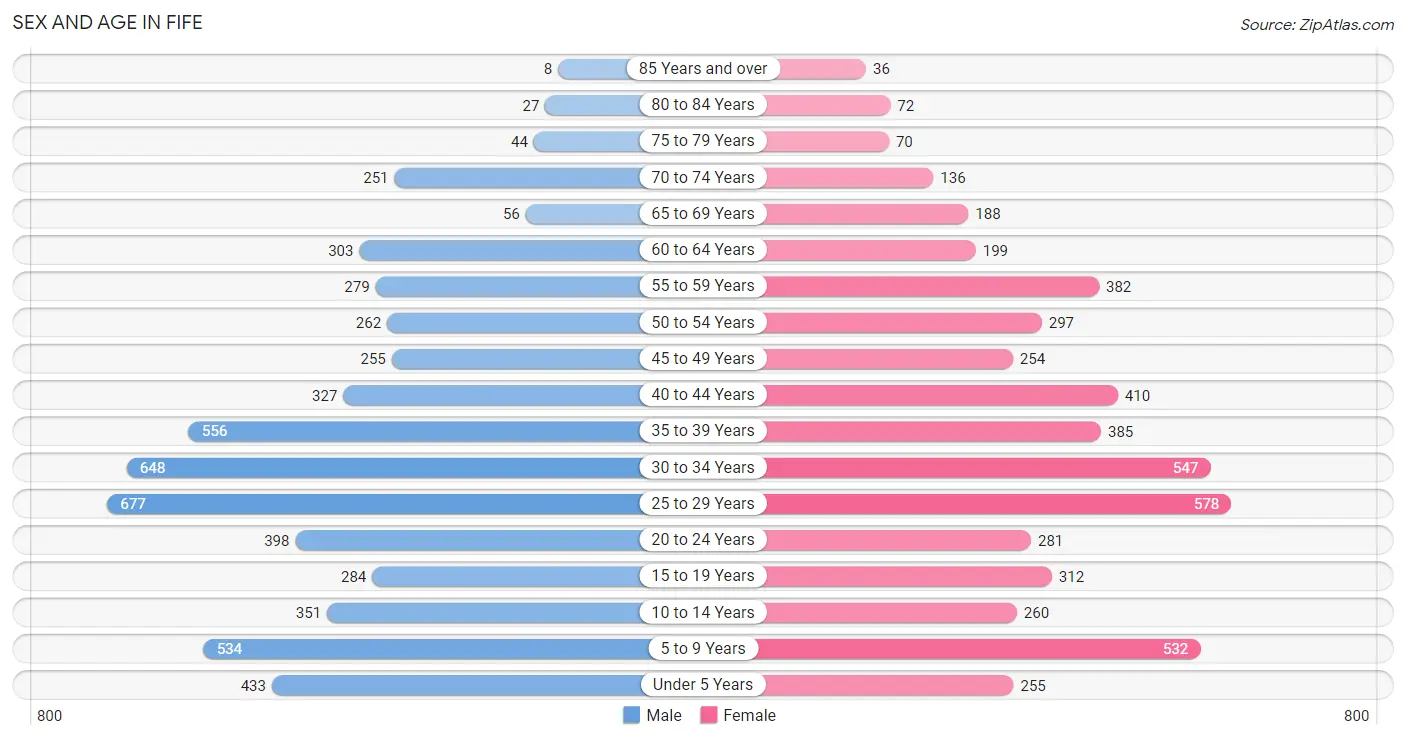
Sex and Age in Fife
Sex and Age in Fife
The most populous age groups in Fife are 25 to 29 Years (677 | 11.9%) for men and 25 to 29 Years (578 | 11.1%) for women.
| Age Bracket | Male | Female |
| Under 5 Years | 433 (7.6%) | 255 (4.9%) |
| 5 to 9 Years | 534 (9.4%) | 532 (10.2%) |
| 10 to 14 Years | 351 (6.2%) | 260 (5.0%) |
| 15 to 19 Years | 284 (5.0%) | 312 (6.0%) |
| 20 to 24 Years | 398 (7.0%) | 281 (5.4%) |
| 25 to 29 Years | 677 (11.9%) | 578 (11.1%) |
| 30 to 34 Years | 648 (11.4%) | 547 (10.5%) |
| 35 to 39 Years | 556 (9.8%) | 385 (7.4%) |
| 40 to 44 Years | 327 (5.7%) | 410 (7.9%) |
| 45 to 49 Years | 255 (4.5%) | 254 (4.9%) |
| 50 to 54 Years | 262 (4.6%) | 297 (5.7%) |
| 55 to 59 Years | 279 (4.9%) | 382 (7.3%) |
| 60 to 64 Years | 303 (5.3%) | 199 (3.8%) |
| 65 to 69 Years | 56 (1.0%) | 188 (3.6%) |
| 70 to 74 Years | 251 (4.4%) | 136 (2.6%) |
| 75 to 79 Years | 44 (0.8%) | 70 (1.3%) |
| 80 to 84 Years | 27 (0.5%) | 72 (1.4%) |
| 85 Years and over | 8 (0.1%) | 36 (0.7%) |
| Total | 5,693 (100.0%) | 5,194 (100.0%) |
Families and Households in Fife
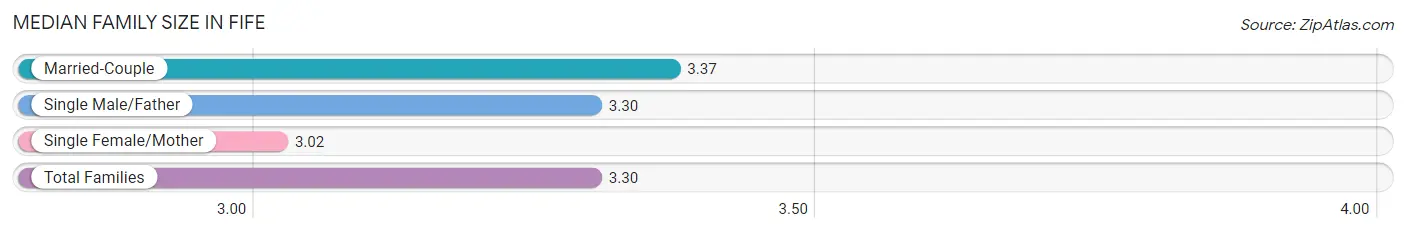
Median Family Size in Fife
The median family size in Fife is 3.30 persons per family, with married-couple families (1,851 | 71.7%) accounting for the largest median family size of 3.37 persons per family. On the other hand, single female/mother families (461 | 17.8%) represent the smallest median family size with 3.02 persons per family.
| Family Type | # Families | Family Size |
| Married-Couple | 1,851 (71.7%) | 3.37 |
| Single Male/Father | 271 (10.5%) | 3.30 |
| Single Female/Mother | 461 (17.8%) | 3.02 |
| Total Families | 2,583 (100.0%) | 3.30 |
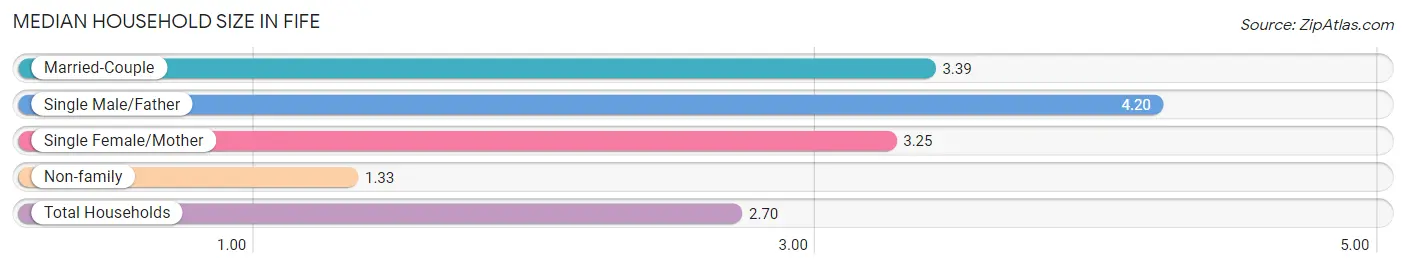
Median Household Size in Fife
The median household size in Fife is 2.70 persons per household, with single male/father households (271 | 6.8%) accounting for the largest median household size of 4.2 persons per household. non-family households (1,428 | 35.6%) represent the smallest median household size with 1.33 persons per household.
| Household Type | # Households | Household Size |
| Married-Couple | 1,851 (46.2%) | 3.39 |
| Single Male/Father | 271 (6.8%) | 4.20 |
| Single Female/Mother | 461 (11.5%) | 3.25 |
| Non-family | 1,428 (35.6%) | 1.33 |
| Total Households | 4,011 (100.0%) | 2.70 |
Household Size by Marriage Status in Fife
Out of a total of 4,011 households in Fife, 2,583 (64.4%) are family households, while 1,428 (35.6%) are nonfamily households. The most numerous type of family households are 2-person households, comprising 1,009, and the most common type of nonfamily households are 1-person households, comprising 1,043.
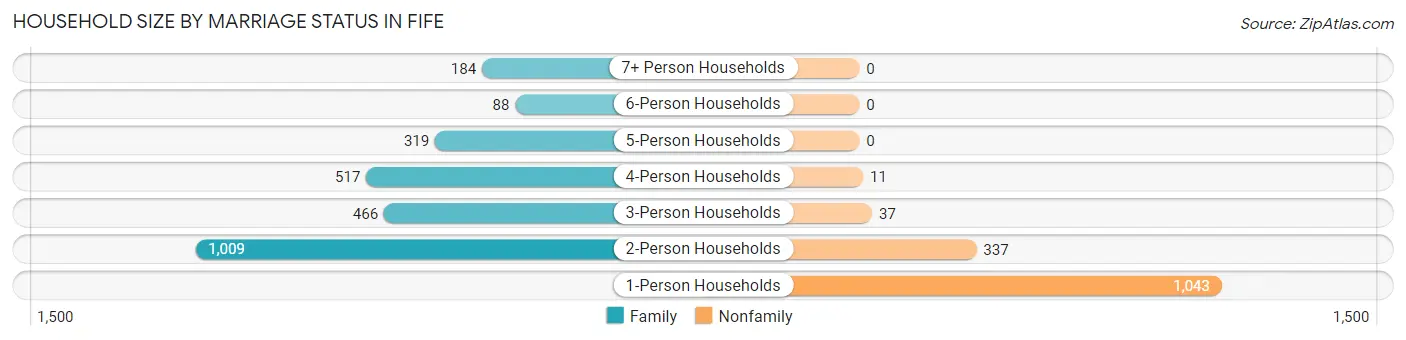
| Household Size | Family Households | Nonfamily Households |
| 1-Person Households | - | 1,043 (26.0%) |
| 2-Person Households | 1,009 (25.2%) | 337 (8.4%) |
| 3-Person Households | 466 (11.6%) | 37 (0.9%) |
| 4-Person Households | 517 (12.9%) | 11 (0.3%) |
| 5-Person Households | 319 (8.0%) | 0 (0.0%) |
| 6-Person Households | 88 (2.2%) | 0 (0.0%) |
| 7+ Person Households | 184 (4.6%) | 0 (0.0%) |
| Total | 2,583 (64.4%) | 1,428 (35.6%) |
Female Fertility in Fife
Fertility by Age in Fife
Average fertility rate in Fife is 50.0 births per 1,000 women. Women in the age bracket of 20 to 34 years have the highest fertility rate with 57.0 births per 1,000 women. Women in the age bracket of 20 to 34 years acount for 56.3% of all women with births.
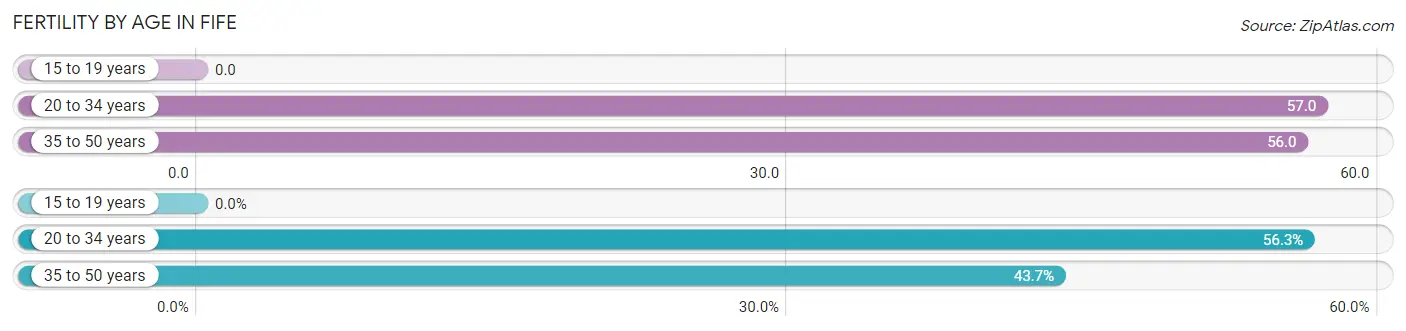
| Age Bracket | Women with Births | Births / 1,000 Women |
| 15 to 19 years | 0 (0.0%) | 0.0 |
| 20 to 34 years | 80 (56.3%) | 57.0 |
| 35 to 50 years | 62 (43.7%) | 56.0 |
| Total | 142 (100.0%) | 50.0 |
Fertility by Age by Marriage Status in Fife
89.4% of women with births (142) in Fife are married. The highest percentage of unmarried women with births falls into 35 to 50 years age bracket with 11.3% of them unmarried at the time of birth, while the lowest percentage of unmarried women with births belong to 20 to 34 years age bracket with 10.0% of them unmarried.
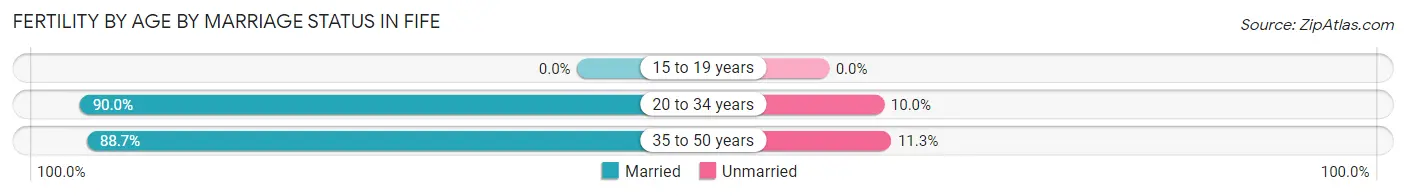
| Age Bracket | Married | Unmarried |
| 15 to 19 years | 0 (0.0%) | 0 (0.0%) |
| 20 to 34 years | 72 (90.0%) | 8 (10.0%) |
| 35 to 50 years | 55 (88.7%) | 7 (11.3%) |
| Total | 127 (89.4%) | 15 (10.6%) |
Fertility by Education in Fife
Average fertility rate in Fife is 50.0 births per 1,000 women. Women with the education attainment of bachelor's degree have the highest fertility rate of 112.0 births per 1,000 women, while women with the education attainment of graduate degree have the lowest fertility at 17.0 births per 1,000 women. Women with the education attainment of bachelor's degree represent 35.2% of all women with births.
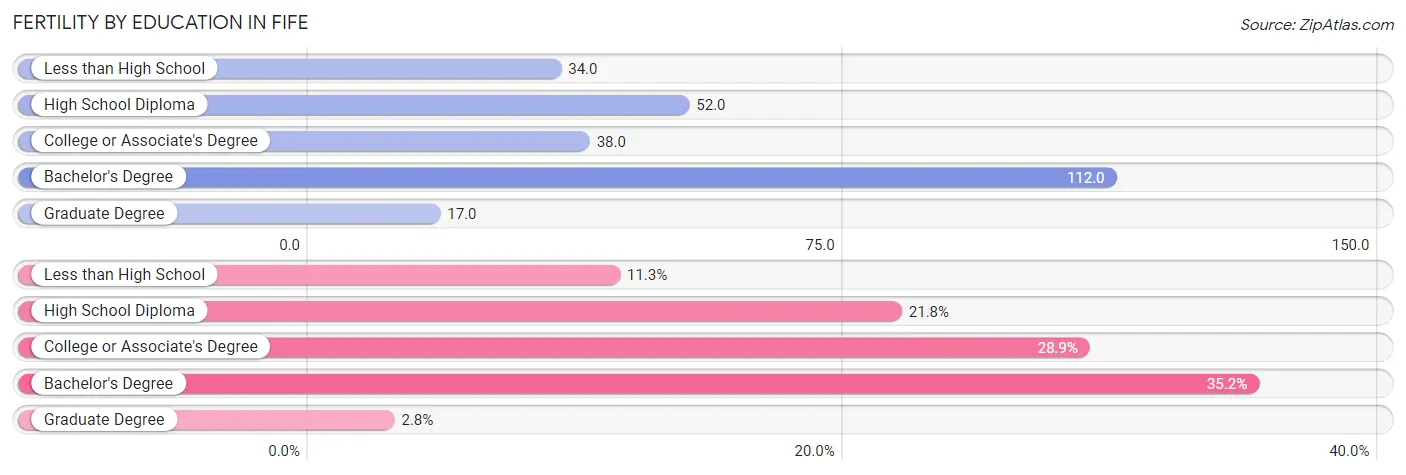
| Educational Attainment | Women with Births | Births / 1,000 Women |
| Less than High School | 16 (11.3%) | 34.0 |
| High School Diploma | 31 (21.8%) | 52.0 |
| College or Associate's Degree | 41 (28.9%) | 38.0 |
| Bachelor's Degree | 50 (35.2%) | 112.0 |
| Graduate Degree | 4 (2.8%) | 17.0 |
| Total | 142 (100.0%) | 50.0 |
Fertility by Education by Marriage Status in Fife
10.6% of women with births in Fife are unmarried. Women with the educational attainment of high school diploma are most likely to be married with 100.0% of them married at childbirth, while women with the educational attainment of less than high school are least likely to be married with 68.8% of them unmarried at childbirth.
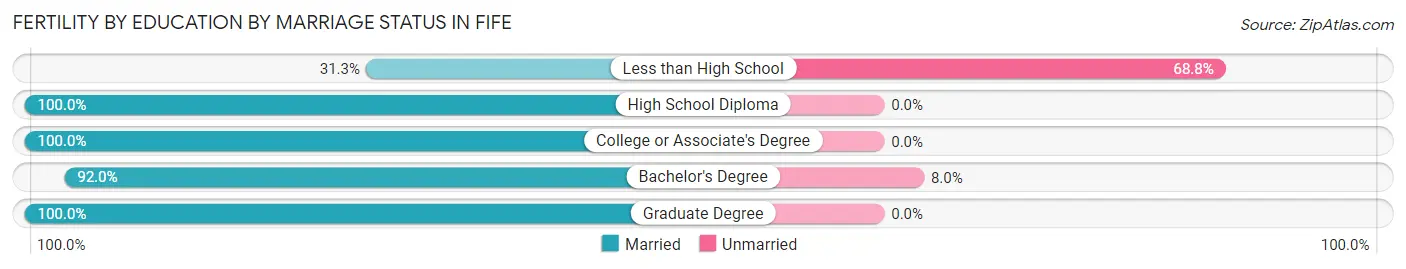
| Educational Attainment | Married | Unmarried |
| Less than High School | 5 (31.2%) | 11 (68.8%) |
| High School Diploma | 31 (100.0%) | 0 (0.0%) |
| College or Associate's Degree | 41 (100.0%) | 0 (0.0%) |
| Bachelor's Degree | 46 (92.0%) | 4 (8.0%) |
| Graduate Degree | 4 (100.0%) | 0 (0.0%) |
| Total | 127 (89.4%) | 15 (10.6%) |
Employment Characteristics in Fife
Employment by Class of Employer in Fife
Among the 5,894 employed individuals in Fife, private company employees (4,070 | 69.1%), not-for-profit organizations (489 | 8.3%), and federal government employees (442 | 7.5%) make up the most common classes of employment.
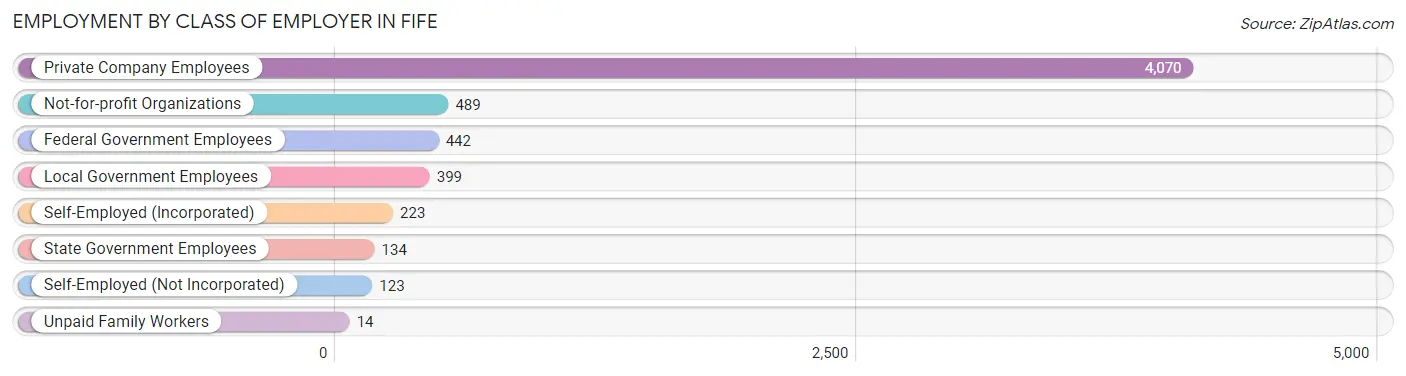
| Employer Class | # Employees | % Employees |
| Private Company Employees | 4,070 | 69.1% |
| Self-Employed (Incorporated) | 223 | 3.8% |
| Self-Employed (Not Incorporated) | 123 | 2.1% |
| Not-for-profit Organizations | 489 | 8.3% |
| Local Government Employees | 399 | 6.8% |
| State Government Employees | 134 | 2.3% |
| Federal Government Employees | 442 | 7.5% |
| Unpaid Family Workers | 14 | 0.2% |
| Total | 5,894 | 100.0% |
Employment Status by Age in Fife
According to the labor force statistics for Fife, out of the total population over 16 years of age (8,396), 74.6% or 6,263 individuals are in the labor force, with 3.8% or 238 of them unemployed. The age group with the highest labor force participation rate is 30 to 34 years, with 91.1% or 1,089 individuals in the labor force. Within the labor force, the 16 to 19 years age range has the highest percentage of unemployed individuals, with 11.1% or 25 of them being unemployed.
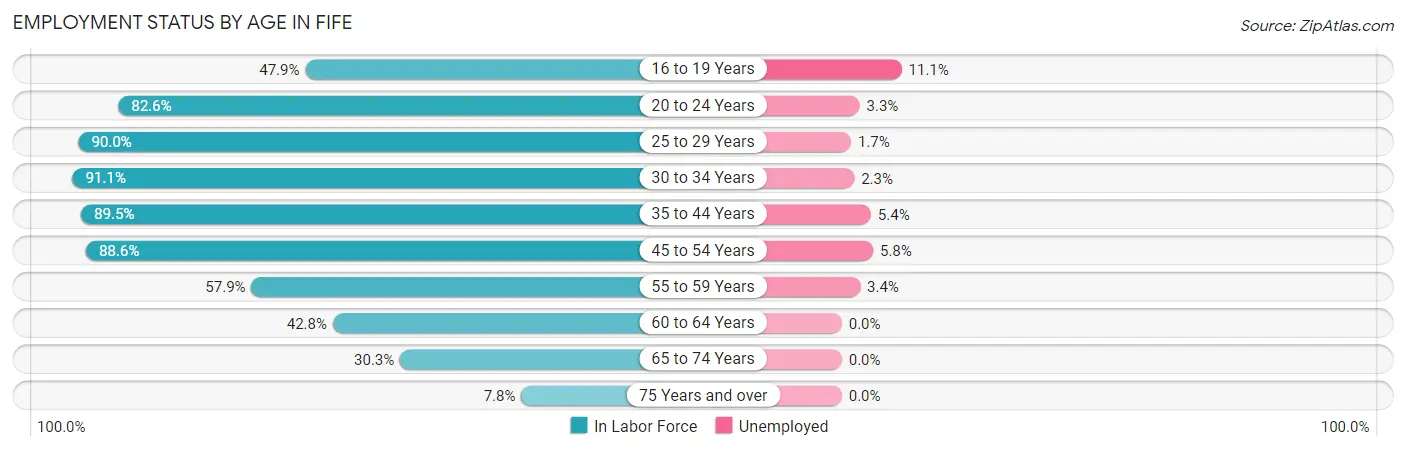
| Age Bracket | In Labor Force | Unemployed |
| 16 to 19 Years | 225 (47.9%) | 25 (11.1%) |
| 20 to 24 Years | 561 (82.6%) | 19 (3.3%) |
| 25 to 29 Years | 1,130 (90.0%) | 19 (1.7%) |
| 30 to 34 Years | 1,089 (91.1%) | 25 (2.3%) |
| 35 to 44 Years | 1,502 (89.5%) | 81 (5.4%) |
| 45 to 54 Years | 946 (88.6%) | 55 (5.8%) |
| 55 to 59 Years | 383 (57.9%) | 13 (3.4%) |
| 60 to 64 Years | 215 (42.8%) | 0 (0.0%) |
| 65 to 74 Years | 191 (30.3%) | 0 (0.0%) |
| 75 Years and over | 20 (7.8%) | 0 (0.0%) |
| Total | 6,263 (74.6%) | 238 (3.8%) |
Employment Status by Educational Attainment in Fife
According to labor force statistics for Fife, 82.8% of individuals (5,265) out of the total population between 25 and 64 years of age (6,359) are in the labor force, with 3.7% or 195 of them being unemployed. The group with the highest labor force participation rate are those with the educational attainment of bachelor's degree or higher, with 89.0% or 1,448 individuals in the labor force. Within the labor force, individuals with less than high school education have the highest percentage of unemployment, with 9.5% or 50 of them being unemployed.

| Educational Attainment | In Labor Force | Unemployed |
| Less than High School | 524 (64.9%) | 77 (9.5%) |
| High School Diploma | 1,393 (81.8%) | 97 (5.7%) |
| College / Associate Degree | 1,898 (85.4%) | 22 (1.0%) |
| Bachelor's Degree or higher | 1,448 (89.0%) | 50 (3.1%) |
| Total | 5,265 (82.8%) | 235 (3.7%) |
Employment Occupations by Sex in Fife
Management, Business, Science and Arts Occupations
The most common Management, Business, Science and Arts occupations in Fife are Management (587 | 9.9%), Community & Social Service (486 | 8.2%), Health Diagnosing & Treating (387 | 6.5%), Education Instruction & Library (276 | 4.7%), and Computers, Engineering & Science (261 | 4.4%).
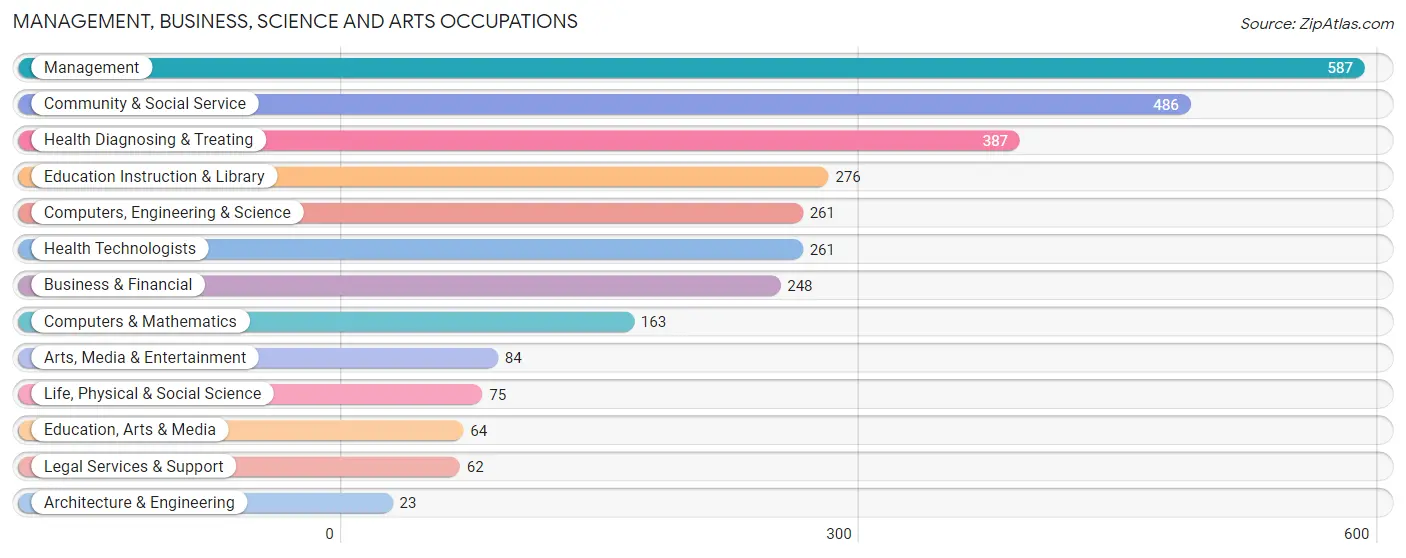
Management, Business, Science and Arts Occupations by Sex
Within the Management, Business, Science and Arts occupations in Fife, the most male-oriented occupations are Architecture & Engineering (100.0%), Computers & Mathematics (81.6%), and Computers, Engineering & Science (72.8%), while the most female-oriented occupations are Legal Services & Support (100.0%), Health Technologists (91.6%), and Arts, Media & Entertainment (88.1%).
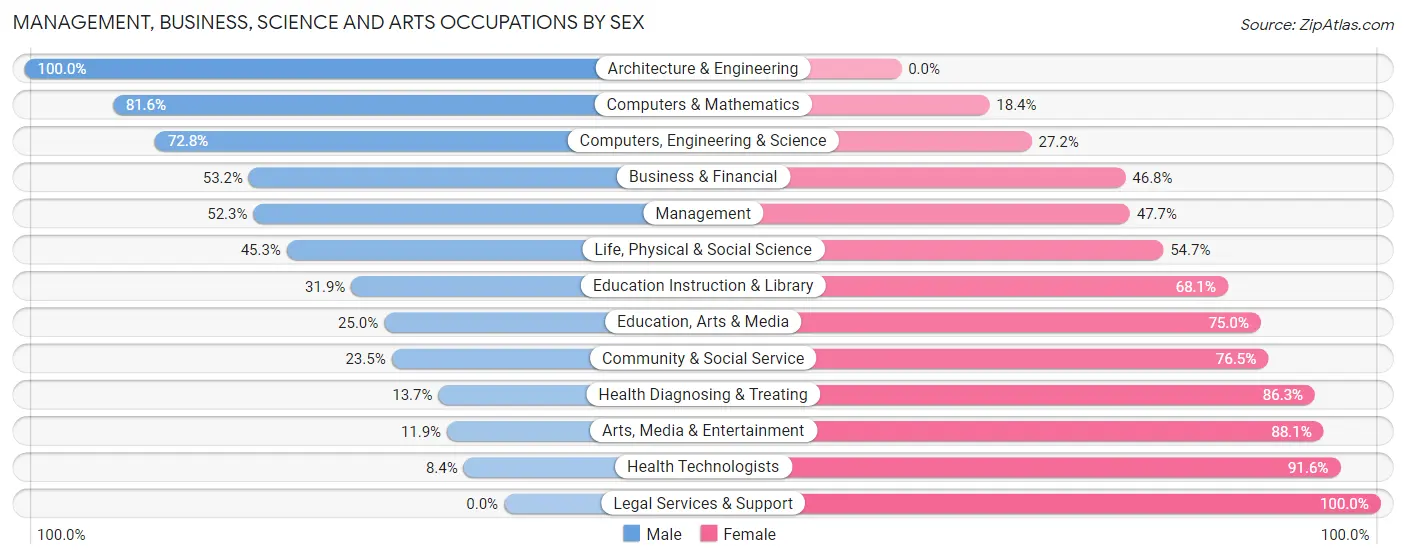
| Occupation | Male | Female |
| Management | 307 (52.3%) | 280 (47.7%) |
| Business & Financial | 132 (53.2%) | 116 (46.8%) |
| Computers, Engineering & Science | 190 (72.8%) | 71 (27.2%) |
| Computers & Mathematics | 133 (81.6%) | 30 (18.4%) |
| Architecture & Engineering | 23 (100.0%) | 0 (0.0%) |
| Life, Physical & Social Science | 34 (45.3%) | 41 (54.7%) |
| Community & Social Service | 114 (23.5%) | 372 (76.5%) |
| Education, Arts & Media | 16 (25.0%) | 48 (75.0%) |
| Legal Services & Support | 0 (0.0%) | 62 (100.0%) |
| Education Instruction & Library | 88 (31.9%) | 188 (68.1%) |
| Arts, Media & Entertainment | 10 (11.9%) | 74 (88.1%) |
| Health Diagnosing & Treating | 53 (13.7%) | 334 (86.3%) |
| Health Technologists | 22 (8.4%) | 239 (91.6%) |
| Total (Category) | 796 (40.4%) | 1,173 (59.6%) |
| Total (Overall) | 3,142 (53.0%) | 2,786 (47.0%) |
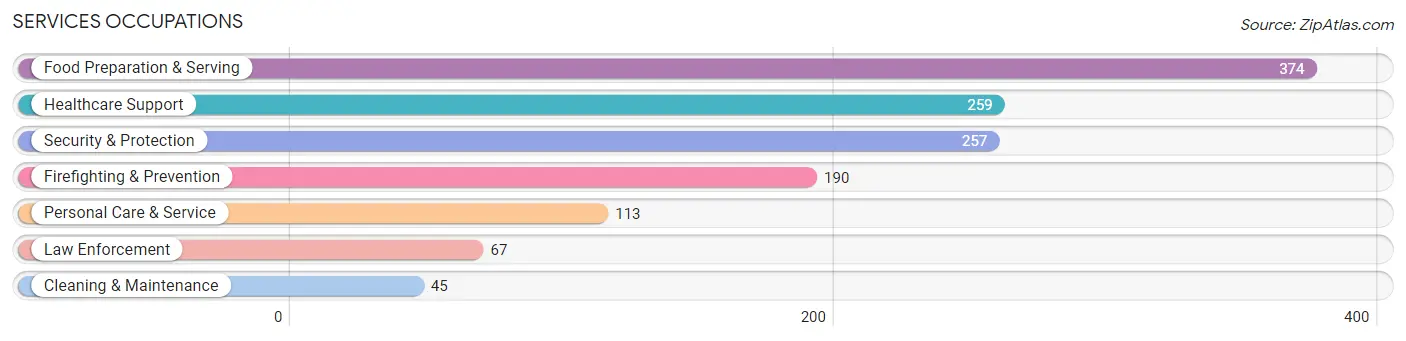
Services Occupations
The most common Services occupations in Fife are Food Preparation & Serving (374 | 6.3%), Healthcare Support (259 | 4.4%), Security & Protection (257 | 4.3%), Firefighting & Prevention (190 | 3.2%), and Personal Care & Service (113 | 1.9%).
Services Occupations by Sex
Within the Services occupations in Fife, the most male-oriented occupations are Firefighting & Prevention (87.4%), Security & Protection (82.1%), and Cleaning & Maintenance (71.1%), while the most female-oriented occupations are Healthcare Support (86.1%), Personal Care & Service (72.6%), and Food Preparation & Serving (52.9%).
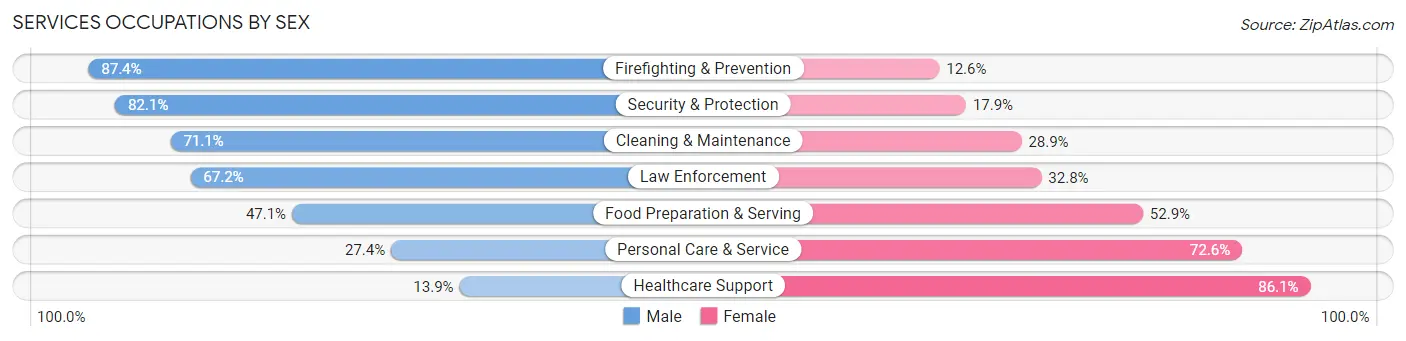
| Occupation | Male | Female |
| Healthcare Support | 36 (13.9%) | 223 (86.1%) |
| Security & Protection | 211 (82.1%) | 46 (17.9%) |
| Firefighting & Prevention | 166 (87.4%) | 24 (12.6%) |
| Law Enforcement | 45 (67.2%) | 22 (32.8%) |
| Food Preparation & Serving | 176 (47.1%) | 198 (52.9%) |
| Cleaning & Maintenance | 32 (71.1%) | 13 (28.9%) |
| Personal Care & Service | 31 (27.4%) | 82 (72.6%) |
| Total (Category) | 486 (46.4%) | 562 (53.6%) |
| Total (Overall) | 3,142 (53.0%) | 2,786 (47.0%) |
Sales and Office Occupations
The most common Sales and Office occupations in Fife are Office & Administration (840 | 14.2%), and Sales & Related (464 | 7.8%).

Sales and Office Occupations by Sex
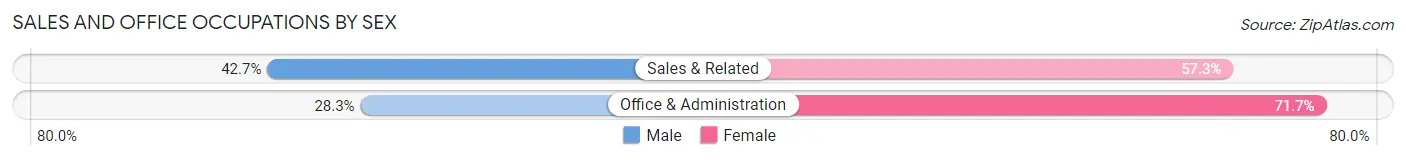
| Occupation | Male | Female |
| Sales & Related | 198 (42.7%) | 266 (57.3%) |
| Office & Administration | 238 (28.3%) | 602 (71.7%) |
| Total (Category) | 436 (33.4%) | 868 (66.6%) |
| Total (Overall) | 3,142 (53.0%) | 2,786 (47.0%) |
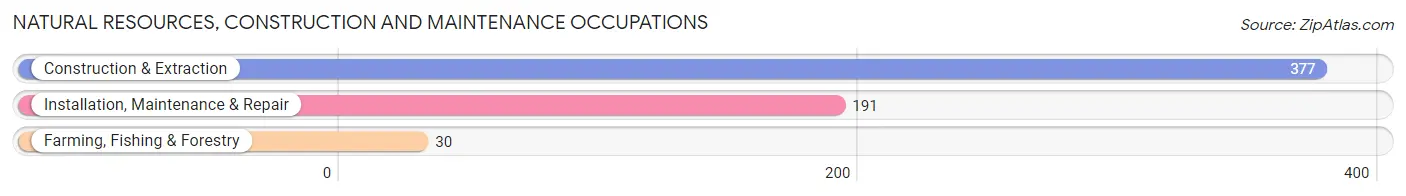
Natural Resources, Construction and Maintenance Occupations
The most common Natural Resources, Construction and Maintenance occupations in Fife are Construction & Extraction (377 | 6.4%), Installation, Maintenance & Repair (191 | 3.2%), and Farming, Fishing & Forestry (30 | 0.5%).
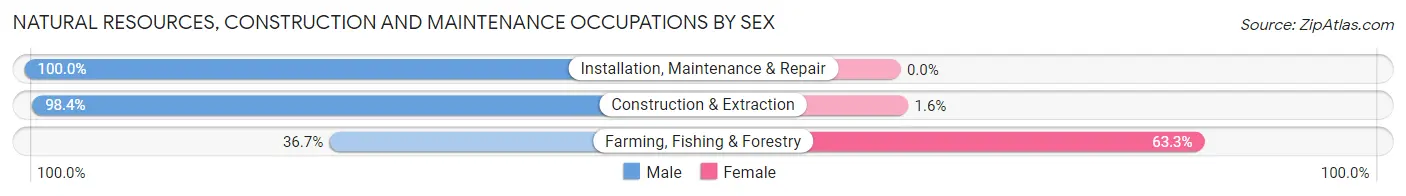
Natural Resources, Construction and Maintenance Occupations by Sex
| Occupation | Male | Female |
| Farming, Fishing & Forestry | 11 (36.7%) | 19 (63.3%) |
| Construction & Extraction | 371 (98.4%) | 6 (1.6%) |
| Installation, Maintenance & Repair | 191 (100.0%) | 0 (0.0%) |
| Total (Category) | 573 (95.8%) | 25 (4.2%) |
| Total (Overall) | 3,142 (53.0%) | 2,786 (47.0%) |
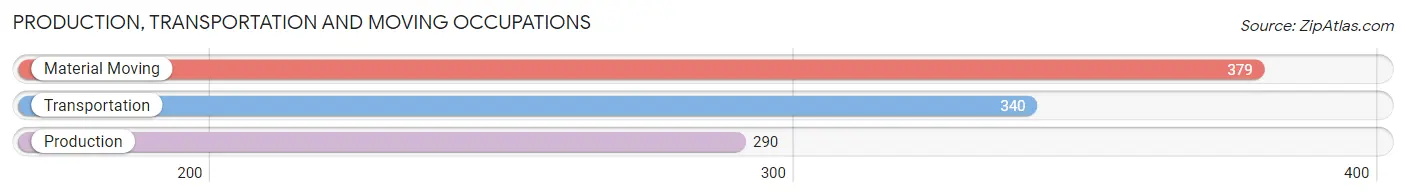
Production, Transportation and Moving Occupations
The most common Production, Transportation and Moving occupations in Fife are Material Moving (379 | 6.4%), Transportation (340 | 5.7%), and Production (290 | 4.9%).
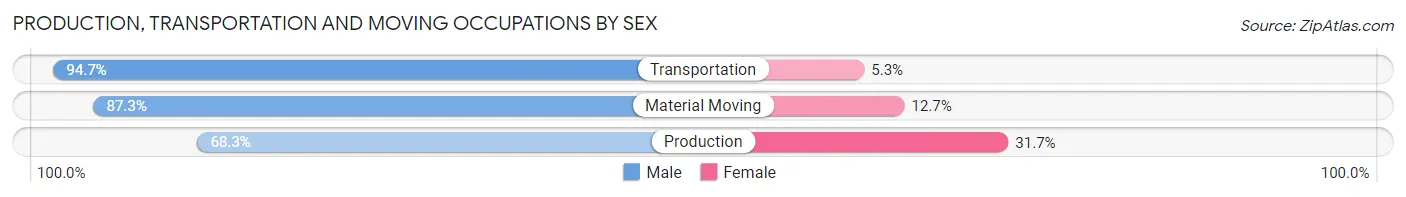
Production, Transportation and Moving Occupations by Sex
| Occupation | Male | Female |
| Production | 198 (68.3%) | 92 (31.7%) |
| Transportation | 322 (94.7%) | 18 (5.3%) |
| Material Moving | 331 (87.3%) | 48 (12.7%) |
| Total (Category) | 851 (84.3%) | 158 (15.7%) |
| Total (Overall) | 3,142 (53.0%) | 2,786 (47.0%) |
Employment Industries by Sex in Fife
Employment Industries in Fife
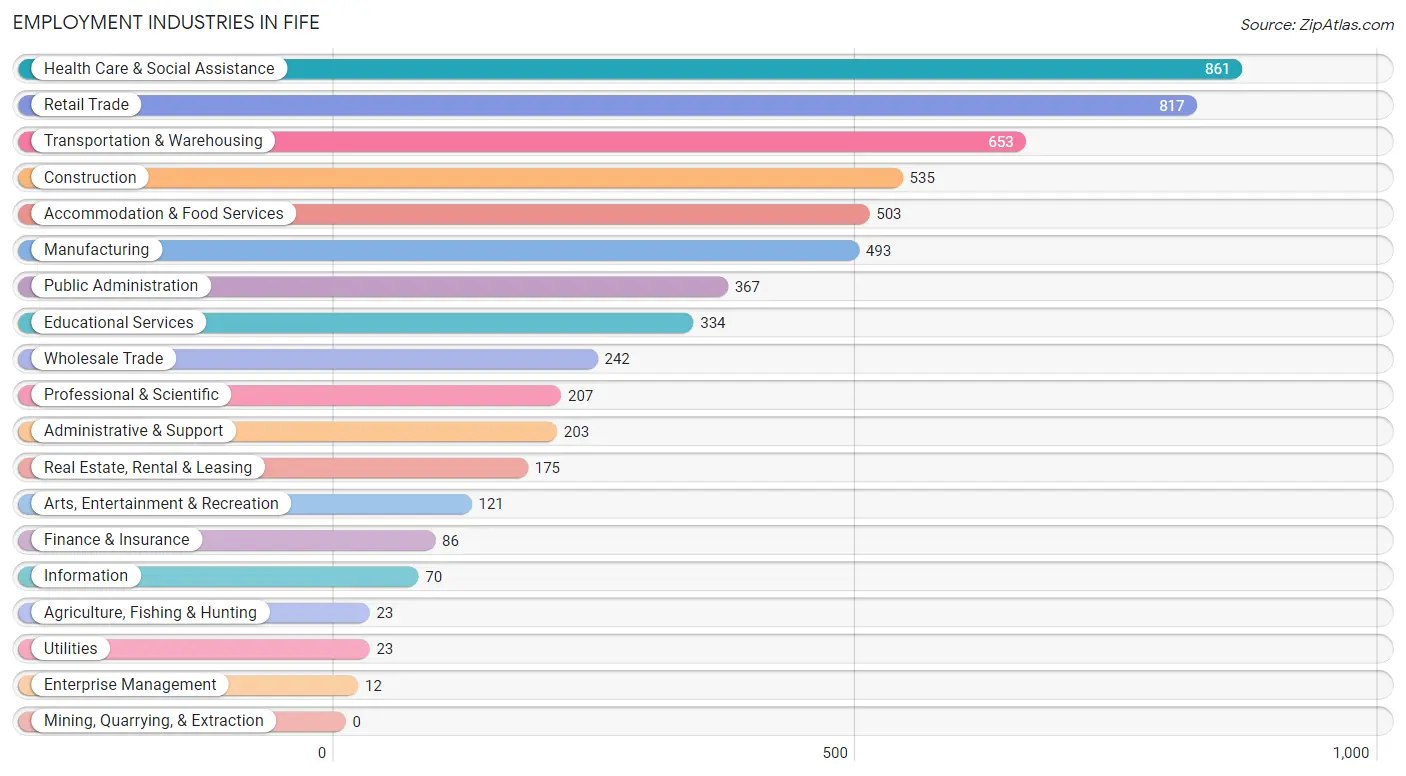
The major employment industries in Fife include Health Care & Social Assistance (861 | 14.5%), Retail Trade (817 | 13.8%), Transportation & Warehousing (653 | 11.0%), Construction (535 | 9.0%), and Accommodation & Food Services (503 | 8.5%).
Employment Industries by Sex in Fife
The Fife industries that see more men than women are Agriculture, Fishing & Hunting (100.0%), Enterprise Management (100.0%), and Construction (85.2%), whereas the industries that tend to have a higher number of women are Health Care & Social Assistance (85.3%), Professional & Scientific (74.9%), and Educational Services (57.2%).
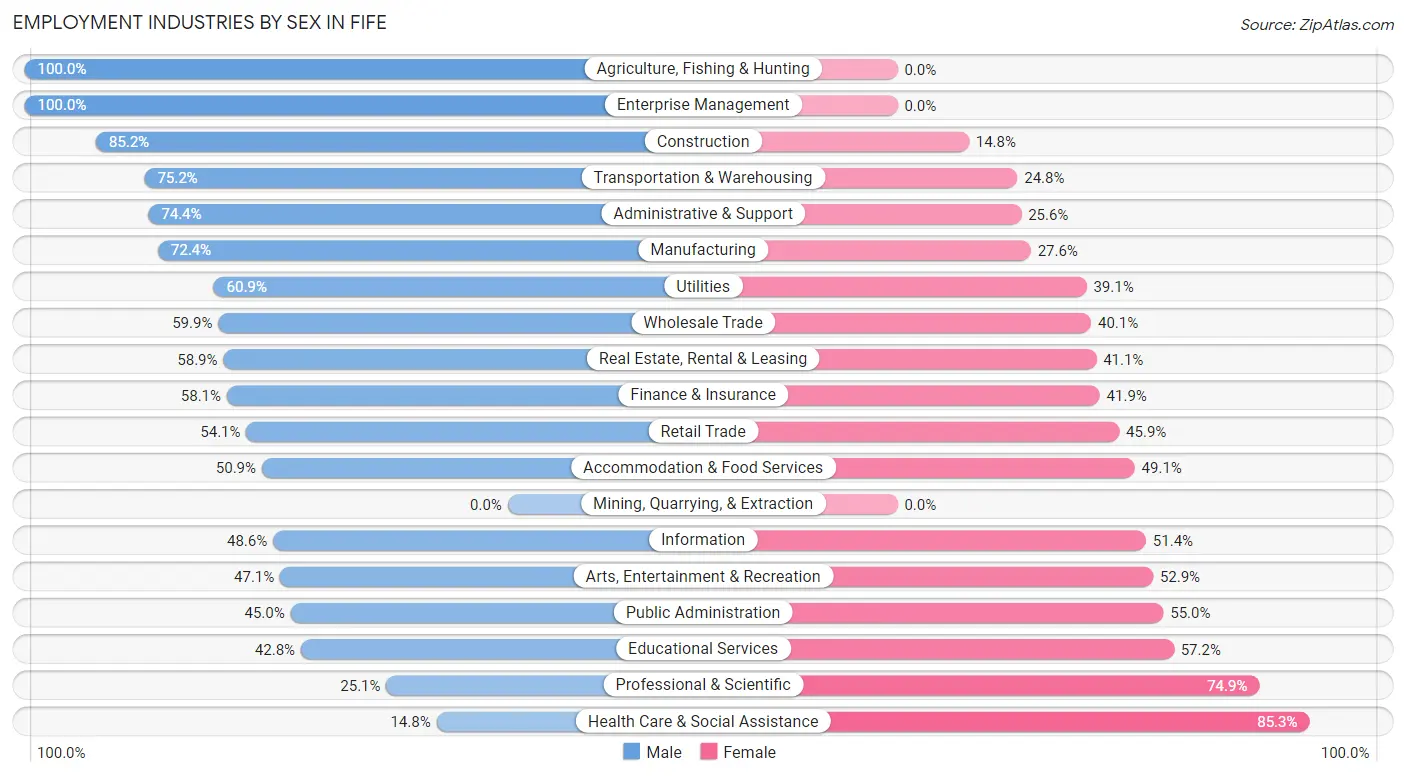
| Industry | Male | Female |
| Agriculture, Fishing & Hunting | 23 (100.0%) | 0 (0.0%) |
| Mining, Quarrying, & Extraction | 0 (0.0%) | 0 (0.0%) |
| Construction | 456 (85.2%) | 79 (14.8%) |
| Manufacturing | 357 (72.4%) | 136 (27.6%) |
| Wholesale Trade | 145 (59.9%) | 97 (40.1%) |
| Retail Trade | 442 (54.1%) | 375 (45.9%) |
| Transportation & Warehousing | 491 (75.2%) | 162 (24.8%) |
| Utilities | 14 (60.9%) | 9 (39.1%) |
| Information | 34 (48.6%) | 36 (51.4%) |
| Finance & Insurance | 50 (58.1%) | 36 (41.9%) |
| Real Estate, Rental & Leasing | 103 (58.9%) | 72 (41.1%) |
| Professional & Scientific | 52 (25.1%) | 155 (74.9%) |
| Enterprise Management | 12 (100.0%) | 0 (0.0%) |
| Administrative & Support | 151 (74.4%) | 52 (25.6%) |
| Educational Services | 143 (42.8%) | 191 (57.2%) |
| Health Care & Social Assistance | 127 (14.7%) | 734 (85.3%) |
| Arts, Entertainment & Recreation | 57 (47.1%) | 64 (52.9%) |
| Accommodation & Food Services | 256 (50.9%) | 247 (49.1%) |
| Public Administration | 165 (45.0%) | 202 (55.0%) |
| Total | 3,142 (53.0%) | 2,786 (47.0%) |
Education in Fife
School Enrollment in Fife
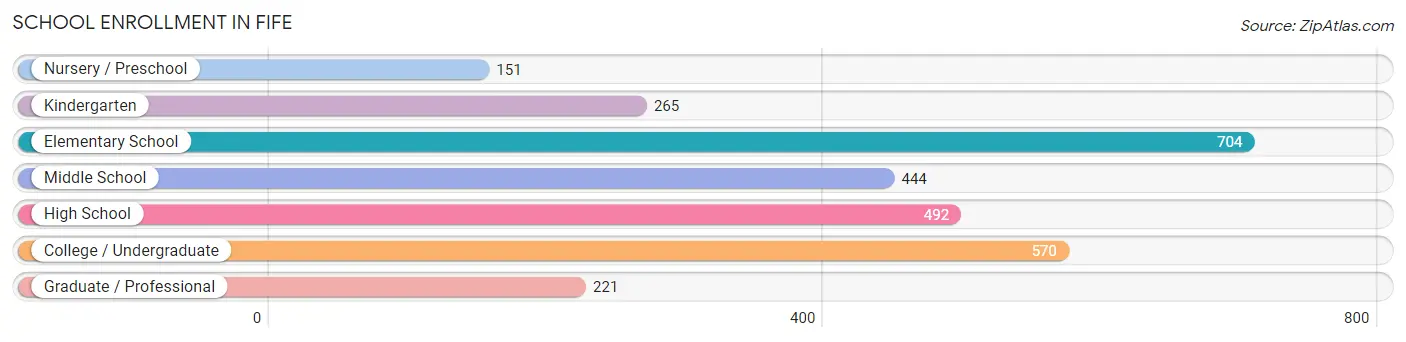
The most common levels of schooling among the 2,847 students in Fife are elementary school (704 | 24.7%), college / undergraduate (570 | 20.0%), and high school (492 | 17.3%).
| School Level | # Students | % Students |
| Nursery / Preschool | 151 | 5.3% |
| Kindergarten | 265 | 9.3% |
| Elementary School | 704 | 24.7% |
| Middle School | 444 | 15.6% |
| High School | 492 | 17.3% |
| College / Undergraduate | 570 | 20.0% |
| Graduate / Professional | 221 | 7.8% |
| Total | 2,847 | 100.0% |
School Enrollment by Age by Funding Source in Fife
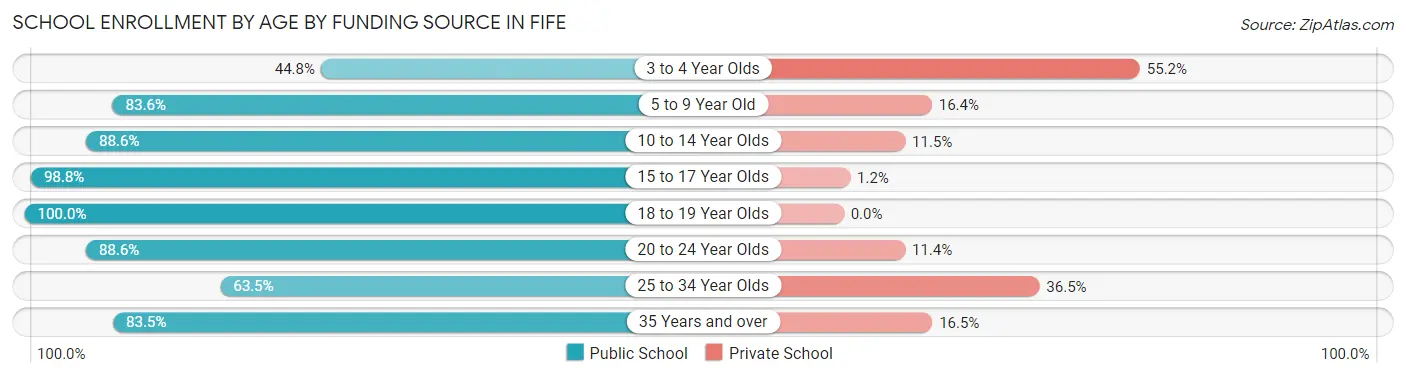
Out of a total of 2,847 students who are enrolled in schools in Fife, 461 (16.2%) attend a private institution, while the remaining 2,386 (83.8%) are enrolled in public schools. The age group of 3 to 4 year olds has the highest likelihood of being enrolled in private schools, with 48 (55.2% in the age bracket) enrolled. Conversely, the age group of 18 to 19 year olds has the lowest likelihood of being enrolled in a private school, with 161 (100.0% in the age bracket) attending a public institution.
| Age Bracket | Public School | Private School |
| 3 to 4 Year Olds | 39 (44.8%) | 48 (55.2%) |
| 5 to 9 Year Old | 774 (83.6%) | 152 (16.4%) |
| 10 to 14 Year Olds | 526 (88.5%) | 68 (11.5%) |
| 15 to 17 Year Olds | 333 (98.8%) | 4 (1.2%) |
| 18 to 19 Year Olds | 161 (100.0%) | 0 (0.0%) |
| 20 to 24 Year Olds | 155 (88.6%) | 20 (11.4%) |
| 25 to 34 Year Olds | 237 (63.5%) | 136 (36.5%) |
| 35 Years and over | 162 (83.5%) | 32 (16.5%) |
| Total | 2,386 (83.8%) | 461 (16.2%) |
Educational Attainment by Field of Study in Fife
Business (358 | 17.6%), science & technology (276 | 13.5%), education (205 | 10.1%), arts & humanities (163 | 8.0%), and social sciences (159 | 7.8%) are the most common fields of study among 2,038 individuals in Fife who have obtained a bachelor's degree or higher.
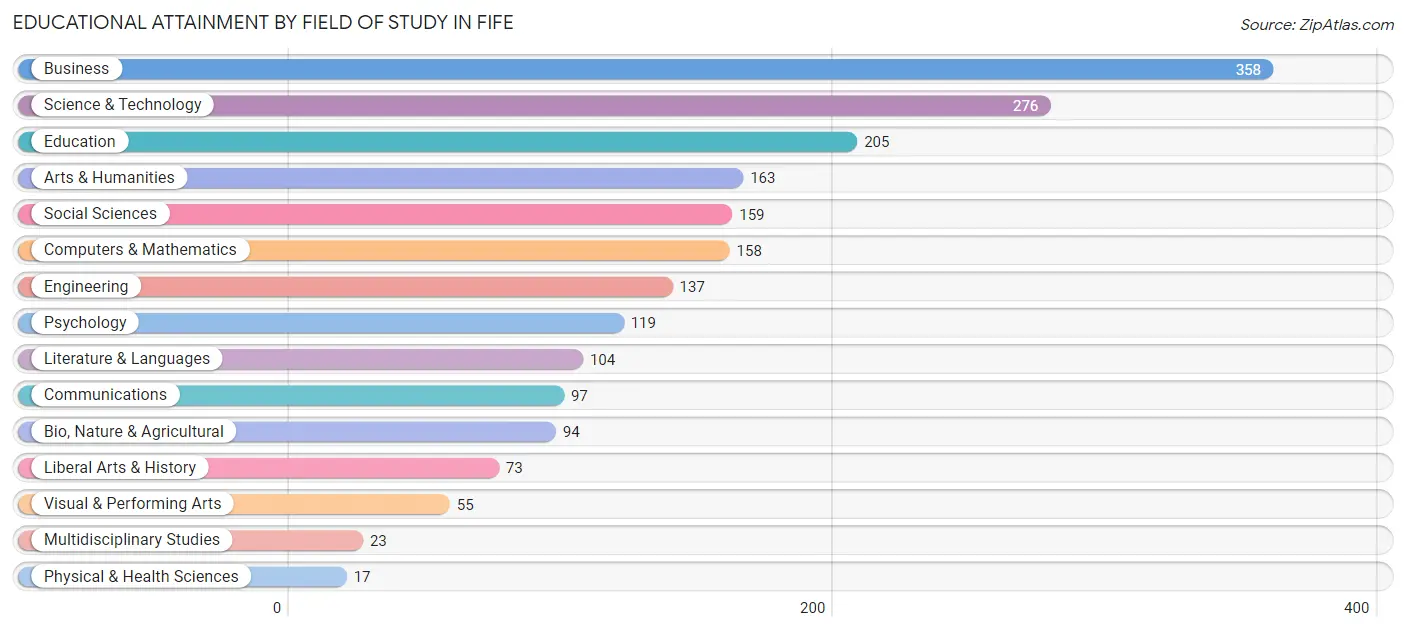
| Field of Study | # Graduates | % Graduates |
| Computers & Mathematics | 158 | 7.7% |
| Bio, Nature & Agricultural | 94 | 4.6% |
| Physical & Health Sciences | 17 | 0.8% |
| Psychology | 119 | 5.8% |
| Social Sciences | 159 | 7.8% |
| Engineering | 137 | 6.7% |
| Multidisciplinary Studies | 23 | 1.1% |
| Science & Technology | 276 | 13.5% |
| Business | 358 | 17.6% |
| Education | 205 | 10.1% |
| Literature & Languages | 104 | 5.1% |
| Liberal Arts & History | 73 | 3.6% |
| Visual & Performing Arts | 55 | 2.7% |
| Communications | 97 | 4.8% |
| Arts & Humanities | 163 | 8.0% |
| Total | 2,038 | 100.0% |
Transportation & Commute in Fife
Vehicle Availability by Sex in Fife
The most prevalent vehicle ownership categories in Fife are males with 2 vehicles (1,571, accounting for 49.5%) and females with 2 vehicles (1,235, making up 57.7%).
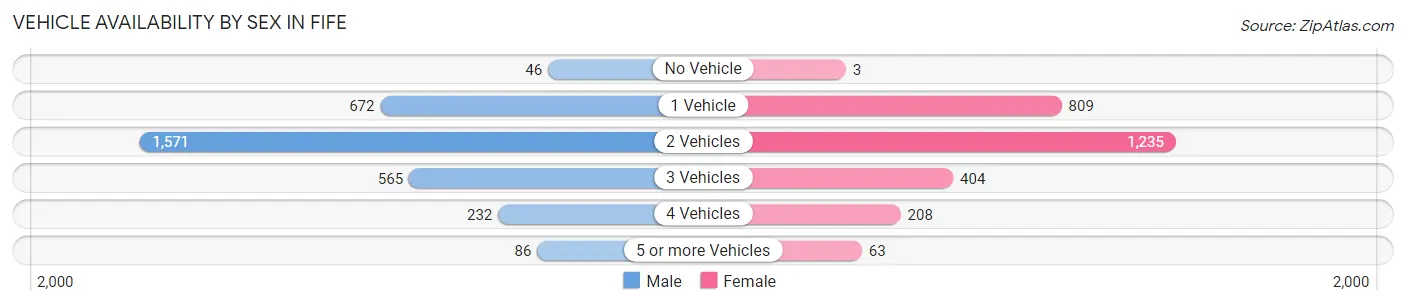
| Vehicles Available | Male | Female |
| No Vehicle | 46 (1.5%) | 3 (0.1%) |
| 1 Vehicle | 672 (21.2%) | 809 (29.7%) |
| 2 Vehicles | 1,571 (49.5%) | 1,235 (45.4%) |
| 3 Vehicles | 565 (17.8%) | 404 (14.8%) |
| 4 Vehicles | 232 (7.3%) | 208 (7.6%) |
| 5 or more Vehicles | 86 (2.7%) | 63 (2.3%) |
| Total | 3,172 (100.0%) | 2,722 (100.0%) |
Commute Time in Fife
The most frequently occuring commute durations in Fife are 20 to 24 minutes (925 commuters, 17.0%), 15 to 19 minutes (666 commuters, 12.2%), and 5 to 9 minutes (648 commuters, 11.9%).
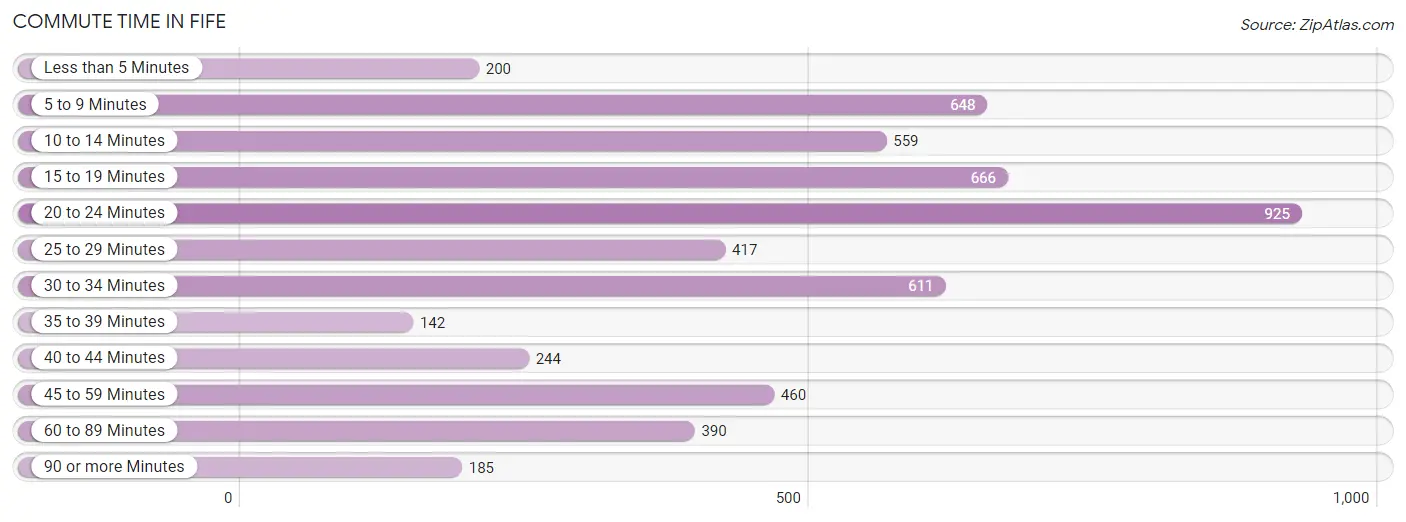
| Commute Time | # Commuters | % Commuters |
| Less than 5 Minutes | 200 | 3.7% |
| 5 to 9 Minutes | 648 | 11.9% |
| 10 to 14 Minutes | 559 | 10.3% |
| 15 to 19 Minutes | 666 | 12.2% |
| 20 to 24 Minutes | 925 | 17.0% |
| 25 to 29 Minutes | 417 | 7.7% |
| 30 to 34 Minutes | 611 | 11.2% |
| 35 to 39 Minutes | 142 | 2.6% |
| 40 to 44 Minutes | 244 | 4.5% |
| 45 to 59 Minutes | 460 | 8.5% |
| 60 to 89 Minutes | 390 | 7.2% |
| 90 or more Minutes | 185 | 3.4% |
Commute Time by Sex in Fife
The most common commute times in Fife are 20 to 24 minutes (401 commuters, 13.6%) for males and 20 to 24 minutes (524 commuters, 21.0%) for females.
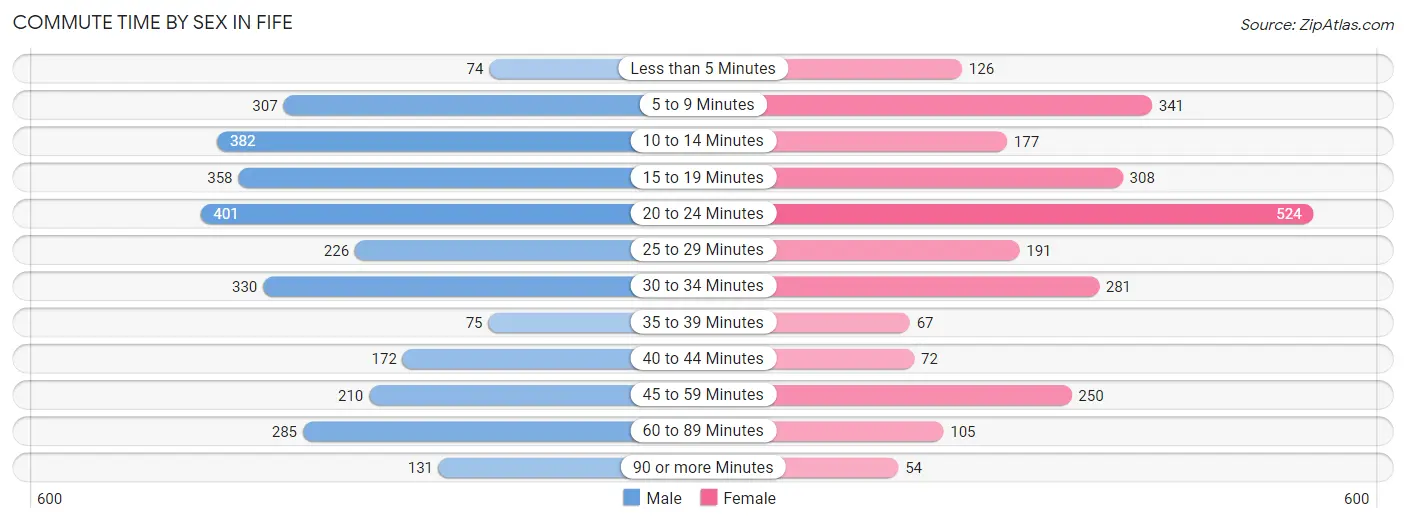
| Commute Time | Male | Female |
| Less than 5 Minutes | 74 (2.5%) | 126 (5.1%) |
| 5 to 9 Minutes | 307 (10.4%) | 341 (13.7%) |
| 10 to 14 Minutes | 382 (12.9%) | 177 (7.1%) |
| 15 to 19 Minutes | 358 (12.1%) | 308 (12.3%) |
| 20 to 24 Minutes | 401 (13.6%) | 524 (21.0%) |
| 25 to 29 Minutes | 226 (7.7%) | 191 (7.6%) |
| 30 to 34 Minutes | 330 (11.2%) | 281 (11.3%) |
| 35 to 39 Minutes | 75 (2.5%) | 67 (2.7%) |
| 40 to 44 Minutes | 172 (5.8%) | 72 (2.9%) |
| 45 to 59 Minutes | 210 (7.1%) | 250 (10.0%) |
| 60 to 89 Minutes | 285 (9.7%) | 105 (4.2%) |
| 90 or more Minutes | 131 (4.4%) | 54 (2.2%) |
Time of Departure to Work by Sex in Fife
The most frequent times of departure to work in Fife are 12:00 PM to 3:59 PM (377, 12.8%) for males and 7:00 AM to 7:29 AM (276, 11.1%) for females.
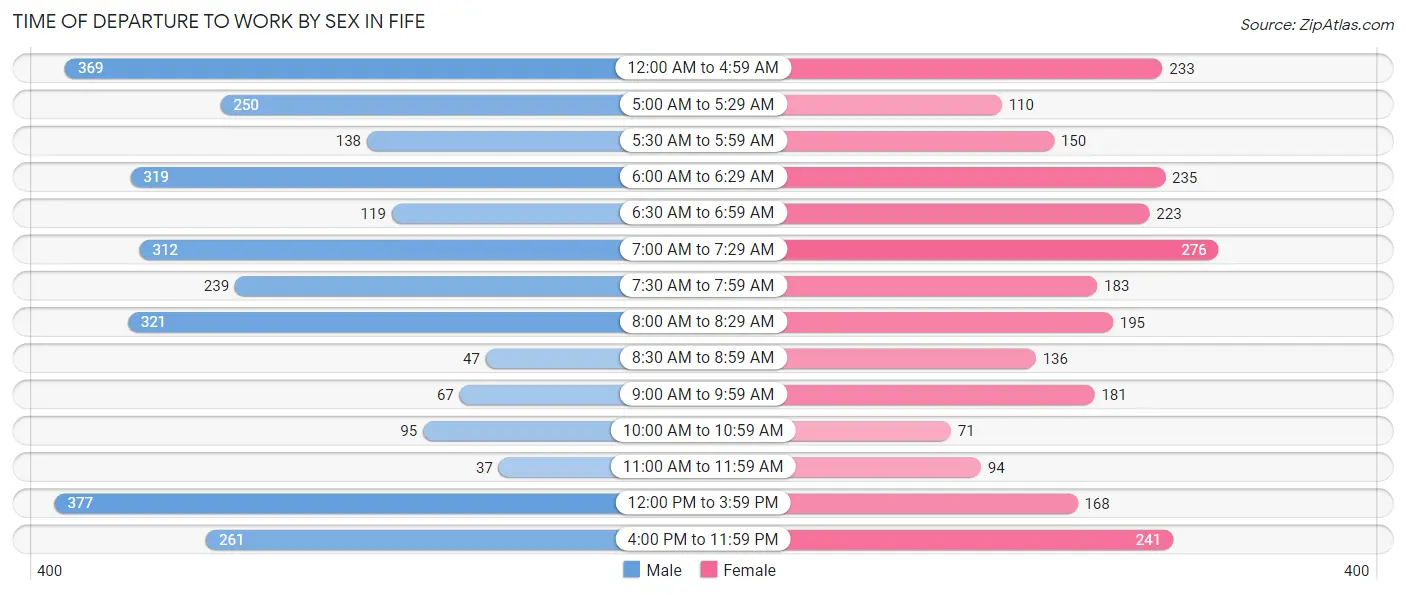
| Time of Departure | Male | Female |
| 12:00 AM to 4:59 AM | 369 (12.5%) | 233 (9.3%) |
| 5:00 AM to 5:29 AM | 250 (8.5%) | 110 (4.4%) |
| 5:30 AM to 5:59 AM | 138 (4.7%) | 150 (6.0%) |
| 6:00 AM to 6:29 AM | 319 (10.8%) | 235 (9.4%) |
| 6:30 AM to 6:59 AM | 119 (4.0%) | 223 (8.9%) |
| 7:00 AM to 7:29 AM | 312 (10.6%) | 276 (11.1%) |
| 7:30 AM to 7:59 AM | 239 (8.1%) | 183 (7.3%) |
| 8:00 AM to 8:29 AM | 321 (10.9%) | 195 (7.8%) |
| 8:30 AM to 8:59 AM | 47 (1.6%) | 136 (5.4%) |
| 9:00 AM to 9:59 AM | 67 (2.3%) | 181 (7.2%) |
| 10:00 AM to 10:59 AM | 95 (3.2%) | 71 (2.8%) |
| 11:00 AM to 11:59 AM | 37 (1.3%) | 94 (3.8%) |
| 12:00 PM to 3:59 PM | 377 (12.8%) | 168 (6.7%) |
| 4:00 PM to 11:59 PM | 261 (8.8%) | 241 (9.7%) |
| Total | 2,951 (100.0%) | 2,496 (100.0%) |
Housing Occupancy in Fife
Occupancy by Ownership in Fife
Of the total 4,011 dwellings in Fife, owner-occupied units account for 1,852 (46.2%), while renter-occupied units make up 2,159 (53.8%).
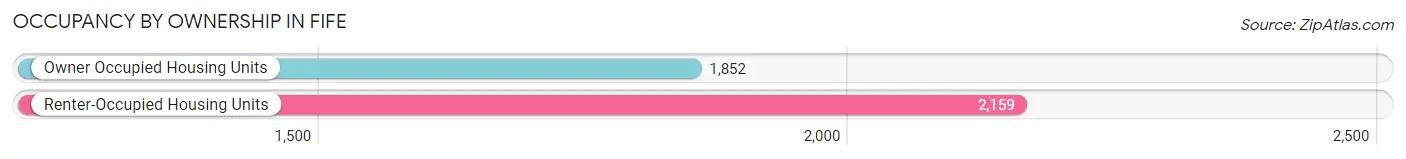
| Occupancy | # Housing Units | % Housing Units |
| Owner Occupied Housing Units | 1,852 | 46.2% |
| Renter-Occupied Housing Units | 2,159 | 53.8% |
| Total Occupied Housing Units | 4,011 | 100.0% |
Occupancy by Household Size in Fife
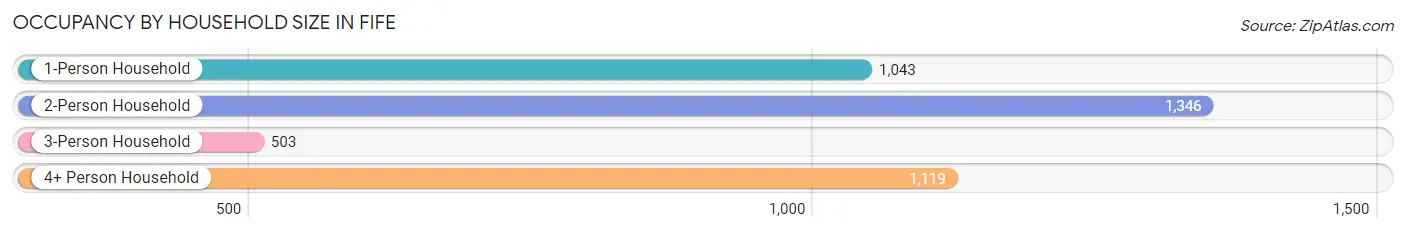
| Household Size | # Housing Units | % Housing Units |
| 1-Person Household | 1,043 | 26.0% |
| 2-Person Household | 1,346 | 33.6% |
| 3-Person Household | 503 | 12.5% |
| 4+ Person Household | 1,119 | 27.9% |
| Total Housing Units | 4,011 | 100.0% |
Occupancy by Ownership by Household Size in Fife
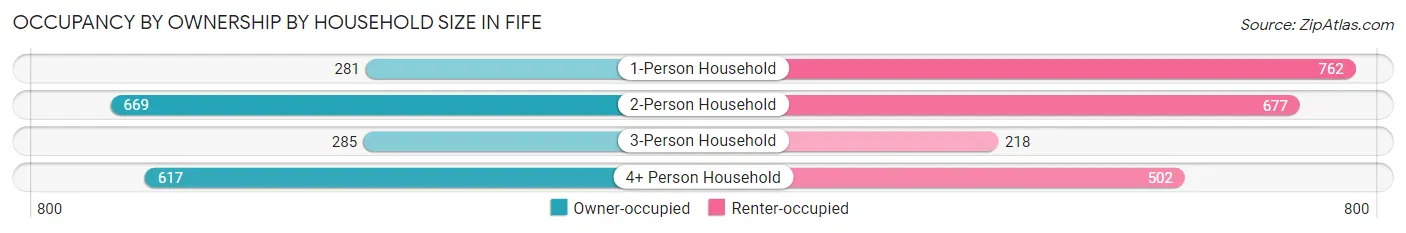
| Household Size | Owner-occupied | Renter-occupied |
| 1-Person Household | 281 (26.9%) | 762 (73.1%) |
| 2-Person Household | 669 (49.7%) | 677 (50.3%) |
| 3-Person Household | 285 (56.7%) | 218 (43.3%) |
| 4+ Person Household | 617 (55.1%) | 502 (44.9%) |
| Total Housing Units | 1,852 (46.2%) | 2,159 (53.8%) |
Occupancy by Educational Attainment in Fife
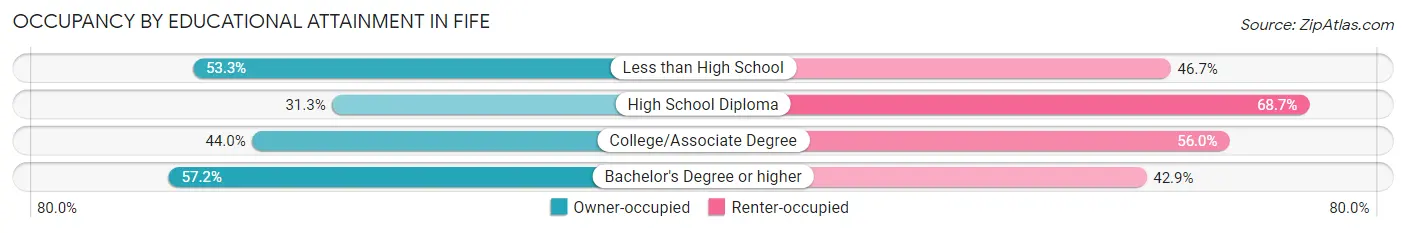
| Household Size | Owner-occupied | Renter-occupied |
| Less than High School | 170 (53.3%) | 149 (46.7%) |
| High School Diploma | 244 (31.3%) | 535 (68.7%) |
| College/Associate Degree | 759 (44.0%) | 966 (56.0%) |
| Bachelor's Degree or higher | 679 (57.2%) | 509 (42.8%) |
Occupancy by Age of Householder in Fife
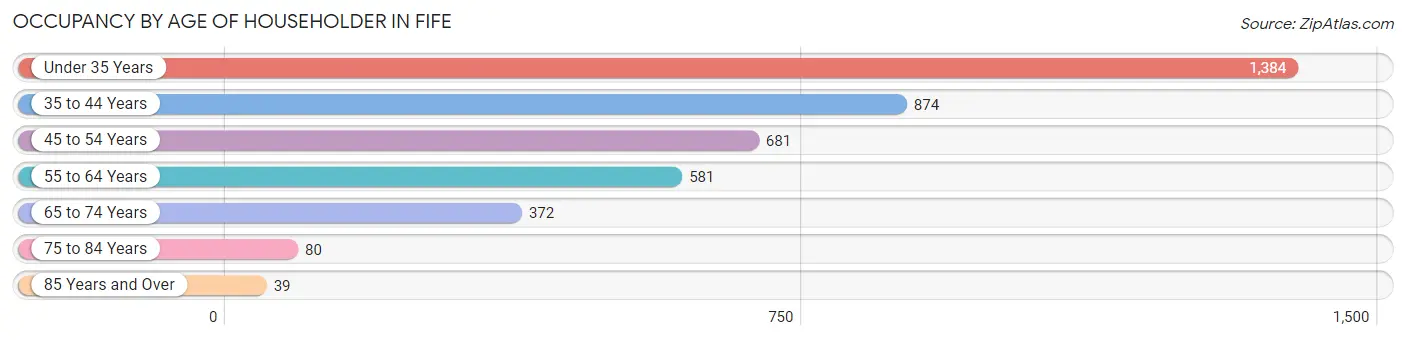
| Age Bracket | # Households | % Households |
| Under 35 Years | 1,384 | 34.5% |
| 35 to 44 Years | 874 | 21.8% |
| 45 to 54 Years | 681 | 17.0% |
| 55 to 64 Years | 581 | 14.5% |
| 65 to 74 Years | 372 | 9.3% |
| 75 to 84 Years | 80 | 2.0% |
| 85 Years and Over | 39 | 1.0% |
| Total | 4,011 | 100.0% |
Housing Finances in Fife
Median Income by Occupancy in Fife
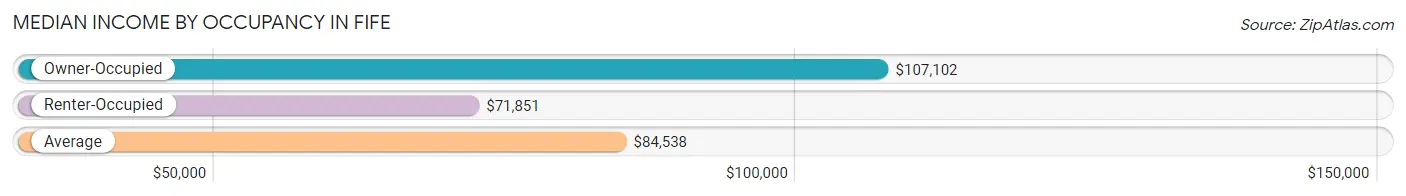
| Occupancy Type | # Households | Median Income |
| Owner-Occupied | 1,852 (46.2%) | $107,102 |
| Renter-Occupied | 2,159 (53.8%) | $71,851 |
| Average | 4,011 (100.0%) | $84,538 |
Occupancy by Householder Income Bracket in Fife
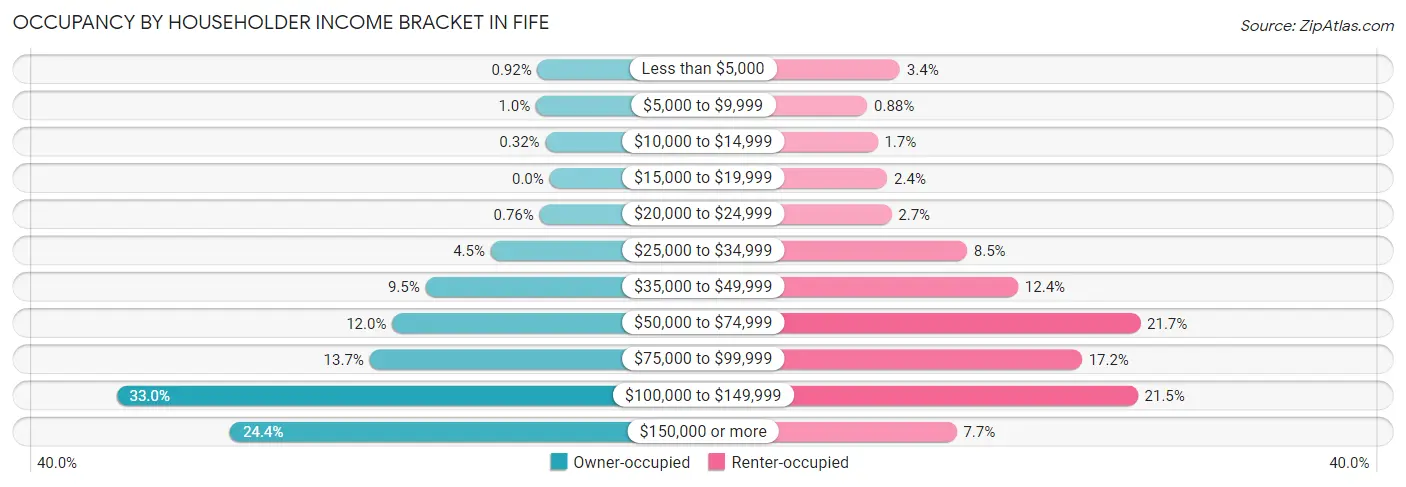
| Income Bracket | Owner-occupied | Renter-occupied |
| Less than $5,000 | 17 (0.9%) | 73 (3.4%) |
| $5,000 to $9,999 | 19 (1.0%) | 19 (0.9%) |
| $10,000 to $14,999 | 6 (0.3%) | 36 (1.7%) |
| $15,000 to $19,999 | 0 (0.0%) | 52 (2.4%) |
| $20,000 to $24,999 | 14 (0.8%) | 59 (2.7%) |
| $25,000 to $34,999 | 83 (4.5%) | 183 (8.5%) |
| $35,000 to $49,999 | 175 (9.5%) | 267 (12.4%) |
| $50,000 to $74,999 | 222 (12.0%) | 468 (21.7%) |
| $75,000 to $99,999 | 254 (13.7%) | 372 (17.2%) |
| $100,000 to $149,999 | 611 (33.0%) | 464 (21.5%) |
| $150,000 or more | 451 (24.3%) | 166 (7.7%) |
| Total | 1,852 (100.0%) | 2,159 (100.0%) |
Monthly Housing Cost Tiers in Fife
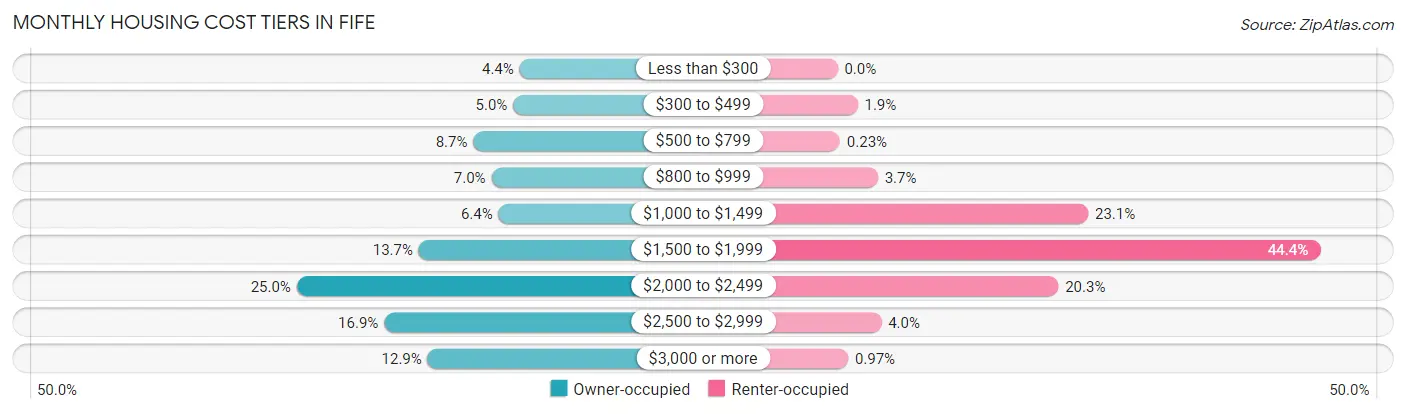
| Monthly Cost | Owner-occupied | Renter-occupied |
| Less than $300 | 82 (4.4%) | 0 (0.0%) |
| $300 to $499 | 93 (5.0%) | 40 (1.8%) |
| $500 to $799 | 161 (8.7%) | 5 (0.2%) |
| $800 to $999 | 130 (7.0%) | 80 (3.7%) |
| $1,000 to $1,499 | 118 (6.4%) | 498 (23.1%) |
| $1,500 to $1,999 | 254 (13.7%) | 959 (44.4%) |
| $2,000 to $2,499 | 462 (24.9%) | 439 (20.3%) |
| $2,500 to $2,999 | 313 (16.9%) | 87 (4.0%) |
| $3,000 or more | 239 (12.9%) | 21 (1.0%) |
| Total | 1,852 (100.0%) | 2,159 (100.0%) |
Physical Housing Characteristics in Fife
Housing Structures in Fife
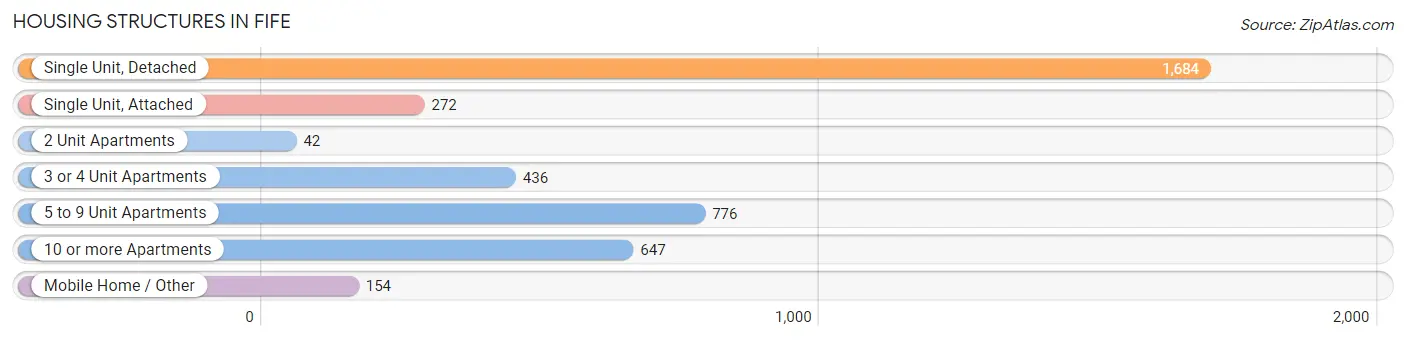
| Structure Type | # Housing Units | % Housing Units |
| Single Unit, Detached | 1,684 | 42.0% |
| Single Unit, Attached | 272 | 6.8% |
| 2 Unit Apartments | 42 | 1.1% |
| 3 or 4 Unit Apartments | 436 | 10.9% |
| 5 to 9 Unit Apartments | 776 | 19.4% |
| 10 or more Apartments | 647 | 16.1% |
| Mobile Home / Other | 154 | 3.8% |
| Total | 4,011 | 100.0% |
Housing Structures by Occupancy in Fife
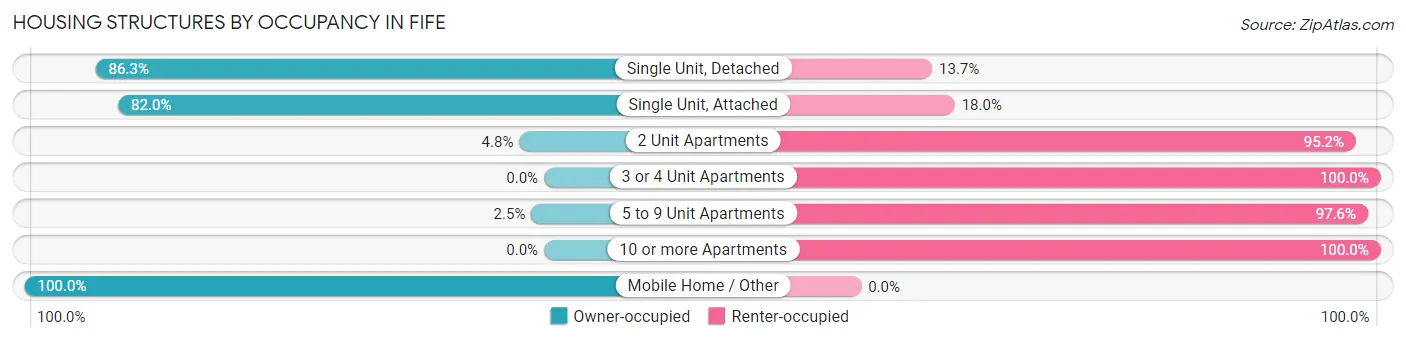
| Structure Type | Owner-occupied | Renter-occupied |
| Single Unit, Detached | 1,454 (86.3%) | 230 (13.7%) |
| Single Unit, Attached | 223 (82.0%) | 49 (18.0%) |
| 2 Unit Apartments | 2 (4.8%) | 40 (95.2%) |
| 3 or 4 Unit Apartments | 0 (0.0%) | 436 (100.0%) |
| 5 to 9 Unit Apartments | 19 (2.5%) | 757 (97.6%) |
| 10 or more Apartments | 0 (0.0%) | 647 (100.0%) |
| Mobile Home / Other | 154 (100.0%) | 0 (0.0%) |
| Total | 1,852 (46.2%) | 2,159 (53.8%) |
Housing Structures by Number of Rooms in Fife
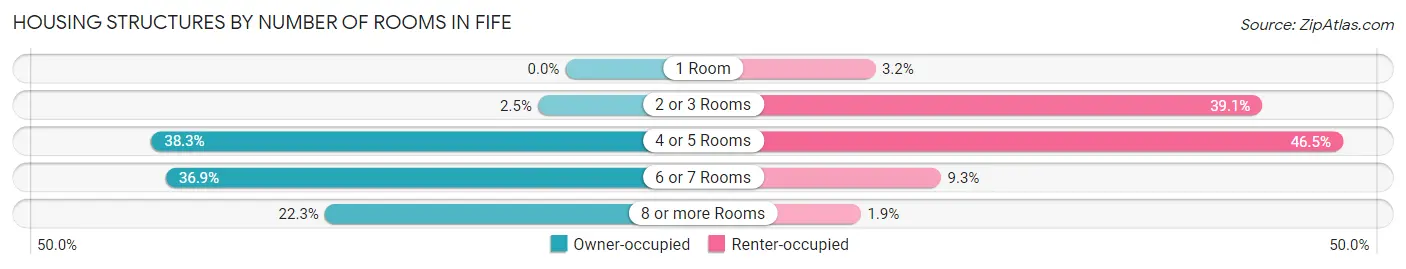
| Number of Rooms | Owner-occupied | Renter-occupied |
| 1 Room | 0 (0.0%) | 70 (3.2%) |
| 2 or 3 Rooms | 47 (2.5%) | 843 (39.1%) |
| 4 or 5 Rooms | 709 (38.3%) | 1,004 (46.5%) |
| 6 or 7 Rooms | 684 (36.9%) | 201 (9.3%) |
| 8 or more Rooms | 412 (22.3%) | 41 (1.9%) |
| Total | 1,852 (100.0%) | 2,159 (100.0%) |
Housing Structure by Heating Type in Fife
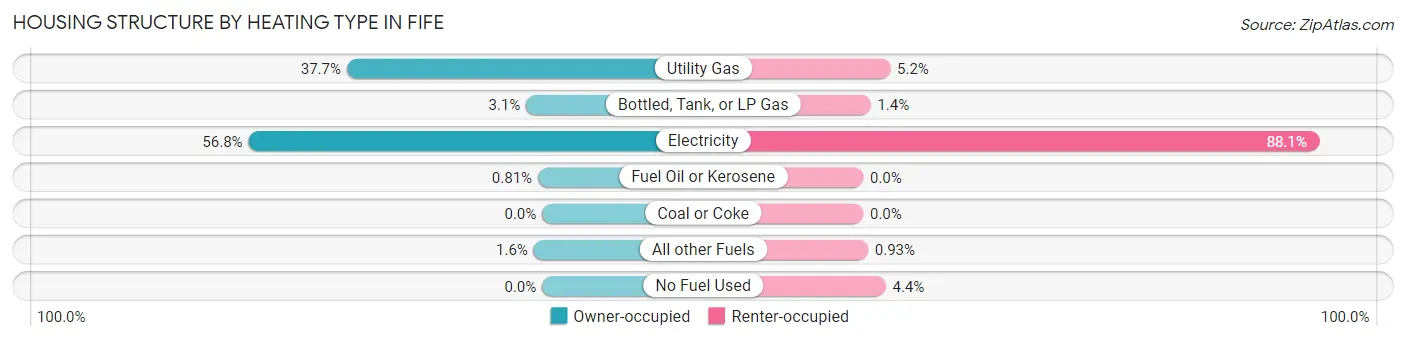
| Heating Type | Owner-occupied | Renter-occupied |
| Utility Gas | 699 (37.7%) | 113 (5.2%) |
| Bottled, Tank, or LP Gas | 57 (3.1%) | 31 (1.4%) |
| Electricity | 1,051 (56.8%) | 1,901 (88.0%) |
| Fuel Oil or Kerosene | 15 (0.8%) | 0 (0.0%) |
| Coal or Coke | 0 (0.0%) | 0 (0.0%) |
| All other Fuels | 30 (1.6%) | 20 (0.9%) |
| No Fuel Used | 0 (0.0%) | 94 (4.3%) |
| Total | 1,852 (100.0%) | 2,159 (100.0%) |
Household Vehicle Usage in Fife
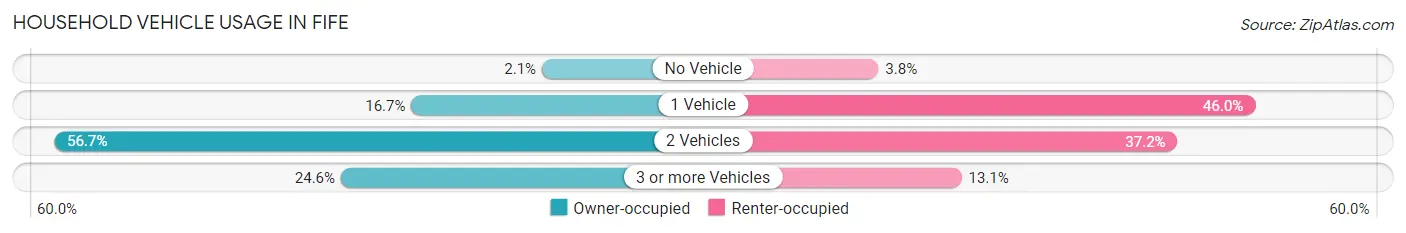
| Vehicles per Household | Owner-occupied | Renter-occupied |
| No Vehicle | 38 (2.1%) | 81 (3.7%) |
| 1 Vehicle | 309 (16.7%) | 992 (46.0%) |
| 2 Vehicles | 1,050 (56.7%) | 804 (37.2%) |
| 3 or more Vehicles | 455 (24.6%) | 282 (13.1%) |
| Total | 1,852 (100.0%) | 2,159 (100.0%) |
Real Estate & Mortgages in Fife
Real Estate and Mortgage Overview in Fife
| Characteristic | Without Mortgage | With Mortgage |
| Housing Units | 501 | 1,351 |
| Median Property Value | $330,800 | $448,100 |
| Median Household Income | $64,250 | $396 |
| Monthly Housing Costs | $661 | $239 |
| Real Estate Taxes | $3,618 | $17 |
Property Value by Mortgage Status in Fife
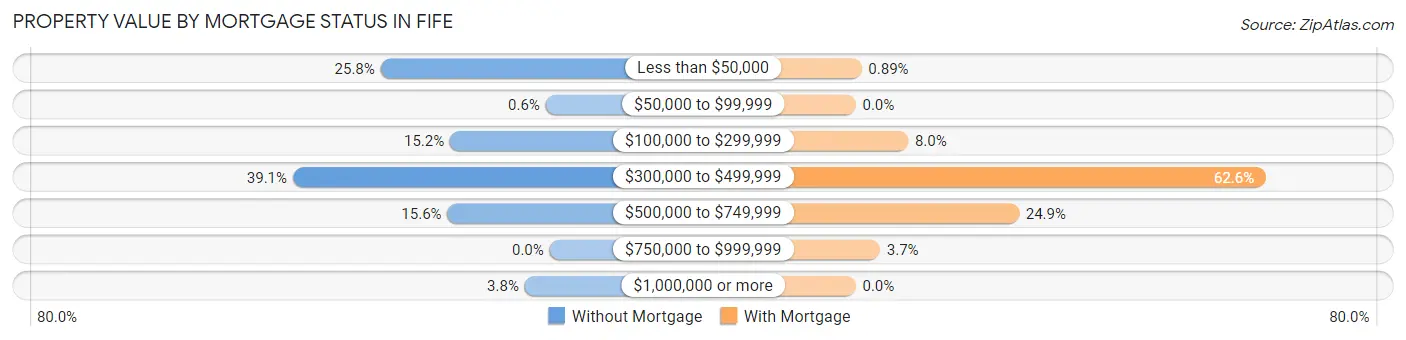
| Property Value | Without Mortgage | With Mortgage |
| Less than $50,000 | 129 (25.8%) | 12 (0.9%) |
| $50,000 to $99,999 | 3 (0.6%) | 0 (0.0%) |
| $100,000 to $299,999 | 76 (15.2%) | 108 (8.0%) |
| $300,000 to $499,999 | 196 (39.1%) | 845 (62.5%) |
| $500,000 to $749,999 | 78 (15.6%) | 336 (24.9%) |
| $750,000 to $999,999 | 0 (0.0%) | 50 (3.7%) |
| $1,000,000 or more | 19 (3.8%) | 0 (0.0%) |
| Total | 501 (100.0%) | 1,351 (100.0%) |
Household Income by Mortgage Status in Fife
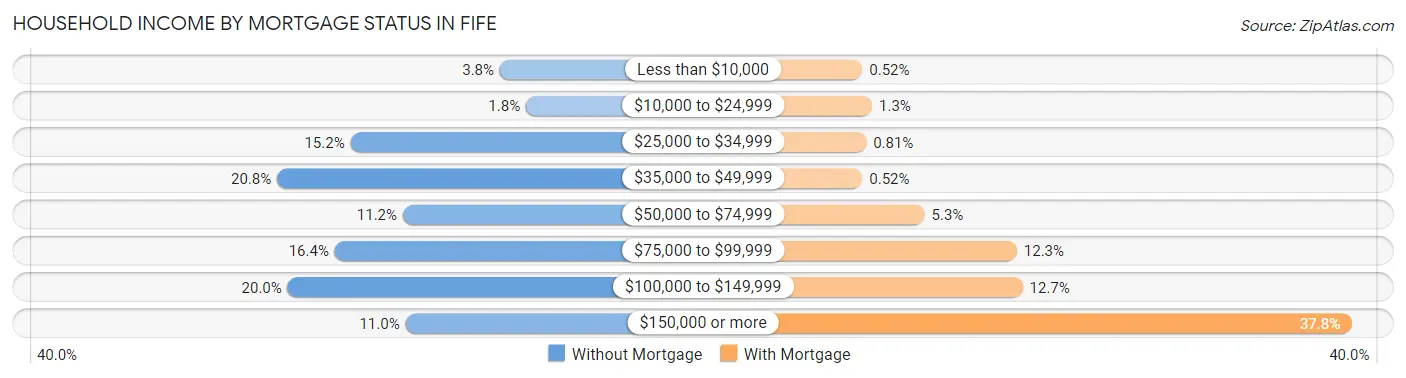
| Household Income | Without Mortgage | With Mortgage |
| Less than $10,000 | 19 (3.8%) | 7 (0.5%) |
| $10,000 to $24,999 | 9 (1.8%) | 17 (1.3%) |
| $25,000 to $34,999 | 76 (15.2%) | 11 (0.8%) |
| $35,000 to $49,999 | 104 (20.8%) | 7 (0.5%) |
| $50,000 to $74,999 | 56 (11.2%) | 71 (5.3%) |
| $75,000 to $99,999 | 82 (16.4%) | 166 (12.3%) |
| $100,000 to $149,999 | 100 (20.0%) | 172 (12.7%) |
| $150,000 or more | 55 (11.0%) | 511 (37.8%) |
| Total | 501 (100.0%) | 1,351 (100.0%) |
Property Value to Household Income Ratio in Fife
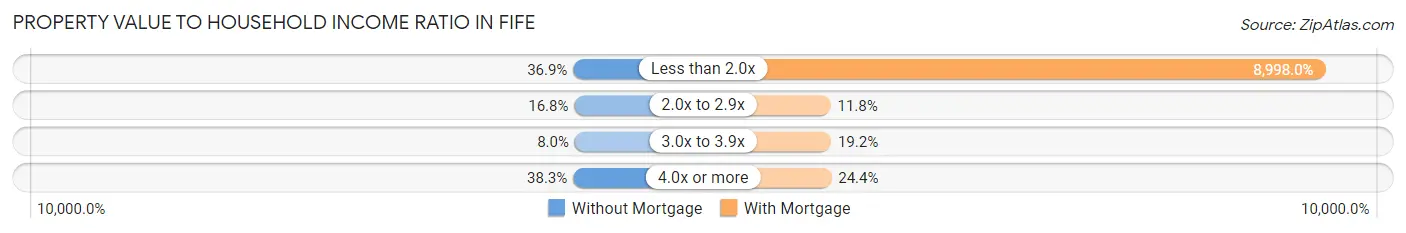
| Value-to-Income Ratio | Without Mortgage | With Mortgage |
| Less than 2.0x | 185 (36.9%) | 121,563 (8,998.0%) |
| 2.0x to 2.9x | 84 (16.8%) | 160 (11.8%) |
| 3.0x to 3.9x | 40 (8.0%) | 259 (19.2%) |
| 4.0x or more | 192 (38.3%) | 329 (24.3%) |
| Total | 501 (100.0%) | 1,351 (100.0%) |
Real Estate Taxes by Mortgage Status in Fife
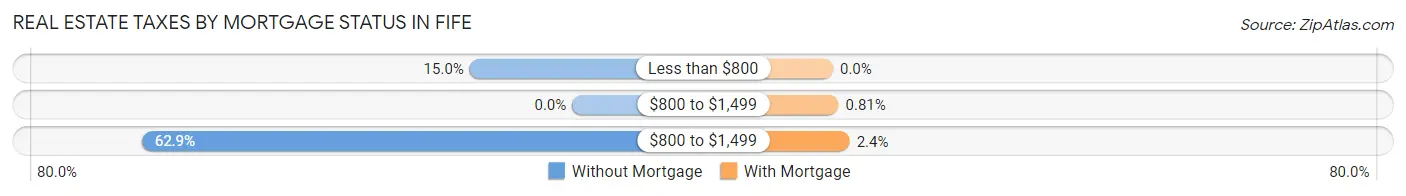
| Property Taxes | Without Mortgage | With Mortgage |
| Less than $800 | 75 (15.0%) | 0 (0.0%) |
| $800 to $1,499 | 0 (0.0%) | 11 (0.8%) |
| $800 to $1,499 | 315 (62.9%) | 33 (2.4%) |
| Total | 501 (100.0%) | 1,351 (100.0%) |
Health & Disability in Fife
Health Insurance Coverage by Age in Fife
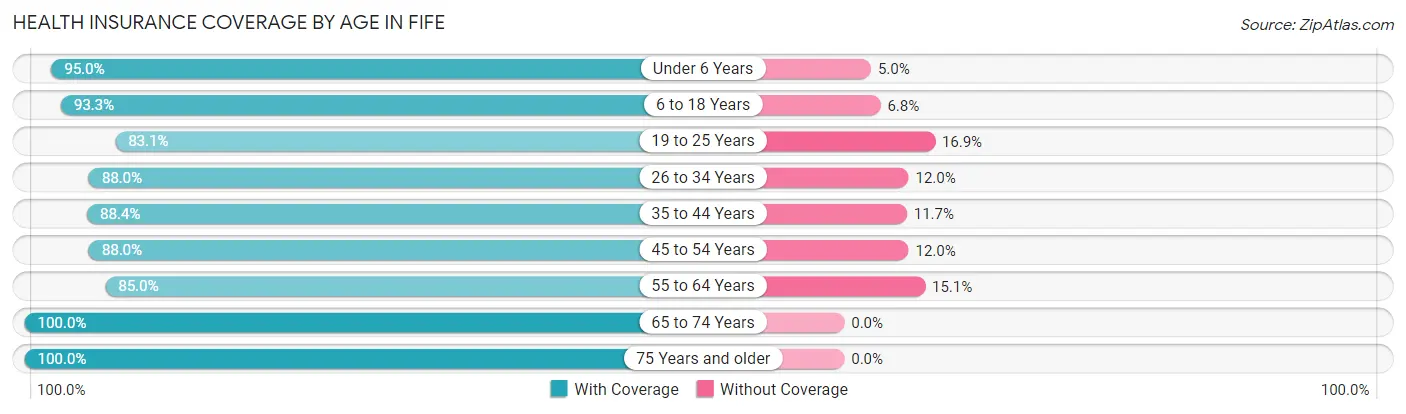
| Age Bracket | With Coverage | Without Coverage |
| Under 6 Years | 1,031 (95.0%) | 54 (5.0%) |
| 6 to 18 Years | 1,645 (93.2%) | 119 (6.8%) |
| 19 to 25 Years | 841 (83.1%) | 171 (16.9%) |
| 26 to 34 Years | 1,874 (88.0%) | 255 (12.0%) |
| 35 to 44 Years | 1,479 (88.3%) | 195 (11.7%) |
| 45 to 54 Years | 940 (88.0%) | 128 (12.0%) |
| 55 to 64 Years | 988 (85.0%) | 175 (15.0%) |
| 65 to 74 Years | 631 (100.0%) | 0 (0.0%) |
| 75 Years and older | 257 (100.0%) | 0 (0.0%) |
| Total | 9,686 (89.8%) | 1,097 (10.2%) |
Health Insurance Coverage by Citizenship Status in Fife
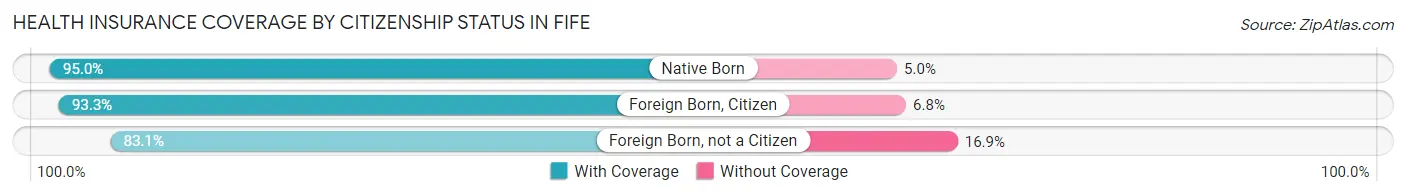
| Citizenship Status | With Coverage | Without Coverage |
| Native Born | 1,031 (95.0%) | 54 (5.0%) |
| Foreign Born, Citizen | 1,645 (93.2%) | 119 (6.8%) |
| Foreign Born, not a Citizen | 841 (83.1%) | 171 (16.9%) |
Health Insurance Coverage by Household Income in Fife
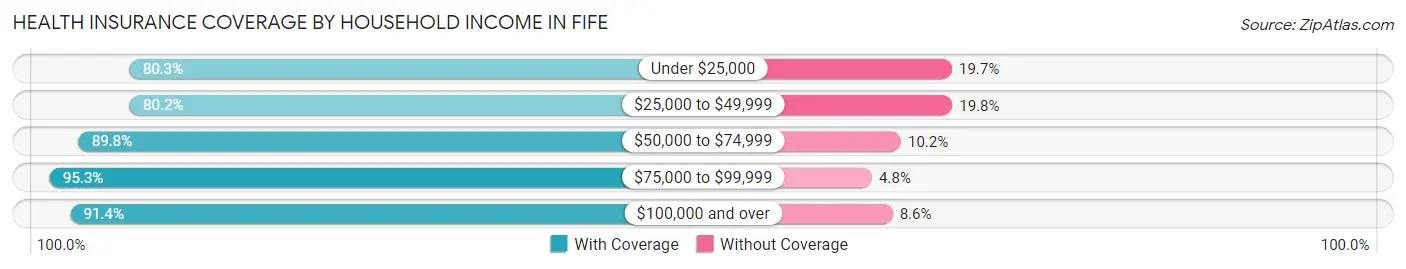
| Household Income | With Coverage | Without Coverage |
| Under $25,000 | 452 (80.3%) | 111 (19.7%) |
| $25,000 to $49,999 | 1,022 (80.2%) | 252 (19.8%) |
| $50,000 to $74,999 | 1,636 (89.8%) | 185 (10.2%) |
| $75,000 to $99,999 | 1,445 (95.3%) | 72 (4.8%) |
| $100,000 and over | 5,065 (91.4%) | 477 (8.6%) |
Public vs Private Health Insurance Coverage by Age in Fife
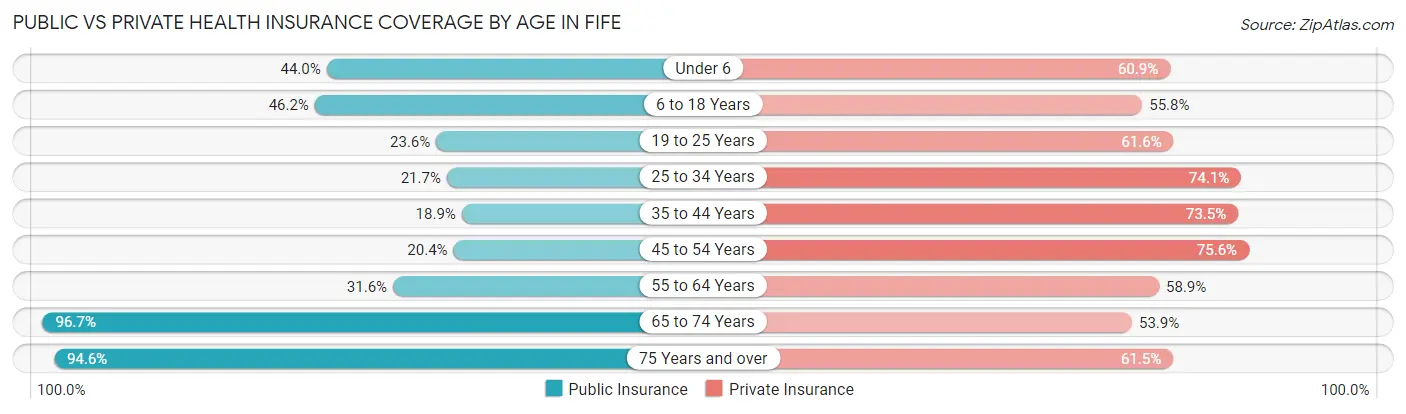
| Age Bracket | Public Insurance | Private Insurance |
| Under 6 | 477 (44.0%) | 661 (60.9%) |
| 6 to 18 Years | 814 (46.2%) | 984 (55.8%) |
| 19 to 25 Years | 239 (23.6%) | 623 (61.6%) |
| 25 to 34 Years | 461 (21.6%) | 1,578 (74.1%) |
| 35 to 44 Years | 316 (18.9%) | 1,231 (73.5%) |
| 45 to 54 Years | 218 (20.4%) | 807 (75.6%) |
| 55 to 64 Years | 368 (31.6%) | 685 (58.9%) |
| 65 to 74 Years | 610 (96.7%) | 340 (53.9%) |
| 75 Years and over | 243 (94.6%) | 158 (61.5%) |
| Total | 3,746 (34.7%) | 7,067 (65.5%) |
Disability Status by Sex by Age in Fife
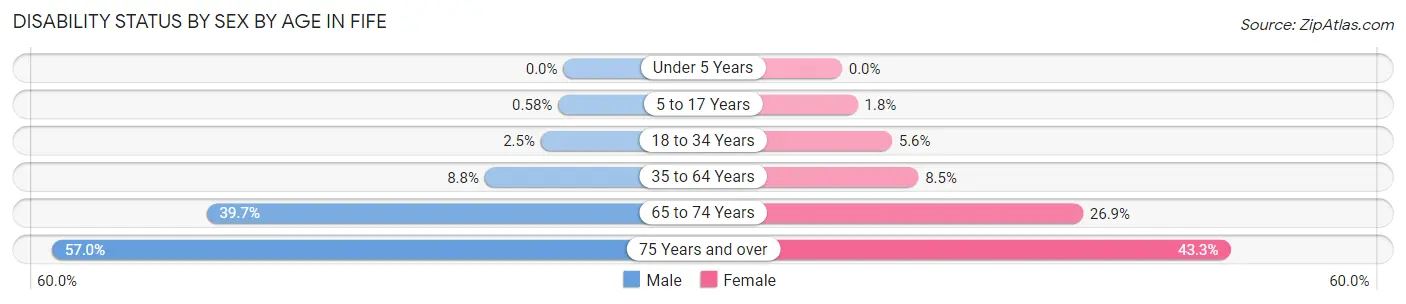
| Age Bracket | Male | Female |
| Under 5 Years | 0 (0.0%) | 0 (0.0%) |
| 5 to 17 Years | 6 (0.6%) | 17 (1.8%) |
| 18 to 34 Years | 44 (2.5%) | 86 (5.6%) |
| 35 to 64 Years | 173 (8.7%) | 164 (8.5%) |
| 65 to 74 Years | 122 (39.7%) | 87 (26.9%) |
| 75 Years and over | 45 (57.0%) | 77 (43.3%) |
Disability Class by Sex by Age in Fife
Disability Class: Hearing Difficulty
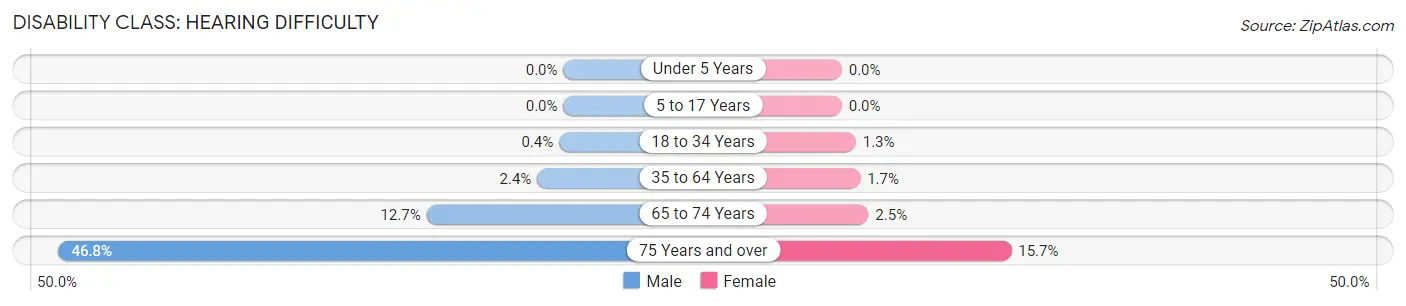
| Age Bracket | Male | Female |
| Under 5 Years | 0 (0.0%) | 0 (0.0%) |
| 5 to 17 Years | 0 (0.0%) | 0 (0.0%) |
| 18 to 34 Years | 7 (0.4%) | 20 (1.3%) |
| 35 to 64 Years | 48 (2.4%) | 33 (1.7%) |
| 65 to 74 Years | 39 (12.7%) | 8 (2.5%) |
| 75 Years and over | 37 (46.8%) | 28 (15.7%) |
Disability Class: Vision Difficulty
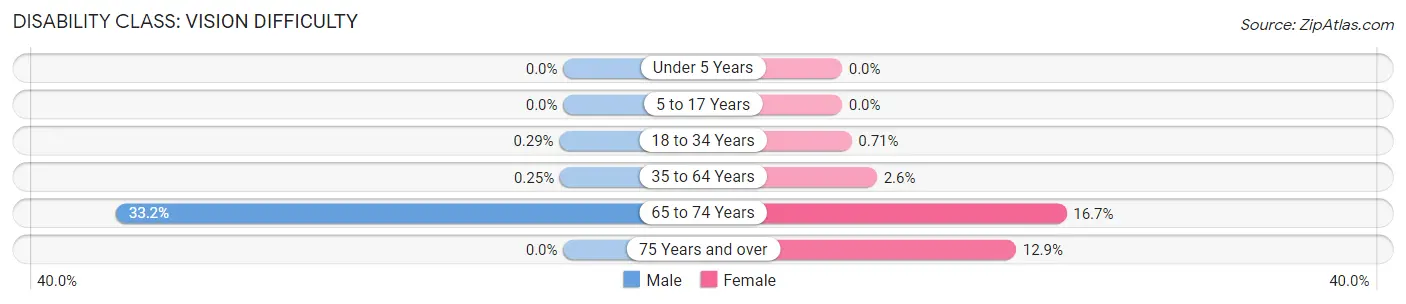
| Age Bracket | Male | Female |
| Under 5 Years | 0 (0.0%) | 0 (0.0%) |
| 5 to 17 Years | 0 (0.0%) | 0 (0.0%) |
| 18 to 34 Years | 5 (0.3%) | 11 (0.7%) |
| 35 to 64 Years | 5 (0.3%) | 50 (2.6%) |
| 65 to 74 Years | 102 (33.2%) | 54 (16.7%) |
| 75 Years and over | 0 (0.0%) | 23 (12.9%) |
Disability Class: Cognitive Difficulty
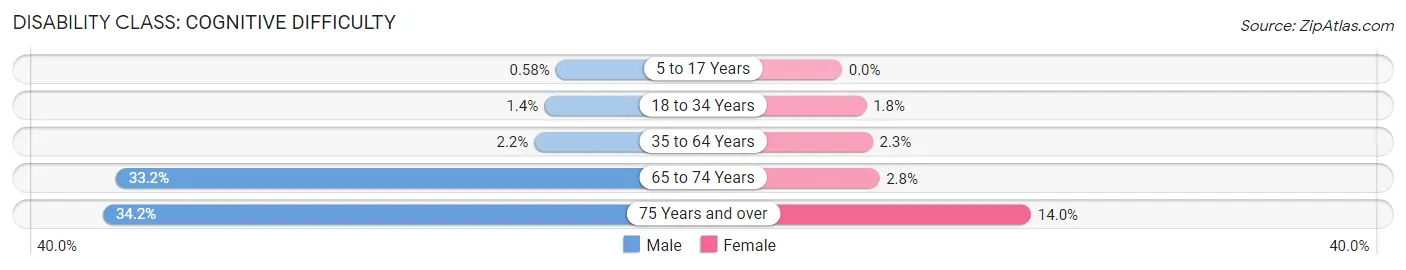
| Age Bracket | Male | Female |
| 5 to 17 Years | 6 (0.6%) | 0 (0.0%) |
| 18 to 34 Years | 25 (1.4%) | 28 (1.8%) |
| 35 to 64 Years | 43 (2.2%) | 44 (2.3%) |
| 65 to 74 Years | 102 (33.2%) | 9 (2.8%) |
| 75 Years and over | 27 (34.2%) | 25 (14.0%) |
Disability Class: Ambulatory Difficulty
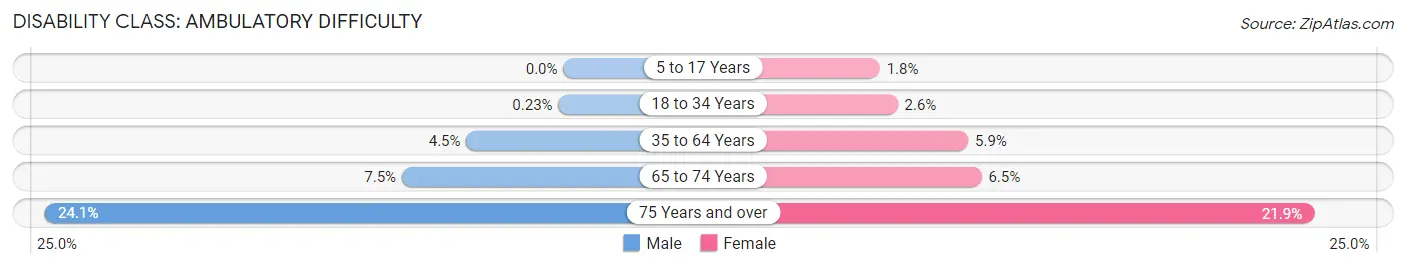
| Age Bracket | Male | Female |
| 5 to 17 Years | 0 (0.0%) | 17 (1.8%) |
| 18 to 34 Years | 4 (0.2%) | 40 (2.6%) |
| 35 to 64 Years | 89 (4.5%) | 113 (5.9%) |
| 65 to 74 Years | 23 (7.5%) | 21 (6.5%) |
| 75 Years and over | 19 (24.0%) | 39 (21.9%) |
Disability Class: Self-Care Difficulty
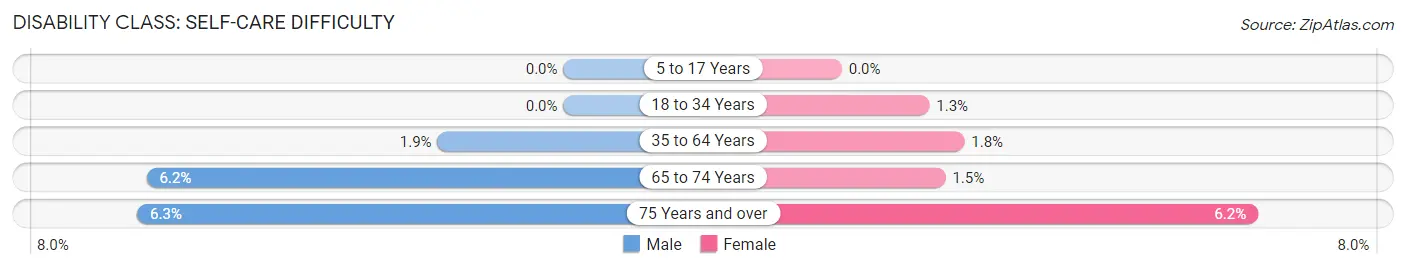
| Age Bracket | Male | Female |
| 5 to 17 Years | 0 (0.0%) | 0 (0.0%) |
| 18 to 34 Years | 0 (0.0%) | 20 (1.3%) |
| 35 to 64 Years | 37 (1.9%) | 35 (1.8%) |
| 65 to 74 Years | 19 (6.2%) | 5 (1.5%) |
| 75 Years and over | 5 (6.3%) | 11 (6.2%) |
Technology Access in Fife
Computing Device Access in Fife
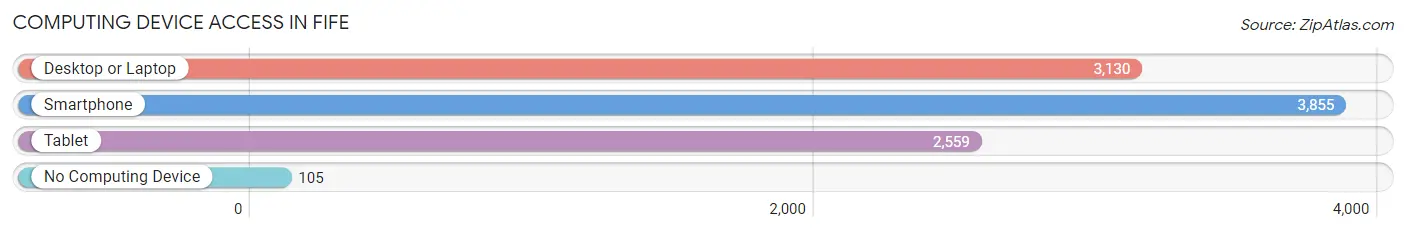
| Device Type | # Households | % Households |
| Desktop or Laptop | 3,130 | 78.0% |
| Smartphone | 3,855 | 96.1% |
| Tablet | 2,559 | 63.8% |
| No Computing Device | 105 | 2.6% |
| Total | 4,011 | 100.0% |
Internet Access in Fife
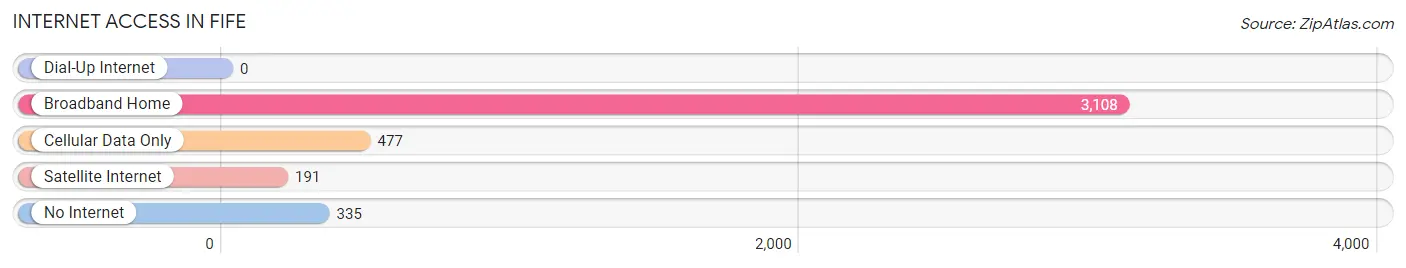
| Internet Type | # Households | % Households |
| Dial-Up Internet | 0 | 0.0% |
| Broadband Home | 3,108 | 77.5% |
| Cellular Data Only | 477 | 11.9% |
| Satellite Internet | 191 | 4.8% |
| No Internet | 335 | 8.4% |
| Total | 4,011 | 100.0% |
Fife Summary
Fife, Washington is a city located in Pierce County, Washington, United States. It is located approximately 25 miles south of Tacoma and 35 miles northeast of Seattle. The population was 9,173 at the 2010 census.
History
Fife was first settled in 1853 by a group of miners from California. The miners named the area after the town of Fife in Scotland. The area was originally part of the Puyallup Indian Reservation, but was opened to non-Native settlement in 1854. The first post office was established in 1876.
In 1891, the Northern Pacific Railway built a line through the area, connecting Tacoma and Seattle. This allowed for the development of the area as a commercial center. The town was officially incorporated in 1957.
Geography
Fife is located at 47°14′N 122°20′W (47.23, -122.33). According to the United States Census Bureau, the city has a total area of 4.7 square miles, of which 4.6 square miles is land and 0.1 square miles (1.45%) is water.
Economy
Fife is home to several large employers, including the Port of Tacoma, the Weyerhaeuser Company, and the Fife School District. The city is also home to several small businesses, including restaurants, retail stores, and service providers.
Demographics
As of the 2010 census, there were 9,173 people, 3,717 households, and 2,521 families residing in the city. The population density was 1,976.2 people per square mile. The racial makeup of the city was 73.2% White, 8.2% African American, 1.2% Native American, 5.3% Asian, 0.4% Pacific Islander, 6.2% from other races, and 5.5% from two or more races. Hispanic or Latino of any race were 13.2% of the population.
The median income for a household in the city was $50,945, and the median income for a family was $60,945. The per capita income for the city was $24,945. About 8.2% of families and 10.2% of the population were below the poverty line, including 14.2% of those under age 18 and 6.2% of those age 65 or over.
Conclusion
Fife, Washington is a city located in Pierce County, Washington, United States. It is located approximately 25 miles south of Tacoma and 35 miles northeast of Seattle. The population was 9,173 at the 2010 census. Fife was first settled in 1853 by a group of miners from California. The area was originally part of the Puyallup Indian Reservation, but was opened to non-Native settlement in 1854. The city is home to several large employers, including the Port of Tacoma, the Weyerhaeuser Company, and the Fife School District. The racial makeup of the city was 73.2% White, 8.2% African American, 1.2% Native American, 5.3% Asian, 0.4% Pacific Islander, 6.2% from other races, and 5.5% from two or more races. The median income for a household in the city was $50,945, and the median income for a family was $60,945. The per capita income for the city was $24,945. About 8.2% of families and 10.2% of the population were below the poverty line. Fife is a vibrant city with a rich history and a diverse population.
Common Questions
What is Per Capita Income in Fife?
Per Capita income in Fife is $36,226.
What is the Median Family Income in Fife?
Median Family Income in Fife is $101,552.
What is the Median Household income in Fife?
Median Household Income in Fife is $84,538.
What is Income or Wage Gap in Fife?
Income or Wage Gap in Fife is 17.3%.
Women in Fife earn 82.7 cents for every dollar earned by a man.
What is Family Income Deficit in Fife?
Family Income Deficit in Fife is $11,971.
Families that are below poverty line in Fife earn $11,971 less on average than the poverty threshold level.
What is Inequality or Gini Index in Fife?
Inequality or Gini Index in Fife is 0.35.
What is the Total Population of Fife?
Total Population of Fife is 10,887.
What is the Total Male Population of Fife?
Total Male Population of Fife is 5,693.
What is the Total Female Population of Fife?
Total Female Population of Fife is 5,194.
What is the Ratio of Males per 100 Females in Fife?
There are 109.61 Males per 100 Females in Fife.
What is the Ratio of Females per 100 Males in Fife?
There are 91.23 Females per 100 Males in Fife.
What is the Median Population Age in Fife?
Median Population Age in Fife is 32.5 Years.
What is the Average Family Size in Fife
Average Family Size in Fife is 3.3 People.
What is the Average Household Size in Fife
Average Household Size in Fife is 2.7 People.
How Large is the Labor Force in Fife?
There are 6,263 People in the Labor Forcein in Fife.
What is the Percentage of People in the Labor Force in Fife?
74.6% of People are in the Labor Force in Fife.
What is the Unemployment Rate in Fife?
Unemployment Rate in Fife is 3.8%.