Parkwood, WA Map & Demographics
Parkwood Map
Parkwood Overview
$38,386
PER CAPITA INCOME
$91,881
AVG FAMILY INCOME
$88,440
AVG HOUSEHOLD INCOME
41.2%
WAGE / INCOME GAP [ % ]
58.8¢/ $1
WAGE / INCOME GAP [ $ ]
0.36
INEQUALITY / GINI INDEX
7,303
TOTAL POPULATION
3,679
MALE POPULATION
3,624
FEMALE POPULATION
101.52
MALES / 100 FEMALES
98.51
FEMALES / 100 MALES
39.3
MEDIAN AGE
3.1
AVG FAMILY SIZE
2.6
AVG HOUSEHOLD SIZE
3,787
LABOR FORCE [ PEOPLE ]
65.4%
PERCENT IN LABOR FORCE
1.3%
UNEMPLOYMENT RATE
Income in Parkwood
Income Overview in Parkwood
Per Capita Income in Parkwood is $38,386, while median incomes of families and households are $91,881 and $88,440 respectively.
| Characteristic | Number | Measure |
| Per Capita Income | 7,303 | $38,386 |
| Median Family Income | 1,887 | $91,881 |
| Mean Family Income | 1,887 | $111,009 |
| Median Household Income | 2,844 | $88,440 |
| Mean Household Income | 2,844 | $96,417 |
| Income Deficit | 1,887 | $0 |
| Wage / Income Gap (%) | 7,303 | 41.17% |
| Wage / Income Gap ($) | 7,303 | 58.83¢ per $1 |
| Gini / Inequality Index | 7,303 | 0.36 |
Earnings by Sex in Parkwood
Average Earnings in Parkwood are $49,800, $59,898 for men and $35,236 for women, a difference of 41.2%.
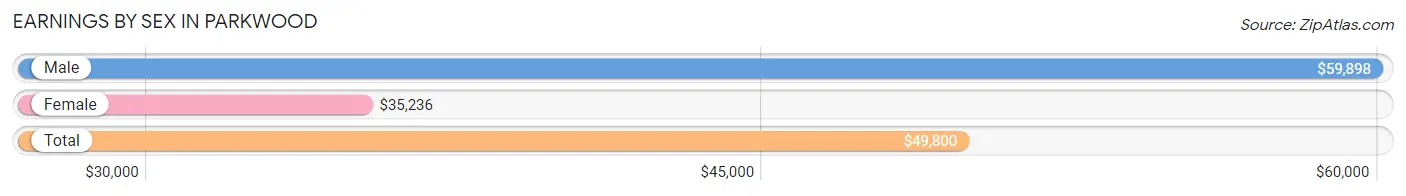
| Sex | Number | Average Earnings |
| Male | 2,212 (55.7%) | $59,898 |
| Female | 1,756 (44.3%) | $35,236 |
| Total | 3,968 (100.0%) | $49,800 |
Earnings by Sex by Income Bracket in Parkwood
The most common earnings brackets in Parkwood are $100,000+ for men (393 | 17.8%) and $55,000 to $64,999 for women (283 | 16.1%).
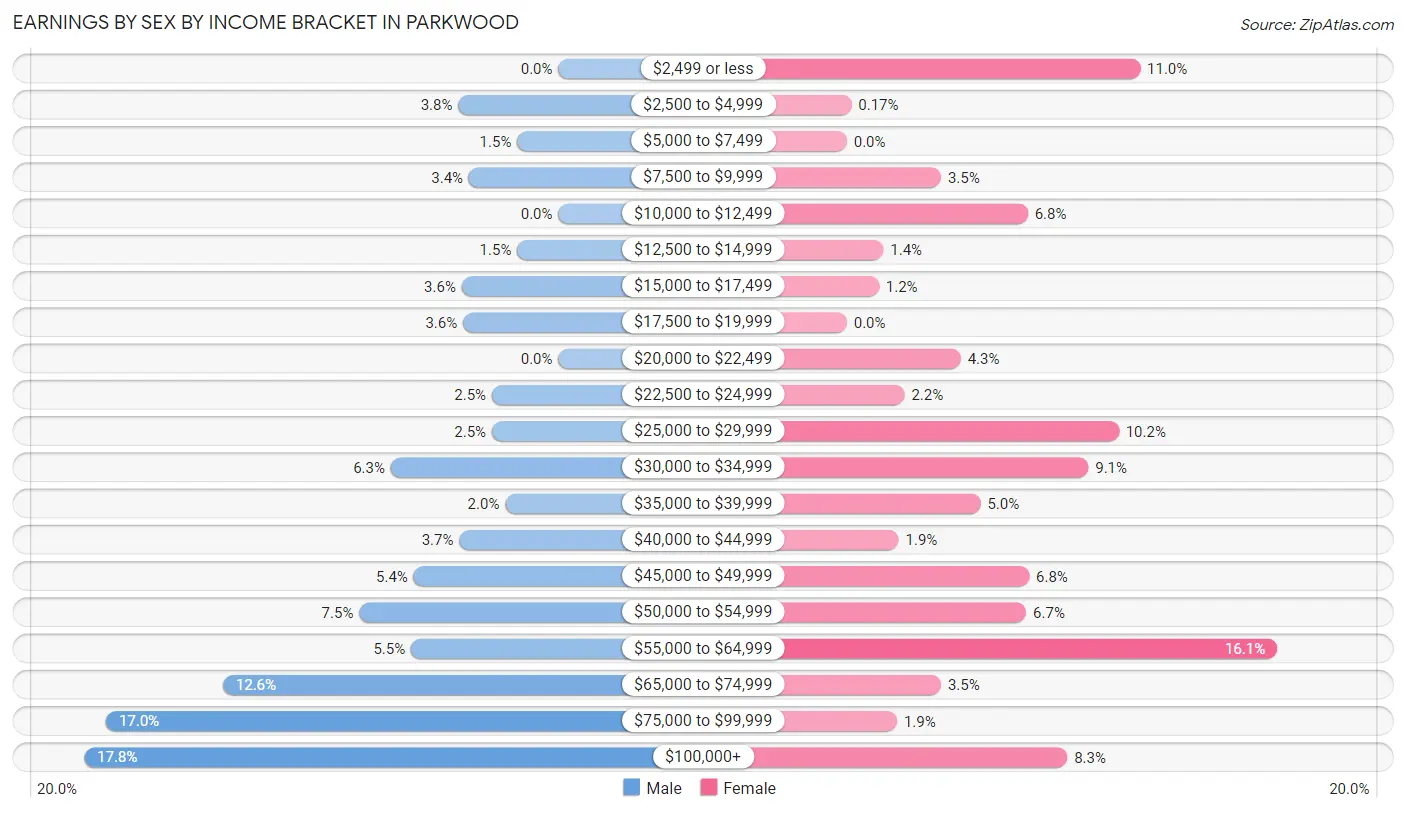
| Income | Male | Female |
| $2,499 or less | 0 (0.0%) | 193 (11.0%) |
| $2,500 to $4,999 | 83 (3.7%) | 3 (0.2%) |
| $5,000 to $7,499 | 34 (1.5%) | 0 (0.0%) |
| $7,500 to $9,999 | 74 (3.4%) | 62 (3.5%) |
| $10,000 to $12,499 | 0 (0.0%) | 119 (6.8%) |
| $12,500 to $14,999 | 34 (1.5%) | 24 (1.4%) |
| $15,000 to $17,499 | 80 (3.6%) | 21 (1.2%) |
| $17,500 to $19,999 | 79 (3.6%) | 0 (0.0%) |
| $20,000 to $22,499 | 0 (0.0%) | 75 (4.3%) |
| $22,500 to $24,999 | 55 (2.5%) | 38 (2.2%) |
| $25,000 to $29,999 | 55 (2.5%) | 179 (10.2%) |
| $30,000 to $34,999 | 139 (6.3%) | 159 (9.0%) |
| $35,000 to $39,999 | 44 (2.0%) | 88 (5.0%) |
| $40,000 to $44,999 | 82 (3.7%) | 34 (1.9%) |
| $45,000 to $49,999 | 120 (5.4%) | 120 (6.8%) |
| $50,000 to $54,999 | 165 (7.5%) | 118 (6.7%) |
| $55,000 to $64,999 | 122 (5.5%) | 283 (16.1%) |
| $65,000 to $74,999 | 278 (12.6%) | 62 (3.5%) |
| $75,000 to $99,999 | 375 (17.0%) | 33 (1.9%) |
| $100,000+ | 393 (17.8%) | 145 (8.3%) |
| Total | 2,212 (100.0%) | 1,756 (100.0%) |
Earnings by Sex by Educational Attainment in Parkwood
Average earnings in Parkwood are $67,924 for men and $39,750 for women, a difference of 41.5%. Men with an educational attainment of graduate degree enjoy the highest average annual earnings of $101,813, while those with less than high school education earn the least with $48,875. Women with an educational attainment of graduate degree earn the most with the average annual earnings of $106,531, while those with college or associate's degree education have the smallest earnings of $28,238.
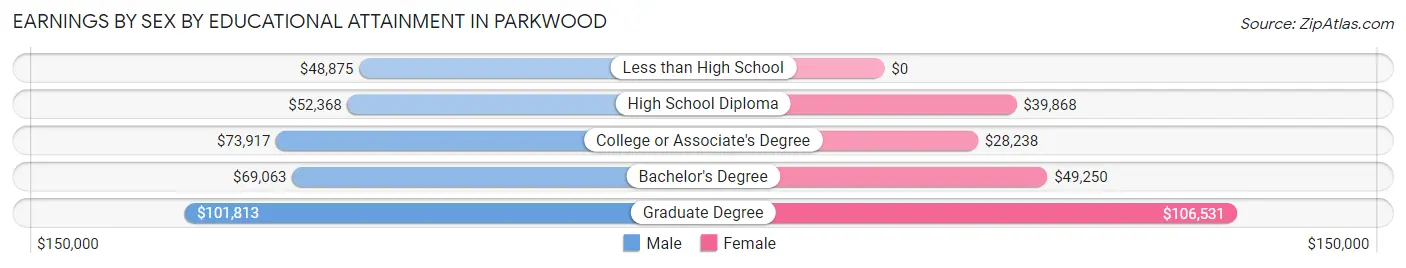
| Educational Attainment | Male Income | Female Income |
| Less than High School | $48,875 | $0 |
| High School Diploma | $52,368 | $39,868 |
| College or Associate's Degree | $73,917 | $28,238 |
| Bachelor's Degree | $69,063 | $49,250 |
| Graduate Degree | $101,813 | $106,531 |
| Total | $67,924 | $39,750 |
Family Income in Parkwood
Family Income Brackets in Parkwood
According to the Parkwood family income data, there are 513 families falling into the $100,000 to $149,999 income range, which is the most common income bracket and makes up 27.2% of all families. Conversely, the $10,000 to $14,999 income bracket is the least frequent group with only 15 families (0.8%) belonging to this category.
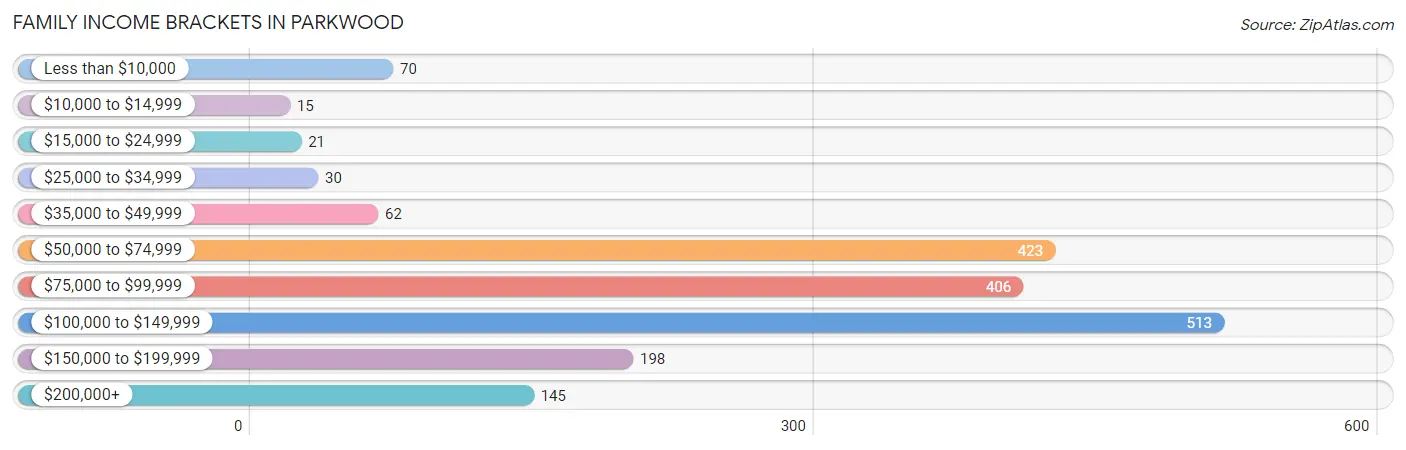
| Income Bracket | # Families | % Families |
| Less than $10,000 | 70 | 3.7% |
| $10,000 to $14,999 | 15 | 0.8% |
| $15,000 to $24,999 | 21 | 1.1% |
| $25,000 to $34,999 | 30 | 1.6% |
| $35,000 to $49,999 | 62 | 3.3% |
| $50,000 to $74,999 | 423 | 22.4% |
| $75,000 to $99,999 | 406 | 21.5% |
| $100,000 to $149,999 | 513 | 27.2% |
| $150,000 to $199,999 | 198 | 10.5% |
| $200,000+ | 145 | 7.7% |
Family Income by Famaliy Size in Parkwood
4-person families (489 | 25.9%) account for the highest median family income in Parkwood with $119,018 per family, while 2-person families (799 | 42.3%) have the highest median income of $44,084 per family member.
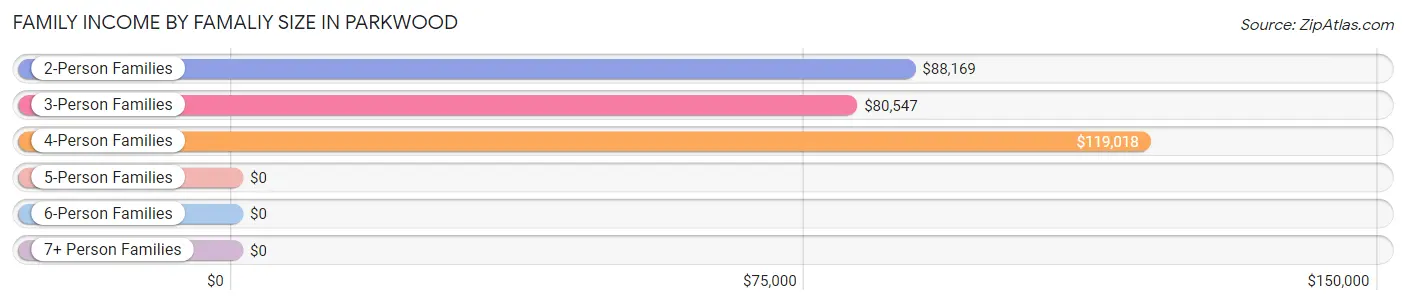
| Income Bracket | # Families | Median Income |
| 2-Person Families | 799 (42.3%) | $88,169 |
| 3-Person Families | 423 (22.4%) | $80,547 |
| 4-Person Families | 489 (25.9%) | $119,018 |
| 5-Person Families | 84 (4.4%) | $0 |
| 6-Person Families | 69 (3.7%) | $0 |
| 7+ Person Families | 23 (1.2%) | $0 |
| Total | 1,887 (100.0%) | $91,881 |
Family Income by Number of Earners in Parkwood
The median family income in Parkwood is $91,881, with families comprising 3+ earners (189) having the highest median family income of $171,431, while families with no earners (262) have the lowest median family income of $67,000, accounting for 10.0% and 13.9% of families, respectively.
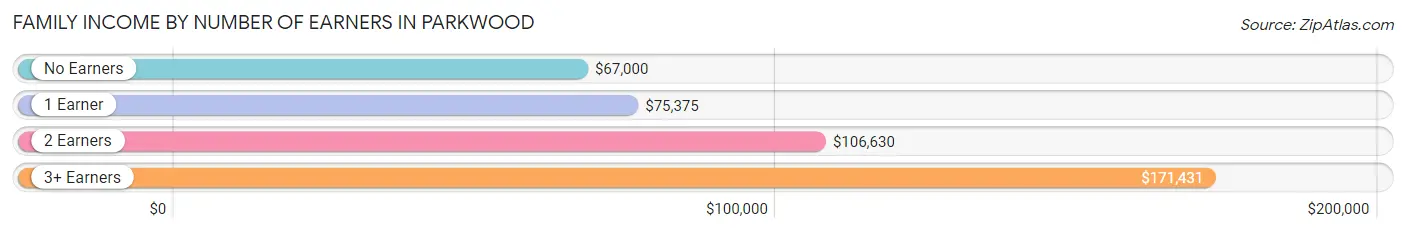
| Number of Earners | # Families | Median Income |
| No Earners | 262 (13.9%) | $67,000 |
| 1 Earner | 574 (30.4%) | $75,375 |
| 2 Earners | 862 (45.7%) | $106,630 |
| 3+ Earners | 189 (10.0%) | $171,431 |
| Total | 1,887 (100.0%) | $91,881 |
Household Income in Parkwood
Household Income Brackets in Parkwood
With 660 households falling in the category, the $100,000 to $149,999 income range is the most frequent in Parkwood, accounting for 23.2% of all households. In contrast, only 43 households (1.5%) fall into the $10,000 to $14,999 income bracket, making it the least populous group.
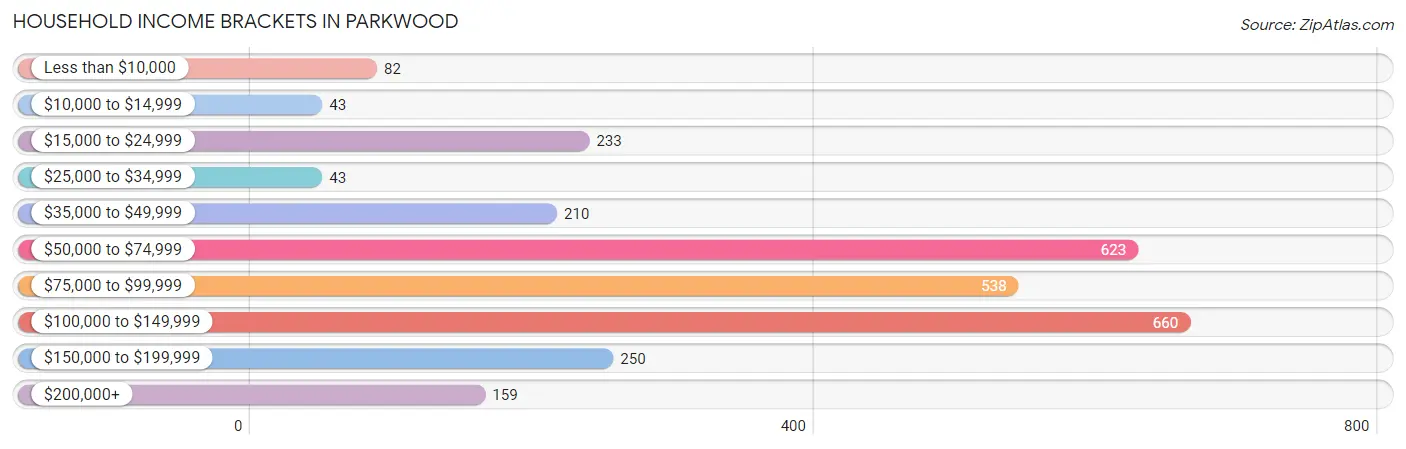
| Income Bracket | # Households | % Households |
| Less than $10,000 | 82 | 2.9% |
| $10,000 to $14,999 | 43 | 1.5% |
| $15,000 to $24,999 | 233 | 8.2% |
| $25,000 to $34,999 | 43 | 1.5% |
| $35,000 to $49,999 | 210 | 7.4% |
| $50,000 to $74,999 | 623 | 21.9% |
| $75,000 to $99,999 | 538 | 18.9% |
| $100,000 to $149,999 | 660 | 23.2% |
| $150,000 to $199,999 | 250 | 8.8% |
| $200,000+ | 159 | 5.6% |
Household Income by Householder Age in Parkwood
The median household income in Parkwood is $88,440, with the highest median household income of $96,865 found in the 25 to 44 years age bracket for the primary householder. A total of 1,163 households (40.9%) fall into this category. Meanwhile, the 15 to 24 years age bracket for the primary householder has the lowest median household income of $0, with 43 households (1.5%) in this group.
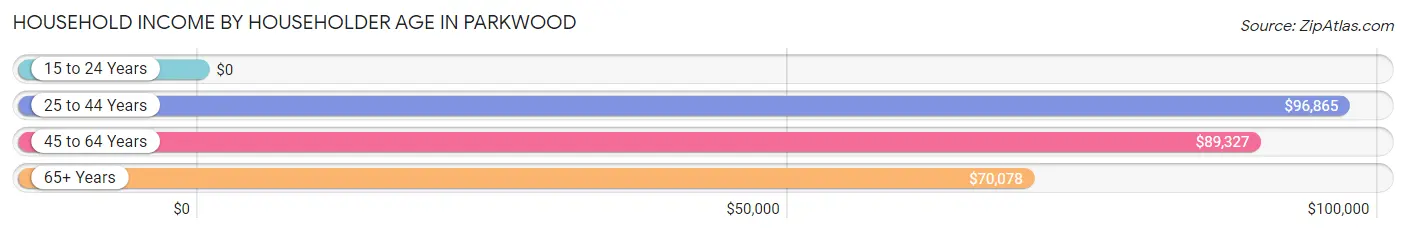
| Income Bracket | # Households | Median Income |
| 15 to 24 Years | 43 (1.5%) | $0 |
| 25 to 44 Years | 1,163 (40.9%) | $96,865 |
| 45 to 64 Years | 961 (33.8%) | $89,327 |
| 65+ Years | 677 (23.8%) | $70,078 |
| Total | 2,844 (100.0%) | $88,440 |
Poverty in Parkwood
Income Below Poverty by Sex and Age in Parkwood
With 6.8% poverty level for males and 8.8% for females among the residents of Parkwood, 18 to 24 year old males and 5 year old females are the most vulnerable to poverty, with 54 males (33.8%) and 25 females (51.0%) in their respective age groups living below the poverty level.
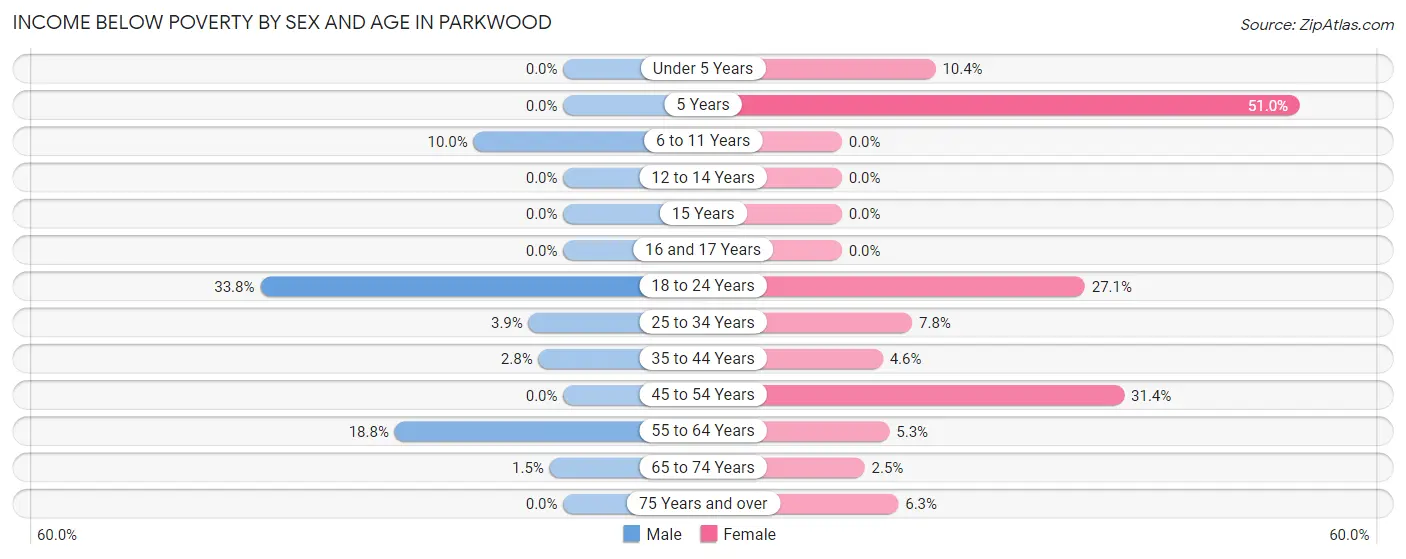
| Age Bracket | Male | Female |
| Under 5 Years | 0 (0.0%) | 17 (10.4%) |
| 5 Years | 0 (0.0%) | 25 (51.0%) |
| 6 to 11 Years | 39 (10.0%) | 0 (0.0%) |
| 12 to 14 Years | 0 (0.0%) | 0 (0.0%) |
| 15 Years | 0 (0.0%) | 0 (0.0%) |
| 16 and 17 Years | 0 (0.0%) | 0 (0.0%) |
| 18 to 24 Years | 54 (33.8%) | 59 (27.1%) |
| 25 to 34 Years | 18 (3.9%) | 44 (7.8%) |
| 35 to 44 Years | 20 (2.8%) | 30 (4.6%) |
| 45 to 54 Years | 0 (0.0%) | 83 (31.4%) |
| 55 to 64 Years | 114 (18.8%) | 28 (5.3%) |
| 65 to 74 Years | 5 (1.5%) | 6 (2.5%) |
| 75 Years and over | 0 (0.0%) | 18 (6.3%) |
| Total | 250 (6.8%) | 310 (8.8%) |
Income Above Poverty by Sex and Age in Parkwood
According to the poverty statistics in Parkwood, males aged under 5 years and females aged 6 to 11 years are the age groups that are most secure financially, with 100.0% of males and 100.0% of females in these age groups living above the poverty line.
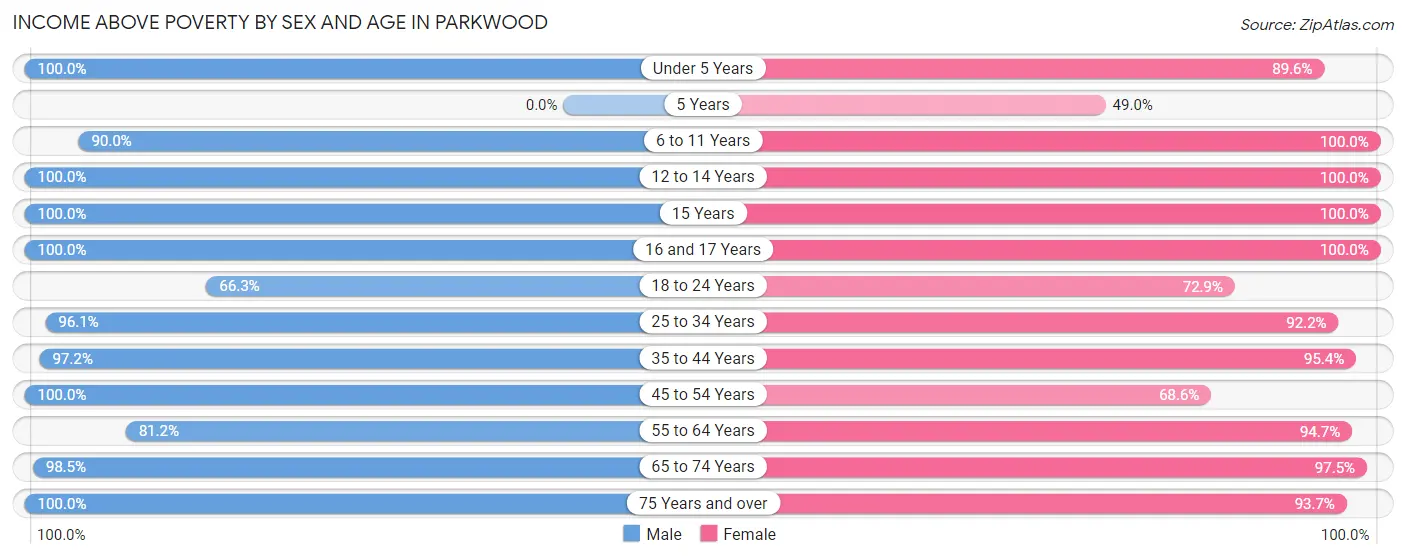
| Age Bracket | Male | Female |
| Under 5 Years | 171 (100.0%) | 146 (89.6%) |
| 5 Years | 0 (0.0%) | 24 (49.0%) |
| 6 to 11 Years | 351 (90.0%) | 381 (100.0%) |
| 12 to 14 Years | 151 (100.0%) | 46 (100.0%) |
| 15 Years | 16 (100.0%) | 31 (100.0%) |
| 16 and 17 Years | 49 (100.0%) | 101 (100.0%) |
| 18 to 24 Years | 106 (66.2%) | 159 (72.9%) |
| 25 to 34 Years | 447 (96.1%) | 518 (92.2%) |
| 35 to 44 Years | 703 (97.2%) | 628 (95.4%) |
| 45 to 54 Years | 331 (100.0%) | 181 (68.6%) |
| 55 to 64 Years | 493 (81.2%) | 500 (94.7%) |
| 65 to 74 Years | 324 (98.5%) | 230 (97.5%) |
| 75 Years and over | 273 (100.0%) | 268 (93.7%) |
| Total | 3,415 (93.2%) | 3,213 (91.2%) |
Income Below Poverty Among Married-Couple Families in Parkwood
The poverty statistics for married-couple families in Parkwood show that 4.8% or 68 of the total 1,420 families live below the poverty line. Families with no children have the highest poverty rate of 9.0%, comprising of 68 families. On the other hand, families with 1 or 2 children have the lowest poverty rate of 0.0%, which includes 0 families.
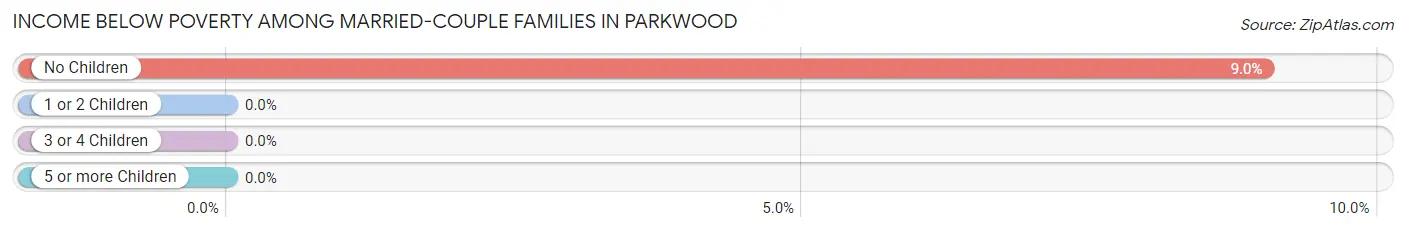
| Children | Above Poverty | Below Poverty |
| No Children | 686 (91.0%) | 68 (9.0%) |
| 1 or 2 Children | 618 (100.0%) | 0 (0.0%) |
| 3 or 4 Children | 48 (100.0%) | 0 (0.0%) |
| 5 or more Children | 0 (0.0%) | 0 (0.0%) |
| Total | 1,352 (95.2%) | 68 (4.8%) |
Income Below Poverty Among Single-Parent Households in Parkwood
According to the poverty data in Parkwood, 7.4% or 18 single-father households and 9.4% or 21 single-mother households are living below the poverty line. Among single-father households, those with 1 or 2 children have the highest poverty rate, with 18 households (13.6%) experiencing poverty. Likewise, among single-mother households, those with 1 or 2 children have the highest poverty rate, with 21 households (19.3%) falling below the poverty line.
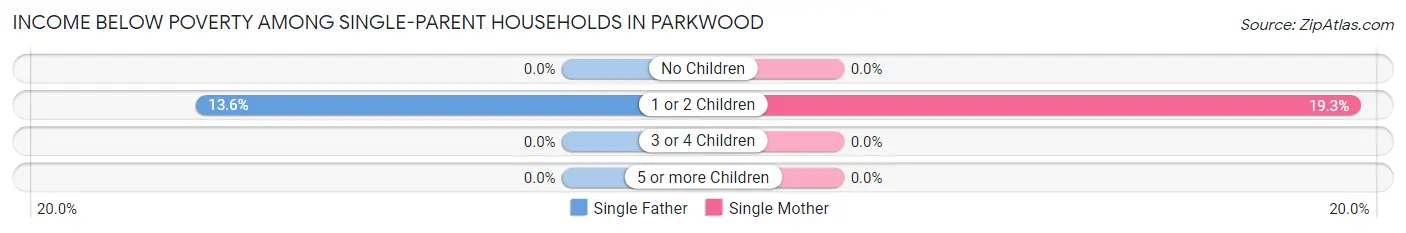
| Children | Single Father | Single Mother |
| No Children | 0 (0.0%) | 0 (0.0%) |
| 1 or 2 Children | 18 (13.6%) | 21 (19.3%) |
| 3 or 4 Children | 0 (0.0%) | 0 (0.0%) |
| 5 or more Children | 0 (0.0%) | 0 (0.0%) |
| Total | 18 (7.4%) | 21 (9.4%) |
Income Below Poverty Among Married-Couple vs Single-Parent Households in Parkwood
The poverty data for Parkwood shows that 68 of the married-couple family households (4.8%) and 39 of the single-parent households (8.4%) are living below the poverty level. Within the married-couple family households, those with no children have the highest poverty rate, with 68 households (9.0%) falling below the poverty line. Among the single-parent households, those with 1 or 2 children have the highest poverty rate, with 39 household (16.2%) living below poverty.
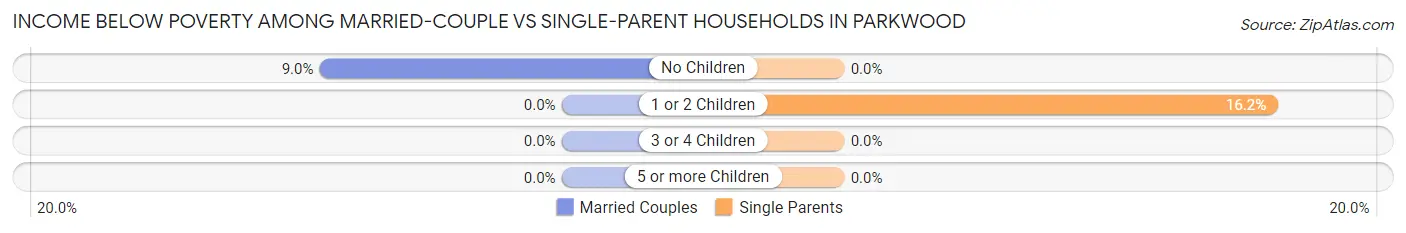
| Children | Married-Couple Families | Single-Parent Households |
| No Children | 68 (9.0%) | 0 (0.0%) |
| 1 or 2 Children | 0 (0.0%) | 39 (16.2%) |
| 3 or 4 Children | 0 (0.0%) | 0 (0.0%) |
| 5 or more Children | 0 (0.0%) | 0 (0.0%) |
| Total | 68 (4.8%) | 39 (8.4%) |
Race in Parkwood
The most populous races in Parkwood are White / Caucasian (5,343 | 73.2%), Hispanic or Latino (878 | 12.0%), and Two or more Races (743 | 10.2%).
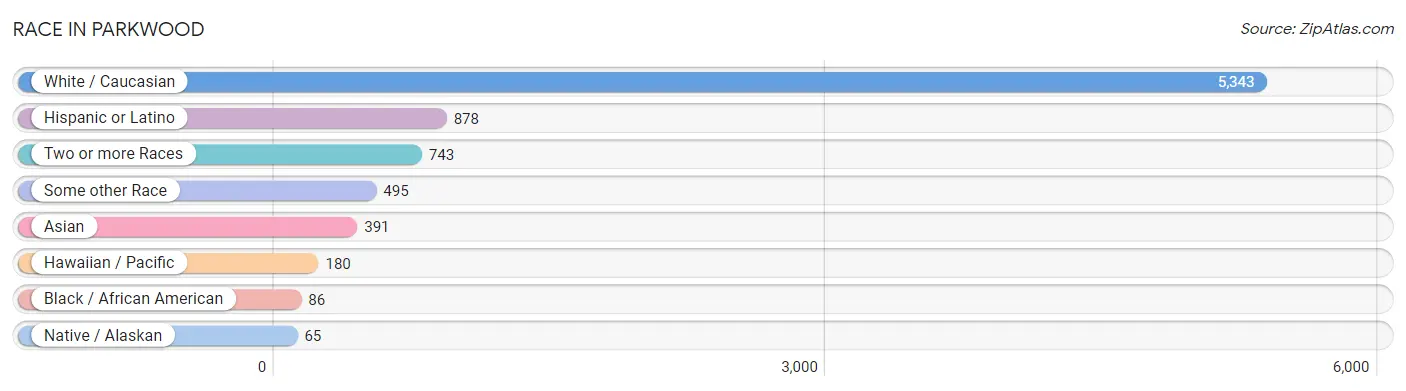
| Race | # Population | % Population |
| Asian | 391 | 5.3% |
| Black / African American | 86 | 1.2% |
| Hawaiian / Pacific | 180 | 2.5% |
| Hispanic or Latino | 878 | 12.0% |
| Native / Alaskan | 65 | 0.9% |
| White / Caucasian | 5,343 | 73.2% |
| Two or more Races | 743 | 10.2% |
| Some other Race | 495 | 6.8% |
| Total | 7,303 | 100.0% |
Ancestry in Parkwood
The most populous ancestries reported in Parkwood are German (1,048 | 14.3%), English (1,025 | 14.0%), Irish (696 | 9.5%), European (499 | 6.8%), and Puerto Rican (495 | 6.8%), together accounting for 51.5% of all Parkwood residents.
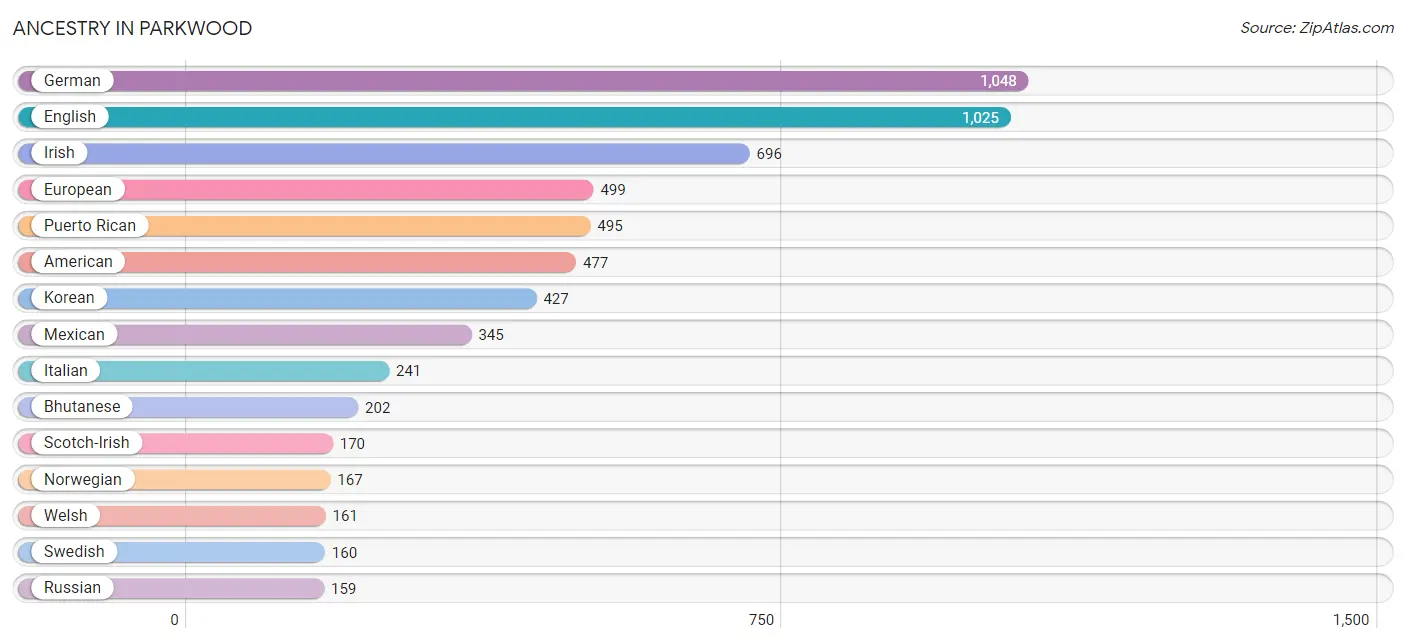
| Ancestry | # Population | % Population |
| African | 52 | 0.7% |
| American | 477 | 6.5% |
| Arab | 126 | 1.7% |
| Austrian | 15 | 0.2% |
| Bhutanese | 202 | 2.8% |
| Blackfeet | 8 | 0.1% |
| British | 9 | 0.1% |
| Burmese | 42 | 0.6% |
| Canadian | 52 | 0.7% |
| Central American | 10 | 0.1% |
| Cherokee | 26 | 0.4% |
| Chickasaw | 39 | 0.5% |
| Cree | 29 | 0.4% |
| Croatian | 56 | 0.8% |
| Czechoslovakian | 21 | 0.3% |
| Danish | 65 | 0.9% |
| Dutch | 147 | 2.0% |
| Eastern European | 46 | 0.6% |
| English | 1,025 | 14.0% |
| European | 499 | 6.8% |
| Finnish | 152 | 2.1% |
| French | 109 | 1.5% |
| French American Indian | 36 | 0.5% |
| French Canadian | 142 | 1.9% |
| German | 1,048 | 14.3% |
| Guamanian / Chamorro | 108 | 1.5% |
| Hungarian | 54 | 0.7% |
| Indian (Asian) | 112 | 1.5% |
| Irish | 696 | 9.5% |
| Italian | 241 | 3.3% |
| Korean | 427 | 5.9% |
| Lebanese | 126 | 1.7% |
| Lithuanian | 9 | 0.1% |
| Mexican | 345 | 4.7% |
| Native Hawaiian | 158 | 2.2% |
| Northern European | 16 | 0.2% |
| Norwegian | 167 | 2.3% |
| Panamanian | 10 | 0.1% |
| Polish | 119 | 1.6% |
| Portuguese | 27 | 0.4% |
| Puerto Rican | 495 | 6.8% |
| Russian | 159 | 2.2% |
| Samoan | 37 | 0.5% |
| Scandinavian | 39 | 0.5% |
| Scotch-Irish | 170 | 2.3% |
| Scottish | 99 | 1.4% |
| Seminole | 65 | 0.9% |
| South American | 13 | 0.2% |
| Spanish | 15 | 0.2% |
| Subsaharan African | 52 | 0.7% |
| Swedish | 160 | 2.2% |
| Swiss | 40 | 0.5% |
| Thai | 88 | 1.2% |
| Ukrainian | 127 | 1.7% |
| Welsh | 161 | 2.2% | View All 55 Rows |
Immigrants in Parkwood
The most numerous immigrant groups reported in Parkwood came from Asia (227 | 3.1%), Philippines (153 | 2.1%), South Eastern Asia (153 | 2.1%), Europe (127 | 1.7%), and Eastern Europe (94 | 1.3%), together accounting for 10.3% of all Parkwood residents.
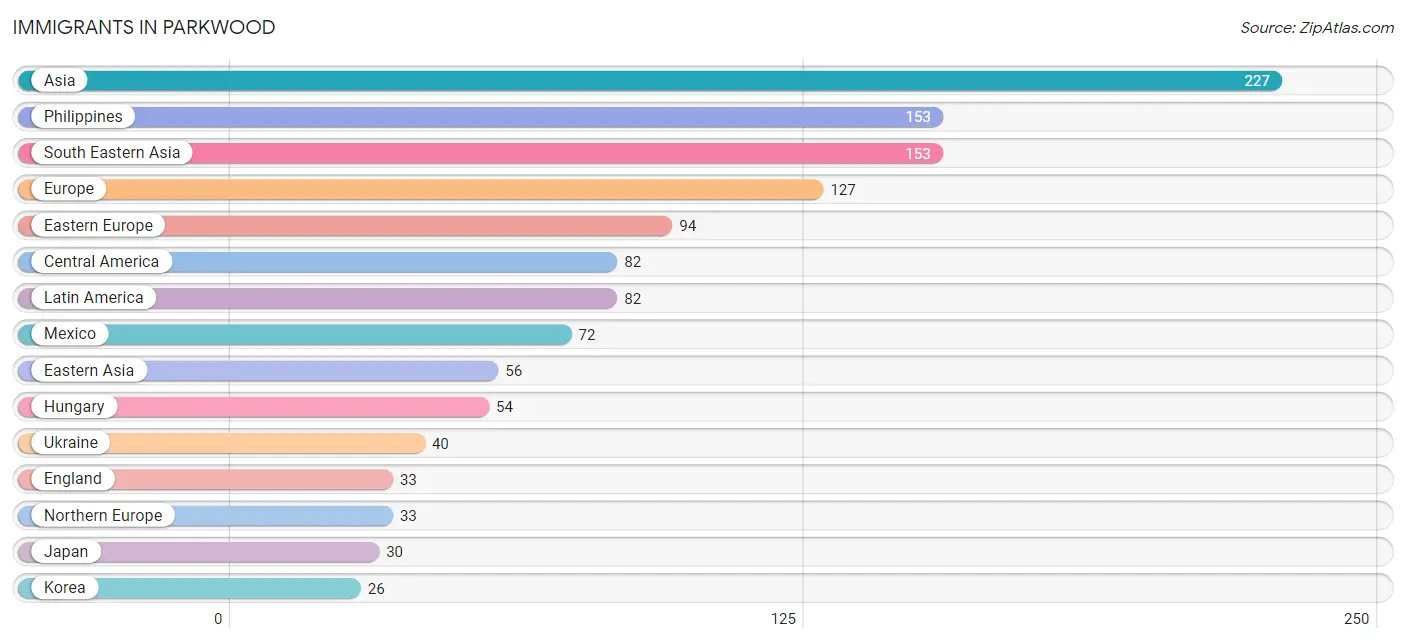
| Immigration Origin | # Population | % Population |
| Asia | 227 | 3.1% |
| Canada | 2 | 0.0% |
| Central America | 82 | 1.1% |
| Eastern Asia | 56 | 0.8% |
| Eastern Europe | 94 | 1.3% |
| England | 33 | 0.4% |
| Europe | 127 | 1.7% |
| Hungary | 54 | 0.7% |
| India | 18 | 0.3% |
| Japan | 30 | 0.4% |
| Korea | 26 | 0.4% |
| Latin America | 82 | 1.1% |
| Mexico | 72 | 1.0% |
| Northern Europe | 33 | 0.4% |
| Panama | 10 | 0.1% |
| Philippines | 153 | 2.1% |
| South Central Asia | 18 | 0.3% |
| South Eastern Asia | 153 | 2.1% |
| Ukraine | 40 | 0.5% | View All 19 Rows |
Sex and Age in Parkwood
Sex and Age in Parkwood
The most populous age groups in Parkwood are 35 to 39 Years (372 | 10.1%) for men and 35 to 39 Years (378 | 10.4%) for women.
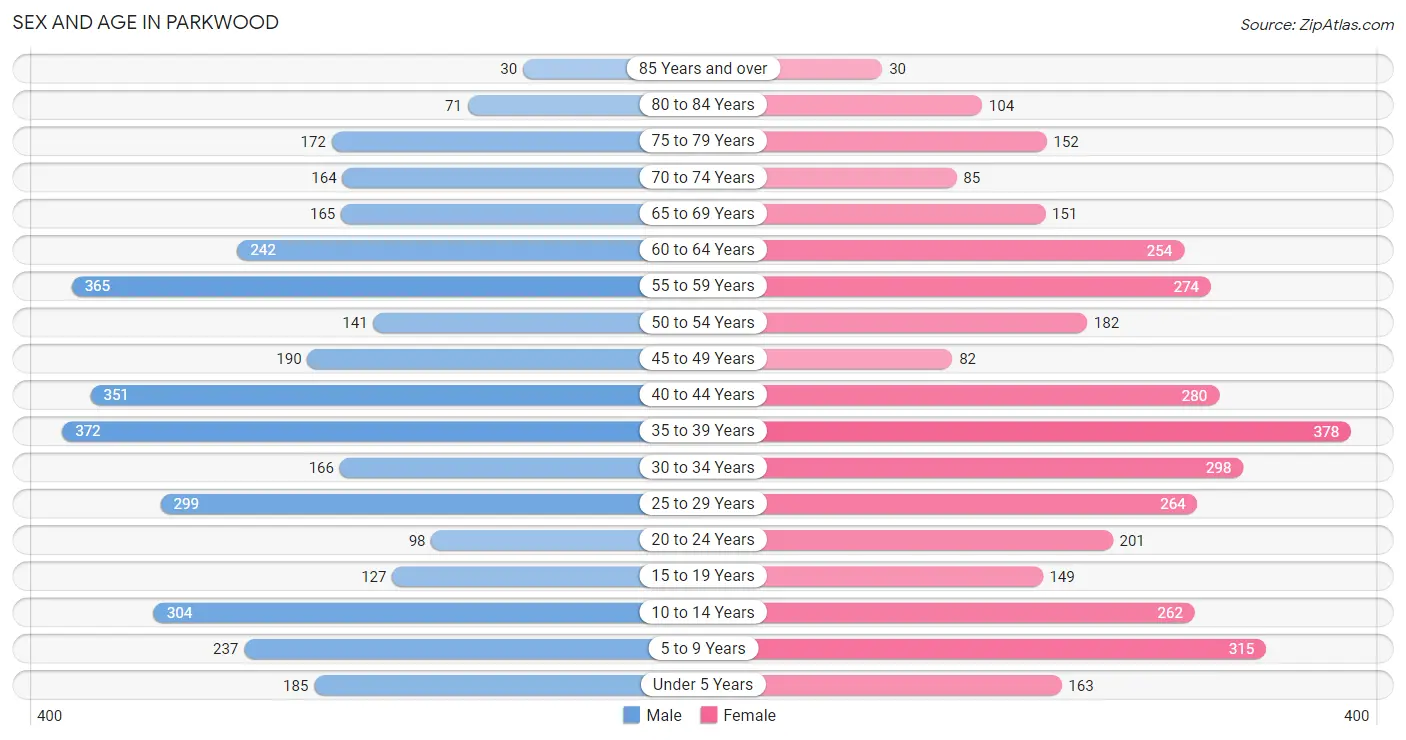
| Age Bracket | Male | Female |
| Under 5 Years | 185 (5.0%) | 163 (4.5%) |
| 5 to 9 Years | 237 (6.4%) | 315 (8.7%) |
| 10 to 14 Years | 304 (8.3%) | 262 (7.2%) |
| 15 to 19 Years | 127 (3.5%) | 149 (4.1%) |
| 20 to 24 Years | 98 (2.7%) | 201 (5.6%) |
| 25 to 29 Years | 299 (8.1%) | 264 (7.3%) |
| 30 to 34 Years | 166 (4.5%) | 298 (8.2%) |
| 35 to 39 Years | 372 (10.1%) | 378 (10.4%) |
| 40 to 44 Years | 351 (9.5%) | 280 (7.7%) |
| 45 to 49 Years | 190 (5.2%) | 82 (2.3%) |
| 50 to 54 Years | 141 (3.8%) | 182 (5.0%) |
| 55 to 59 Years | 365 (9.9%) | 274 (7.6%) |
| 60 to 64 Years | 242 (6.6%) | 254 (7.0%) |
| 65 to 69 Years | 165 (4.5%) | 151 (4.2%) |
| 70 to 74 Years | 164 (4.5%) | 85 (2.4%) |
| 75 to 79 Years | 172 (4.7%) | 152 (4.2%) |
| 80 to 84 Years | 71 (1.9%) | 104 (2.9%) |
| 85 Years and over | 30 (0.8%) | 30 (0.8%) |
| Total | 3,679 (100.0%) | 3,624 (100.0%) |
Families and Households in Parkwood
Median Family Size in Parkwood
The median family size in Parkwood is 3.06 persons per family, with married-couple families (1,420 | 75.2%) accounting for the largest median family size of 3.19 persons per family. On the other hand, single male/father families (243 | 12.9%) represent the smallest median family size with 2.25 persons per family.
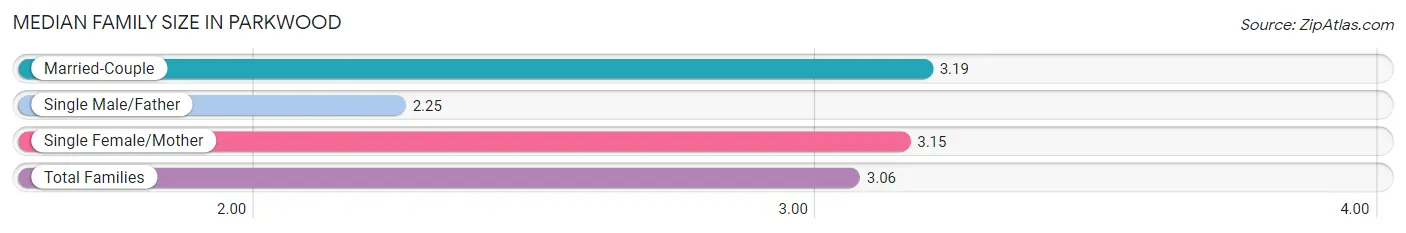
| Family Type | # Families | Family Size |
| Married-Couple | 1,420 (75.2%) | 3.19 |
| Single Male/Father | 243 (12.9%) | 2.25 |
| Single Female/Mother | 224 (11.9%) | 3.15 |
| Total Families | 1,887 (100.0%) | 3.06 |
Median Household Size in Parkwood
The median household size in Parkwood is 2.56 persons per household, with single female/mother households (224 | 7.9%) accounting for the largest median household size of 3.63 persons per household. non-family households (957 | 33.7%) represent the smallest median household size with 1.37 persons per household.
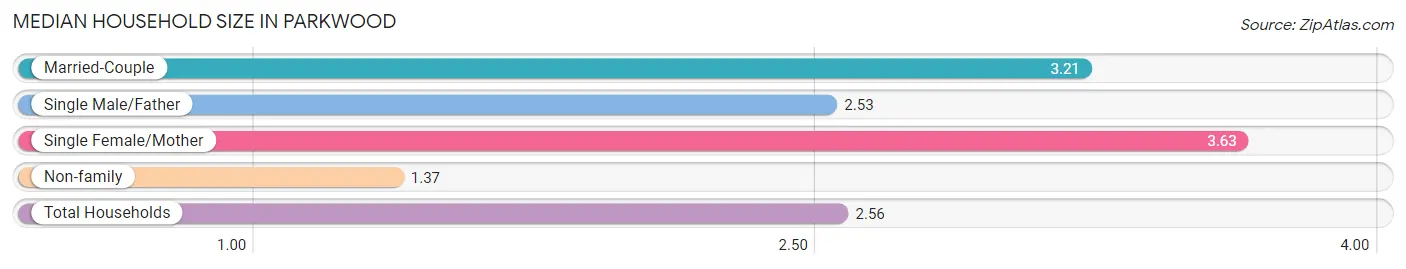
| Household Type | # Households | Household Size |
| Married-Couple | 1,420 (49.9%) | 3.21 |
| Single Male/Father | 243 (8.5%) | 2.53 |
| Single Female/Mother | 224 (7.9%) | 3.63 |
| Non-family | 957 (33.7%) | 1.37 |
| Total Households | 2,844 (100.0%) | 2.56 |
Household Size by Marriage Status in Parkwood
Out of a total of 2,844 households in Parkwood, 1,887 (66.3%) are family households, while 957 (33.7%) are nonfamily households. The most numerous type of family households are 2-person households, comprising 745, and the most common type of nonfamily households are 1-person households, comprising 737.
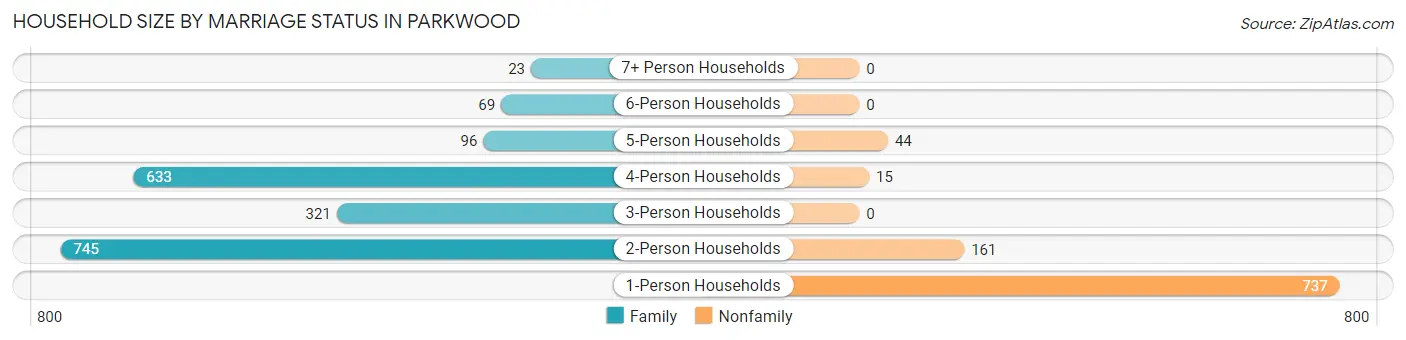
| Household Size | Family Households | Nonfamily Households |
| 1-Person Households | - | 737 (25.9%) |
| 2-Person Households | 745 (26.2%) | 161 (5.7%) |
| 3-Person Households | 321 (11.3%) | 0 (0.0%) |
| 4-Person Households | 633 (22.3%) | 15 (0.5%) |
| 5-Person Households | 96 (3.4%) | 44 (1.5%) |
| 6-Person Households | 69 (2.4%) | 0 (0.0%) |
| 7+ Person Households | 23 (0.8%) | 0 (0.0%) |
| Total | 1,887 (66.3%) | 957 (33.7%) |
Female Fertility in Parkwood
Fertility by Age in Parkwood
Average fertility rate in Parkwood is 55.0 births per 1,000 women. Women in the age bracket of 20 to 34 years have the highest fertility rate with 69.0 births per 1,000 women. Women in the age bracket of 20 to 34 years acount for 57.6% of all women with births.
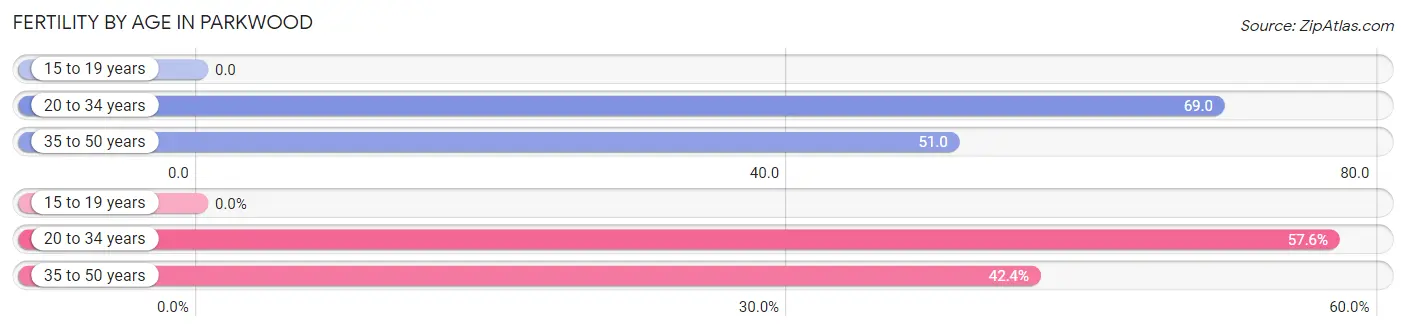
| Age Bracket | Women with Births | Births / 1,000 Women |
| 15 to 19 years | 0 (0.0%) | 0.0 |
| 20 to 34 years | 53 (57.6%) | 69.0 |
| 35 to 50 years | 39 (42.4%) | 51.0 |
| Total | 92 (100.0%) | 55.0 |
Fertility by Age by Marriage Status in Parkwood
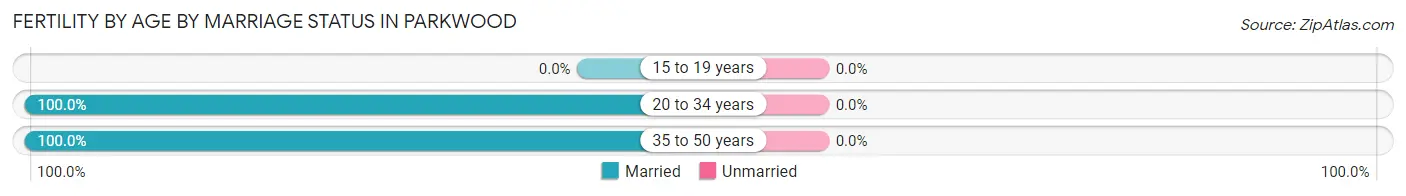
| Age Bracket | Married | Unmarried |
| 15 to 19 years | 0 (0.0%) | 0 (0.0%) |
| 20 to 34 years | 53 (100.0%) | 0 (0.0%) |
| 35 to 50 years | 39 (100.0%) | 0 (0.0%) |
| Total | 92 (100.0%) | 0 (0.0%) |
Fertility by Education in Parkwood
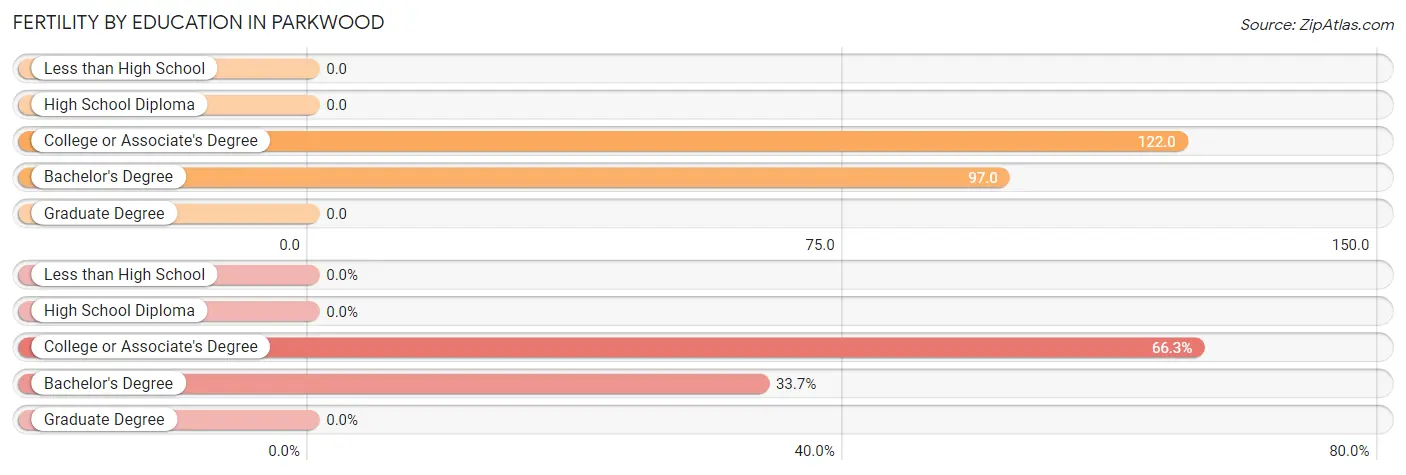
| Educational Attainment | Women with Births | Births / 1,000 Women |
| Less than High School | 0 (0.0%) | 0.0 |
| High School Diploma | 0 (0.0%) | 0.0 |
| College or Associate's Degree | 61 (66.3%) | 122.0 |
| Bachelor's Degree | 31 (33.7%) | 97.0 |
| Graduate Degree | 0 (0.0%) | 0.0 |
| Total | 92 (100.0%) | 55.0 |
Fertility by Education by Marriage Status in Parkwood
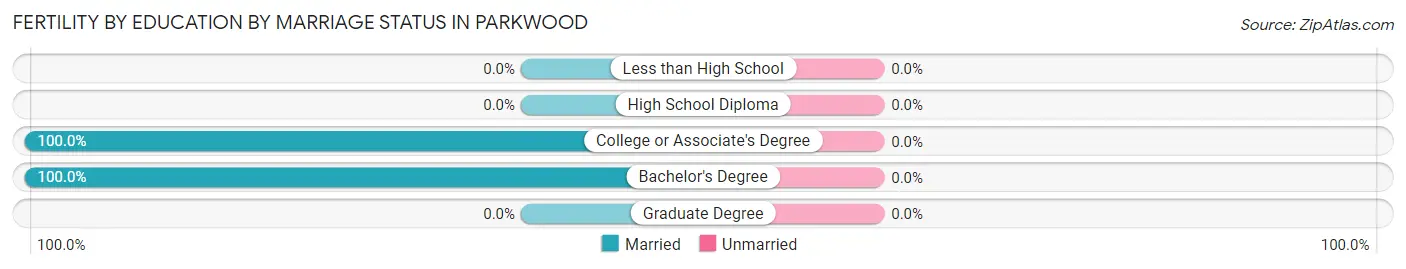
| Educational Attainment | Married | Unmarried |
| Less than High School | 0 (0.0%) | 0 (0.0%) |
| High School Diploma | 0 (0.0%) | 0 (0.0%) |
| College or Associate's Degree | 61 (100.0%) | 0 (0.0%) |
| Bachelor's Degree | 31 (100.0%) | 0 (0.0%) |
| Graduate Degree | 0 (0.0%) | 0 (0.0%) |
| Total | 92 (100.0%) | 0 (0.0%) |
Employment Characteristics in Parkwood
Employment by Class of Employer in Parkwood
Among the 3,644 employed individuals in Parkwood, private company employees (2,048 | 56.2%), federal government employees (791 | 21.7%), and local government employees (359 | 9.9%) make up the most common classes of employment.
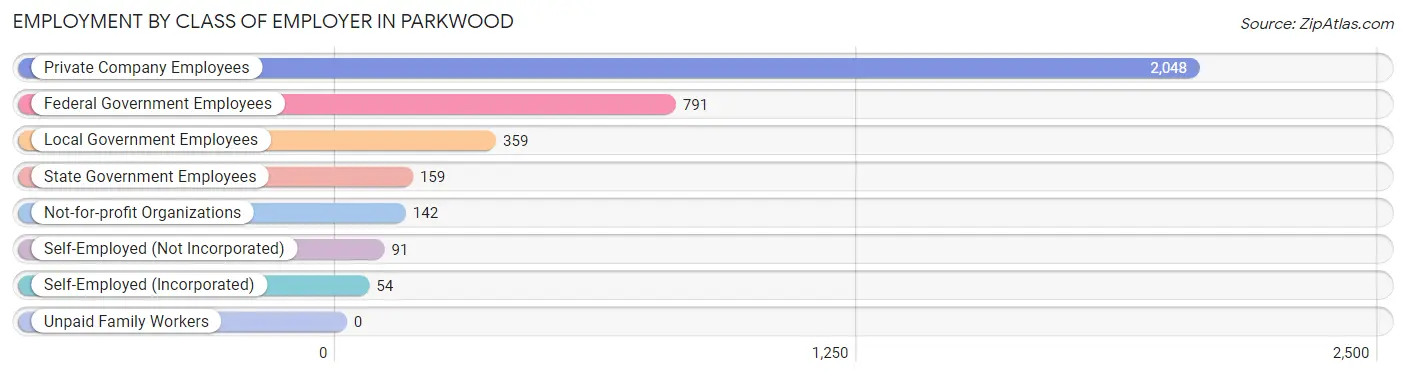
| Employer Class | # Employees | % Employees |
| Private Company Employees | 2,048 | 56.2% |
| Self-Employed (Incorporated) | 54 | 1.5% |
| Self-Employed (Not Incorporated) | 91 | 2.5% |
| Not-for-profit Organizations | 142 | 3.9% |
| Local Government Employees | 359 | 9.9% |
| State Government Employees | 159 | 4.4% |
| Federal Government Employees | 791 | 21.7% |
| Unpaid Family Workers | 0 | 0.0% |
| Total | 3,644 | 100.0% |
Employment Status by Age in Parkwood
According to the labor force statistics for Parkwood, out of the total population over 16 years of age (5,790), 65.4% or 3,787 individuals are in the labor force, with 1.3% or 49 of them unemployed. The age group with the highest labor force participation rate is 25 to 29 years, with 92.2% or 519 individuals in the labor force. Within the labor force, the 35 to 44 years age range has the highest percentage of unemployed individuals, with 4.3% or 51 of them being unemployed.
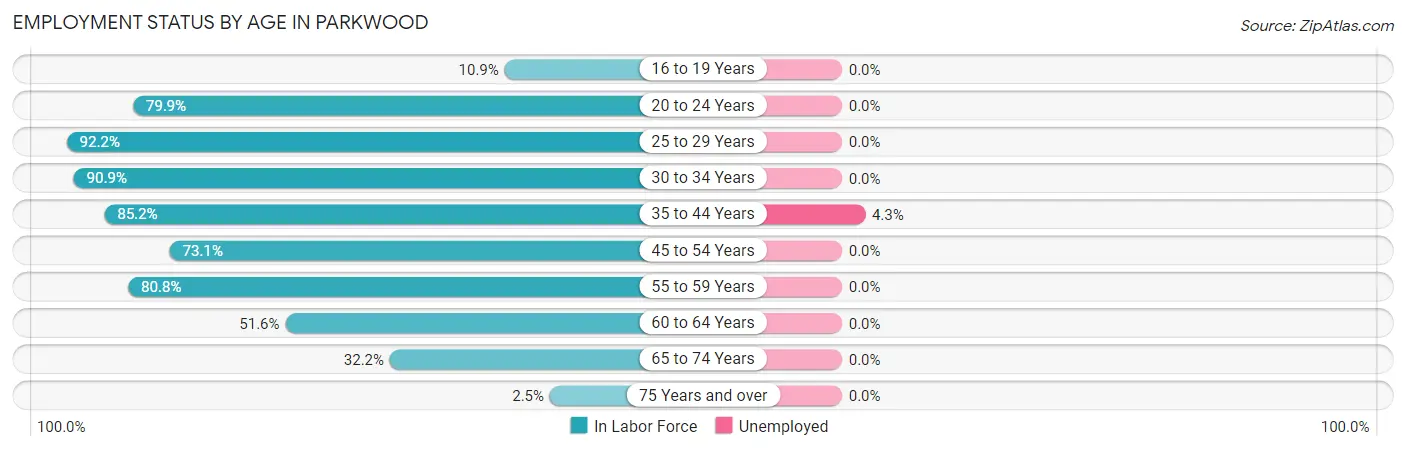
| Age Bracket | In Labor Force | Unemployed |
| 16 to 19 Years | 25 (10.9%) | 0 (0.0%) |
| 20 to 24 Years | 239 (79.9%) | 0 (0.0%) |
| 25 to 29 Years | 519 (92.2%) | 0 (0.0%) |
| 30 to 34 Years | 422 (90.9%) | 0 (0.0%) |
| 35 to 44 Years | 1,177 (85.2%) | 51 (4.3%) |
| 45 to 54 Years | 435 (73.1%) | 0 (0.0%) |
| 55 to 59 Years | 516 (80.8%) | 0 (0.0%) |
| 60 to 64 Years | 256 (51.6%) | 0 (0.0%) |
| 65 to 74 Years | 182 (32.2%) | 0 (0.0%) |
| 75 Years and over | 14 (2.5%) | 0 (0.0%) |
| Total | 3,787 (65.4%) | 49 (1.3%) |
Employment Status by Educational Attainment in Parkwood
According to labor force statistics for Parkwood, 80.3% of individuals (3,323) out of the total population between 25 and 64 years of age (4,138) are in the labor force, with 1.5% or 50 of them being unemployed. The group with the highest labor force participation rate are those with the educational attainment of bachelor's degree or higher, with 89.7% or 804 individuals in the labor force. Within the labor force, individuals with less than high school education have the highest percentage of unemployment, with 15.2% or 30 of them being unemployed.
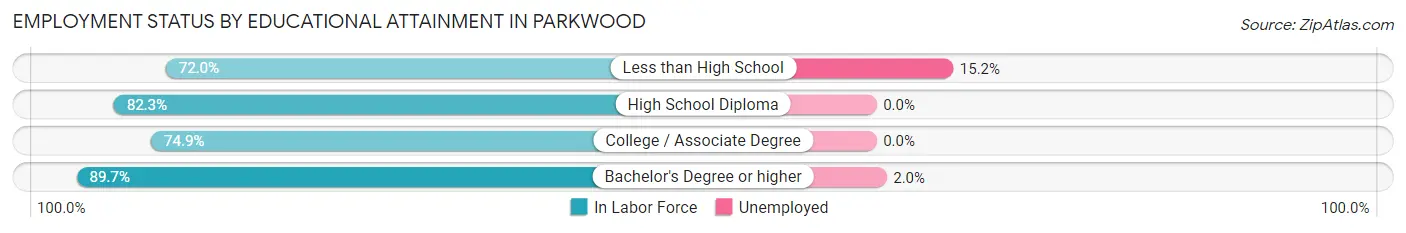
| Educational Attainment | In Labor Force | Unemployed |
| Less than High School | 198 (72.0%) | 42 (15.2%) |
| High School Diploma | 1,095 (82.3%) | 0 (0.0%) |
| College / Associate Degree | 1,225 (74.9%) | 0 (0.0%) |
| Bachelor's Degree or higher | 804 (89.7%) | 18 (2.0%) |
| Total | 3,323 (80.3%) | 62 (1.5%) |
Employment Occupations by Sex in Parkwood
Management, Business, Science and Arts Occupations
The most common Management, Business, Science and Arts occupations in Parkwood are Computers, Engineering & Science (256 | 7.4%), Health Diagnosing & Treating (198 | 5.7%), Management (182 | 5.3%), Community & Social Service (151 | 4.4%), and Computers & Mathematics (129 | 3.7%).
Management, Business, Science and Arts Occupations by Sex
Within the Management, Business, Science and Arts occupations in Parkwood, the most male-oriented occupations are Arts, Media & Entertainment (100.0%), Computers & Mathematics (80.6%), and Computers, Engineering & Science (63.7%), while the most female-oriented occupations are Education, Arts & Media (100.0%), Legal Services & Support (100.0%), and Education Instruction & Library (86.5%).
| Occupation | Male | Female |
| Management | 93 (51.1%) | 89 (48.9%) |
| Business & Financial | 66 (62.9%) | 39 (37.1%) |
| Computers, Engineering & Science | 163 (63.7%) | 93 (36.3%) |
| Computers & Mathematics | 104 (80.6%) | 25 (19.4%) |
| Architecture & Engineering | 59 (46.5%) | 68 (53.5%) |
| Life, Physical & Social Science | 0 (0.0%) | 0 (0.0%) |
| Community & Social Service | 35 (23.2%) | 116 (76.8%) |
| Education, Arts & Media | 0 (0.0%) | 19 (100.0%) |
| Legal Services & Support | 0 (0.0%) | 7 (100.0%) |
| Education Instruction & Library | 14 (13.5%) | 90 (86.5%) |
| Arts, Media & Entertainment | 21 (100.0%) | 0 (0.0%) |
| Health Diagnosing & Treating | 46 (23.2%) | 152 (76.8%) |
| Health Technologists | 25 (24.3%) | 78 (75.7%) |
| Total (Category) | 403 (45.2%) | 489 (54.8%) |
| Total (Overall) | 1,896 (54.9%) | 1,558 (45.1%) |
Services Occupations
The most common Services occupations in Parkwood are Food Preparation & Serving (275 | 8.0%), Healthcare Support (118 | 3.4%), Cleaning & Maintenance (99 | 2.9%), Personal Care & Service (94 | 2.7%), and Security & Protection (93 | 2.7%).
Services Occupations by Sex
Within the Services occupations in Parkwood, the most male-oriented occupations are Security & Protection (100.0%), Firefighting & Prevention (100.0%), and Cleaning & Maintenance (36.4%), while the most female-oriented occupations are Healthcare Support (84.8%), Food Preparation & Serving (81.8%), and Personal Care & Service (80.8%).
| Occupation | Male | Female |
| Healthcare Support | 18 (15.2%) | 100 (84.8%) |
| Security & Protection | 93 (100.0%) | 0 (0.0%) |
| Firefighting & Prevention | 93 (100.0%) | 0 (0.0%) |
| Law Enforcement | 0 (0.0%) | 0 (0.0%) |
| Food Preparation & Serving | 50 (18.2%) | 225 (81.8%) |
| Cleaning & Maintenance | 36 (36.4%) | 63 (63.6%) |
| Personal Care & Service | 18 (19.2%) | 76 (80.8%) |
| Total (Category) | 215 (31.7%) | 464 (68.3%) |
| Total (Overall) | 1,896 (54.9%) | 1,558 (45.1%) |
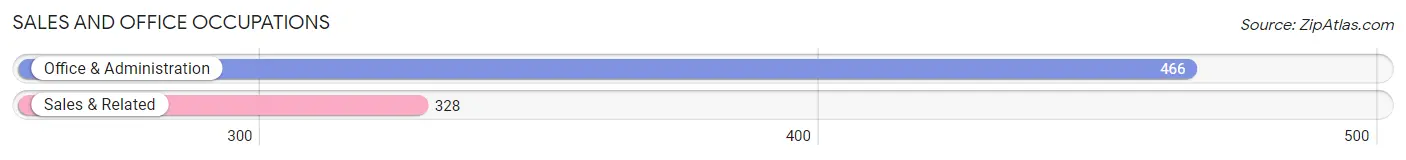
Sales and Office Occupations
The most common Sales and Office occupations in Parkwood are Office & Administration (466 | 13.5%), and Sales & Related (328 | 9.5%).
Sales and Office Occupations by Sex
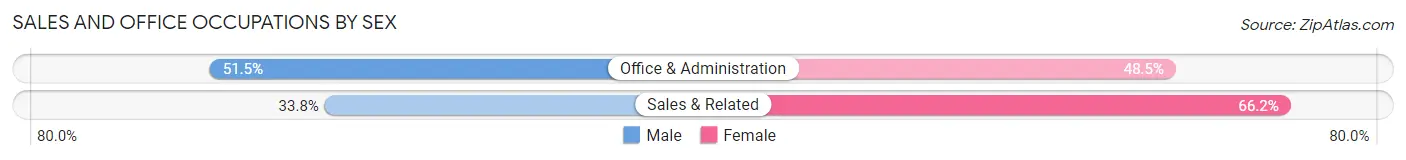
| Occupation | Male | Female |
| Sales & Related | 111 (33.8%) | 217 (66.2%) |
| Office & Administration | 240 (51.5%) | 226 (48.5%) |
| Total (Category) | 351 (44.2%) | 443 (55.8%) |
| Total (Overall) | 1,896 (54.9%) | 1,558 (45.1%) |
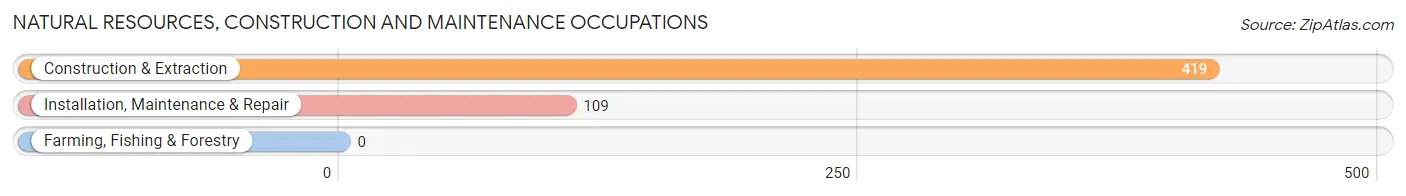
Natural Resources, Construction and Maintenance Occupations
The most common Natural Resources, Construction and Maintenance occupations in Parkwood are Construction & Extraction (419 | 12.1%), and Installation, Maintenance & Repair (109 | 3.2%).
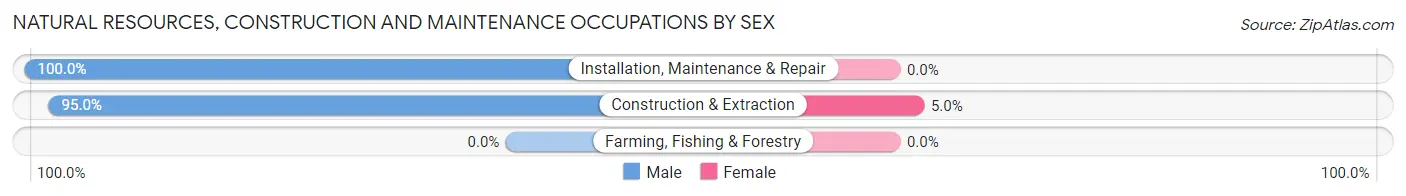
Natural Resources, Construction and Maintenance Occupations by Sex
| Occupation | Male | Female |
| Farming, Fishing & Forestry | 0 (0.0%) | 0 (0.0%) |
| Construction & Extraction | 398 (95.0%) | 21 (5.0%) |
| Installation, Maintenance & Repair | 109 (100.0%) | 0 (0.0%) |
| Total (Category) | 507 (96.0%) | 21 (4.0%) |
| Total (Overall) | 1,896 (54.9%) | 1,558 (45.1%) |
Production, Transportation and Moving Occupations
The most common Production, Transportation and Moving occupations in Parkwood are Production (216 | 6.2%), Transportation (198 | 5.7%), and Material Moving (147 | 4.3%).
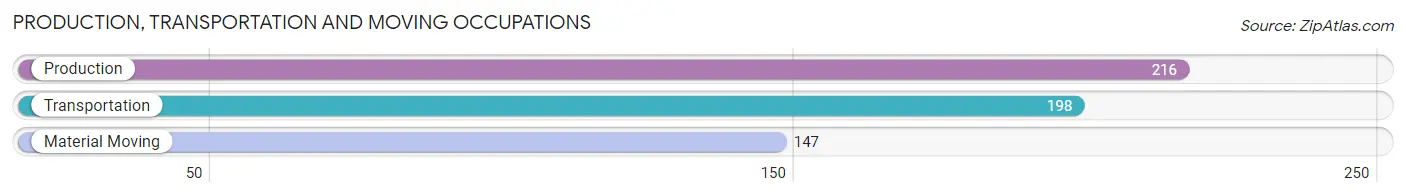
Production, Transportation and Moving Occupations by Sex
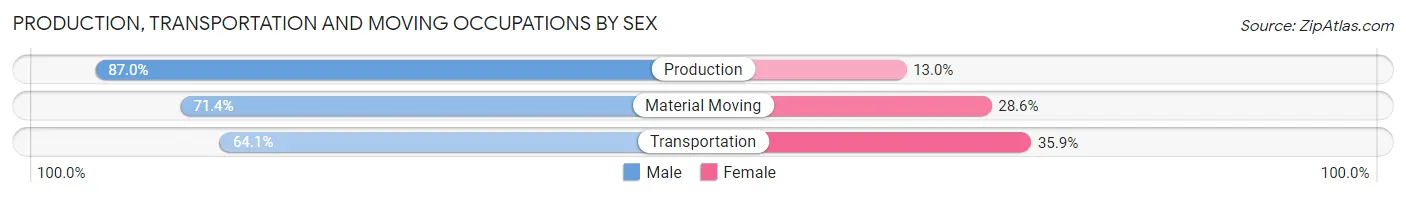
| Occupation | Male | Female |
| Production | 188 (87.0%) | 28 (13.0%) |
| Transportation | 127 (64.1%) | 71 (35.9%) |
| Material Moving | 105 (71.4%) | 42 (28.6%) |
| Total (Category) | 420 (74.9%) | 141 (25.1%) |
| Total (Overall) | 1,896 (54.9%) | 1,558 (45.1%) |
Employment Industries by Sex in Parkwood
Employment Industries in Parkwood
The major employment industries in Parkwood include Retail Trade (639 | 18.5%), Public Administration (417 | 12.1%), Manufacturing (387 | 11.2%), Construction (355 | 10.3%), and Health Care & Social Assistance (339 | 9.8%).
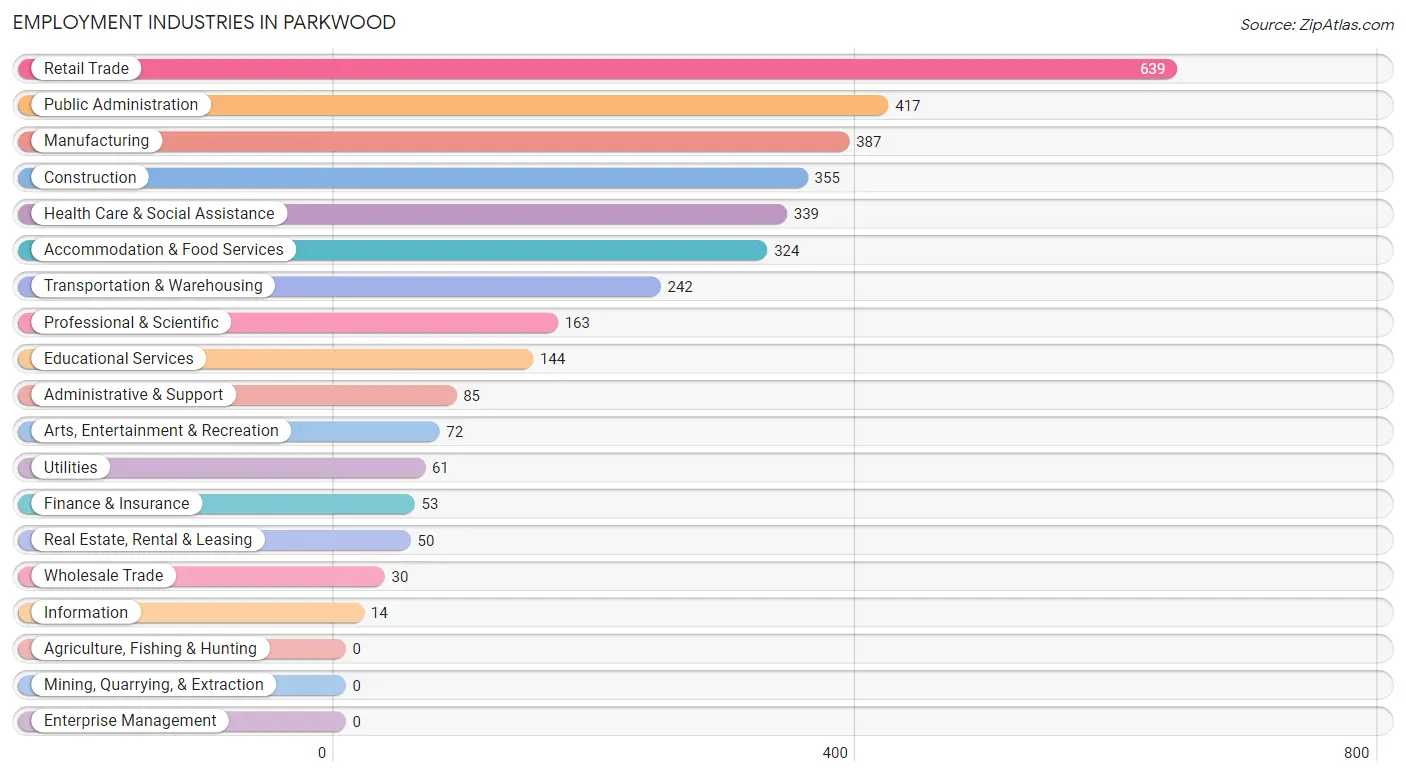
Employment Industries by Sex in Parkwood
The Parkwood industries that see more men than women are Wholesale Trade (100.0%), Utilities (100.0%), and Construction (94.1%), whereas the industries that tend to have a higher number of women are Information (100.0%), Real Estate, Rental & Leasing (100.0%), and Accommodation & Food Services (80.2%).
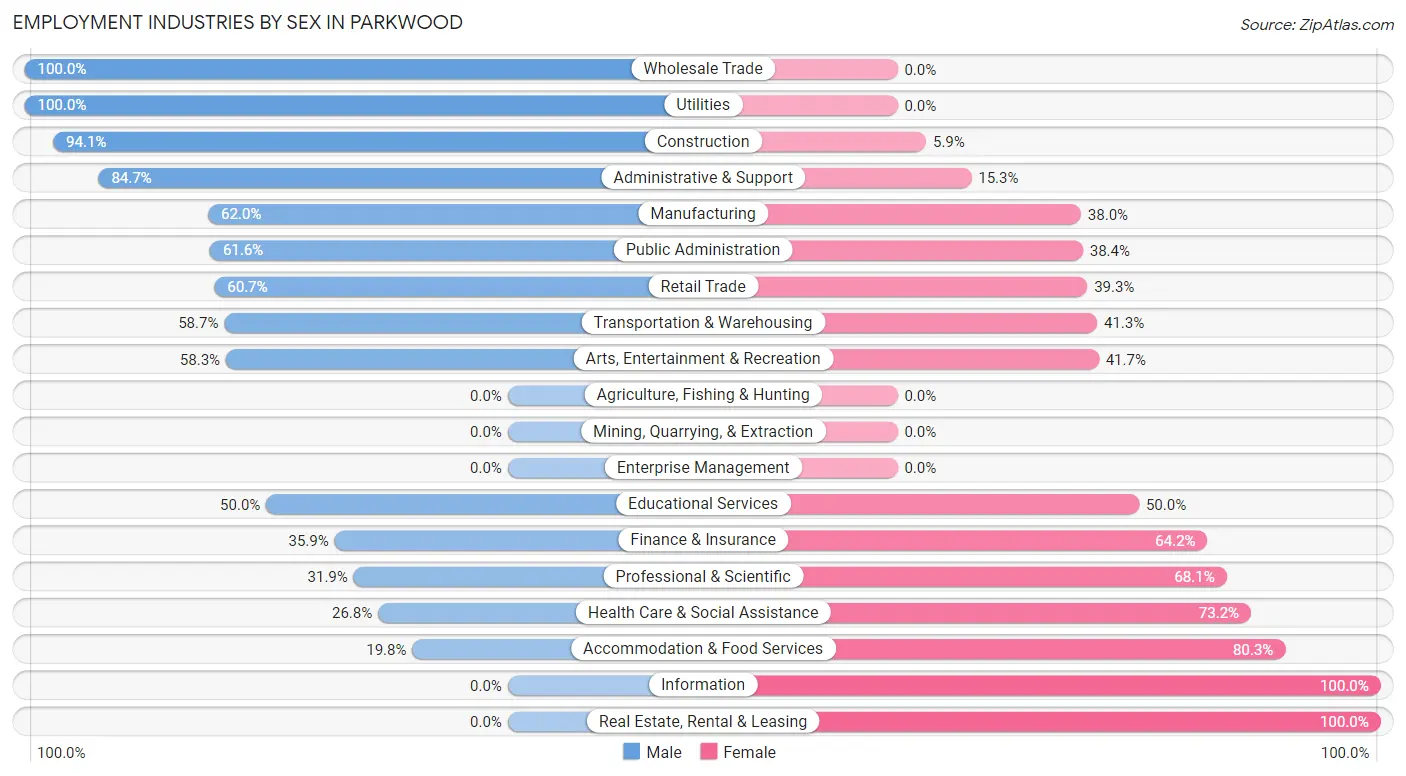
| Industry | Male | Female |
| Agriculture, Fishing & Hunting | 0 (0.0%) | 0 (0.0%) |
| Mining, Quarrying, & Extraction | 0 (0.0%) | 0 (0.0%) |
| Construction | 334 (94.1%) | 21 (5.9%) |
| Manufacturing | 240 (62.0%) | 147 (38.0%) |
| Wholesale Trade | 30 (100.0%) | 0 (0.0%) |
| Retail Trade | 388 (60.7%) | 251 (39.3%) |
| Transportation & Warehousing | 142 (58.7%) | 100 (41.3%) |
| Utilities | 61 (100.0%) | 0 (0.0%) |
| Information | 0 (0.0%) | 14 (100.0%) |
| Finance & Insurance | 19 (35.8%) | 34 (64.1%) |
| Real Estate, Rental & Leasing | 0 (0.0%) | 50 (100.0%) |
| Professional & Scientific | 52 (31.9%) | 111 (68.1%) |
| Enterprise Management | 0 (0.0%) | 0 (0.0%) |
| Administrative & Support | 72 (84.7%) | 13 (15.3%) |
| Educational Services | 72 (50.0%) | 72 (50.0%) |
| Health Care & Social Assistance | 91 (26.8%) | 248 (73.2%) |
| Arts, Entertainment & Recreation | 42 (58.3%) | 30 (41.7%) |
| Accommodation & Food Services | 64 (19.8%) | 260 (80.2%) |
| Public Administration | 257 (61.6%) | 160 (38.4%) |
| Total | 1,896 (54.9%) | 1,558 (45.1%) |
Education in Parkwood
School Enrollment in Parkwood
The most common levels of schooling among the 1,623 students in Parkwood are elementary school (569 | 35.1%), middle school (442 | 27.2%), and high school (276 | 17.0%).
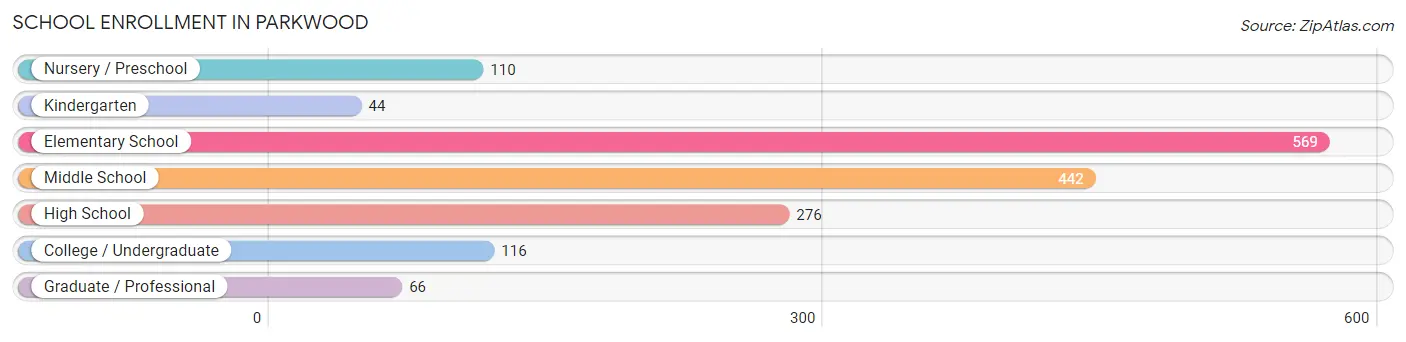
| School Level | # Students | % Students |
| Nursery / Preschool | 110 | 6.8% |
| Kindergarten | 44 | 2.7% |
| Elementary School | 569 | 35.1% |
| Middle School | 442 | 27.2% |
| High School | 276 | 17.0% |
| College / Undergraduate | 116 | 7.1% |
| Graduate / Professional | 66 | 4.1% |
| Total | 1,623 | 100.0% |
School Enrollment by Age by Funding Source in Parkwood
Out of a total of 1,623 students who are enrolled in schools in Parkwood, 180 (11.1%) attend a private institution, while the remaining 1,443 (88.9%) are enrolled in public schools. The age group of 3 to 4 year olds has the highest likelihood of being enrolled in private schools, with 38 (52.8% in the age bracket) enrolled. Conversely, the age group of 15 to 17 year olds has the lowest likelihood of being enrolled in a private school, with 197 (100.0% in the age bracket) attending a public institution.
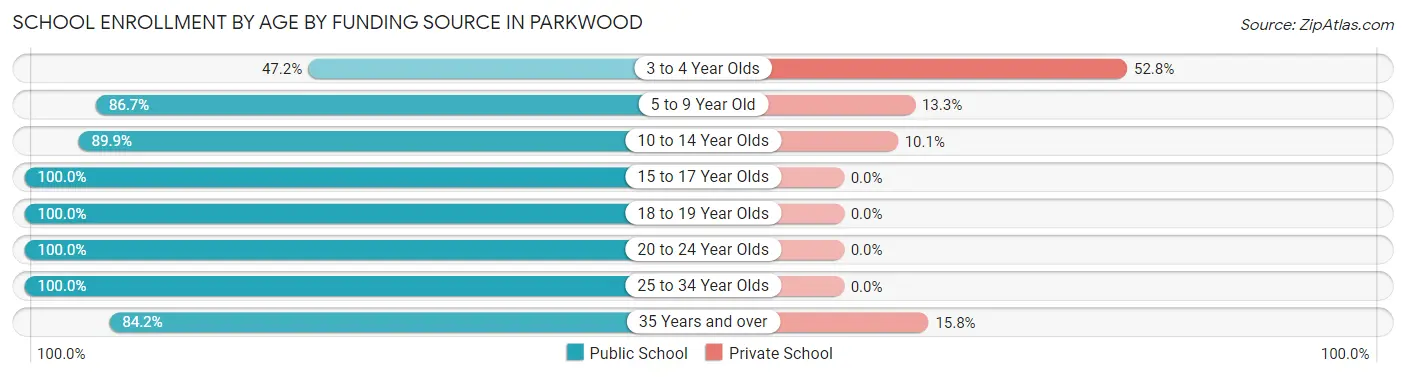
| Age Bracket | Public School | Private School |
| 3 to 4 Year Olds | 34 (47.2%) | 38 (52.8%) |
| 5 to 9 Year Old | 457 (86.7%) | 70 (13.3%) |
| 10 to 14 Year Olds | 509 (89.9%) | 57 (10.1%) |
| 15 to 17 Year Olds | 197 (100.0%) | 0 (0.0%) |
| 18 to 19 Year Olds | 79 (100.0%) | 0 (0.0%) |
| 20 to 24 Year Olds | 41 (100.0%) | 0 (0.0%) |
| 25 to 34 Year Olds | 46 (100.0%) | 0 (0.0%) |
| 35 Years and over | 80 (84.2%) | 15 (15.8%) |
| Total | 1,443 (88.9%) | 180 (11.1%) |
Educational Attainment by Field of Study in Parkwood
Business (334 | 29.7%), social sciences (144 | 12.8%), education (103 | 9.2%), arts & humanities (103 | 9.2%), and science & technology (91 | 8.1%) are the most common fields of study among 1,123 individuals in Parkwood who have obtained a bachelor's degree or higher.
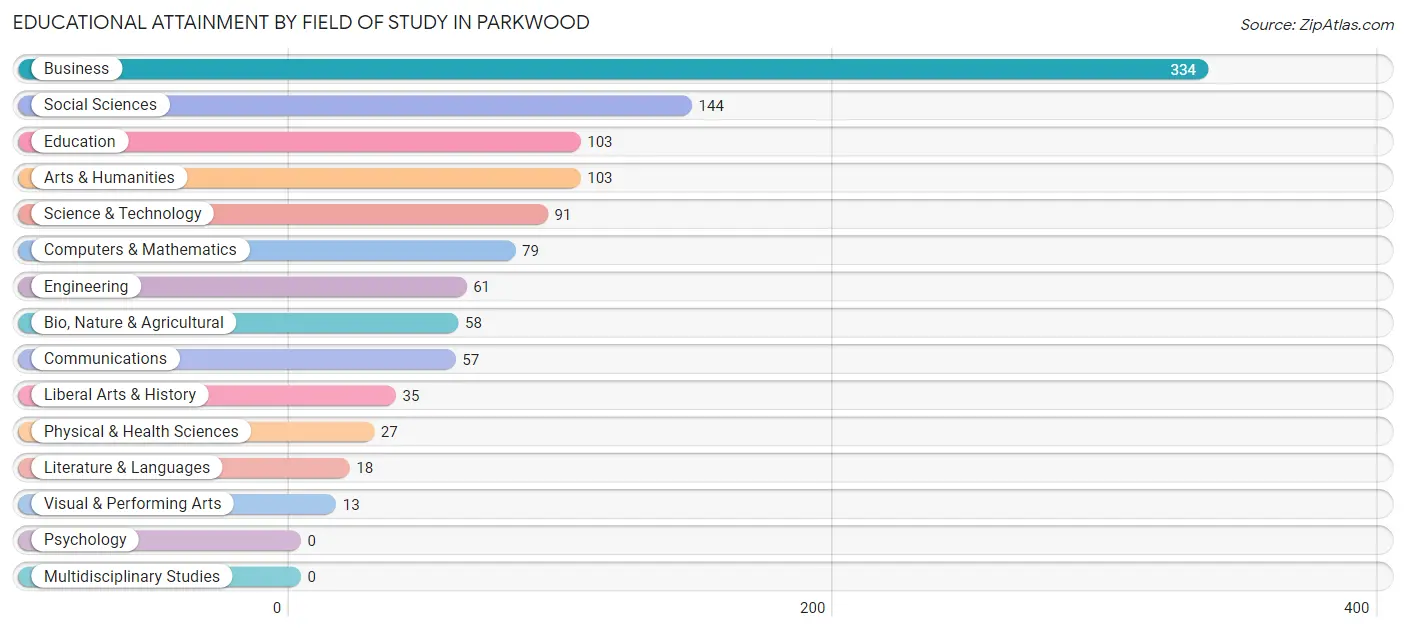
| Field of Study | # Graduates | % Graduates |
| Computers & Mathematics | 79 | 7.0% |
| Bio, Nature & Agricultural | 58 | 5.2% |
| Physical & Health Sciences | 27 | 2.4% |
| Psychology | 0 | 0.0% |
| Social Sciences | 144 | 12.8% |
| Engineering | 61 | 5.4% |
| Multidisciplinary Studies | 0 | 0.0% |
| Science & Technology | 91 | 8.1% |
| Business | 334 | 29.7% |
| Education | 103 | 9.2% |
| Literature & Languages | 18 | 1.6% |
| Liberal Arts & History | 35 | 3.1% |
| Visual & Performing Arts | 13 | 1.2% |
| Communications | 57 | 5.1% |
| Arts & Humanities | 103 | 9.2% |
| Total | 1,123 | 100.0% |
Transportation & Commute in Parkwood
Vehicle Availability by Sex in Parkwood
The most prevalent vehicle ownership categories in Parkwood are males with 3 vehicles (743, accounting for 35.9%) and females with 3 vehicles (593, making up 47.3%).
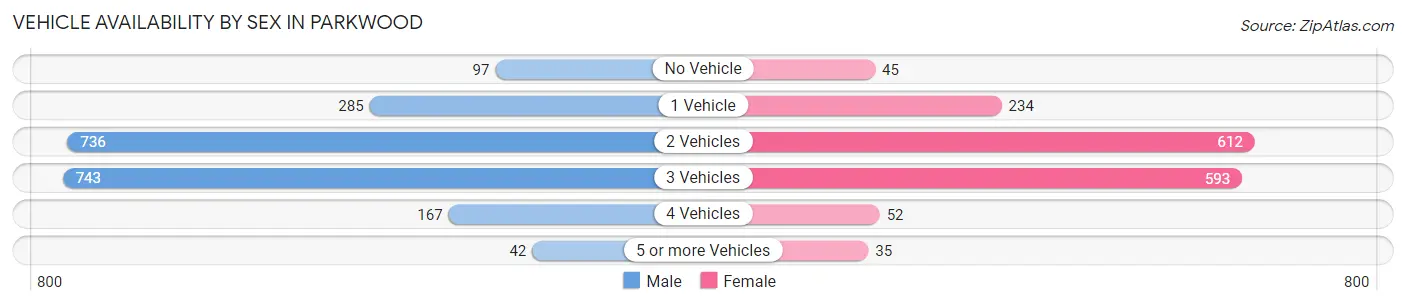
| Vehicles Available | Male | Female |
| No Vehicle | 97 (4.7%) | 45 (2.9%) |
| 1 Vehicle | 285 (13.8%) | 234 (14.9%) |
| 2 Vehicles | 736 (35.6%) | 612 (39.0%) |
| 3 Vehicles | 743 (35.9%) | 593 (37.8%) |
| 4 Vehicles | 167 (8.1%) | 52 (3.3%) |
| 5 or more Vehicles | 42 (2.0%) | 35 (2.2%) |
| Total | 2,070 (100.0%) | 1,571 (100.0%) |
Commute Time in Parkwood
The most frequently occuring commute durations in Parkwood are 5 to 9 minutes (580 commuters, 16.6%), 30 to 34 minutes (481 commuters, 13.8%), and 10 to 14 minutes (427 commuters, 12.2%).
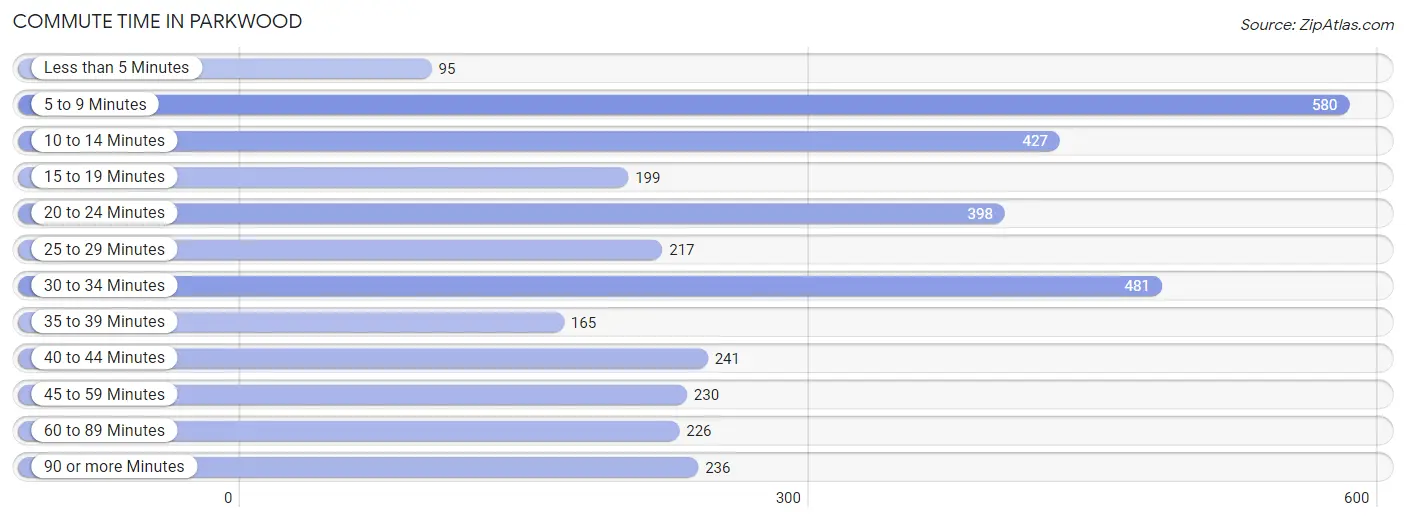
| Commute Time | # Commuters | % Commuters |
| Less than 5 Minutes | 95 | 2.7% |
| 5 to 9 Minutes | 580 | 16.6% |
| 10 to 14 Minutes | 427 | 12.2% |
| 15 to 19 Minutes | 199 | 5.7% |
| 20 to 24 Minutes | 398 | 11.4% |
| 25 to 29 Minutes | 217 | 6.2% |
| 30 to 34 Minutes | 481 | 13.8% |
| 35 to 39 Minutes | 165 | 4.7% |
| 40 to 44 Minutes | 241 | 6.9% |
| 45 to 59 Minutes | 230 | 6.6% |
| 60 to 89 Minutes | 226 | 6.5% |
| 90 or more Minutes | 236 | 6.8% |
Commute Time by Sex in Parkwood
The most common commute times in Parkwood are 30 to 34 minutes (375 commuters, 18.6%) for males and 5 to 9 minutes (292 commuters, 19.8%) for females.
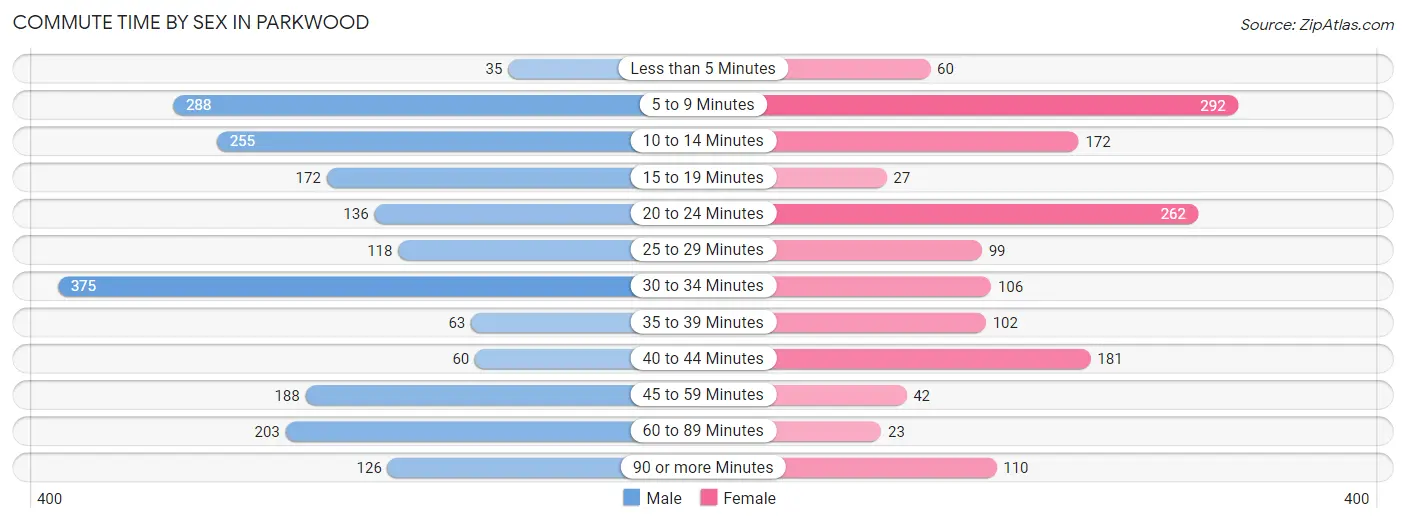
| Commute Time | Male | Female |
| Less than 5 Minutes | 35 (1.7%) | 60 (4.1%) |
| 5 to 9 Minutes | 288 (14.3%) | 292 (19.8%) |
| 10 to 14 Minutes | 255 (12.6%) | 172 (11.7%) |
| 15 to 19 Minutes | 172 (8.5%) | 27 (1.8%) |
| 20 to 24 Minutes | 136 (6.7%) | 262 (17.7%) |
| 25 to 29 Minutes | 118 (5.8%) | 99 (6.7%) |
| 30 to 34 Minutes | 375 (18.6%) | 106 (7.2%) |
| 35 to 39 Minutes | 63 (3.1%) | 102 (6.9%) |
| 40 to 44 Minutes | 60 (3.0%) | 181 (12.3%) |
| 45 to 59 Minutes | 188 (9.3%) | 42 (2.9%) |
| 60 to 89 Minutes | 203 (10.1%) | 23 (1.6%) |
| 90 or more Minutes | 126 (6.2%) | 110 (7.4%) |
Time of Departure to Work by Sex in Parkwood
The most frequent times of departure to work in Parkwood are 5:00 AM to 5:29 AM (337, 16.7%) for males and 7:00 AM to 7:29 AM (309, 20.9%) for females.
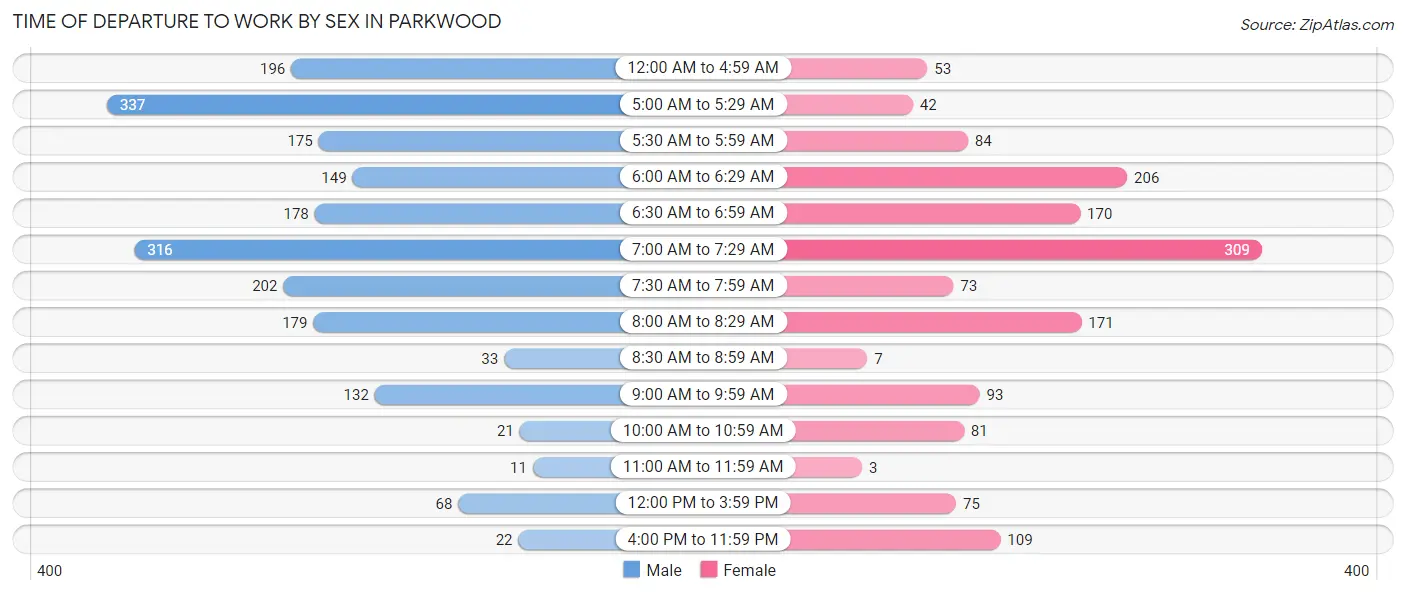
| Time of Departure | Male | Female |
| 12:00 AM to 4:59 AM | 196 (9.7%) | 53 (3.6%) |
| 5:00 AM to 5:29 AM | 337 (16.7%) | 42 (2.9%) |
| 5:30 AM to 5:59 AM | 175 (8.7%) | 84 (5.7%) |
| 6:00 AM to 6:29 AM | 149 (7.4%) | 206 (14.0%) |
| 6:30 AM to 6:59 AM | 178 (8.8%) | 170 (11.5%) |
| 7:00 AM to 7:29 AM | 316 (15.7%) | 309 (20.9%) |
| 7:30 AM to 7:59 AM | 202 (10.0%) | 73 (5.0%) |
| 8:00 AM to 8:29 AM | 179 (8.9%) | 171 (11.6%) |
| 8:30 AM to 8:59 AM | 33 (1.6%) | 7 (0.5%) |
| 9:00 AM to 9:59 AM | 132 (6.5%) | 93 (6.3%) |
| 10:00 AM to 10:59 AM | 21 (1.0%) | 81 (5.5%) |
| 11:00 AM to 11:59 AM | 11 (0.5%) | 3 (0.2%) |
| 12:00 PM to 3:59 PM | 68 (3.4%) | 75 (5.1%) |
| 4:00 PM to 11:59 PM | 22 (1.1%) | 109 (7.4%) |
| Total | 2,019 (100.0%) | 1,476 (100.0%) |
Housing Occupancy in Parkwood
Occupancy by Ownership in Parkwood
Of the total 2,844 dwellings in Parkwood, owner-occupied units account for 1,832 (64.4%), while renter-occupied units make up 1,012 (35.6%).
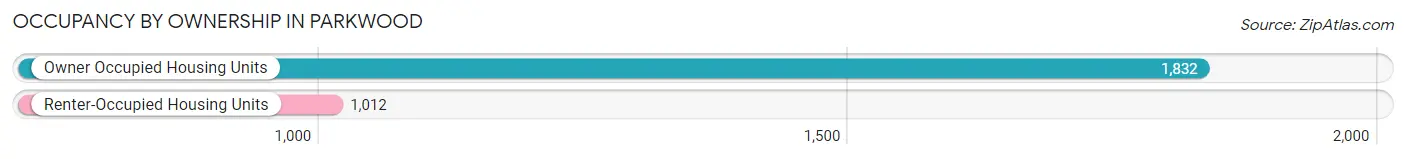
| Occupancy | # Housing Units | % Housing Units |
| Owner Occupied Housing Units | 1,832 | 64.4% |
| Renter-Occupied Housing Units | 1,012 | 35.6% |
| Total Occupied Housing Units | 2,844 | 100.0% |
Occupancy by Household Size in Parkwood
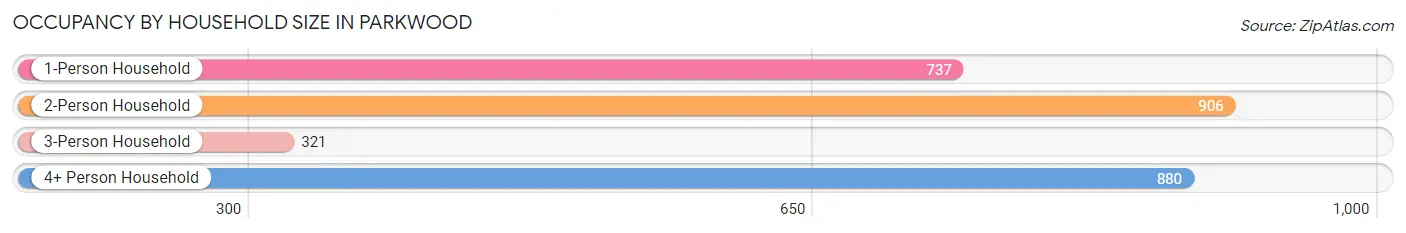
| Household Size | # Housing Units | % Housing Units |
| 1-Person Household | 737 | 25.9% |
| 2-Person Household | 906 | 31.9% |
| 3-Person Household | 321 | 11.3% |
| 4+ Person Household | 880 | 30.9% |
| Total Housing Units | 2,844 | 100.0% |
Occupancy by Ownership by Household Size in Parkwood
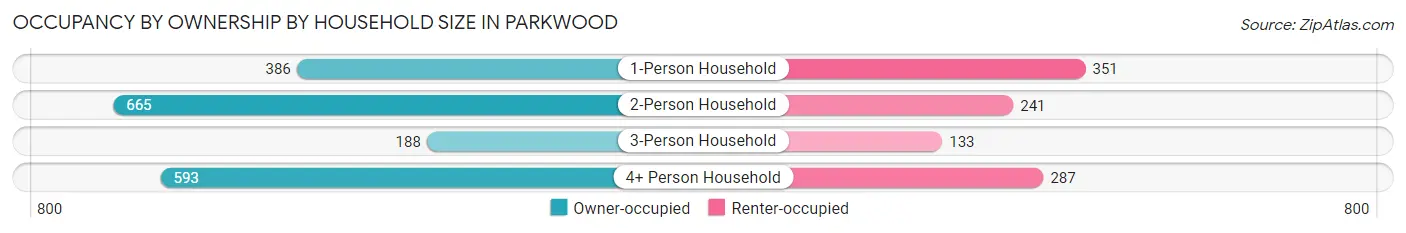
| Household Size | Owner-occupied | Renter-occupied |
| 1-Person Household | 386 (52.4%) | 351 (47.6%) |
| 2-Person Household | 665 (73.4%) | 241 (26.6%) |
| 3-Person Household | 188 (58.6%) | 133 (41.4%) |
| 4+ Person Household | 593 (67.4%) | 287 (32.6%) |
| Total Housing Units | 1,832 (64.4%) | 1,012 (35.6%) |
Occupancy by Educational Attainment in Parkwood
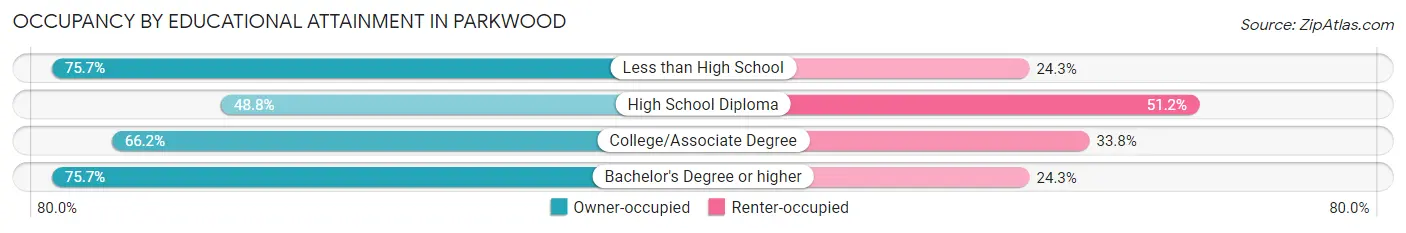
| Household Size | Owner-occupied | Renter-occupied |
| Less than High School | 84 (75.7%) | 27 (24.3%) |
| High School Diploma | 331 (48.8%) | 347 (51.2%) |
| College/Associate Degree | 960 (66.2%) | 491 (33.8%) |
| Bachelor's Degree or higher | 457 (75.7%) | 147 (24.3%) |
Occupancy by Age of Householder in Parkwood
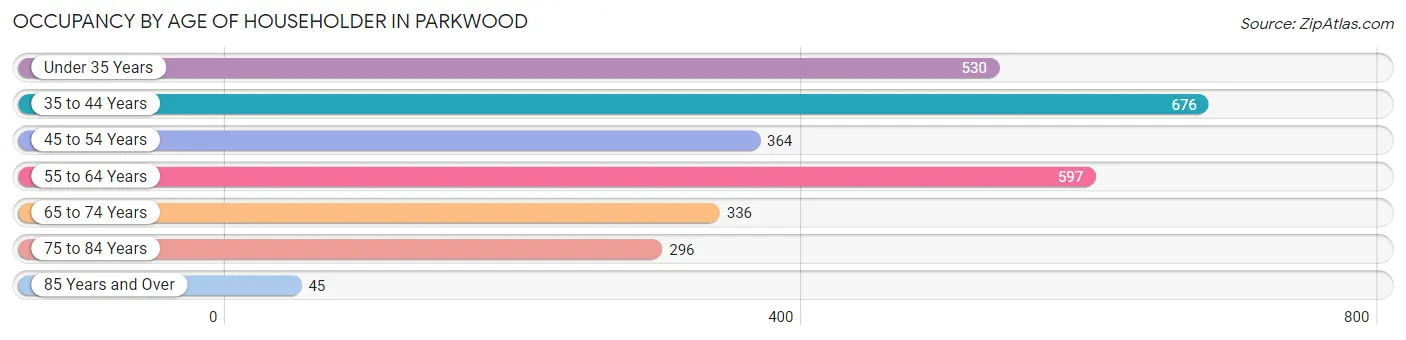
| Age Bracket | # Households | % Households |
| Under 35 Years | 530 | 18.6% |
| 35 to 44 Years | 676 | 23.8% |
| 45 to 54 Years | 364 | 12.8% |
| 55 to 64 Years | 597 | 21.0% |
| 65 to 74 Years | 336 | 11.8% |
| 75 to 84 Years | 296 | 10.4% |
| 85 Years and Over | 45 | 1.6% |
| Total | 2,844 | 100.0% |
Housing Finances in Parkwood
Median Income by Occupancy in Parkwood
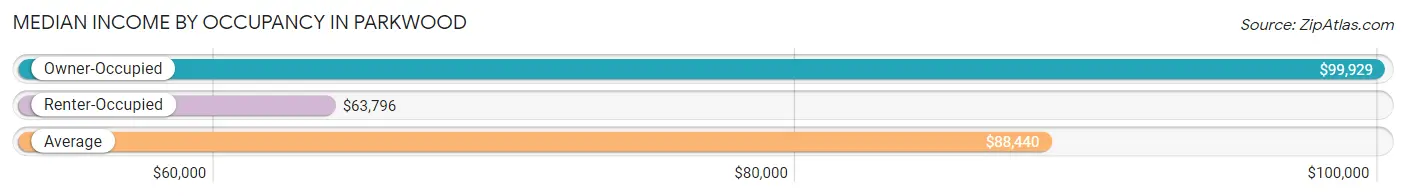
| Occupancy Type | # Households | Median Income |
| Owner-Occupied | 1,832 (64.4%) | $99,929 |
| Renter-Occupied | 1,012 (35.6%) | $63,796 |
| Average | 2,844 (100.0%) | $88,440 |
Occupancy by Householder Income Bracket in Parkwood
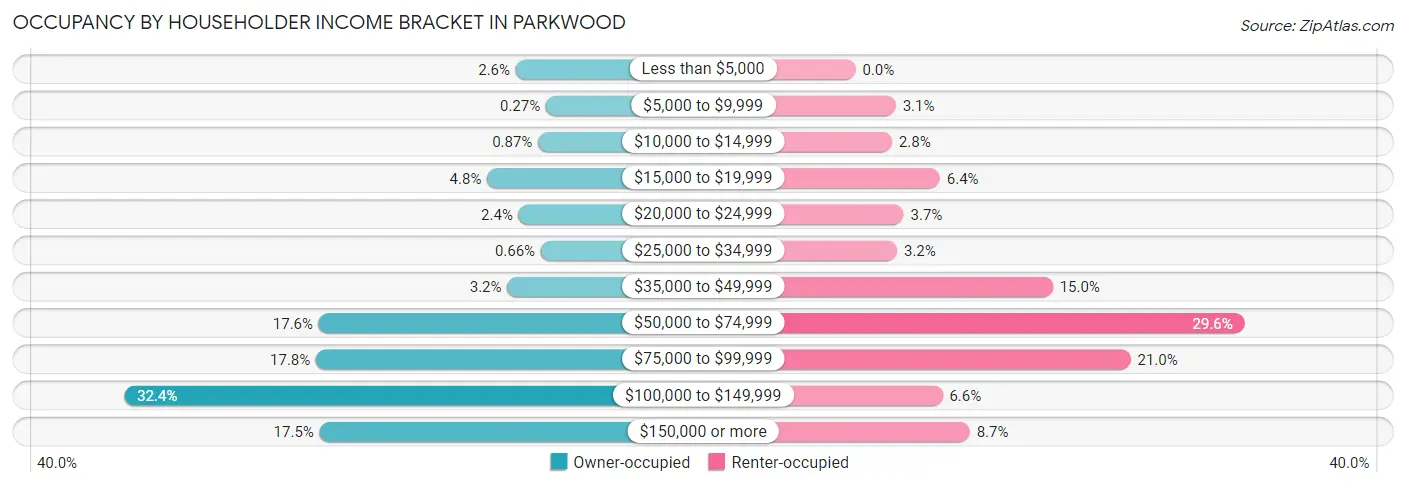
| Income Bracket | Owner-occupied | Renter-occupied |
| Less than $5,000 | 47 (2.6%) | 0 (0.0%) |
| $5,000 to $9,999 | 5 (0.3%) | 31 (3.1%) |
| $10,000 to $14,999 | 16 (0.9%) | 28 (2.8%) |
| $15,000 to $19,999 | 87 (4.8%) | 65 (6.4%) |
| $20,000 to $24,999 | 43 (2.4%) | 37 (3.7%) |
| $25,000 to $34,999 | 12 (0.7%) | 32 (3.2%) |
| $35,000 to $49,999 | 59 (3.2%) | 152 (15.0%) |
| $50,000 to $74,999 | 322 (17.6%) | 300 (29.6%) |
| $75,000 to $99,999 | 326 (17.8%) | 212 (20.9%) |
| $100,000 to $149,999 | 594 (32.4%) | 67 (6.6%) |
| $150,000 or more | 321 (17.5%) | 88 (8.7%) |
| Total | 1,832 (100.0%) | 1,012 (100.0%) |
Monthly Housing Cost Tiers in Parkwood
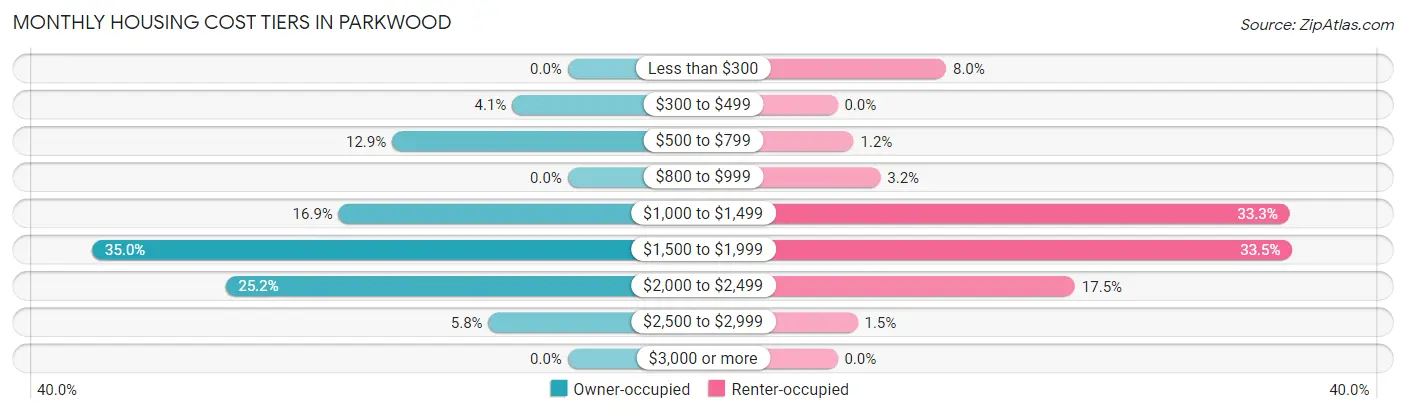
| Monthly Cost | Owner-occupied | Renter-occupied |
| Less than $300 | 0 (0.0%) | 81 (8.0%) |
| $300 to $499 | 75 (4.1%) | 0 (0.0%) |
| $500 to $799 | 237 (12.9%) | 12 (1.2%) |
| $800 to $999 | 0 (0.0%) | 32 (3.2%) |
| $1,000 to $1,499 | 309 (16.9%) | 337 (33.3%) |
| $1,500 to $1,999 | 642 (35.0%) | 339 (33.5%) |
| $2,000 to $2,499 | 462 (25.2%) | 177 (17.5%) |
| $2,500 to $2,999 | 107 (5.8%) | 15 (1.5%) |
| $3,000 or more | 0 (0.0%) | 0 (0.0%) |
| Total | 1,832 (100.0%) | 1,012 (100.0%) |
Physical Housing Characteristics in Parkwood
Housing Structures in Parkwood
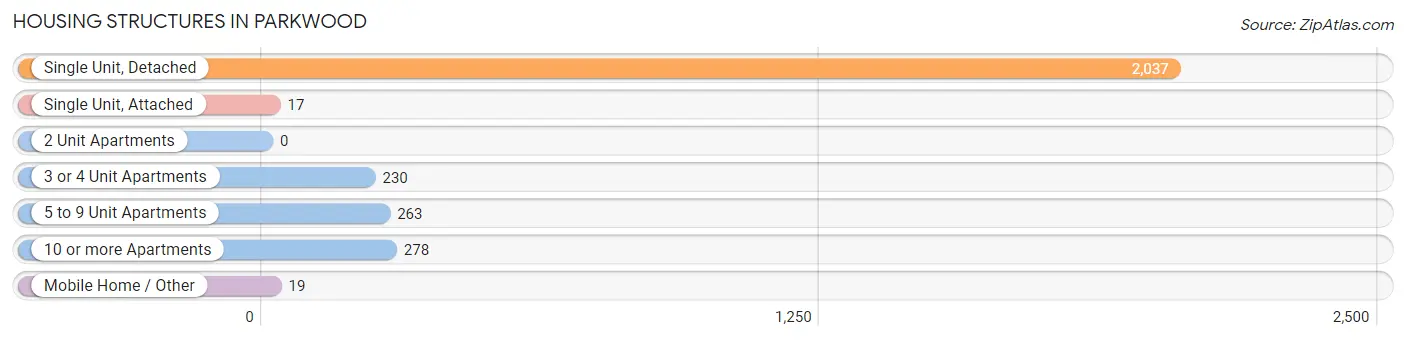
| Structure Type | # Housing Units | % Housing Units |
| Single Unit, Detached | 2,037 | 71.6% |
| Single Unit, Attached | 17 | 0.6% |
| 2 Unit Apartments | 0 | 0.0% |
| 3 or 4 Unit Apartments | 230 | 8.1% |
| 5 to 9 Unit Apartments | 263 | 9.2% |
| 10 or more Apartments | 278 | 9.8% |
| Mobile Home / Other | 19 | 0.7% |
| Total | 2,844 | 100.0% |
Housing Structures by Occupancy in Parkwood
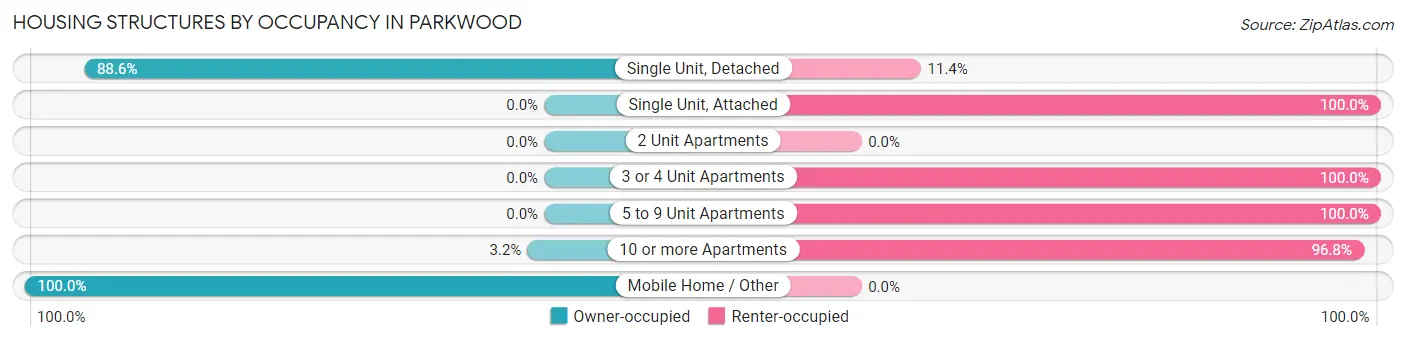
| Structure Type | Owner-occupied | Renter-occupied |
| Single Unit, Detached | 1,804 (88.6%) | 233 (11.4%) |
| Single Unit, Attached | 0 (0.0%) | 17 (100.0%) |
| 2 Unit Apartments | 0 (0.0%) | 0 (0.0%) |
| 3 or 4 Unit Apartments | 0 (0.0%) | 230 (100.0%) |
| 5 to 9 Unit Apartments | 0 (0.0%) | 263 (100.0%) |
| 10 or more Apartments | 9 (3.2%) | 269 (96.8%) |
| Mobile Home / Other | 19 (100.0%) | 0 (0.0%) |
| Total | 1,832 (64.4%) | 1,012 (35.6%) |
Housing Structures by Number of Rooms in Parkwood
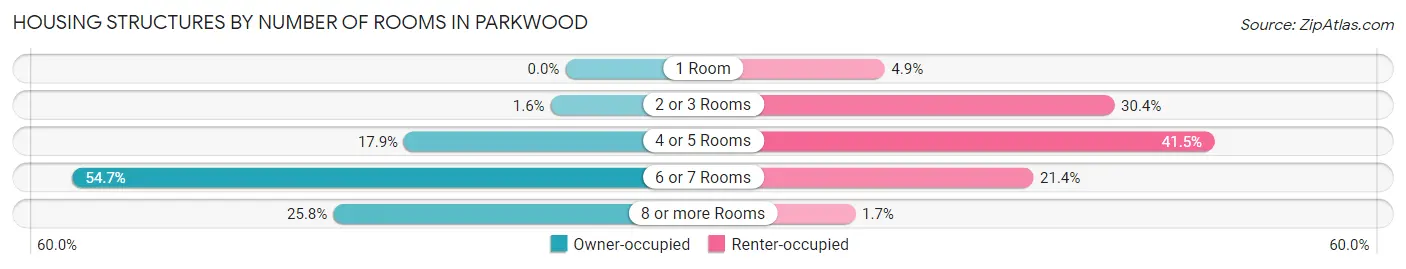
| Number of Rooms | Owner-occupied | Renter-occupied |
| 1 Room | 0 (0.0%) | 50 (4.9%) |
| 2 or 3 Rooms | 30 (1.6%) | 308 (30.4%) |
| 4 or 5 Rooms | 328 (17.9%) | 420 (41.5%) |
| 6 or 7 Rooms | 1,002 (54.7%) | 217 (21.4%) |
| 8 or more Rooms | 472 (25.8%) | 17 (1.7%) |
| Total | 1,832 (100.0%) | 1,012 (100.0%) |
Housing Structure by Heating Type in Parkwood
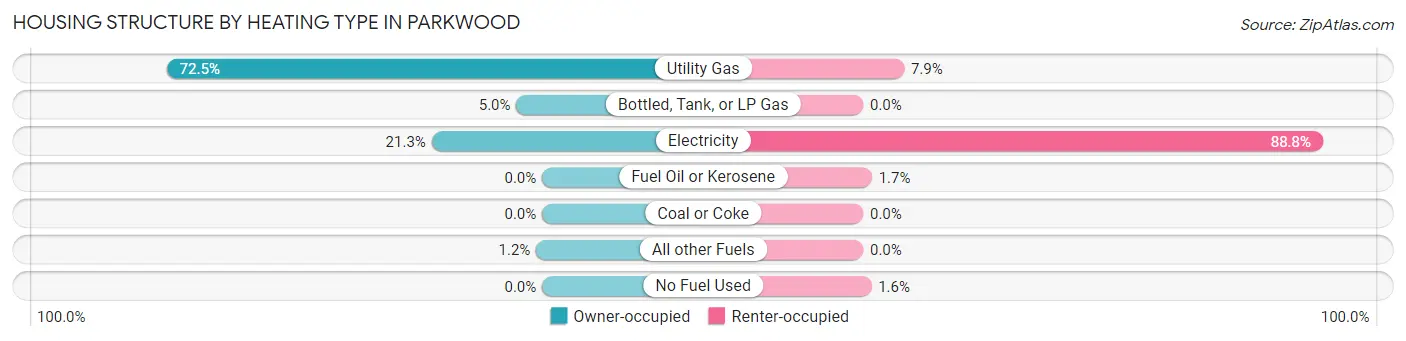
| Heating Type | Owner-occupied | Renter-occupied |
| Utility Gas | 1,329 (72.5%) | 80 (7.9%) |
| Bottled, Tank, or LP Gas | 91 (5.0%) | 0 (0.0%) |
| Electricity | 391 (21.3%) | 899 (88.8%) |
| Fuel Oil or Kerosene | 0 (0.0%) | 17 (1.7%) |
| Coal or Coke | 0 (0.0%) | 0 (0.0%) |
| All other Fuels | 21 (1.1%) | 0 (0.0%) |
| No Fuel Used | 0 (0.0%) | 16 (1.6%) |
| Total | 1,832 (100.0%) | 1,012 (100.0%) |
Household Vehicle Usage in Parkwood
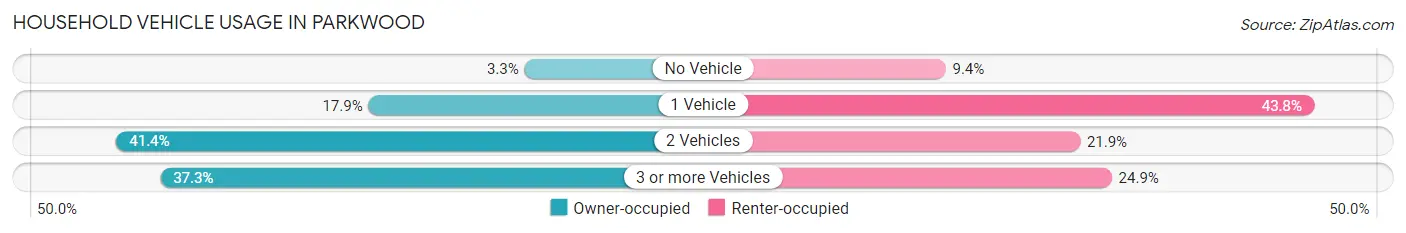
| Vehicles per Household | Owner-occupied | Renter-occupied |
| No Vehicle | 61 (3.3%) | 95 (9.4%) |
| 1 Vehicle | 328 (17.9%) | 443 (43.8%) |
| 2 Vehicles | 759 (41.4%) | 222 (21.9%) |
| 3 or more Vehicles | 684 (37.3%) | 252 (24.9%) |
| Total | 1,832 (100.0%) | 1,012 (100.0%) |
Real Estate & Mortgages in Parkwood
Real Estate and Mortgage Overview in Parkwood
| Characteristic | Without Mortgage | With Mortgage |
| Housing Units | 294 | 1,538 |
| Median Property Value | $376,700 | $384,600 |
| Median Household Income | $78,214 | $298 |
| Monthly Housing Costs | $561 | $0 |
| Real Estate Taxes | $3,360 | $36 |
Property Value by Mortgage Status in Parkwood
| Property Value | Without Mortgage | With Mortgage |
| Less than $50,000 | 0 (0.0%) | 0 (0.0%) |
| $50,000 to $99,999 | 0 (0.0%) | 0 (0.0%) |
| $100,000 to $299,999 | 55 (18.7%) | 331 (21.5%) |
| $300,000 to $499,999 | 213 (72.5%) | 1,074 (69.8%) |
| $500,000 to $749,999 | 26 (8.8%) | 124 (8.1%) |
| $750,000 to $999,999 | 0 (0.0%) | 0 (0.0%) |
| $1,000,000 or more | 0 (0.0%) | 9 (0.6%) |
| Total | 294 (100.0%) | 1,538 (100.0%) |
Household Income by Mortgage Status in Parkwood
| Household Income | Without Mortgage | With Mortgage |
| Less than $10,000 | 5 (1.7%) | 14 (0.9%) |
| $10,000 to $24,999 | 23 (7.8%) | 47 (3.1%) |
| $25,000 to $34,999 | 12 (4.1%) | 123 (8.0%) |
| $35,000 to $49,999 | 28 (9.5%) | 0 (0.0%) |
| $50,000 to $74,999 | 75 (25.5%) | 31 (2.0%) |
| $75,000 to $99,999 | 95 (32.3%) | 247 (16.1%) |
| $100,000 to $149,999 | 33 (11.2%) | 231 (15.0%) |
| $150,000 or more | 23 (7.8%) | 561 (36.5%) |
| Total | 294 (100.0%) | 1,538 (100.0%) |
Property Value to Household Income Ratio in Parkwood
| Value-to-Income Ratio | Without Mortgage | With Mortgage |
| Less than 2.0x | 14 (4.8%) | 106,324 (6,913.1%) |
| 2.0x to 2.9x | 23 (7.8%) | 165 (10.7%) |
| 3.0x to 3.9x | 34 (11.6%) | 317 (20.6%) |
| 4.0x or more | 223 (75.8%) | 446 (29.0%) |
| Total | 294 (100.0%) | 1,538 (100.0%) |
Real Estate Taxes by Mortgage Status in Parkwood
| Property Taxes | Without Mortgage | With Mortgage |
| Less than $800 | 0 (0.0%) | 0 (0.0%) |
| $800 to $1,499 | 0 (0.0%) | 70 (4.5%) |
| $800 to $1,499 | 294 (100.0%) | 40 (2.6%) |
| Total | 294 (100.0%) | 1,538 (100.0%) |
Health & Disability in Parkwood
Health Insurance Coverage by Age in Parkwood
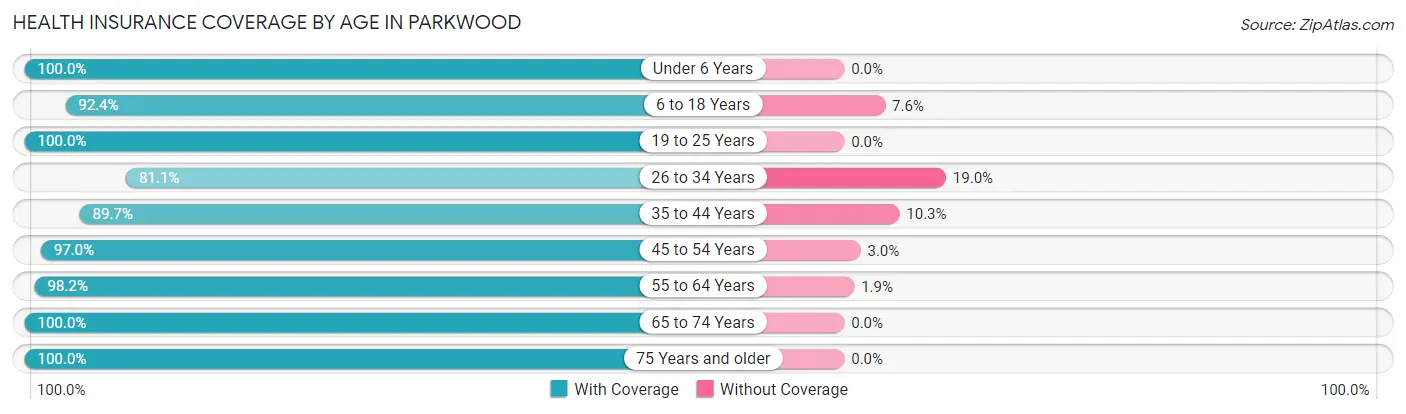
| Age Bracket | With Coverage | Without Coverage |
| Under 6 Years | 397 (100.0%) | 0 (0.0%) |
| 6 to 18 Years | 1,227 (92.4%) | 101 (7.6%) |
| 19 to 25 Years | 365 (100.0%) | 0 (0.0%) |
| 26 to 34 Years | 663 (81.0%) | 155 (19.0%) |
| 35 to 44 Years | 1,127 (89.7%) | 129 (10.3%) |
| 45 to 54 Years | 577 (97.0%) | 18 (3.0%) |
| 55 to 64 Years | 1,114 (98.2%) | 21 (1.8%) |
| 65 to 74 Years | 565 (100.0%) | 0 (0.0%) |
| 75 Years and older | 559 (100.0%) | 0 (0.0%) |
| Total | 6,594 (94.0%) | 424 (6.0%) |
Health Insurance Coverage by Citizenship Status in Parkwood
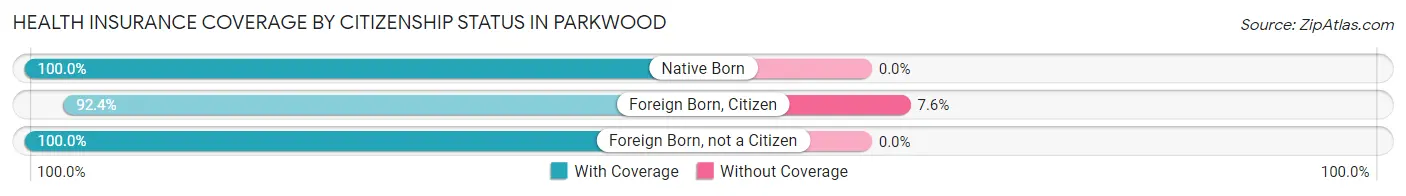
| Citizenship Status | With Coverage | Without Coverage |
| Native Born | 397 (100.0%) | 0 (0.0%) |
| Foreign Born, Citizen | 1,227 (92.4%) | 101 (7.6%) |
| Foreign Born, not a Citizen | 365 (100.0%) | 0 (0.0%) |
Health Insurance Coverage by Household Income in Parkwood
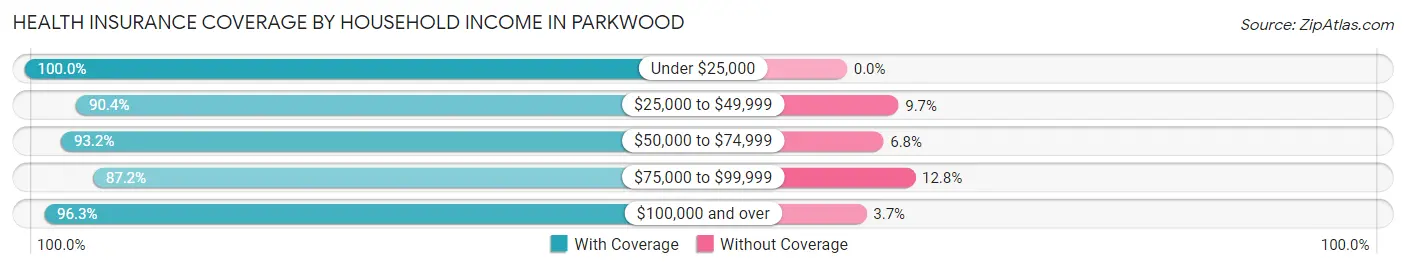
| Household Income | With Coverage | Without Coverage |
| Under $25,000 | 604 (100.0%) | 0 (0.0%) |
| $25,000 to $49,999 | 487 (90.3%) | 52 (9.7%) |
| $50,000 to $74,999 | 1,131 (93.2%) | 83 (6.8%) |
| $75,000 to $99,999 | 1,132 (87.2%) | 166 (12.8%) |
| $100,000 and over | 3,229 (96.3%) | 123 (3.7%) |
Public vs Private Health Insurance Coverage by Age in Parkwood
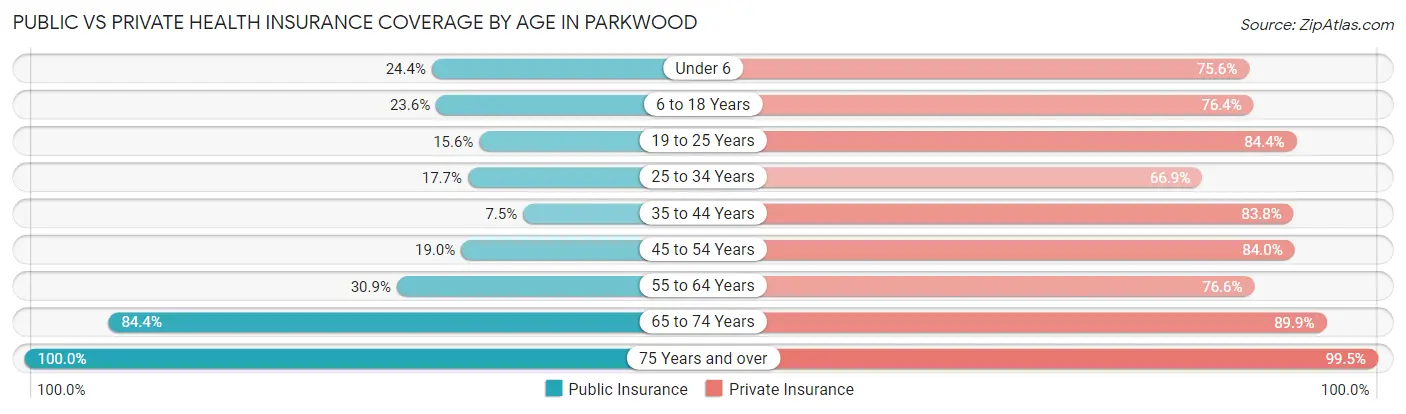
| Age Bracket | Public Insurance | Private Insurance |
| Under 6 | 97 (24.4%) | 300 (75.6%) |
| 6 to 18 Years | 314 (23.6%) | 1,015 (76.4%) |
| 19 to 25 Years | 57 (15.6%) | 308 (84.4%) |
| 25 to 34 Years | 145 (17.7%) | 547 (66.9%) |
| 35 to 44 Years | 94 (7.5%) | 1,053 (83.8%) |
| 45 to 54 Years | 113 (19.0%) | 500 (84.0%) |
| 55 to 64 Years | 351 (30.9%) | 869 (76.6%) |
| 65 to 74 Years | 477 (84.4%) | 508 (89.9%) |
| 75 Years and over | 559 (100.0%) | 556 (99.5%) |
| Total | 2,207 (31.5%) | 5,656 (80.6%) |
Disability Status by Sex by Age in Parkwood
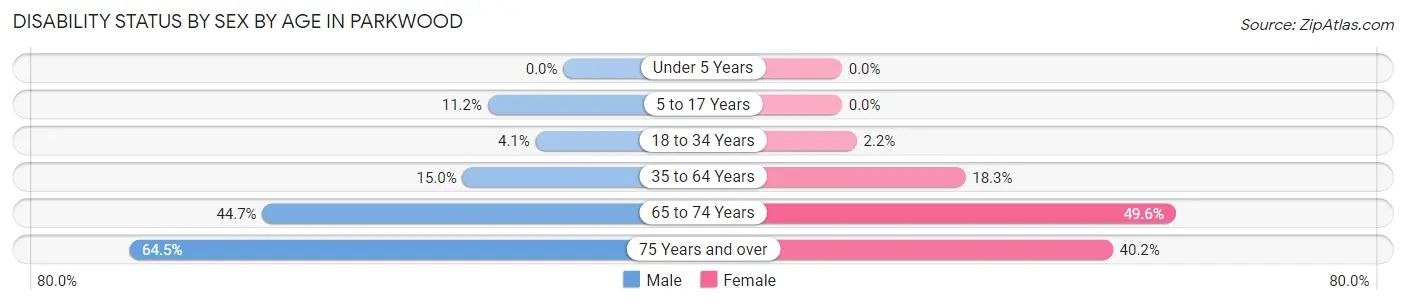
| Age Bracket | Male | Female |
| Under 5 Years | 0 (0.0%) | 0 (0.0%) |
| 5 to 17 Years | 68 (11.2%) | 0 (0.0%) |
| 18 to 34 Years | 21 (4.1%) | 16 (2.2%) |
| 35 to 64 Years | 230 (15.0%) | 266 (18.3%) |
| 65 to 74 Years | 147 (44.7%) | 117 (49.6%) |
| 75 Years and over | 176 (64.5%) | 115 (40.2%) |
Disability Class by Sex by Age in Parkwood
Disability Class: Hearing Difficulty
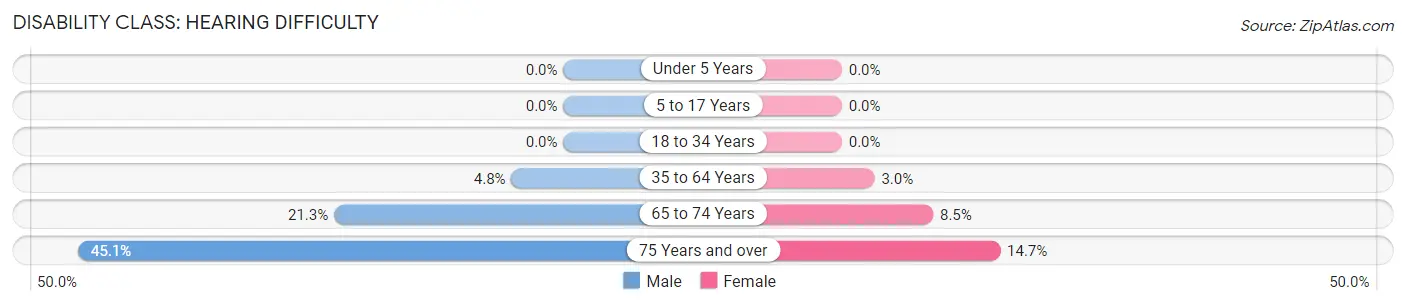
| Age Bracket | Male | Female |
| Under 5 Years | 0 (0.0%) | 0 (0.0%) |
| 5 to 17 Years | 0 (0.0%) | 0 (0.0%) |
| 18 to 34 Years | 0 (0.0%) | 0 (0.0%) |
| 35 to 64 Years | 74 (4.8%) | 44 (3.0%) |
| 65 to 74 Years | 70 (21.3%) | 20 (8.5%) |
| 75 Years and over | 123 (45.1%) | 42 (14.7%) |
Disability Class: Vision Difficulty
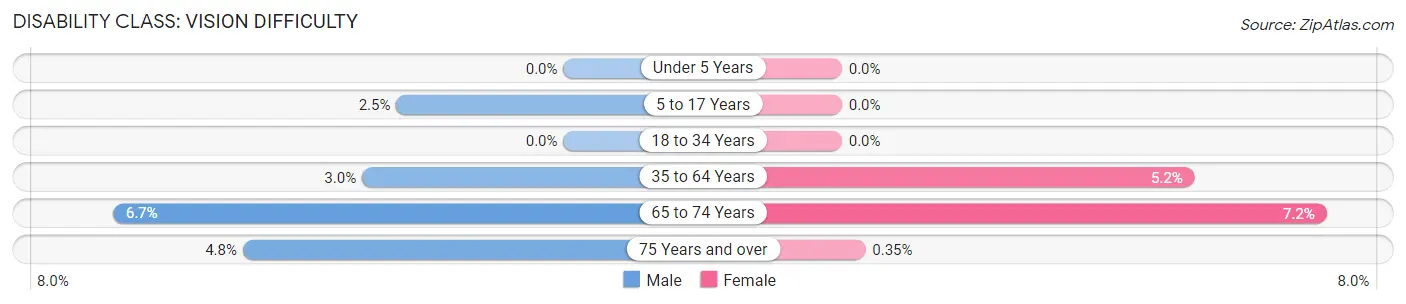
| Age Bracket | Male | Female |
| Under 5 Years | 0 (0.0%) | 0 (0.0%) |
| 5 to 17 Years | 15 (2.5%) | 0 (0.0%) |
| 18 to 34 Years | 0 (0.0%) | 0 (0.0%) |
| 35 to 64 Years | 46 (3.0%) | 76 (5.2%) |
| 65 to 74 Years | 22 (6.7%) | 17 (7.2%) |
| 75 Years and over | 13 (4.8%) | 1 (0.4%) |
Disability Class: Cognitive Difficulty
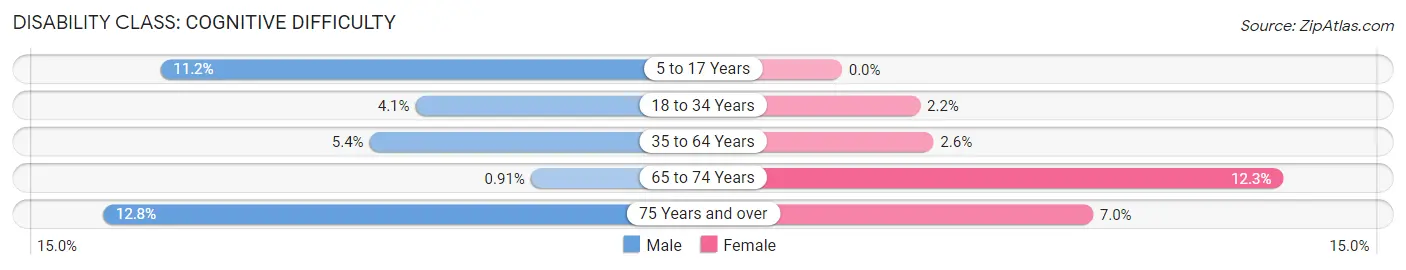
| Age Bracket | Male | Female |
| 5 to 17 Years | 68 (11.2%) | 0 (0.0%) |
| 18 to 34 Years | 21 (4.1%) | 16 (2.2%) |
| 35 to 64 Years | 83 (5.4%) | 37 (2.5%) |
| 65 to 74 Years | 3 (0.9%) | 29 (12.3%) |
| 75 Years and over | 35 (12.8%) | 20 (7.0%) |
Disability Class: Ambulatory Difficulty
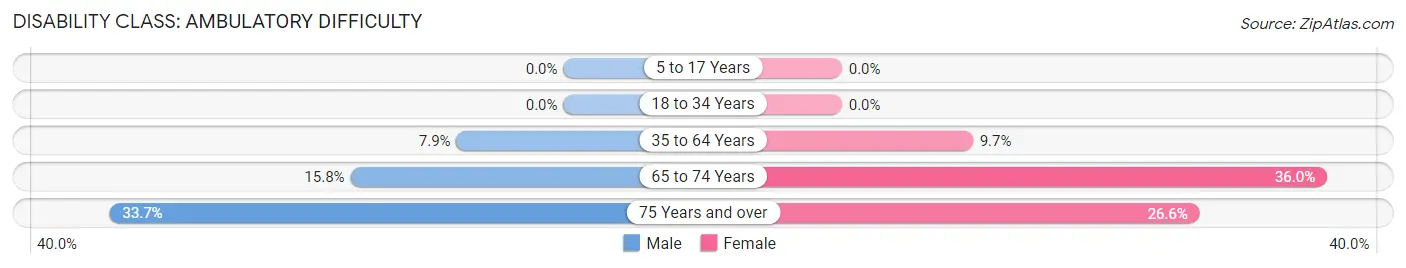
| Age Bracket | Male | Female |
| 5 to 17 Years | 0 (0.0%) | 0 (0.0%) |
| 18 to 34 Years | 0 (0.0%) | 0 (0.0%) |
| 35 to 64 Years | 122 (7.9%) | 141 (9.7%) |
| 65 to 74 Years | 52 (15.8%) | 85 (36.0%) |
| 75 Years and over | 92 (33.7%) | 76 (26.6%) |
Disability Class: Self-Care Difficulty
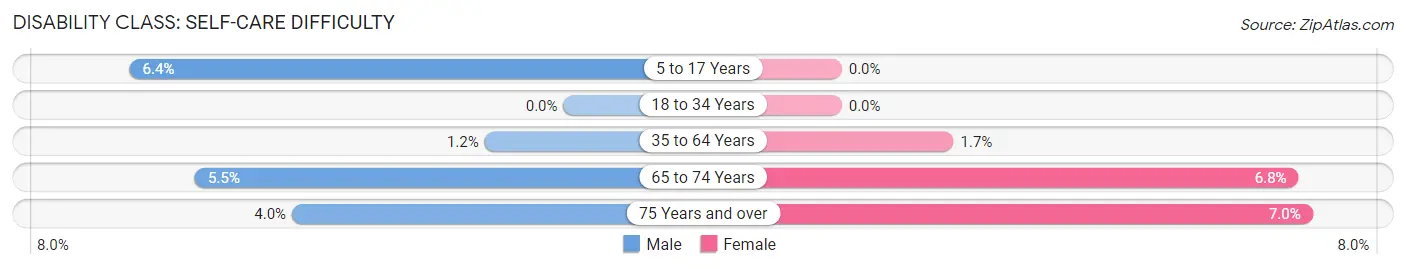
| Age Bracket | Male | Female |
| 5 to 17 Years | 39 (6.4%) | 0 (0.0%) |
| 18 to 34 Years | 0 (0.0%) | 0 (0.0%) |
| 35 to 64 Years | 18 (1.2%) | 24 (1.7%) |
| 65 to 74 Years | 18 (5.5%) | 16 (6.8%) |
| 75 Years and over | 11 (4.0%) | 20 (7.0%) |
Technology Access in Parkwood
Computing Device Access in Parkwood
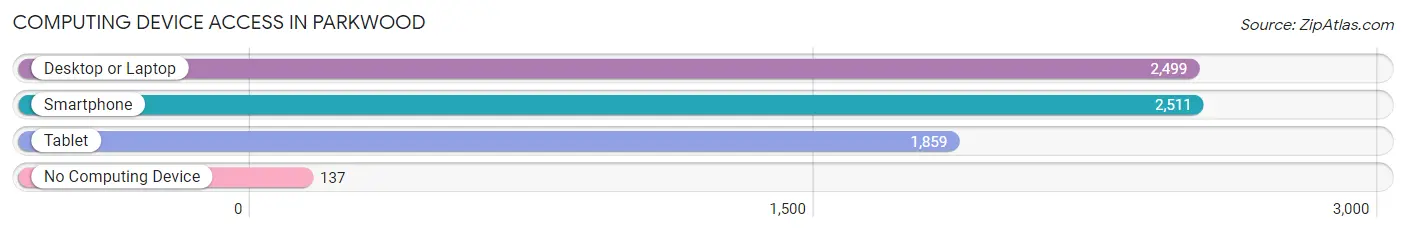
| Device Type | # Households | % Households |
| Desktop or Laptop | 2,499 | 87.9% |
| Smartphone | 2,511 | 88.3% |
| Tablet | 1,859 | 65.4% |
| No Computing Device | 137 | 4.8% |
| Total | 2,844 | 100.0% |
Internet Access in Parkwood
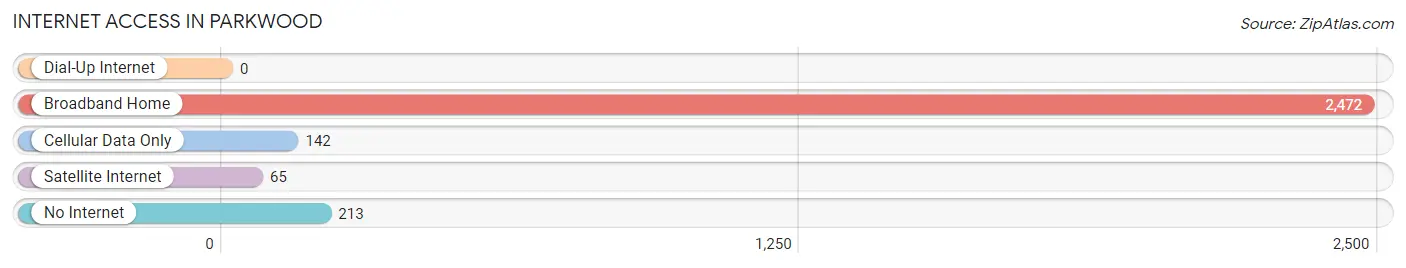
| Internet Type | # Households | % Households |
| Dial-Up Internet | 0 | 0.0% |
| Broadband Home | 2,472 | 86.9% |
| Cellular Data Only | 142 | 5.0% |
| Satellite Internet | 65 | 2.3% |
| No Internet | 213 | 7.5% |
| Total | 2,844 | 100.0% |
Parkwood Summary
Parkwood is a small suburb located in the City of Rockingham, Western Australia. It is situated approximately 40 kilometres south of the Perth CBD and is bordered by the suburbs of Waikiki, Warnbro, Safety Bay and Rockingham. Parkwood is a relatively new suburb, having been established in the late 1980s.
History
Parkwood was originally part of the larger suburb of Waikiki, which was established in the late 1950s. In the late 1980s, the area was subdivided and the suburb of Parkwood was created. The suburb was named after the nearby Parkwood Primary School, which had been established in the area in the early 1970s.
The suburb was initially developed as a residential area, with the majority of the homes being single-storey dwellings. In the late 1990s, the area began to experience rapid growth, with the construction of a number of new housing developments. This growth has continued into the 21st century, with the suburb now home to a variety of housing styles, including townhouses, duplexes and apartments.
Geography
Parkwood is located in the City of Rockingham, approximately 40 kilometres south of the Perth CBD. The suburb is bordered by the suburbs of Waikiki, Warnbro, Safety Bay and Rockingham.
The suburb is situated on the western side of the Rockingham coastline, with the Indian Ocean to the west and the Rockingham foreshore to the east. The suburb is relatively flat, with the highest point being just over 20 metres above sea level.
The suburb is home to a number of parks and reserves, including Parkwood Reserve, which is located in the centre of the suburb. The reserve features a playground, picnic facilities and a basketball court.
Economy
Parkwood is primarily a residential suburb, with the majority of the population employed in the service and retail sectors. The suburb is home to a number of small businesses, including cafes, restaurants, hairdressers and other retail outlets.
The suburb is also home to a number of industrial businesses, including a number of manufacturing and engineering companies. The suburb is also home to a number of warehouses and distribution centres.
Demographics
As of the 2016 census, the population of Parkwood was 4,845. The median age of the population was 37 years, with the majority of the population aged between 25 and 44 years. The suburb has a relatively diverse population, with the majority of residents born in Australia (68.3%), followed by England (7.2%), New Zealand (3.2%) and India (2.7%).
The majority of households in Parkwood are owner-occupied (71.2%), with the remainder being rented (28.8%). The median household income is $1,541 per week, which is slightly higher than the national average of $1,438 per week.
Conclusion
Parkwood is a relatively new suburb located in the City of Rockingham, Western Australia. The suburb was established in the late 1980s and has experienced rapid growth in recent years. The suburb is primarily residential, with the majority of the population employed in the service and retail sectors. The suburb has a diverse population, with the majority of residents born in Australia. The median household income is slightly higher than the national average.
Common Questions
What is Per Capita Income in Parkwood?
Per Capita income in Parkwood is $38,386.
What is the Median Family Income in Parkwood?
Median Family Income in Parkwood is $91,881.
What is the Median Household income in Parkwood?
Median Household Income in Parkwood is $88,440.
What is Income or Wage Gap in Parkwood?
Income or Wage Gap in Parkwood is 41.2%.
Women in Parkwood earn 58.8 cents for every dollar earned by a man.
What is Inequality or Gini Index in Parkwood?
Inequality or Gini Index in Parkwood is 0.36.
What is the Total Population of Parkwood?
Total Population of Parkwood is 7,303.
What is the Total Male Population of Parkwood?
Total Male Population of Parkwood is 3,679.
What is the Total Female Population of Parkwood?
Total Female Population of Parkwood is 3,624.
What is the Ratio of Males per 100 Females in Parkwood?
There are 101.52 Males per 100 Females in Parkwood.
What is the Ratio of Females per 100 Males in Parkwood?
There are 98.51 Females per 100 Males in Parkwood.
What is the Median Population Age in Parkwood?
Median Population Age in Parkwood is 39.3 Years.
What is the Average Family Size in Parkwood
Average Family Size in Parkwood is 3.1 People.
What is the Average Household Size in Parkwood
Average Household Size in Parkwood is 2.6 People.
How Large is the Labor Force in Parkwood?
There are 3,787 People in the Labor Forcein in Parkwood.
What is the Percentage of People in the Labor Force in Parkwood?
65.4% of People are in the Labor Force in Parkwood.
What is the Unemployment Rate in Parkwood?
Unemployment Rate in Parkwood is 1.3%.