Cities with the Lowest Poverty Level Among Children Under the Age of 5 in Utah
RELATED REPORTS & OPTIONS
Lowest Poverty | Child 0-5
Utah
Compare Cities
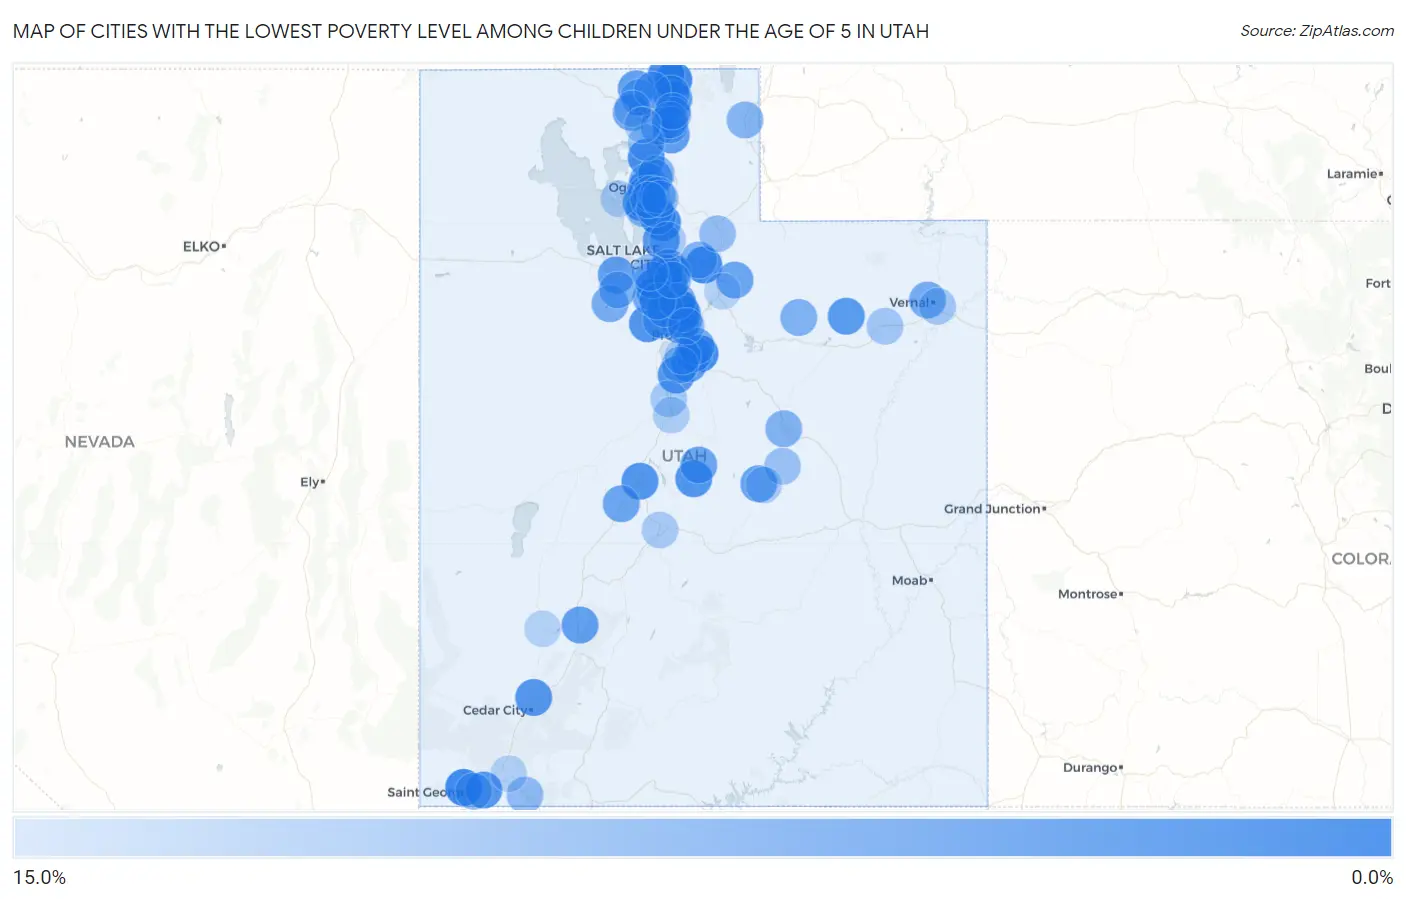
Map of Cities with the Lowest Poverty Level Among Children Under the Age of 5 in Utah
15.0%
0.0%
Cities with the Lowest Poverty Level Among Children Under the Age of 5 in Utah
| City | Child Poverty | vs State | vs National | |
| 1. | Highland | 0.33% | 10.0%(-9.66)#1 | 18.1%(-17.7)#7 |
| 2. | Santa Clara | 1.3% | 10.0%(-8.69)#2 | 18.1%(-16.8)#159 |
| 3. | Richmond | 1.4% | 10.0%(-8.55)#3 | 18.1%(-16.6)#187 |
| 4. | Farmington | 1.6% | 10.0%(-8.39)#4 | 18.1%(-16.5)#225 |
| 5. | Mapleton | 1.7% | 10.0%(-8.32)#5 | 18.1%(-16.4)#246 |
| 6. | West Haven | 1.7% | 10.0%(-8.25)#6 | 18.1%(-16.3)#263 |
| 7. | Snyderville | 1.8% | 10.0%(-8.23)#7 | 18.1%(-16.3)#274 |
| 8. | Draper | 1.9% | 10.0%(-8.12)#8 | 18.1%(-16.2)#300 |
| 9. | Cedar Hills | 2.0% | 10.0%(-8.01)#9 | 18.1%(-16.1)#336 |
| 10. | West Point | 2.1% | 10.0%(-7.93)#10 | 18.1%(-16.0)#363 |
| 11. | Lewiston | 2.2% | 10.0%(-7.75)#11 | 18.1%(-15.8)#418 |
| 12. | South Jordan | 2.5% | 10.0%(-7.50)#12 | 18.1%(-15.6)#501 |
| 13. | Willard | 2.7% | 10.0%(-7.26)#13 | 18.1%(-15.3)#588 |
| 14. | Eagle Mountain | 3.0% | 10.0%(-7.01)#14 | 18.1%(-15.1)#702 |
| 15. | Manti | 3.2% | 10.0%(-6.82)#15 | 18.1%(-14.9)#772 |
| 16. | Scipio | 3.2% | 10.0%(-6.76)#16 | 18.1%(-14.8)#803 |
| 17. | Santaquin | 3.2% | 10.0%(-6.75)#17 | 18.1%(-14.8)#804 |
| 18. | Washington | 3.6% | 10.0%(-6.43)#18 | 18.1%(-14.5)#937 |
| 19. | Sandy | 3.6% | 10.0%(-6.40)#19 | 18.1%(-14.5)#952 |
| 20. | Enoch | 3.6% | 10.0%(-6.37)#20 | 18.1%(-14.4)#961 |
| 21. | Hyde Park | 3.7% | 10.0%(-6.25)#21 | 18.1%(-14.3)#1,024 |
| 22. | Woods Cross | 3.9% | 10.0%(-6.06)#22 | 18.1%(-14.1)#1,103 |
| 23. | Altamont | 4.1% | 10.0%(-5.91)#23 | 18.1%(-14.0)#1,158 |
| 24. | Kaysville | 4.3% | 10.0%(-5.65)#24 | 18.1%(-13.7)#1,263 |
| 25. | Paradise | 4.7% | 10.0%(-5.30)#25 | 18.1%(-13.4)#1,417 |
| 26. | American Fork | 4.8% | 10.0%(-5.20)#26 | 18.1%(-13.3)#1,480 |
| 27. | Beaver | 4.8% | 10.0%(-5.14)#27 | 18.1%(-13.2)#1,506 |
| 28. | Plymouth | 4.9% | 10.0%(-5.11)#28 | 18.1%(-13.2)#1,522 |
| 29. | Stansbury Park | 5.1% | 10.0%(-4.93)#29 | 18.1%(-13.0)#1,595 |
| 30. | Salem | 5.1% | 10.0%(-4.93)#30 | 18.1%(-13.0)#1,597 |
| 31. | Harrisville | 5.3% | 10.0%(-4.69)#31 | 18.1%(-12.8)#1,708 |
| 32. | Vineyard | 5.4% | 10.0%(-4.54)#32 | 18.1%(-12.6)#1,763 |
| 33. | Millcreek | 5.5% | 10.0%(-4.46)#33 | 18.1%(-12.5)#1,794 |
| 34. | Orangeville | 5.6% | 10.0%(-4.43)#34 | 18.1%(-12.5)#1,801 |
| 35. | Spanish Fork | 5.6% | 10.0%(-4.42)#35 | 18.1%(-12.5)#1,821 |
| 36. | Clinton | 5.6% | 10.0%(-4.42)#36 | 18.1%(-12.5)#1,822 |
| 37. | Midvale | 5.7% | 10.0%(-4.33)#37 | 18.1%(-12.4)#1,858 |
| 38. | Holladay | 5.9% | 10.0%(-4.13)#38 | 18.1%(-12.2)#1,925 |
| 39. | Smithfield | 5.9% | 10.0%(-4.05)#39 | 18.1%(-12.1)#1,966 |
| 40. | Ephraim | 6.0% | 10.0%(-4.03)#40 | 18.1%(-12.1)#1,970 |
| 41. | Holden | 6.0% | 10.0%(-3.99)#41 | 18.1%(-12.1)#1,986 |
| 42. | Francis | 6.2% | 10.0%(-3.83)#42 | 18.1%(-11.9)#2,043 |
| 43. | Herriman | 6.2% | 10.0%(-3.82)#43 | 18.1%(-11.9)#2,051 |
| 44. | Tremonton | 6.2% | 10.0%(-3.80)#44 | 18.1%(-11.9)#2,057 |
| 45. | Lindon | 6.3% | 10.0%(-3.68)#45 | 18.1%(-11.8)#2,126 |
| 46. | Providence | 6.8% | 10.0%(-3.20)#46 | 18.1%(-11.3)#2,323 |
| 47. | Wellsville | 6.8% | 10.0%(-3.15)#47 | 18.1%(-11.2)#2,346 |
| 48. | Murray | 6.9% | 10.0%(-3.08)#48 | 18.1%(-11.2)#2,386 |
| 49. | Springville | 7.0% | 10.0%(-3.02)#49 | 18.1%(-11.1)#2,405 |
| 50. | Pleasant Grove | 7.1% | 10.0%(-2.87)#50 | 18.1%(-10.9)#2,467 |
| 51. | Maeser | 7.2% | 10.0%(-2.81)#51 | 18.1%(-10.9)#2,507 |
| 52. | Saratoga Springs | 7.2% | 10.0%(-2.76)#52 | 18.1%(-10.8)#2,520 |
| 53. | Riverton | 7.3% | 10.0%(-2.67)#53 | 18.1%(-10.7)#2,552 |
| 54. | Lehi | 7.4% | 10.0%(-2.59)#54 | 18.1%(-10.7)#2,593 |
| 55. | Stockton | 7.4% | 10.0%(-2.58)#55 | 18.1%(-10.7)#2,596 |
| 56. | Alpine | 7.4% | 10.0%(-2.57)#56 | 18.1%(-10.6)#2,608 |
| 57. | Marriott Slaterville | 7.6% | 10.0%(-2.43)#57 | 18.1%(-10.5)#2,653 |
| 58. | Tooele | 8.0% | 10.0%(-2.01)#58 | 18.1%(-10.1)#2,818 |
| 59. | Tabiona | 8.0% | 10.0%(-1.99)#59 | 18.1%(-10.1)#2,837 |
| 60. | Roy | 8.1% | 10.0%(-1.88)#60 | 18.1%(-9.96)#2,868 |
| 61. | Summit Park | 8.3% | 10.0%(-1.73)#61 | 18.1%(-9.80)#2,926 |
| 62. | West Wood | 8.4% | 10.0%(-1.55)#62 | 18.1%(-9.63)#3,010 |
| 63. | West Jordan | 8.7% | 10.0%(-1.33)#63 | 18.1%(-9.40)#3,111 |
| 64. | Randolph | 8.8% | 10.0%(-1.19)#64 | 18.1%(-9.26)#3,171 |
| 65. | Bluffdale | 8.9% | 10.0%(-1.06)#65 | 18.1%(-9.13)#3,226 |
| 66. | Cottonwood Heights | 9.2% | 10.0%(-0.743)#66 | 18.1%(-8.82)#3,372 |
| 67. | North Ogden | 9.3% | 10.0%(-0.727)#67 | 18.1%(-8.80)#3,379 |
| 68. | Hyrum | 9.3% | 10.0%(-0.722)#68 | 18.1%(-8.80)#3,380 |
| 69. | Payson | 9.3% | 10.0%(-0.721)#69 | 18.1%(-8.80)#3,382 |
| 70. | Syracuse | 9.3% | 10.0%(-0.681)#70 | 18.1%(-8.76)#3,395 |
| 71. | Fielding | 9.5% | 10.0%(-0.506)#71 | 18.1%(-8.58)#3,450 |
| 72. | Newton | 9.6% | 10.0%(-0.373)#72 | 18.1%(-8.45)#3,514 |
| 73. | St George | 9.7% | 10.0%(-0.287)#73 | 18.1%(-8.36)#3,545 |
| 74. | Nibley | 9.7% | 10.0%(-0.249)#74 | 18.1%(-8.32)#3,557 |
| 75. | Apple Valley | 10.0% | 10.0%(+0.012)#75 | 18.1%(-8.06)#3,638 |
| 76. | Layton | 10.1% | 10.0%(+0.064)#76 | 18.1%(-8.01)#3,686 |
| 77. | Riverdale | 10.1% | 10.0%(+0.101)#77 | 18.1%(-7.97)#3,698 |
| 78. | Kearns | 10.3% | 10.0%(+0.319)#78 | 18.1%(-7.76)#3,778 |
| 79. | South Ogden | 10.3% | 10.0%(+0.337)#79 | 18.1%(-7.74)#3,785 |
| 80. | Orem | 10.4% | 10.0%(+0.379)#80 | 18.1%(-7.70)#3,798 |
| 81. | Coalville | 10.4% | 10.0%(+0.428)#81 | 18.1%(-7.65)#3,813 |
| 82. | Uintah | 10.4% | 10.0%(+0.459)#82 | 18.1%(-7.62)#3,830 |
| 83. | Brigham City | 11.0% | 10.0%(+0.987)#83 | 18.1%(-7.09)#4,031 |
| 84. | Cleveland | 11.1% | 10.0%(+1.12)#84 | 18.1%(-6.95)#4,110 |
| 85. | River Heights | 11.6% | 10.0%(+1.61)#85 | 18.1%(-6.47)#4,297 |
| 86. | Ballard | 11.9% | 10.0%(+1.88)#86 | 18.1%(-6.20)#4,403 |
| 87. | Naples | 12.1% | 10.0%(+2.10)#87 | 18.1%(-5.97)#4,488 |
| 88. | Mona | 12.2% | 10.0%(+2.23)#88 | 18.1%(-5.85)#4,525 |
| 89. | Aurora | 12.7% | 10.0%(+2.74)#89 | 18.1%(-5.34)#4,725 |
| 90. | Bountiful | 12.8% | 10.0%(+2.78)#90 | 18.1%(-5.29)#4,749 |
| 91. | Garland | 12.8% | 10.0%(+2.82)#91 | 18.1%(-5.25)#4,763 |
| 92. | Hooper | 13.0% | 10.0%(+2.97)#92 | 18.1%(-5.10)#4,824 |
| 93. | Sunset | 13.1% | 10.0%(+3.07)#93 | 18.1%(-5.00)#4,860 |
| 94. | Nephi | 13.2% | 10.0%(+3.23)#94 | 18.1%(-4.85)#4,915 |
| 95. | Castle Dale | 13.2% | 10.0%(+3.25)#95 | 18.1%(-4.83)#4,920 |
| 96. | Honeyville | 13.3% | 10.0%(+3.35)#96 | 18.1%(-4.73)#4,947 |
| 97. | La Verkin | 13.6% | 10.0%(+3.62)#97 | 18.1%(-4.46)#5,050 |
| 98. | Heber | 13.8% | 10.0%(+3.85)#98 | 18.1%(-4.23)#5,149 |
| 99. | Minersville | 13.8% | 10.0%(+3.86)#99 | 18.1%(-4.22)#5,153 |
| 100. | Benjamin | 14.0% | 10.0%(+4.05)#100 | 18.1%(-4.03)#5,232 |
Common Questions
What are the Top 10 Cities with the Lowest Poverty Level Among Children Under the Age of 5 in Utah?
Top 10 Cities with the Lowest Poverty Level Among Children Under the Age of 5 in Utah are:
#1
0.33%
#2
1.3%
#3
1.4%
#4
1.6%
#5
1.7%
#6
1.7%
#7
1.8%
#8
1.9%
#9
2.0%
#10
2.1%
What city has the Lowest Poverty Level Among Children Under the Age of 5 in Utah?
Highland has the Lowest Poverty Level Among Children Under the Age of 5 in Utah with 0.33%.
What is the Poverty Level Among Children Under the Age of 5 in the State of Utah?
Poverty Level Among Children Under the Age of 5 in Utah is 10.0%.
What is the Poverty Level Among Children Under the Age of 5 in the United States?
Poverty Level Among Children Under the Age of 5 in the United States is 18.1%.