Cities with the Highest Percentage of Hispanic or Latino Population in Minnesota
RELATED REPORTS & OPTIONS
Hispanic or Latino
Minnesota
Compare Cities
Map of Cities with the Highest Percentage of Hispanic or Latino Population in Minnesota
0.0%
60.0%
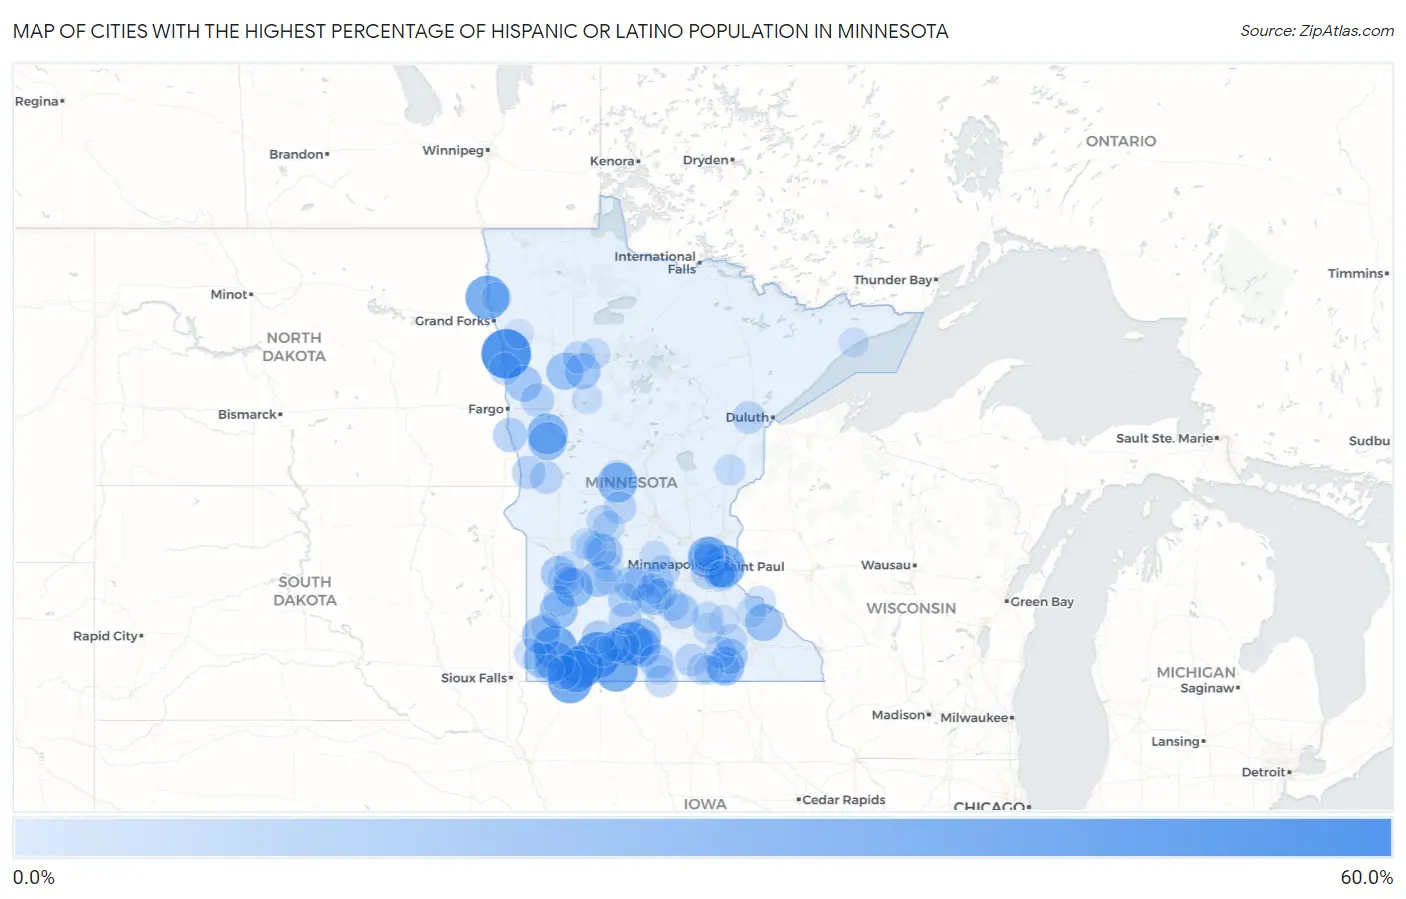
Cities with the Highest Percentage of Hispanic or Latino Population in Minnesota
| City | Hispanic or Latino | vs State | vs National | |
| 1. | Nielsville | 59.1% | 5.7%(+53.3)#1 | 18.7%(+40.4)#1,578 |
| 2. | Wilder | 50.0% | 5.7%(+44.3)#2 | 18.7%(+31.3)#1,953 |
| 3. | Bigelow | 45.6% | 5.7%(+39.9)#3 | 18.7%(+26.9)#2,174 |
| 4. | Oslo | 45.0% | 5.7%(+39.2)#4 | 18.7%(+26.3)#2,211 |
| 5. | St James | 43.9% | 5.7%(+38.2)#5 | 18.7%(+25.2)#2,280 |
| 6. | Chandler | 43.2% | 5.7%(+37.4)#6 | 18.7%(+24.5)#2,312 |
| 7. | Alpha | 43.0% | 5.7%(+37.2)#7 | 18.7%(+24.3)#2,329 |
| 8. | Brewster | 42.2% | 5.7%(+36.4)#8 | 18.7%(+23.5)#2,384 |
| 9. | Landfall | 41.7% | 5.7%(+36.0)#9 | 18.7%(+23.1)#2,402 |
| 10. | Worthington | 41.0% | 5.7%(+35.2)#10 | 18.7%(+22.3)#2,443 |
| 11. | Hilltop | 40.3% | 5.7%(+34.6)#11 | 18.7%(+21.6)#2,491 |
| 12. | Pelican Rapids | 36.2% | 5.7%(+30.4)#12 | 18.7%(+17.5)#2,788 |
| 13. | Lismore | 36.0% | 5.7%(+30.2)#13 | 18.7%(+17.3)#2,811 |
| 14. | Long Prairie | 34.7% | 5.7%(+29.0)#14 | 18.7%(+16.1)#2,908 |
| 15. | Mapleview | 31.9% | 5.7%(+26.2)#15 | 18.7%(+13.2)#3,184 |
| 16. | Lewisville | 31.9% | 5.7%(+26.1)#16 | 18.7%(+13.2)#3,186 |
| 17. | Hanley Falls | 31.7% | 5.7%(+25.9)#17 | 18.7%(+13.0)#3,206 |
| 18. | Holland | 30.7% | 5.7%(+24.9)#18 | 18.7%(+12.0)#3,320 |
| 19. | Erhard | 30.6% | 5.7%(+24.8)#19 | 18.7%(+11.9)#3,332 |
| 20. | Lynd | 29.6% | 5.7%(+23.9)#20 | 18.7%(+10.9)#3,446 |
| 21. | Madelia | 29.0% | 5.7%(+23.3)#21 | 18.7%(+10.3)#3,509 |
| 22. | Midway | 28.1% | 5.7%(+22.4)#22 | 18.7%(+9.47)#3,615 |
| 23. | Millville | 28.0% | 5.7%(+22.3)#23 | 18.7%(+9.36)#3,630 |
| 24. | Butterfield | 26.0% | 5.7%(+20.3)#24 | 18.7%(+7.34)#3,892 |
| 25. | South End | 25.6% | 5.7%(+19.9)#25 | 18.7%(+6.99)#3,932 |
| 26. | Renville | 25.5% | 5.7%(+19.7)#26 | 18.7%(+6.83)#3,960 |
| 27. | Borup | 25.3% | 5.7%(+19.6)#27 | 18.7%(+6.67)#3,974 |
| 28. | Gaylord | 24.6% | 5.7%(+18.8)#28 | 18.7%(+5.94)#4,076 |
| 29. | Hardwick | 24.6% | 5.7%(+18.8)#29 | 18.7%(+5.91)#4,084 |
| 30. | Boyd | 24.1% | 5.7%(+18.3)#30 | 18.7%(+5.41)#4,174 |
| 31. | Willmar | 23.9% | 5.7%(+18.1)#31 | 18.7%(+5.22)#4,214 |
| 32. | Le Center | 22.9% | 5.7%(+17.2)#32 | 18.7%(+4.25)#4,376 |
| 33. | Waltham | 22.8% | 5.7%(+17.1)#33 | 18.7%(+4.15)#4,399 |
| 34. | Buffalo Lake | 21.8% | 5.7%(+16.1)#34 | 18.7%(+3.18)#4,567 |
| 35. | Wolverton | 21.3% | 5.7%(+15.5)#35 | 18.7%(+2.62)#4,685 |
| 36. | Rushmore | 21.1% | 5.7%(+15.3)#36 | 18.7%(+2.42)#4,725 |
| 37. | Winnebago | 21.0% | 5.7%(+15.2)#37 | 18.7%(+2.31)#4,755 |
| 38. | Stewart | 20.4% | 5.7%(+14.7)#38 | 18.7%(+1.75)#4,875 |
| 39. | Jeffers | 20.4% | 5.7%(+14.6)#39 | 18.7%(+1.72)#4,879 |
| 40. | West St Paul | 20.4% | 5.7%(+14.6)#40 | 18.7%(+1.71)#4,883 |
| 41. | Fairfax | 20.3% | 5.7%(+14.5)#41 | 18.7%(+1.62)#4,899 |
| 42. | Pennock | 19.8% | 5.7%(+14.1)#42 | 18.7%(+1.15)#5,006 |
| 43. | Hitterdal | 19.5% | 5.7%(+13.8)#43 | 18.7%(+0.845)#5,094 |
| 44. | Campbell | 18.8% | 5.7%(+13.0)#44 | 18.7%(+0.133)#5,231 |
| 45. | Richfield | 18.6% | 5.7%(+12.9)#45 | 18.7%(-0.029)#5,269 |
| 46. | Wendell | 17.8% | 5.7%(+12.1)#46 | 18.7%(-0.814)#5,486 |
| 47. | Sleepy Eye | 17.7% | 5.7%(+12.0)#47 | 18.7%(-0.952)#5,532 |
| 48. | Le Sueur | 17.6% | 5.7%(+11.9)#48 | 18.7%(-1.00)#5,542 |
| 49. | Melrose | 17.6% | 5.7%(+11.8)#49 | 18.7%(-1.10)#5,566 |
| 50. | Austin | 17.4% | 5.7%(+11.7)#50 | 18.7%(-1.21)#5,595 |
| 51. | Mahnomen | 17.4% | 5.7%(+11.6)#51 | 18.7%(-1.28)#5,619 |
| 52. | Freeborn | 17.1% | 5.7%(+11.4)#52 | 18.7%(-1.55)#5,704 |
| 53. | Elmore | 16.7% | 5.7%(+11.0)#53 | 18.7%(-1.91)#5,801 |
| 54. | Lester Prairie | 16.7% | 5.7%(+11.0)#54 | 18.7%(-1.92)#5,802 |
| 55. | Halstad | 16.7% | 5.7%(+11.0)#55 | 18.7%(-1.93)#5,808 |
| 56. | South St Paul | 16.5% | 5.7%(+10.8)#56 | 18.7%(-2.15)#5,868 |
| 57. | Ebro | 16.5% | 5.7%(+10.7)#57 | 18.7%(-2.17)#5,874 |
| 58. | Glencoe | 16.4% | 5.7%(+10.7)#58 | 18.7%(-2.21)#5,890 |
| 59. | Brooten | 16.3% | 5.7%(+10.5)#59 | 18.7%(-2.39)#5,956 |
| 60. | Clarkfield | 16.2% | 5.7%(+10.5)#60 | 18.7%(-2.43)#5,970 |
| 61. | Arlington | 16.1% | 5.7%(+10.4)#61 | 18.7%(-2.55)#6,011 |
| 62. | Blooming Prairie | 16.0% | 5.7%(+10.2)#62 | 18.7%(-2.68)#6,046 |
| 63. | Dodge Center | 15.8% | 5.7%(+10.0)#63 | 18.7%(-2.86)#6,117 |
| 64. | Albert Lea | 15.3% | 5.7%(+9.57)#64 | 18.7%(-3.34)#6,254 |
| 65. | Hazel Run | 15.0% | 5.7%(+9.26)#65 | 18.7%(-3.65)#6,355 |
| 66. | Brooklyn Center | 15.0% | 5.7%(+9.21)#66 | 18.7%(-3.70)#6,372 |
| 67. | Jasper | 14.7% | 5.7%(+9.00)#67 | 18.7%(-3.91)#6,463 |
| 68. | Ghent | 14.7% | 5.7%(+8.92)#68 | 18.7%(-3.99)#6,494 |
| 69. | Medford | 14.5% | 5.7%(+8.80)#69 | 18.7%(-4.10)#6,532 |
| 70. | Faribault | 14.5% | 5.7%(+8.80)#70 | 18.7%(-4.11)#6,536 |
| 71. | Murdock | 14.4% | 5.7%(+8.64)#71 | 18.7%(-4.27)#6,589 |
| 72. | Blomkest | 14.4% | 5.7%(+8.63)#72 | 18.7%(-4.28)#6,596 |
| 73. | Kerkhoven | 14.3% | 5.7%(+8.59)#73 | 18.7%(-4.31)#6,605 |
| 74. | Belgrade | 14.3% | 5.7%(+8.56)#74 | 18.7%(-4.35)#6,614 |
| 75. | Cokato | 14.1% | 5.7%(+8.37)#75 | 18.7%(-4.54)#6,685 |
| 76. | Frontenac | 14.0% | 5.7%(+8.28)#76 | 18.7%(-4.63)#6,716 |
| 77. | Fridley | 13.9% | 5.7%(+8.13)#77 | 18.7%(-4.78)#6,767 |
| 78. | Mountain Lake | 13.6% | 5.7%(+7.89)#78 | 18.7%(-5.02)#6,853 |
| 79. | Winthrop | 13.5% | 5.7%(+7.76)#79 | 18.7%(-5.15)#6,919 |
| 80. | Shevlin | 13.4% | 5.7%(+7.63)#80 | 18.7%(-5.28)#6,981 |
| 81. | Windom | 13.3% | 5.7%(+7.55)#81 | 18.7%(-5.36)#7,012 |
| 82. | Sandstone | 13.3% | 5.7%(+7.51)#82 | 18.7%(-5.40)#7,022 |
| 83. | New Auburn | 13.0% | 5.7%(+7.29)#83 | 18.7%(-5.62)#7,124 |
| 84. | Columbia Heights | 12.9% | 5.7%(+7.16)#84 | 18.7%(-5.75)#7,179 |
| 85. | Browerville | 12.9% | 5.7%(+7.16)#85 | 18.7%(-5.75)#7,180 |
| 86. | Alvarado | 12.9% | 5.7%(+7.11)#86 | 18.7%(-5.79)#7,203 |
| 87. | Bellechester | 12.6% | 5.7%(+6.82)#87 | 18.7%(-6.09)#7,331 |
| 88. | Spring Lake Park | 12.4% | 5.7%(+6.66)#88 | 18.7%(-6.25)#7,393 |
| 89. | Montevideo | 12.3% | 5.7%(+6.56)#89 | 18.7%(-6.35)#7,442 |
| 90. | Pine Point | 12.3% | 5.7%(+6.54)#90 | 18.7%(-6.37)#7,455 |
| 91. | Inver Grove Heights | 12.3% | 5.7%(+6.52)#91 | 18.7%(-6.39)#7,464 |
| 92. | Kenyon | 12.3% | 5.7%(+6.51)#92 | 18.7%(-6.40)#7,468 |
| 93. | Olivia | 12.2% | 5.7%(+6.43)#93 | 18.7%(-6.48)#7,511 |
| 94. | Magnolia | 12.1% | 5.7%(+6.38)#94 | 18.7%(-6.53)#7,539 |
| 95. | Blue Earth | 12.1% | 5.7%(+6.36)#95 | 18.7%(-6.55)#7,545 |
| 96. | Ruthton | 12.0% | 5.7%(+6.26)#96 | 18.7%(-6.65)#7,590 |
| 97. | St Paul Park | 11.8% | 5.7%(+6.03)#97 | 18.7%(-6.88)#7,706 |
| 98. | Lutsen | 11.6% | 5.7%(+5.81)#98 | 18.7%(-7.10)#7,827 |
| 99. | Hayward | 11.1% | 5.7%(+5.37)#99 | 18.7%(-7.54)#8,060 |
| 100. | Crookston | 11.1% | 5.7%(+5.35)#100 | 18.7%(-7.56)#8,072 |
Common Questions
What are the Top 10 Cities with the Highest Percentage of Hispanic or Latino Population in Minnesota?
Top 10 Cities with the Highest Percentage of Hispanic or Latino Population in Minnesota are:
#1
59.1%
#2
50.0%
#3
45.6%
#4
45.0%
#5
43.9%
#6
43.2%
#7
43.0%
#8
42.2%
#9
41.7%
#10
41.0%
What city has the Highest Percentage of Hispanic or Latino Population in Minnesota?
Nielsville has the Highest Percentage of Hispanic or Latino Population in Minnesota with 59.1%.
What is the Percentage of Hispanic or Latino Population in the State of Minnesota?
Percentage of Hispanic or Latino Population in Minnesota is 5.7%.
What is the Percentage of Hispanic or Latino Population in the United States?
Percentage of Hispanic or Latino Population in the United States is 18.7%.