Cities with the Highest Percentage of Hispanic or Latino Population in New York
RELATED REPORTS & OPTIONS
Hispanic or Latino
New York
Compare Cities
Map of Cities with the Highest Percentage of Hispanic or Latino Population in New York
0.0%
80.0%
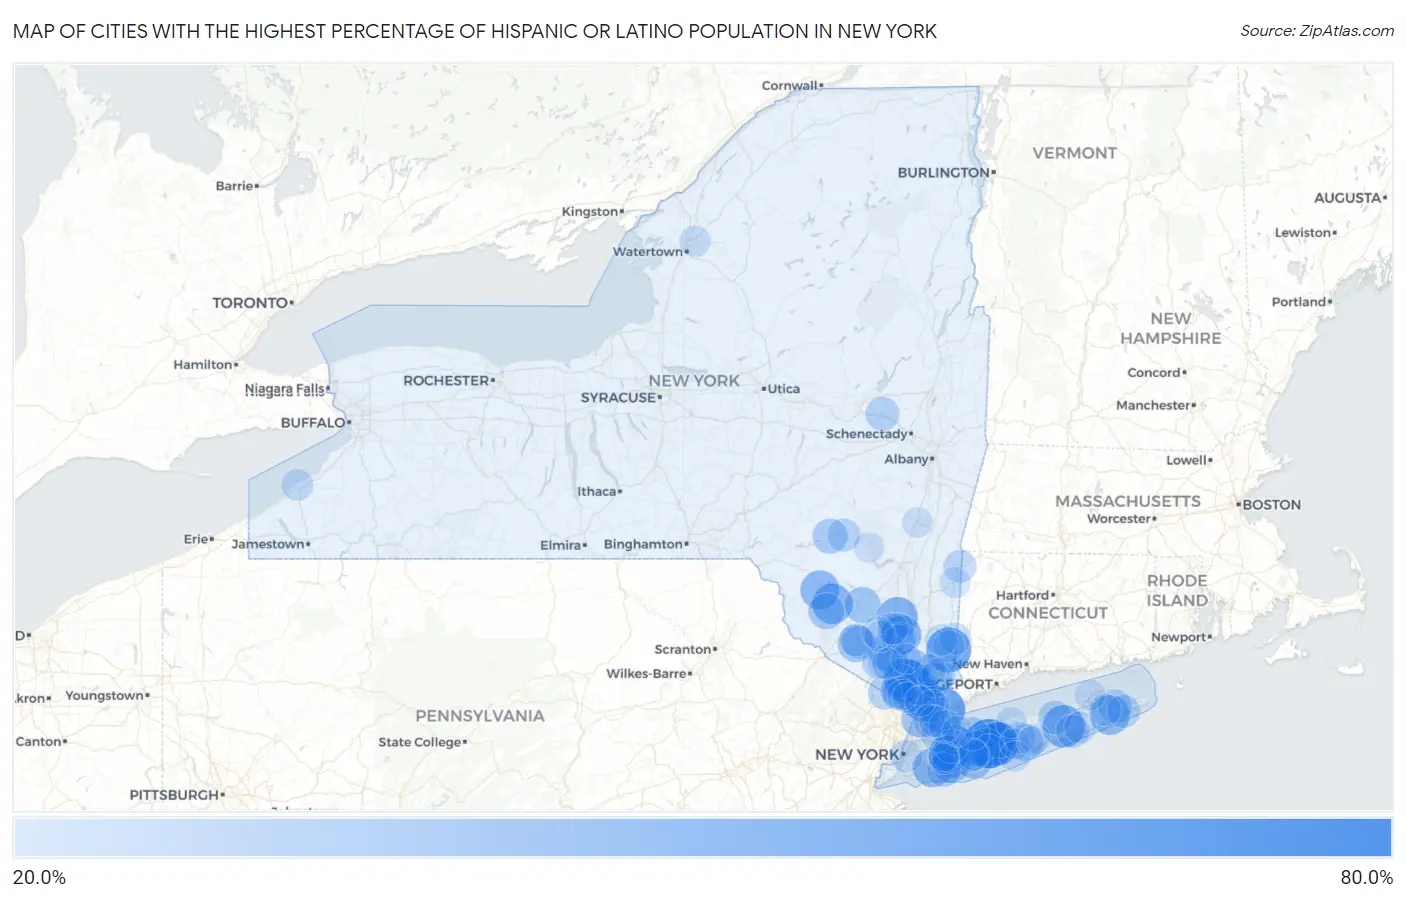
Cities with the Highest Percentage of Hispanic or Latino Population in New York
| City | Hispanic or Latino | vs State | vs National | |
| 1. | Brentwood | 72.9% | 19.5%(+53.4)#1 | 18.7%(+54.2)#1,172 |
| 2. | Port Chester | 62.4% | 19.5%(+43.0)#2 | 18.7%(+43.8)#1,474 |
| 3. | North Bay Shore | 61.1% | 19.5%(+41.7)#3 | 18.7%(+42.5)#1,521 |
| 4. | Brewster | 60.9% | 19.5%(+41.4)#4 | 18.7%(+42.2)#1,528 |
| 5. | Central Islip | 59.6% | 19.5%(+40.2)#5 | 18.7%(+41.0)#1,569 |
| 6. | Wassaic | 58.6% | 19.5%(+39.1)#6 | 18.7%(+39.9)#1,608 |
| 7. | West Haverstraw | 56.1% | 19.5%(+36.6)#7 | 18.7%(+37.4)#1,685 |
| 8. | Haverstraw | 55.8% | 19.5%(+36.3)#8 | 18.7%(+37.1)#1,692 |
| 9. | New Cassel | 55.7% | 19.5%(+36.2)#9 | 18.7%(+37.0)#1,694 |
| 10. | Flanders | 54.7% | 19.5%(+35.3)#10 | 18.7%(+36.1)#1,746 |
| 11. | Plattekill | 50.6% | 19.5%(+31.1)#11 | 18.7%(+31.9)#1,921 |
| 12. | Sleepy Hollow | 50.3% | 19.5%(+30.8)#12 | 18.7%(+31.7)#1,936 |
| 13. | South Fallsburg | 49.5% | 19.5%(+30.1)#13 | 18.7%(+30.9)#1,976 |
| 14. | Newburgh | 48.7% | 19.5%(+29.2)#14 | 18.7%(+30.0)#2,025 |
| 15. | Elmsford | 48.3% | 19.5%(+28.8)#15 | 18.7%(+29.7)#2,046 |
| 16. | East Hampton North | 47.4% | 19.5%(+27.9)#16 | 18.7%(+28.7)#2,092 |
| 17. | Inwood | 46.3% | 19.5%(+26.8)#17 | 18.7%(+27.7)#2,143 |
| 18. | Liberty | 46.1% | 19.5%(+26.7)#18 | 18.7%(+27.5)#2,156 |
| 19. | Hempstead | 45.4% | 19.5%(+25.9)#19 | 18.7%(+26.7)#2,187 |
| 20. | Baywood | 44.4% | 19.5%(+25.0)#20 | 18.7%(+25.8)#2,245 |
| 21. | Roosevelt | 43.8% | 19.5%(+24.3)#21 | 18.7%(+25.2)#2,284 |
| 22. | Freeport | 43.5% | 19.5%(+24.0)#22 | 18.7%(+24.9)#2,293 |
| 23. | Hillcrest | 43.3% | 19.5%(+23.9)#23 | 18.7%(+24.7)#2,299 |
| 24. | Mountain Lodge Park | 41.6% | 19.5%(+22.1)#24 | 18.7%(+23.0)#2,406 |
| 25. | Yonkers | 41.6% | 19.5%(+22.1)#25 | 18.7%(+22.9)#2,408 |
| 26. | Copiague | 41.4% | 19.5%(+21.9)#26 | 18.7%(+22.8)#2,421 |
| 27. | Ossining | 41.3% | 19.5%(+21.8)#27 | 18.7%(+22.7)#2,424 |
| 28. | Peekskill | 41.3% | 19.5%(+21.8)#28 | 18.7%(+22.6)#2,429 |
| 29. | Uniondale | 40.3% | 19.5%(+20.8)#29 | 18.7%(+21.7)#2,490 |
| 30. | Middletown | 40.3% | 19.5%(+20.8)#30 | 18.7%(+21.6)#2,493 |
| 31. | North Bellport | 39.8% | 19.5%(+20.3)#31 | 18.7%(+21.1)#2,516 |
| 32. | Ellenville | 38.9% | 19.5%(+19.4)#32 | 18.7%(+20.2)#2,577 |
| 33. | Wyandanch | 38.5% | 19.5%(+19.0)#33 | 18.7%(+19.8)#2,612 |
| 34. | Islandia | 38.2% | 19.5%(+18.7)#34 | 18.7%(+19.5)#2,634 |
| 35. | Monticello | 37.9% | 19.5%(+18.4)#35 | 18.7%(+19.3)#2,653 |
| 36. | Margaretville | 35.8% | 19.5%(+16.3)#36 | 18.7%(+17.2)#2,818 |
| 37. | Mount Kisco | 34.5% | 19.5%(+15.0)#37 | 18.7%(+15.8)#2,933 |
| 38. | Mount Ivy | 33.8% | 19.5%(+14.3)#38 | 18.7%(+15.1)#2,999 |
| 39. | Hillburn | 33.2% | 19.5%(+13.8)#39 | 18.7%(+14.6)#3,054 |
| 40. | Bay Shore | 33.2% | 19.5%(+13.7)#40 | 18.7%(+14.5)#3,063 |
| 41. | Island Park | 32.9% | 19.5%(+13.4)#41 | 18.7%(+14.3)#3,079 |
| 42. | Amsterdam | 32.8% | 19.5%(+13.3)#42 | 18.7%(+14.2)#3,085 |
| 43. | North Amityville | 32.7% | 19.5%(+13.2)#43 | 18.7%(+14.0)#3,094 |
| 44. | Riverhead | 32.6% | 19.5%(+13.1)#44 | 18.7%(+13.9)#3,108 |
| 45. | Manorhaven | 32.5% | 19.5%(+13.0)#45 | 18.7%(+13.9)#3,115 |
| 46. | Gardnertown | 32.4% | 19.5%(+12.9)#46 | 18.7%(+13.7)#3,134 |
| 47. | Bedford Hills | 32.2% | 19.5%(+12.8)#47 | 18.7%(+13.6)#3,145 |
| 48. | Springs | 32.2% | 19.5%(+12.8)#48 | 18.7%(+13.6)#3,146 |
| 49. | Westbury | 32.2% | 19.5%(+12.7)#49 | 18.7%(+13.5)#3,153 |
| 50. | Huntington Station | 31.9% | 19.5%(+12.4)#50 | 18.7%(+13.3)#3,183 |
| 51. | Walton Park | 31.5% | 19.5%(+12.0)#51 | 18.7%(+12.9)#3,224 |
| 52. | White Plains | 31.3% | 19.5%(+11.8)#52 | 18.7%(+12.6)#3,250 |
| 53. | Brewster Heights | 31.2% | 19.5%(+11.7)#53 | 18.7%(+12.6)#3,261 |
| 54. | Hampton Bays | 31.2% | 19.5%(+11.7)#54 | 18.7%(+12.6)#3,263 |
| 55. | Napeague | 31.2% | 19.5%(+11.7)#55 | 18.7%(+12.5)#3,266 |
| 56. | Fleischmanns | 31.2% | 19.5%(+11.7)#56 | 18.7%(+12.5)#3,268 |
| 57. | New Rochelle | 31.0% | 19.5%(+11.6)#57 | 18.7%(+12.4)#3,281 |
| 58. | Mechanicstown | 31.0% | 19.5%(+11.5)#58 | 18.7%(+12.3)#3,285 |
| 59. | Washington Heights | 30.7% | 19.5%(+11.2)#59 | 18.7%(+12.1)#3,317 |
| 60. | Vails Gate | 30.2% | 19.5%(+10.7)#60 | 18.7%(+11.6)#3,367 |
| 61. | Hankins | 30.1% | 19.5%(+10.6)#61 | 18.7%(+11.4)#3,385 |
| 62. | Millerton | 29.8% | 19.5%(+10.3)#62 | 18.7%(+11.2)#3,418 |
| 63. | Monroe | 29.3% | 19.5%(+9.83)#63 | 18.7%(+10.7)#3,471 |
| 64. | Spring Valley | 29.3% | 19.5%(+9.82)#64 | 18.7%(+10.7)#3,472 |
| 65. | Glen Cove | 29.1% | 19.5%(+9.57)#65 | 18.7%(+10.4)#3,503 |
| 66. | New York | 29.0% | 19.5%(+9.54)#66 | 18.7%(+10.4)#3,505 |
| 67. | Woodbury | 28.9% | 19.5%(+9.44)#67 | 18.7%(+10.3)#3,519 |
| 68. | Northwest Harbor | 28.8% | 19.5%(+9.31)#68 | 18.7%(+10.1)#3,529 |
| 69. | Montgomery | 28.4% | 19.5%(+8.88)#69 | 18.7%(+9.71)#3,582 |
| 70. | Yorktown Heights | 28.3% | 19.5%(+8.79)#70 | 18.7%(+9.62)#3,598 |
| 71. | Shinnecock Hills | 27.8% | 19.5%(+8.29)#71 | 18.7%(+9.12)#3,658 |
| 72. | Dunkirk | 27.6% | 19.5%(+8.11)#72 | 18.7%(+8.94)#3,677 |
| 73. | New Windsor | 27.5% | 19.5%(+7.99)#73 | 18.7%(+8.82)#3,696 |
| 74. | Medford | 27.3% | 19.5%(+7.84)#74 | 18.7%(+8.67)#3,715 |
| 75. | Putnam Lake | 27.3% | 19.5%(+7.78)#75 | 18.7%(+8.61)#3,726 |
| 76. | Brewster Hill | 27.2% | 19.5%(+7.74)#76 | 18.7%(+8.57)#3,731 |
| 77. | Mamaroneck | 27.1% | 19.5%(+7.58)#77 | 18.7%(+8.41)#3,755 |
| 78. | Lake Carmel | 27.0% | 19.5%(+7.57)#78 | 18.7%(+8.40)#3,760 |
| 79. | Maybrook | 27.0% | 19.5%(+7.53)#79 | 18.7%(+8.37)#3,763 |
| 80. | Calcium | 26.8% | 19.5%(+7.32)#80 | 18.7%(+8.16)#3,792 |
| 81. | Orange Lake | 26.6% | 19.5%(+7.16)#81 | 18.7%(+7.99)#3,814 |
| 82. | Fairview Cdp Westchester County | 26.1% | 19.5%(+6.63)#82 | 18.7%(+7.46)#3,873 |
| 83. | Port Jefferson Station | 26.0% | 19.5%(+6.55)#83 | 18.7%(+7.38)#3,885 |
| 84. | Harriman | 26.0% | 19.5%(+6.54)#84 | 18.7%(+7.37)#3,887 |
| 85. | North Lindenhurst | 25.8% | 19.5%(+6.31)#85 | 18.7%(+7.14)#3,914 |
| 86. | Amenia | 25.6% | 19.5%(+6.15)#86 | 18.7%(+6.98)#3,936 |
| 87. | Greenport | 25.4% | 19.5%(+5.93)#87 | 18.7%(+6.77)#3,968 |
| 88. | North Patchogue | 24.9% | 19.5%(+5.37)#88 | 18.7%(+6.21)#4,038 |
| 89. | Fire Island | 24.8% | 19.5%(+5.35)#89 | 18.7%(+6.18)#4,040 |
| 90. | Oyster Bay | 24.8% | 19.5%(+5.34)#90 | 18.7%(+6.17)#4,041 |
| 91. | Jefferson Heights | 24.7% | 19.5%(+5.25)#91 | 18.7%(+6.09)#4,049 |
| 92. | Nanuet | 24.6% | 19.5%(+5.10)#92 | 18.7%(+5.93)#4,081 |
| 93. | Mastic | 24.5% | 19.5%(+4.97)#93 | 18.7%(+5.81)#4,105 |
| 94. | Phoenicia | 24.4% | 19.5%(+4.95)#94 | 18.7%(+5.78)#4,107 |
| 95. | Lakeview | 24.4% | 19.5%(+4.93)#95 | 18.7%(+5.77)#4,111 |
| 96. | West Nyack | 24.4% | 19.5%(+4.88)#96 | 18.7%(+5.71)#4,118 |
| 97. | Tarrytown | 23.9% | 19.5%(+4.40)#97 | 18.7%(+5.23)#4,211 |
| 98. | Fort Montgomery | 23.7% | 19.5%(+4.24)#98 | 18.7%(+5.07)#4,232 |
| 99. | West Hempstead | 23.6% | 19.5%(+4.12)#99 | 18.7%(+4.95)#4,251 |
| 100. | Shirley | 23.4% | 19.5%(+3.96)#100 | 18.7%(+4.79)#4,282 |
Common Questions
What are the Top 10 Cities with the Highest Percentage of Hispanic or Latino Population in New York?
Top 10 Cities with the Highest Percentage of Hispanic or Latino Population in New York are:
#1
72.9%
#2
62.4%
#3
61.1%
#4
60.9%
#5
59.6%
#6
56.1%
#7
55.8%
#8
55.7%
#9
54.7%
#10
50.6%
What city has the Highest Percentage of Hispanic or Latino Population in New York?
Brentwood has the Highest Percentage of Hispanic or Latino Population in New York with 72.9%.
What is the Percentage of Hispanic or Latino Population in the State of New York?
Percentage of Hispanic or Latino Population in New York is 19.5%.
What is the Percentage of Hispanic or Latino Population in the United States?
Percentage of Hispanic or Latino Population in the United States is 18.7%.