Cities with the Highest Percentage of Hispanic or Latino Population in Kansas
RELATED REPORTS & OPTIONS
Hispanic or Latino
Kansas
Compare Cities
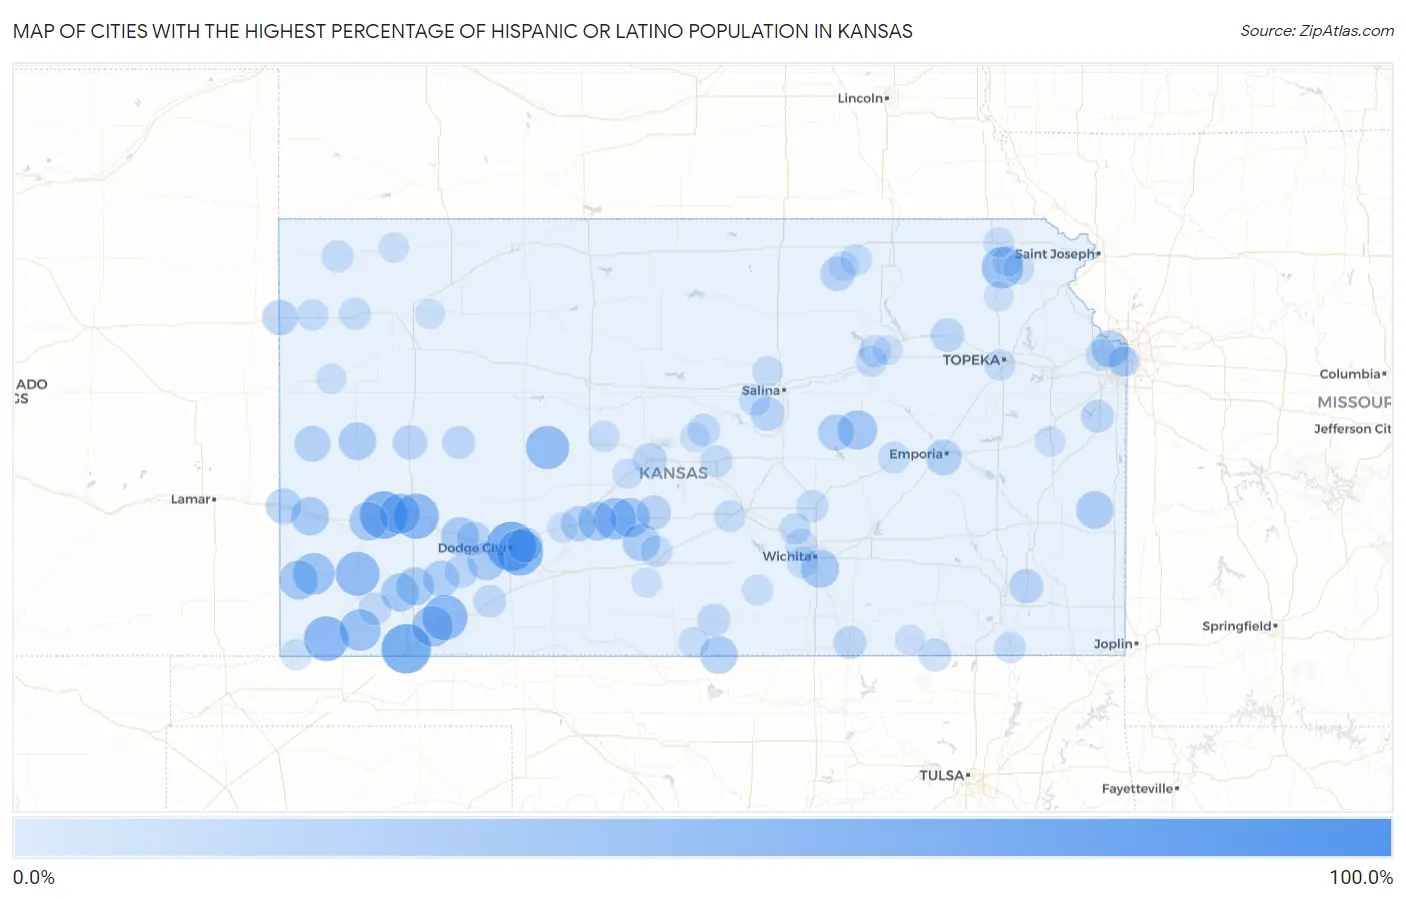
Map of Cities with the Highest Percentage of Hispanic or Latino Population in Kansas
0.0%
100.0%
Cities with the Highest Percentage of Hispanic or Latino Population in Kansas
| City | Hispanic or Latino | vs State | vs National | |
| 1. | Shallow Water | 100.0% | 12.6%(+87.4)#1 | 18.7%(+81.3)#334 |
| 2. | Liberal | 66.2% | 12.6%(+53.6)#2 | 18.7%(+47.6)#1,364 |
| 3. | Dodge City | 65.3% | 12.6%(+52.7)#3 | 18.7%(+46.7)#1,395 |
| 4. | Deerfield | 60.9% | 12.6%(+48.3)#4 | 18.7%(+42.2)#1,530 |
| 5. | Wilroads Gardens | 56.7% | 12.6%(+44.1)#5 | 18.7%(+38.1)#1,663 |
| 6. | Garden City | 54.2% | 12.6%(+41.6)#6 | 18.7%(+35.6)#1,774 |
| 7. | Plains | 54.0% | 12.6%(+41.4)#7 | 18.7%(+35.4)#1,785 |
| 8. | Rolla | 53.3% | 12.6%(+40.7)#8 | 18.7%(+34.7)#1,818 |
| 9. | Ulysses | 51.0% | 12.6%(+38.4)#9 | 18.7%(+32.4)#1,901 |
| 10. | Bazine | 48.9% | 12.6%(+36.3)#10 | 18.7%(+30.2)#2,017 |
| 11. | Belpre | 44.7% | 12.6%(+32.1)#11 | 18.7%(+26.1)#2,224 |
| 12. | Johnson City | 44.2% | 12.6%(+31.6)#12 | 18.7%(+25.6)#2,257 |
| 13. | Kickapoo Site 5 | 44.1% | 12.6%(+31.5)#13 | 18.7%(+25.5)#2,262 |
| 14. | Hugoton | 43.9% | 12.6%(+31.3)#14 | 18.7%(+25.3)#2,275 |
| 15. | Kismet | 42.5% | 12.6%(+29.9)#15 | 18.7%(+23.9)#2,360 |
| 16. | Holcomb | 41.2% | 12.6%(+28.6)#16 | 18.7%(+22.5)#2,433 |
| 17. | Macksville | 38.5% | 12.6%(+25.9)#17 | 18.7%(+19.9)#2,608 |
| 18. | Lost Springs | 38.5% | 12.6%(+25.9)#18 | 18.7%(+19.8)#2,613 |
| 19. | Manter | 37.4% | 12.6%(+24.8)#19 | 18.7%(+18.7)#2,690 |
| 20. | Lewis | 36.2% | 12.6%(+23.6)#20 | 18.7%(+17.6)#2,786 |
| 21. | Lakin | 36.0% | 12.6%(+23.4)#21 | 18.7%(+17.4)#2,807 |
| 22. | Oaklawn Sunview | 34.7% | 12.6%(+22.1)#22 | 18.7%(+16.0)#2,911 |
| 23. | Ingalls | 34.6% | 12.6%(+22.0)#23 | 18.7%(+16.0)#2,917 |
| 24. | Syracuse | 34.6% | 12.6%(+22.0)#24 | 18.7%(+16.0)#2,921 |
| 25. | Satanta | 34.3% | 12.6%(+21.7)#25 | 18.7%(+15.6)#2,952 |
| 26. | Ensign | 34.3% | 12.6%(+21.7)#26 | 18.7%(+15.6)#2,953 |
| 27. | Sublette | 34.2% | 12.6%(+21.6)#27 | 18.7%(+15.6)#2,957 |
| 28. | Leoti | 33.5% | 12.6%(+20.9)#28 | 18.7%(+14.9)#3,017 |
| 29. | Mapleton | 33.3% | 12.6%(+20.7)#29 | 18.7%(+14.7)#3,037 |
| 30. | Byers | 33.3% | 12.6%(+20.7)#30 | 18.7%(+14.7)#3,040 |
| 31. | Waldron | 33.3% | 12.6%(+20.7)#31 | 18.7%(+14.7)#3,041 |
| 32. | Kansas City | 31.6% | 12.6%(+19.0)#32 | 18.7%(+13.0)#3,208 |
| 33. | Piedmont | 31.2% | 12.6%(+18.6)#33 | 18.7%(+12.6)#3,256 |
| 34. | Copeland | 30.1% | 12.6%(+17.5)#34 | 18.7%(+11.4)#3,384 |
| 35. | Tampa | 29.8% | 12.6%(+17.2)#35 | 18.7%(+11.1)#3,427 |
| 36. | Newbury | 29.3% | 12.6%(+16.7)#36 | 18.7%(+10.6)#3,473 |
| 37. | Tribune | 28.9% | 12.6%(+16.3)#37 | 18.7%(+10.2)#3,522 |
| 38. | Emporia | 28.6% | 12.6%(+16.0)#38 | 18.7%(+9.91)#3,554 |
| 39. | Coolidge | 28.4% | 12.6%(+15.8)#39 | 18.7%(+9.76)#3,579 |
| 40. | Kanorado | 27.6% | 12.6%(+15.0)#40 | 18.7%(+8.93)#3,680 |
| 41. | Kinsley | 27.6% | 12.6%(+15.0)#41 | 18.7%(+8.92)#3,682 |
| 42. | Wright | 27.1% | 12.6%(+14.5)#42 | 18.7%(+8.43)#3,749 |
| 43. | Palmer | 25.2% | 12.6%(+12.6)#43 | 18.7%(+6.51)#3,992 |
| 44. | St John | 24.9% | 12.6%(+12.3)#44 | 18.7%(+6.23)#4,033 |
| 45. | Scott City | 24.7% | 12.6%(+12.1)#45 | 18.7%(+6.03)#4,062 |
| 46. | Thayer | 24.7% | 12.6%(+12.1)#46 | 18.7%(+6.01)#4,069 |
| 47. | Cimarron | 24.6% | 12.6%(+12.0)#47 | 18.7%(+5.99)#4,071 |
| 48. | Falun | 23.9% | 12.6%(+11.3)#48 | 18.7%(+5.29)#4,194 |
| 49. | Great Bend | 23.8% | 12.6%(+11.2)#49 | 18.7%(+5.12)#4,229 |
| 50. | Belvue | 22.5% | 12.6%(+9.86)#50 | 18.7%(+3.81)#4,456 |
| 51. | Montezuma | 22.1% | 12.6%(+9.50)#51 | 18.7%(+3.45)#4,524 |
| 52. | Arkansas City | 21.3% | 12.6%(+8.65)#52 | 18.7%(+2.60)#4,691 |
| 53. | Dighton | 21.1% | 12.6%(+8.45)#53 | 18.7%(+2.40)#4,729 |
| 54. | Hillsdale | 21.1% | 12.6%(+8.45)#54 | 18.7%(+2.40)#4,730 |
| 55. | Moscow | 20.8% | 12.6%(+8.23)#55 | 18.7%(+2.18)#4,776 |
| 56. | Attica | 20.8% | 12.6%(+8.16)#56 | 18.7%(+2.11)#4,792 |
| 57. | Elgin | 20.4% | 12.6%(+7.81)#57 | 18.7%(+1.76)#4,869 |
| 58. | Lorraine | 20.3% | 12.6%(+7.74)#58 | 18.7%(+1.69)#4,889 |
| 59. | Fowler | 19.8% | 12.6%(+7.23)#59 | 18.7%(+1.18)#4,998 |
| 60. | Newton | 19.5% | 12.6%(+6.94)#60 | 18.7%(+0.893)#5,076 |
| 61. | Lyons | 19.5% | 12.6%(+6.86)#61 | 18.7%(+0.814)#5,102 |
| 62. | Maize | 19.4% | 12.6%(+6.77)#62 | 18.7%(+0.719)#5,119 |
| 63. | Fort Riley | 19.3% | 12.6%(+6.68)#63 | 18.7%(+0.634)#5,132 |
| 64. | Bird City | 18.5% | 12.6%(+5.87)#64 | 18.7%(-0.176)#5,308 |
| 65. | Iuka | 18.2% | 12.6%(+5.58)#65 | 18.7%(-0.470)#5,387 |
| 66. | Partridge | 18.2% | 12.6%(+5.58)#66 | 18.7%(-0.470)#5,388 |
| 67. | Brewster | 18.2% | 12.6%(+5.56)#67 | 18.7%(-0.492)#5,396 |
| 68. | Elmdale | 18.0% | 12.6%(+5.40)#68 | 18.7%(-0.652)#5,443 |
| 69. | Brookville | 18.0% | 12.6%(+5.36)#69 | 18.7%(-0.693)#5,453 |
| 70. | Wichita | 17.6% | 12.6%(+4.96)#70 | 18.7%(-1.09)#5,564 |
| 71. | Junction City | 17.3% | 12.6%(+4.75)#71 | 18.7%(-1.30)#5,628 |
| 72. | Goodland | 17.0% | 12.6%(+4.45)#72 | 18.7%(-1.60)#5,724 |
| 73. | Bentley | 17.0% | 12.6%(+4.43)#73 | 18.7%(-1.62)#5,731 |
| 74. | Greenleaf | 16.9% | 12.6%(+4.33)#74 | 18.7%(-1.72)#5,757 |
| 75. | Edwardsville | 16.9% | 12.6%(+4.26)#75 | 18.7%(-1.79)#5,773 |
| 76. | Coffeyville | 16.8% | 12.6%(+4.23)#76 | 18.7%(-1.82)#5,778 |
| 77. | Bison | 16.8% | 12.6%(+4.16)#77 | 18.7%(-1.89)#5,797 |
| 78. | Horton | 16.4% | 12.6%(+3.77)#78 | 18.7%(-2.28)#5,918 |
| 79. | Topeka | 16.4% | 12.6%(+3.77)#79 | 18.7%(-2.28)#5,921 |
| 80. | Hazelton | 16.1% | 12.6%(+3.53)#80 | 18.7%(-2.52)#5,999 |
| 81. | Kickapoo Site 1 | 15.8% | 12.6%(+3.19)#81 | 18.7%(-2.86)#6,120 |
| 82. | Elkhart | 15.8% | 12.6%(+3.16)#82 | 18.7%(-2.89)#6,128 |
| 83. | Norwich | 15.3% | 12.6%(+2.73)#83 | 18.7%(-3.32)#6,246 |
| 84. | Culver | 15.3% | 12.6%(+2.68)#84 | 18.7%(-3.37)#6,261 |
| 85. | Princeton | 14.9% | 12.6%(+2.30)#85 | 18.7%(-3.75)#6,391 |
| 86. | Offerle | 14.8% | 12.6%(+2.20)#86 | 18.7%(-3.85)#6,437 |
| 87. | Cedar Vale | 14.5% | 12.6%(+1.90)#87 | 18.7%(-4.15)#6,549 |
| 88. | Linn | 14.5% | 12.6%(+1.88)#88 | 18.7%(-4.17)#6,557 |
| 89. | Pawnee Rock | 14.1% | 12.6%(+1.54)#89 | 18.7%(-4.51)#6,673 |
| 90. | Fairview | 14.1% | 12.6%(+1.47)#90 | 18.7%(-4.58)#6,700 |
| 91. | Wallace | 14.0% | 12.6%(+1.40)#91 | 18.7%(-4.65)#6,725 |
| 92. | Westwood | 14.0% | 12.6%(+1.40)#92 | 18.7%(-4.66)#6,727 |
| 93. | Atwood | 14.0% | 12.6%(+1.37)#93 | 18.7%(-4.68)#6,734 |
| 94. | Roeland Park | 13.9% | 12.6%(+1.26)#94 | 18.7%(-4.79)#6,776 |
| 95. | Ogden | 13.7% | 12.6%(+1.13)#95 | 18.7%(-4.92)#6,819 |
| 96. | Menlo | 13.5% | 12.6%(+0.912)#96 | 18.7%(-5.14)#6,914 |
| 97. | Holton | 13.2% | 12.6%(+0.570)#97 | 18.7%(-5.48)#7,062 |
| 98. | Coats | 13.2% | 12.6%(+0.556)#98 | 18.7%(-5.49)#7,068 |
| 99. | St. Marks | 13.1% | 12.6%(+0.483)#99 | 18.7%(-5.57)#7,091 |
| 100. | Bushton | 13.0% | 12.6%(+0.442)#100 | 18.7%(-5.61)#7,119 |
Common Questions
What are the Top 10 Cities with the Highest Percentage of Hispanic or Latino Population in Kansas?
Top 10 Cities with the Highest Percentage of Hispanic or Latino Population in Kansas are:
#1
66.2%
#2
65.3%
#3
60.9%
#4
56.7%
#5
54.2%
#6
54.0%
#7
53.3%
#8
51.0%
#9
48.9%
#10
44.7%
What city has the Highest Percentage of Hispanic or Latino Population in Kansas?
Liberal has the Highest Percentage of Hispanic or Latino Population in Kansas with 66.2%.
What is the Percentage of Hispanic or Latino Population in the State of Kansas?
Percentage of Hispanic or Latino Population in Kansas is 12.6%.
What is the Percentage of Hispanic or Latino Population in the United States?
Percentage of Hispanic or Latino Population in the United States is 18.7%.