Cities with the Highest Percentage of Hispanic or Latino Population in Georgia
RELATED REPORTS & OPTIONS
Hispanic or Latino
Georgia
Compare Cities
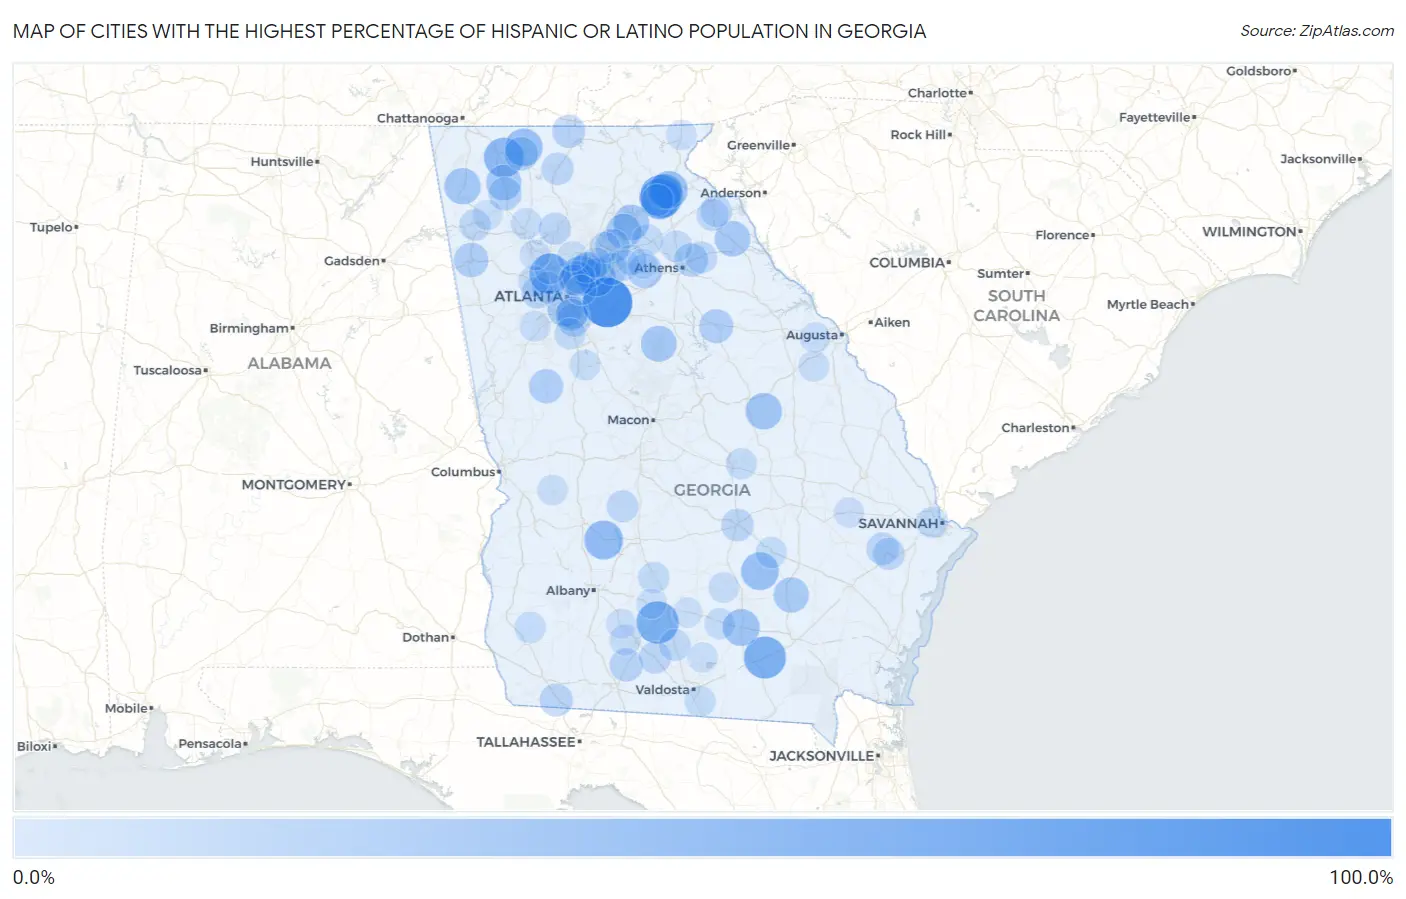
Map of Cities with the Highest Percentage of Hispanic or Latino Population in Georgia
0.0%
100.0%
Cities with the Highest Percentage of Hispanic or Latino Population in Georgia
| City | Hispanic or Latino | vs State | vs National | |
| 1. | Lakeview Estates | 90.7% | 10.1%(+80.6)#1 | 18.7%(+72.0)#760 |
| 2. | Baldwin | 64.8% | 10.1%(+54.7)#2 | 18.7%(+46.1)#1,415 |
| 3. | Axson | 63.3% | 10.1%(+53.2)#3 | 18.7%(+44.6)#1,448 |
| 4. | Omega | 62.1% | 10.1%(+52.0)#4 | 18.7%(+43.4)#1,488 |
| 5. | Argyle | 60.7% | 10.1%(+50.7)#5 | 18.7%(+42.1)#1,534 |
| 6. | Alto | 56.1% | 10.1%(+46.0)#6 | 18.7%(+37.4)#1,684 |
| 7. | Fair Oaks | 55.4% | 10.1%(+45.4)#7 | 18.7%(+36.8)#1,705 |
| 8. | Dalton | 51.5% | 10.1%(+41.4)#8 | 18.7%(+32.8)#1,887 |
| 9. | De Soto | 47.8% | 10.1%(+37.7)#9 | 18.7%(+29.1)#2,073 |
| 10. | Doraville | 45.1% | 10.1%(+35.1)#10 | 18.7%(+26.5)#2,201 |
| 11. | Lilburn | 44.7% | 10.1%(+34.6)#11 | 18.7%(+26.0)#2,226 |
| 12. | Mount Airy | 44.4% | 10.1%(+34.4)#12 | 18.7%(+25.8)#2,246 |
| 13. | Denton | 44.0% | 10.1%(+33.9)#13 | 18.7%(+25.3)#2,273 |
| 14. | Eton | 43.9% | 10.1%(+33.8)#14 | 18.7%(+25.2)#2,279 |
| 15. | Pearson | 40.7% | 10.1%(+30.7)#15 | 18.7%(+22.1)#2,460 |
| 16. | Riddleville | 39.1% | 10.1%(+29.0)#16 | 18.7%(+20.4)#2,568 |
| 17. | Trion | 38.3% | 10.1%(+28.2)#17 | 18.7%(+19.6)#2,628 |
| 18. | Shady Dale | 37.2% | 10.1%(+27.1)#18 | 18.7%(+18.5)#2,706 |
| 19. | Norcross | 36.6% | 10.1%(+26.5)#19 | 18.7%(+17.9)#2,752 |
| 20. | Gainesville | 36.4% | 10.1%(+26.3)#20 | 18.7%(+17.7)#2,769 |
| 21. | Dewy Rose | 35.7% | 10.1%(+25.6)#21 | 18.7%(+17.0)#2,829 |
| 22. | Resaca | 34.9% | 10.1%(+24.9)#22 | 18.7%(+16.3)#2,893 |
| 23. | Hapeville | 34.8% | 10.1%(+24.7)#23 | 18.7%(+16.1)#2,902 |
| 24. | Chamblee | 34.6% | 10.1%(+24.5)#24 | 18.7%(+15.9)#2,922 |
| 25. | Cornelia | 34.6% | 10.1%(+24.5)#25 | 18.7%(+15.9)#2,923 |
| 26. | Rockingham | 34.4% | 10.1%(+24.4)#26 | 18.7%(+15.8)#2,937 |
| 27. | Oakwood | 33.8% | 10.1%(+23.8)#27 | 18.7%(+15.2)#2,997 |
| 28. | Cedartown | 31.5% | 10.1%(+21.4)#28 | 18.7%(+12.8)#3,234 |
| 29. | Buford | 31.2% | 10.1%(+21.2)#29 | 18.7%(+12.6)#3,259 |
| 30. | Echols County Consolidated Government | 31.0% | 10.1%(+20.9)#30 | 18.7%(+12.3)#3,283 |
| 31. | Bethlehem | 30.4% | 10.1%(+20.4)#31 | 18.7%(+11.8)#3,349 |
| 32. | Gay | 30.3% | 10.1%(+20.3)#32 | 18.7%(+11.7)#3,357 |
| 33. | Siloam | 29.8% | 10.1%(+19.7)#33 | 18.7%(+11.1)#3,421 |
| 34. | Chatsworth | 28.7% | 10.1%(+18.6)#34 | 18.7%(+10.0)#3,544 |
| 35. | Hull | 28.3% | 10.1%(+18.2)#35 | 18.7%(+9.64)#3,594 |
| 36. | Faceville | 27.8% | 10.1%(+17.8)#36 | 18.7%(+9.16)#3,651 |
| 37. | Morrow | 27.4% | 10.1%(+17.3)#37 | 18.7%(+8.71)#3,710 |
| 38. | Calhoun | 27.3% | 10.1%(+17.2)#38 | 18.7%(+8.65)#3,716 |
| 39. | Coolidge | 26.6% | 10.1%(+16.5)#39 | 18.7%(+7.93)#3,822 |
| 40. | Epworth | 26.4% | 10.1%(+16.4)#40 | 18.7%(+7.78)#3,838 |
| 41. | Attapulgus | 25.9% | 10.1%(+15.8)#41 | 18.7%(+7.22)#3,904 |
| 42. | Mcrae Helena | 24.6% | 10.1%(+14.5)#42 | 18.7%(+5.91)#4,083 |
| 43. | Fort Stewart | 24.1% | 10.1%(+14.0)#43 | 18.7%(+5.45)#4,164 |
| 44. | Conley | 23.9% | 10.1%(+13.8)#44 | 18.7%(+5.24)#4,206 |
| 45. | Ellijay | 23.6% | 10.1%(+13.5)#45 | 18.7%(+4.95)#4,253 |
| 46. | Lawrenceville | 23.4% | 10.1%(+13.4)#46 | 18.7%(+4.77)#4,290 |
| 47. | Forest Park | 23.0% | 10.1%(+13.0)#47 | 18.7%(+4.39)#4,359 |
| 48. | Lithia Springs | 23.0% | 10.1%(+13.0)#48 | 18.7%(+4.38)#4,360 |
| 49. | Berlin | 23.0% | 10.1%(+13.0)#49 | 18.7%(+4.37)#4,363 |
| 50. | Flemington | 22.5% | 10.1%(+12.4)#50 | 18.7%(+3.81)#4,454 |
| 51. | Mableton | 22.3% | 10.1%(+12.3)#51 | 18.7%(+3.69)#4,473 |
| 52. | Canton | 22.3% | 10.1%(+12.2)#52 | 18.7%(+3.63)#4,488 |
| 53. | Byromville | 22.1% | 10.1%(+12.1)#53 | 18.7%(+3.48)#4,521 |
| 54. | Canon | 21.8% | 10.1%(+11.8)#54 | 18.7%(+3.17)#4,573 |
| 55. | Sparks | 21.7% | 10.1%(+11.7)#55 | 18.7%(+3.06)#4,594 |
| 56. | Colbert | 21.6% | 10.1%(+11.6)#56 | 18.7%(+2.98)#4,611 |
| 57. | Raoul | 21.2% | 10.1%(+11.2)#57 | 18.7%(+2.58)#4,695 |
| 58. | Bowersville | 21.1% | 10.1%(+11.1)#58 | 18.7%(+2.46)#4,720 |
| 59. | Rome | 21.0% | 10.1%(+10.9)#59 | 18.7%(+2.35)#4,741 |
| 60. | Piney Grove | 20.7% | 10.1%(+10.7)#60 | 18.7%(+2.08)#4,797 |
| 61. | Dacula | 20.5% | 10.1%(+10.4)#61 | 18.7%(+1.85)#4,845 |
| 62. | Nicholson | 20.4% | 10.1%(+10.3)#62 | 18.7%(+1.72)#4,880 |
| 63. | Garden City | 20.2% | 10.1%(+10.1)#63 | 18.7%(+1.52)#4,931 |
| 64. | Pendergrass | 20.1% | 10.1%(+10.0)#64 | 18.7%(+1.41)#4,958 |
| 65. | Sycamore | 19.9% | 10.1%(+9.81)#65 | 18.7%(+1.22)#4,988 |
| 66. | White | 19.5% | 10.1%(+9.48)#66 | 18.7%(+0.884)#5,082 |
| 67. | Hazlehurst | 19.5% | 10.1%(+9.48)#67 | 18.7%(+0.882)#5,085 |
| 68. | Damascus | 19.3% | 10.1%(+9.28)#68 | 18.7%(+0.683)#5,125 |
| 69. | East Dublin | 19.2% | 10.1%(+9.15)#69 | 18.7%(+0.559)#5,150 |
| 70. | Powder Springs | 19.1% | 10.1%(+9.07)#70 | 18.7%(+0.474)#5,161 |
| 71. | Marietta | 18.8% | 10.1%(+8.79)#71 | 18.7%(+0.197)#5,219 |
| 72. | Irondale | 18.8% | 10.1%(+8.79)#72 | 18.7%(+0.192)#5,220 |
| 73. | Willacoochee | 18.7% | 10.1%(+8.67)#73 | 18.7%(+0.081)#5,245 |
| 74. | Dasher | 18.4% | 10.1%(+8.38)#74 | 18.7%(-0.213)#5,322 |
| 75. | Cataula | 18.4% | 10.1%(+8.31)#75 | 18.7%(-0.281)#5,341 |
| 76. | Funston | 18.1% | 10.1%(+8.08)#76 | 18.7%(-0.513)#5,401 |
| 77. | East Griffin | 17.7% | 10.1%(+7.69)#77 | 18.7%(-0.907)#5,516 |
| 78. | Sugar Hill | 17.7% | 10.1%(+7.67)#78 | 18.7%(-0.926)#5,522 |
| 79. | Keysville | 17.6% | 10.1%(+7.56)#79 | 18.7%(-1.03)#5,550 |
| 80. | Brookhaven | 17.6% | 10.1%(+7.56)#80 | 18.7%(-1.04)#5,553 |
| 81. | Cusseta Chattahoochee County Unified Government | 17.6% | 10.1%(+7.53)#81 | 18.7%(-1.06)#5,557 |
| 82. | Auburn | 17.3% | 10.1%(+7.21)#82 | 18.7%(-1.38)#5,653 |
| 83. | Palmetto | 17.3% | 10.1%(+7.21)#83 | 18.7%(-1.38)#5,655 |
| 84. | Ambrose | 17.2% | 10.1%(+7.14)#84 | 18.7%(-1.46)#5,676 |
| 85. | Buena Vista | 17.1% | 10.1%(+7.00)#85 | 18.7%(-1.59)#5,719 |
| 86. | Acworth | 17.0% | 10.1%(+6.95)#86 | 18.7%(-1.64)#5,736 |
| 87. | Peachtree Corners | 16.6% | 10.1%(+6.51)#87 | 18.7%(-2.09)#5,851 |
| 88. | Grovetown | 16.5% | 10.1%(+6.42)#88 | 18.7%(-2.17)#5,875 |
| 89. | Mountain City | 16.3% | 10.1%(+6.29)#89 | 18.7%(-2.30)#5,930 |
| 90. | Scottdale | 16.3% | 10.1%(+6.19)#90 | 18.7%(-2.40)#5,961 |
| 91. | Claxton | 16.2% | 10.1%(+6.11)#91 | 18.7%(-2.48)#5,990 |
| 92. | Roswell | 16.1% | 10.1%(+6.09)#92 | 18.7%(-2.50)#5,996 |
| 93. | Sterling | 15.8% | 10.1%(+5.76)#93 | 18.7%(-2.83)#6,105 |
| 94. | Shannon | 15.8% | 10.1%(+5.72)#94 | 18.7%(-2.87)#6,123 |
| 95. | Ray City | 15.7% | 10.1%(+5.67)#95 | 18.7%(-2.93)#6,136 |
| 96. | Enigma | 15.6% | 10.1%(+5.53)#96 | 18.7%(-3.06)#6,176 |
| 97. | Doerun | 15.5% | 10.1%(+5.44)#97 | 18.7%(-3.16)#6,204 |
| 98. | Ty Ty | 15.3% | 10.1%(+5.28)#98 | 18.7%(-3.32)#6,247 |
| 99. | Winder | 15.3% | 10.1%(+5.27)#99 | 18.7%(-3.33)#6,249 |
| 100. | Duluth | 15.3% | 10.1%(+5.19)#100 | 18.7%(-3.40)#6,277 |
Common Questions
What are the Top 10 Cities with the Highest Percentage of Hispanic or Latino Population in Georgia?
Top 10 Cities with the Highest Percentage of Hispanic or Latino Population in Georgia are:
What city has the Highest Percentage of Hispanic or Latino Population in Georgia?
Lakeview Estates has the Highest Percentage of Hispanic or Latino Population in Georgia with 90.7%.
What is the Percentage of Hispanic or Latino Population in the State of Georgia?
Percentage of Hispanic or Latino Population in Georgia is 10.1%.
What is the Percentage of Hispanic or Latino Population in the United States?
Percentage of Hispanic or Latino Population in the United States is 18.7%.