Prospect Park borough, NJ Map & Demographics
Prospect Park borough Overview
$25,501
PER CAPITA INCOME
$59,167
AVG FAMILY INCOME
$54,271
AVG HOUSEHOLD INCOME
29.8%
WAGE / INCOME GAP [ % ]
70.2¢/ $1
WAGE / INCOME GAP [ $ ]
0.52
INEQUALITY / GINI INDEX
6,299
TOTAL POPULATION
3,227
MALE POPULATION
3,072
FEMALE POPULATION
105.05
MALES / 100 FEMALES
95.20
FEMALES / 100 MALES
35.5
MEDIAN AGE
3.8
AVG FAMILY SIZE
3.3
AVG HOUSEHOLD SIZE
3,162
LABOR FORCE [ PEOPLE ]
64.8%
PERCENT IN LABOR FORCE
9.0%
UNEMPLOYMENT RATE
Income in Prospect Park borough
Income Overview in Prospect Park borough
Per Capita Income in Prospect Park borough is $25,501, while median incomes of families and households are $59,167 and $54,271 respectively.
| Characteristic | Number | Measure |
| Per Capita Income | 6,299 | $25,501 |
| Median Family Income | 1,458 | $59,167 |
| Mean Family Income | 1,458 | $91,994 |
| Median Household Income | 1,892 | $54,271 |
| Mean Household Income | 1,892 | $84,574 |
| Income Deficit | 1,458 | $0 |
| Wage / Income Gap (%) | 6,299 | 29.76% |
| Wage / Income Gap ($) | 6,299 | 70.24¢ per $1 |
| Gini / Inequality Index | 6,299 | 0.52 |
Earnings by Sex in Prospect Park borough
Average Earnings in Prospect Park borough are $32,917, $38,047 for men and $26,726 for women, a difference of 29.8%.
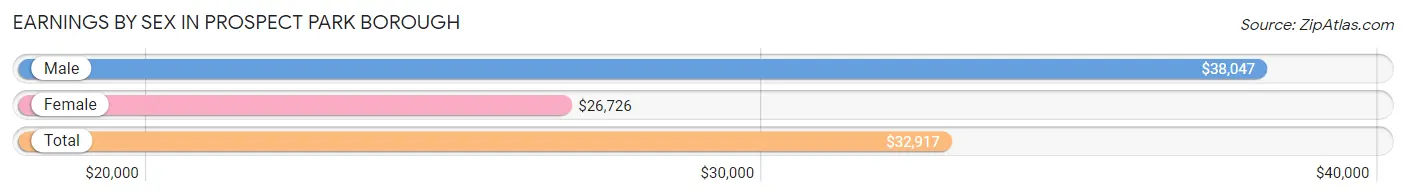
| Sex | Number | Average Earnings |
| Male | 1,568 (49.9%) | $38,047 |
| Female | 1,571 (50.0%) | $26,726 |
| Total | 3,139 (100.0%) | $32,917 |
Earnings by Sex by Income Bracket in Prospect Park borough
The most common earnings brackets in Prospect Park borough are $75,000 to $99,999 for men (213 | 13.6%) and $25,000 to $29,999 for women (216 | 13.8%).
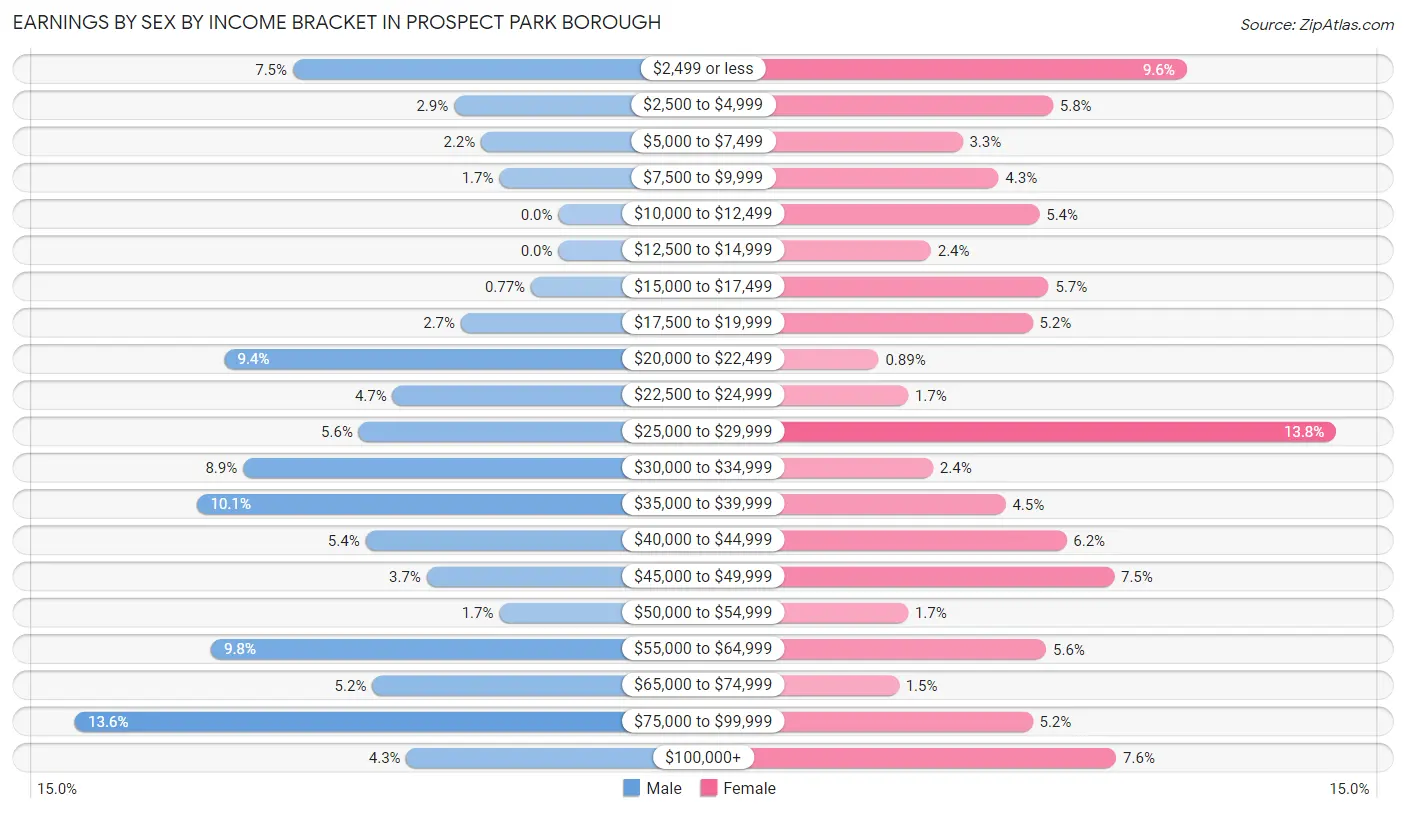
| Income | Male | Female |
| $2,499 or less | 117 (7.5%) | 150 (9.6%) |
| $2,500 to $4,999 | 46 (2.9%) | 91 (5.8%) |
| $5,000 to $7,499 | 34 (2.2%) | 51 (3.3%) |
| $7,500 to $9,999 | 26 (1.7%) | 67 (4.3%) |
| $10,000 to $12,499 | 0 (0.0%) | 85 (5.4%) |
| $12,500 to $14,999 | 0 (0.0%) | 37 (2.4%) |
| $15,000 to $17,499 | 12 (0.8%) | 89 (5.7%) |
| $17,500 to $19,999 | 43 (2.7%) | 82 (5.2%) |
| $20,000 to $22,499 | 147 (9.4%) | 14 (0.9%) |
| $22,500 to $24,999 | 73 (4.7%) | 27 (1.7%) |
| $25,000 to $29,999 | 88 (5.6%) | 216 (13.8%) |
| $30,000 to $34,999 | 139 (8.9%) | 38 (2.4%) |
| $35,000 to $39,999 | 159 (10.1%) | 70 (4.5%) |
| $40,000 to $44,999 | 85 (5.4%) | 97 (6.2%) |
| $45,000 to $49,999 | 58 (3.7%) | 118 (7.5%) |
| $50,000 to $54,999 | 26 (1.7%) | 27 (1.7%) |
| $55,000 to $64,999 | 153 (9.8%) | 88 (5.6%) |
| $65,000 to $74,999 | 82 (5.2%) | 23 (1.5%) |
| $75,000 to $99,999 | 213 (13.6%) | 82 (5.2%) |
| $100,000+ | 67 (4.3%) | 119 (7.6%) |
| Total | 1,568 (100.0%) | 1,571 (100.0%) |
Earnings by Sex by Educational Attainment in Prospect Park borough
Average earnings in Prospect Park borough are $41,988 for men and $38,170 for women, a difference of 9.1%. Men with an educational attainment of bachelor's degree enjoy the highest average annual earnings of $57,756, while those with graduate degree education earn the least with $36,645. Women with an educational attainment of bachelor's degree earn the most with the average annual earnings of $75,893, while those with high school diploma education have the smallest earnings of $26,773.
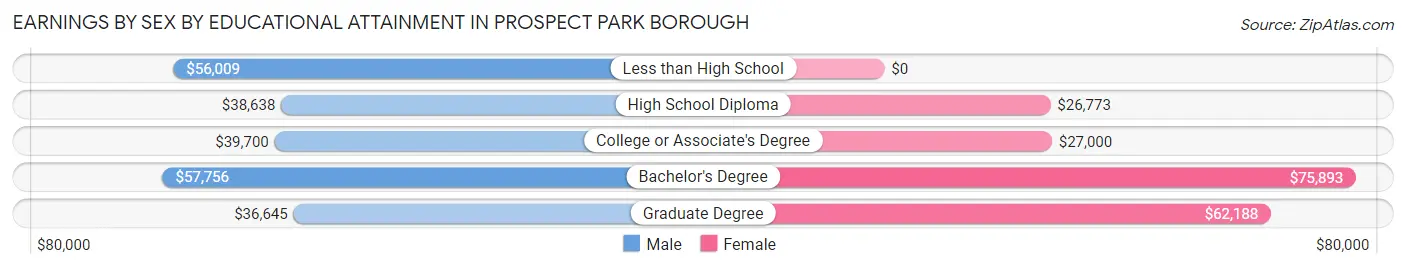
| Educational Attainment | Male Income | Female Income |
| Less than High School | $56,009 | $0 |
| High School Diploma | $38,638 | $26,773 |
| College or Associate's Degree | $39,700 | $27,000 |
| Bachelor's Degree | $57,756 | $75,893 |
| Graduate Degree | $36,645 | $62,188 |
| Total | $41,988 | $38,170 |
Family Income in Prospect Park borough
Family Income Brackets in Prospect Park borough
According to the Prospect Park borough family income data, there are 273 families falling into the $50,000 to $74,999 income range, which is the most common income bracket and makes up 18.7% of all families. Conversely, the $150,000 to $199,999 income bracket is the least frequent group with only 66 families (4.5%) belonging to this category.
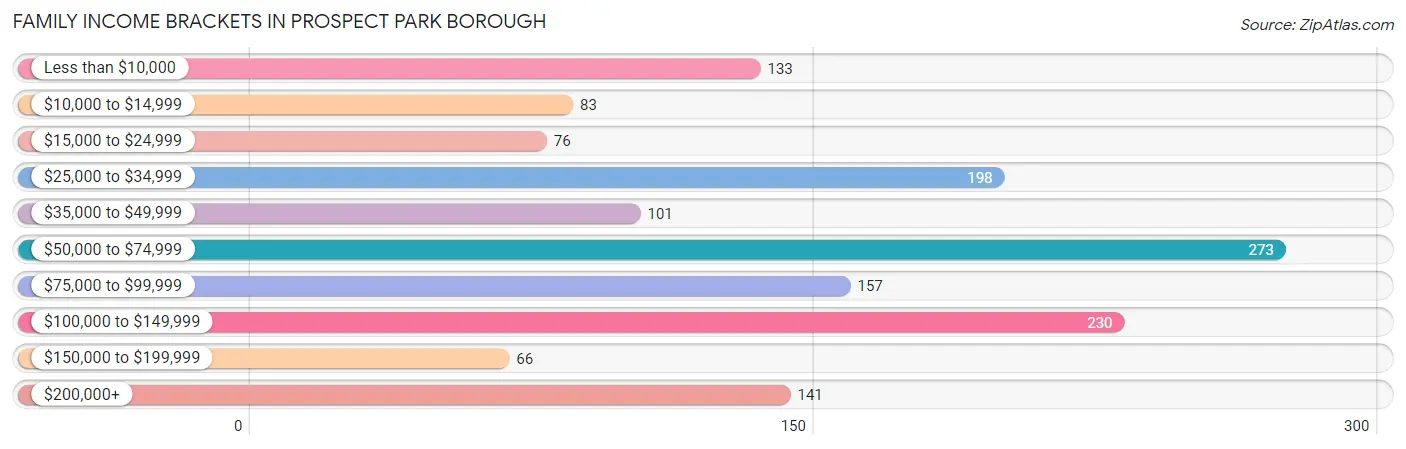
| Income Bracket | # Families | % Families |
| Less than $10,000 | 133 | 9.1% |
| $10,000 to $14,999 | 83 | 5.7% |
| $15,000 to $24,999 | 76 | 5.2% |
| $25,000 to $34,999 | 198 | 13.6% |
| $35,000 to $49,999 | 101 | 6.9% |
| $50,000 to $74,999 | 273 | 18.7% |
| $75,000 to $99,999 | 157 | 10.8% |
| $100,000 to $149,999 | 230 | 15.8% |
| $150,000 to $199,999 | 66 | 4.5% |
| $200,000+ | 141 | 9.7% |
Family Income by Famaliy Size in Prospect Park borough
7+ person families (76 | 5.2%) account for the highest median family income in Prospect Park borough with $250,001 per family, while 7+ person families (76 | 5.2%) have the highest median income of $35,714 per family member.
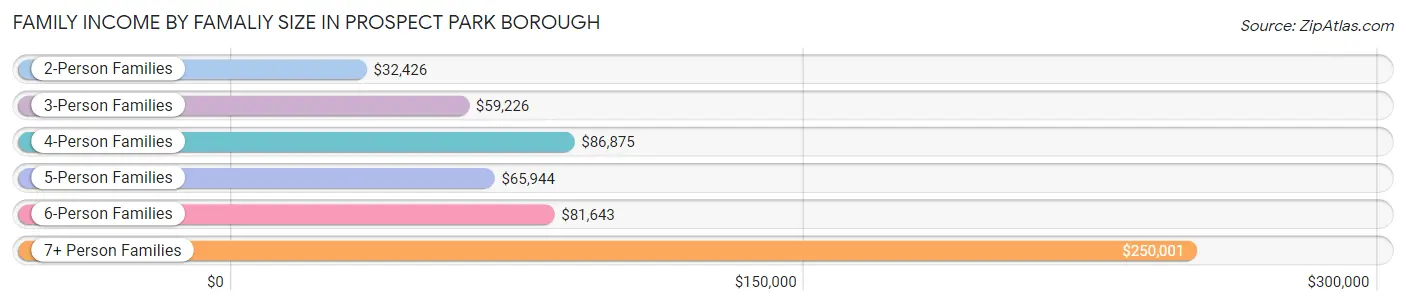
| Income Bracket | # Families | Median Income |
| 2-Person Families | 405 (27.8%) | $32,426 |
| 3-Person Families | 419 (28.7%) | $59,226 |
| 4-Person Families | 227 (15.6%) | $86,875 |
| 5-Person Families | 217 (14.9%) | $65,944 |
| 6-Person Families | 114 (7.8%) | $81,643 |
| 7+ Person Families | 76 (5.2%) | $250,001 |
| Total | 1,458 (100.0%) | $59,167 |
Family Income by Number of Earners in Prospect Park borough
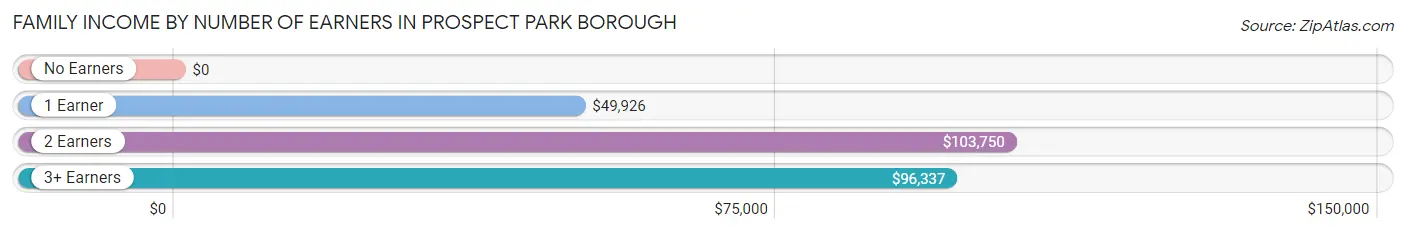
| Number of Earners | # Families | Median Income |
| No Earners | 300 (20.6%) | $0 |
| 1 Earner | 423 (29.0%) | $49,926 |
| 2 Earners | 337 (23.1%) | $103,750 |
| 3+ Earners | 398 (27.3%) | $96,337 |
| Total | 1,458 (100.0%) | $59,167 |
Household Income in Prospect Park borough
Household Income Brackets in Prospect Park borough
With 333 households falling in the category, the $100,000 to $149,999 income range is the most frequent in Prospect Park borough, accounting for 17.6% of all households. In contrast, only 51 households (2.7%) fall into the $150,000 to $199,999 income bracket, making it the least populous group.
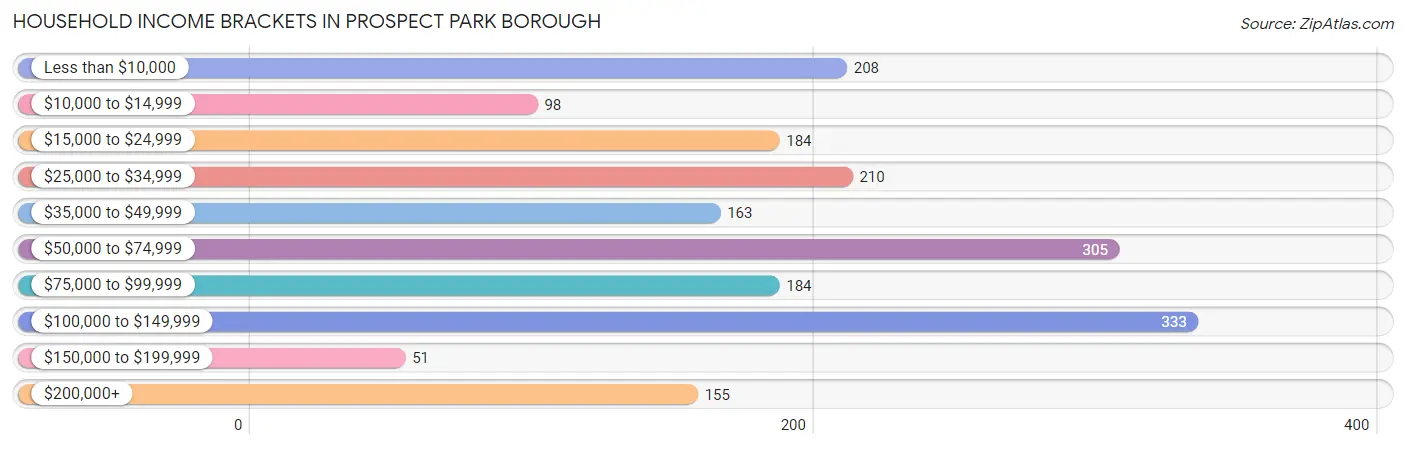
| Income Bracket | # Households | % Households |
| Less than $10,000 | 208 | 11.0% |
| $10,000 to $14,999 | 98 | 5.2% |
| $15,000 to $24,999 | 184 | 9.7% |
| $25,000 to $34,999 | 210 | 11.1% |
| $35,000 to $49,999 | 163 | 8.6% |
| $50,000 to $74,999 | 305 | 16.1% |
| $75,000 to $99,999 | 184 | 9.7% |
| $100,000 to $149,999 | 333 | 17.6% |
| $150,000 to $199,999 | 51 | 2.7% |
| $200,000+ | 155 | 8.2% |
Household Income by Householder Age in Prospect Park borough
The median household income in Prospect Park borough is $54,271, with the highest median household income of $58,095 found in the 45 to 64 years age bracket for the primary householder. A total of 958 households (50.6%) fall into this category. Meanwhile, the 15 to 24 years age bracket for the primary householder has the lowest median household income of $0, with 34 households (1.8%) in this group.
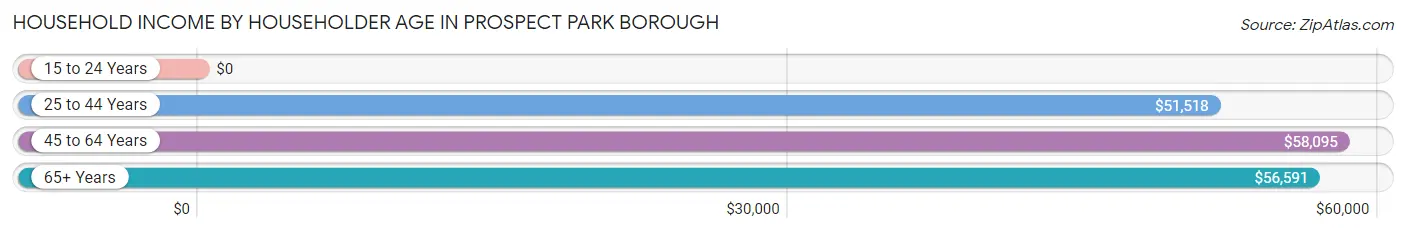
| Income Bracket | # Households | Median Income |
| 15 to 24 Years | 34 (1.8%) | $0 |
| 25 to 44 Years | 528 (27.9%) | $51,518 |
| 45 to 64 Years | 958 (50.6%) | $58,095 |
| 65+ Years | 372 (19.7%) | $56,591 |
| Total | 1,892 (100.0%) | $54,271 |
Poverty in Prospect Park borough
Income Below Poverty by Sex and Age in Prospect Park borough
With 11.4% poverty level for males and 23.6% for females among the residents of Prospect Park borough, 15 year old males and 12 to 14 year old females are the most vulnerable to poverty, with 65 males (39.9%) and 43 females (52.4%) in their respective age groups living below the poverty level.
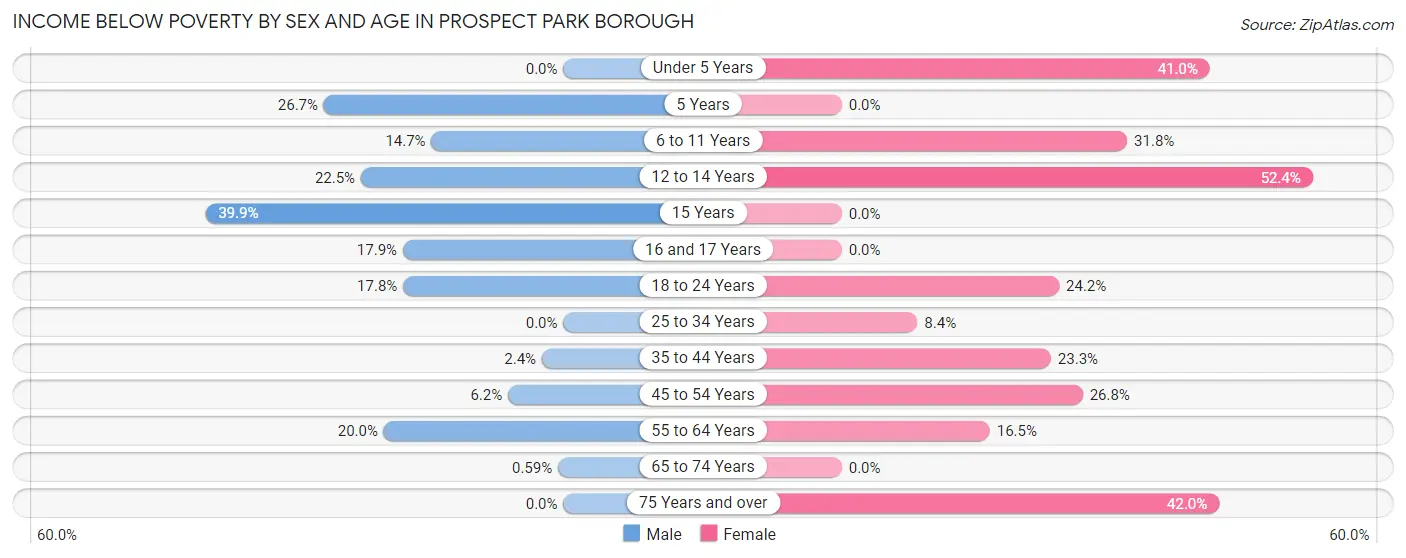
| Age Bracket | Male | Female |
| Under 5 Years | 0 (0.0%) | 84 (41.0%) |
| 5 Years | 12 (26.7%) | 0 (0.0%) |
| 6 to 11 Years | 21 (14.7%) | 75 (31.8%) |
| 12 to 14 Years | 39 (22.5%) | 43 (52.4%) |
| 15 Years | 65 (39.9%) | 0 (0.0%) |
| 16 and 17 Years | 42 (17.9%) | 0 (0.0%) |
| 18 to 24 Years | 71 (17.8%) | 98 (24.2%) |
| 25 to 34 Years | 0 (0.0%) | 23 (8.4%) |
| 35 to 44 Years | 11 (2.4%) | 119 (23.3%) |
| 45 to 54 Years | 18 (6.2%) | 132 (26.8%) |
| 55 to 64 Years | 87 (20.0%) | 60 (16.5%) |
| 65 to 74 Years | 1 (0.6%) | 0 (0.0%) |
| 75 Years and over | 0 (0.0%) | 79 (42.0%) |
| Total | 367 (11.4%) | 713 (23.6%) |
Income Above Poverty by Sex and Age in Prospect Park borough
According to the poverty statistics in Prospect Park borough, males aged under 5 years and females aged 5 years are the age groups that are most secure financially, with 100.0% of males and 100.0% of females in these age groups living above the poverty line.
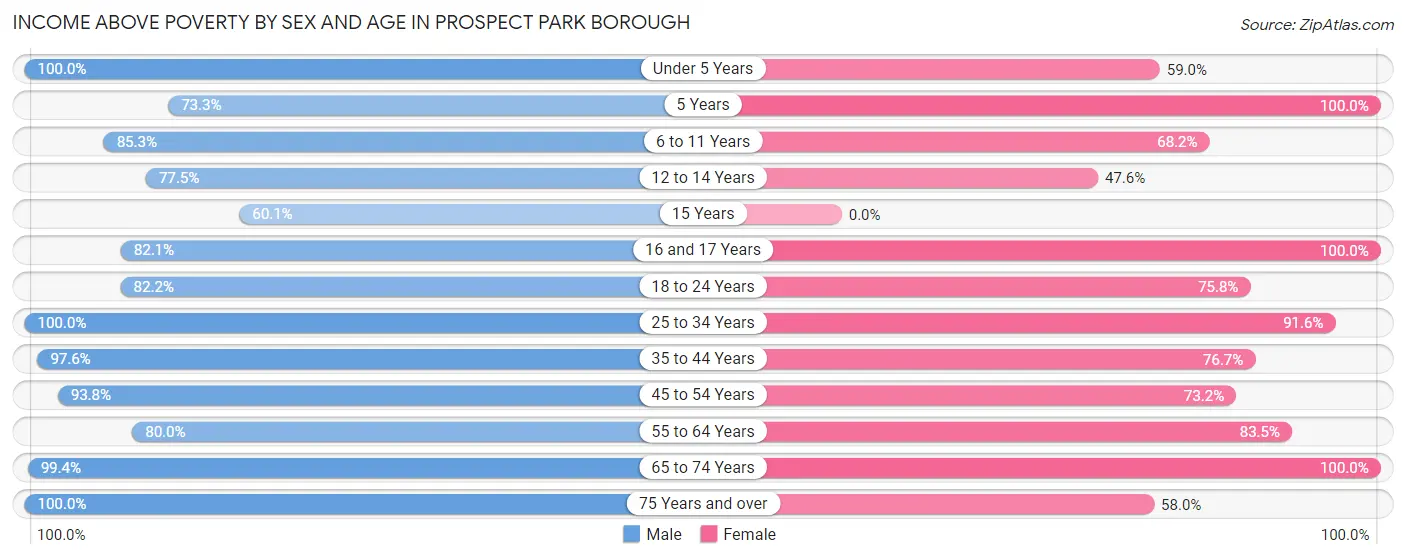
| Age Bracket | Male | Female |
| Under 5 Years | 272 (100.0%) | 121 (59.0%) |
| 5 Years | 33 (73.3%) | 35 (100.0%) |
| 6 to 11 Years | 122 (85.3%) | 161 (68.2%) |
| 12 to 14 Years | 134 (77.5%) | 39 (47.6%) |
| 15 Years | 98 (60.1%) | 0 (0.0%) |
| 16 and 17 Years | 193 (82.1%) | 75 (100.0%) |
| 18 to 24 Years | 327 (82.2%) | 307 (75.8%) |
| 25 to 34 Years | 314 (100.0%) | 250 (91.6%) |
| 35 to 44 Years | 449 (97.6%) | 392 (76.7%) |
| 45 to 54 Years | 274 (93.8%) | 360 (73.2%) |
| 55 to 64 Years | 348 (80.0%) | 304 (83.5%) |
| 65 to 74 Years | 169 (99.4%) | 151 (100.0%) |
| 75 Years and over | 116 (100.0%) | 109 (58.0%) |
| Total | 2,849 (88.6%) | 2,304 (76.4%) |
Income Below Poverty Among Married-Couple Families in Prospect Park borough
The poverty statistics for married-couple families in Prospect Park borough show that 1.7% or 11 of the total 655 families live below the poverty line. Families with no children have the highest poverty rate of 4.2%, comprising of 11 families. On the other hand, families with 1 or 2 children have the lowest poverty rate of 0.0%, which includes 0 families.
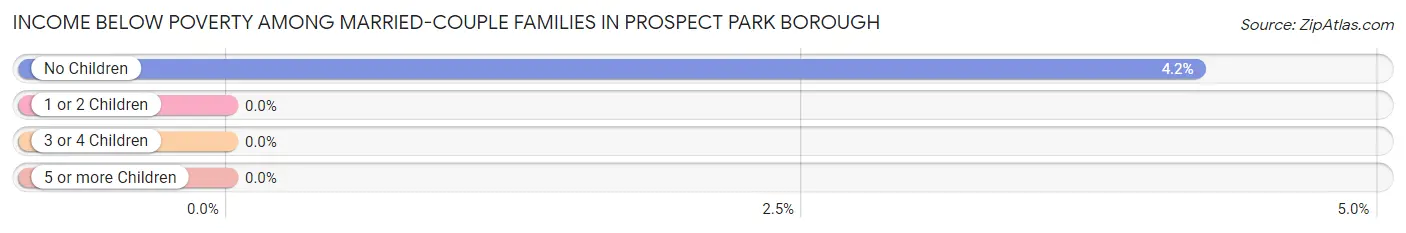
| Children | Above Poverty | Below Poverty |
| No Children | 250 (95.8%) | 11 (4.2%) |
| 1 or 2 Children | 230 (100.0%) | 0 (0.0%) |
| 3 or 4 Children | 164 (100.0%) | 0 (0.0%) |
| 5 or more Children | 0 (0.0%) | 0 (0.0%) |
| Total | 644 (98.3%) | 11 (1.7%) |
Income Below Poverty Among Single-Parent Households in Prospect Park borough
According to the poverty data in Prospect Park borough, 18.0% or 38 single-father households and 40.5% or 240 single-mother households are living below the poverty line. Among single-father households, those with 3 or 4 children have the highest poverty rate, with 11 households (100.0%) experiencing poverty. Likewise, among single-mother households, those with 3 or 4 children have the highest poverty rate, with 34 households (72.3%) falling below the poverty line.
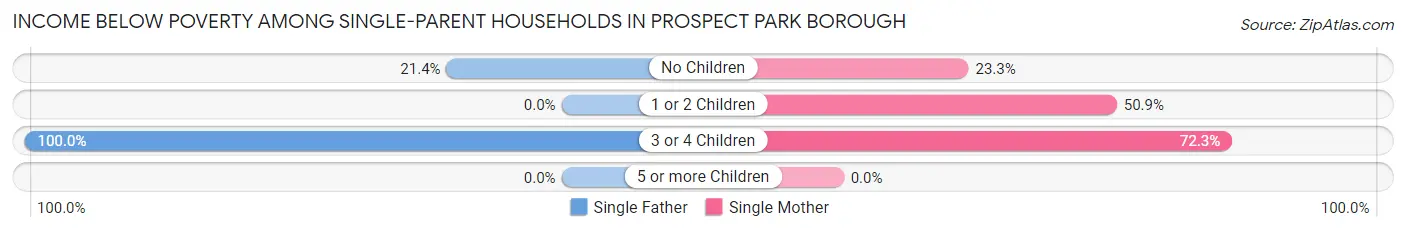
| Children | Single Father | Single Mother |
| No Children | 27 (21.4%) | 60 (23.3%) |
| 1 or 2 Children | 0 (0.0%) | 146 (50.9%) |
| 3 or 4 Children | 11 (100.0%) | 34 (72.3%) |
| 5 or more Children | 0 (0.0%) | 0 (0.0%) |
| Total | 38 (18.0%) | 240 (40.5%) |
Income Below Poverty Among Married-Couple vs Single-Parent Households in Prospect Park borough
The poverty data for Prospect Park borough shows that 11 of the married-couple family households (1.7%) and 278 of the single-parent households (34.6%) are living below the poverty level. Within the married-couple family households, those with no children have the highest poverty rate, with 11 households (4.2%) falling below the poverty line. Among the single-parent households, those with 3 or 4 children have the highest poverty rate, with 45 household (77.6%) living below poverty.
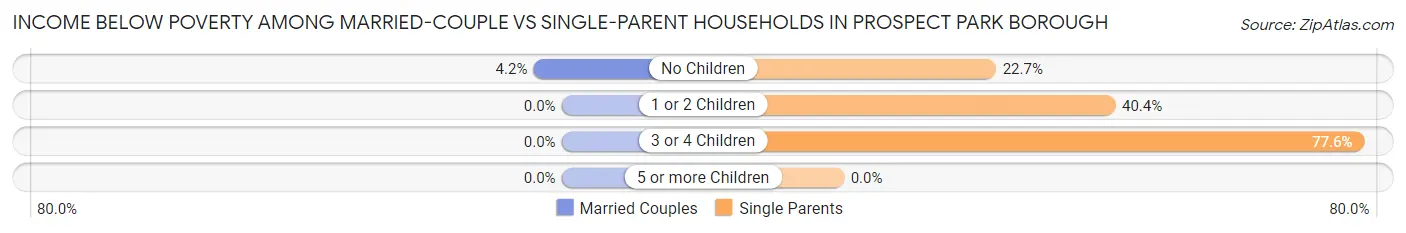
| Children | Married-Couple Families | Single-Parent Households |
| No Children | 11 (4.2%) | 87 (22.7%) |
| 1 or 2 Children | 0 (0.0%) | 146 (40.4%) |
| 3 or 4 Children | 0 (0.0%) | 45 (77.6%) |
| 5 or more Children | 0 (0.0%) | 0 (0.0%) |
| Total | 11 (1.7%) | 278 (34.6%) |
Race in Prospect Park borough
The most populous races in Prospect Park borough are Hispanic or Latino (3,527 | 56.0%), White / Caucasian (3,360 | 53.3%), and Black / African American (1,078 | 17.1%).
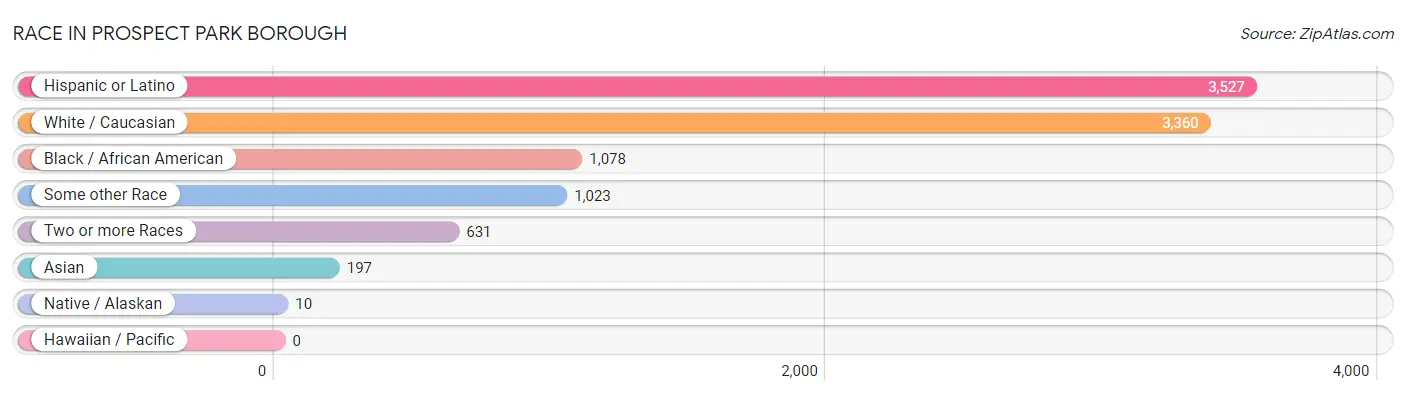
| Race | # Population | % Population |
| Asian | 197 | 3.1% |
| Black / African American | 1,078 | 17.1% |
| Hawaiian / Pacific | 0 | 0.0% |
| Hispanic or Latino | 3,527 | 56.0% |
| Native / Alaskan | 10 | 0.2% |
| White / Caucasian | 3,360 | 53.3% |
| Two or more Races | 631 | 10.0% |
| Some other Race | 1,023 | 16.2% |
| Total | 6,299 | 100.0% |
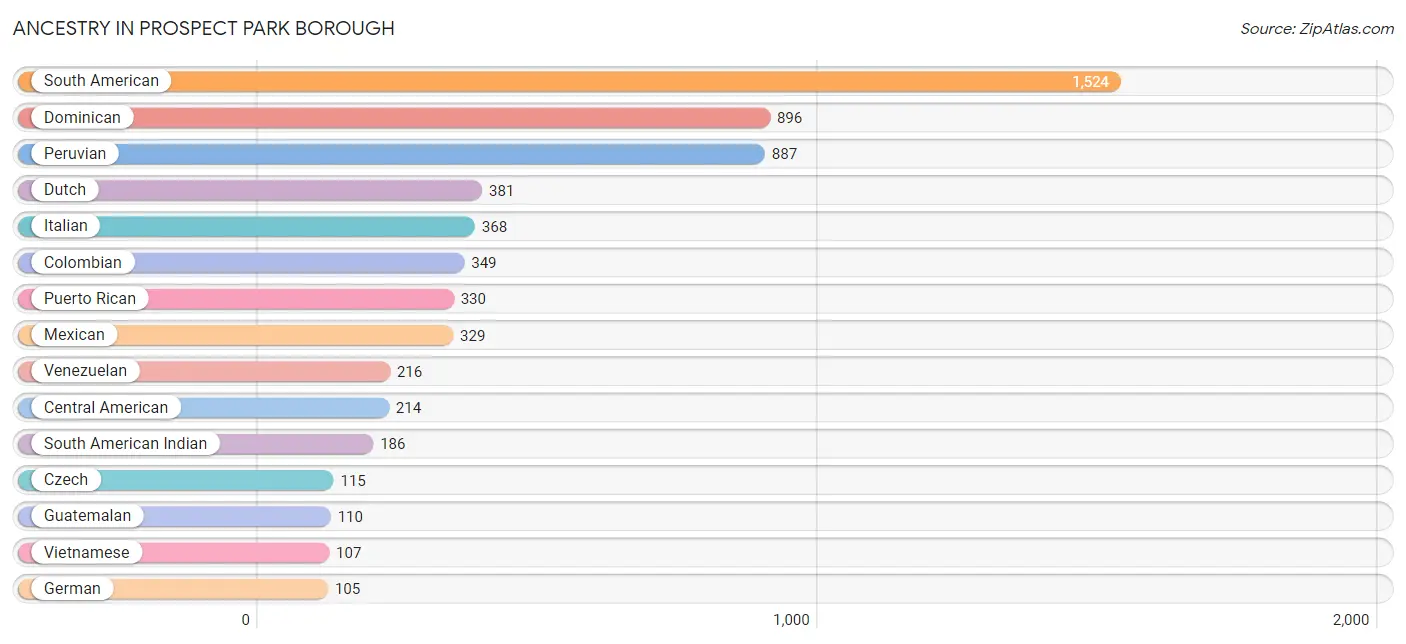
Ancestry in Prospect Park borough
The most populous ancestries reported in Prospect Park borough are South American (1,524 | 24.2%), Dominican (896 | 14.2%), Peruvian (887 | 14.1%), Dutch (381 | 6.0%), and Italian (368 | 5.8%), together accounting for 64.4% of all Prospect Park borough residents.
| Ancestry | # Population | % Population |
| African | 58 | 0.9% |
| Albanian | 98 | 1.6% |
| American | 96 | 1.5% |
| Arab | 74 | 1.2% |
| British | 13 | 0.2% |
| Central American | 214 | 3.4% |
| Central American Indian | 40 | 0.6% |
| Colombian | 349 | 5.5% |
| Costa Rican | 89 | 1.4% |
| Cuban | 31 | 0.5% |
| Czech | 115 | 1.8% |
| Dominican | 896 | 14.2% |
| Dutch | 381 | 6.0% |
| Ecuadorian | 72 | 1.1% |
| English | 28 | 0.4% |
| French | 88 | 1.4% |
| German | 105 | 1.7% |
| Guatemalan | 110 | 1.8% |
| Haitian | 103 | 1.6% |
| Indian (Asian) | 22 | 0.4% |
| Irish | 82 | 1.3% |
| Israeli | 1 | 0.0% |
| Italian | 368 | 5.8% |
| Jamaican | 15 | 0.2% |
| Jordanian | 31 | 0.5% |
| Lebanese | 18 | 0.3% |
| Lithuanian | 6 | 0.1% |
| Mexican | 329 | 5.2% |
| Palestinian | 25 | 0.4% |
| Peruvian | 887 | 14.1% |
| Polish | 35 | 0.6% |
| Puerto Rican | 330 | 5.2% |
| Salvadoran | 15 | 0.2% |
| Scottish | 26 | 0.4% |
| South American | 1,524 | 24.2% |
| South American Indian | 186 | 2.9% |
| Spanish | 37 | 0.6% |
| Subsaharan African | 58 | 0.9% |
| Thai | 68 | 1.1% |
| Turkish | 12 | 0.2% |
| Venezuelan | 216 | 3.4% |
| Vietnamese | 107 | 1.7% |
| West Indian | 35 | 0.6% | View All 43 Rows |
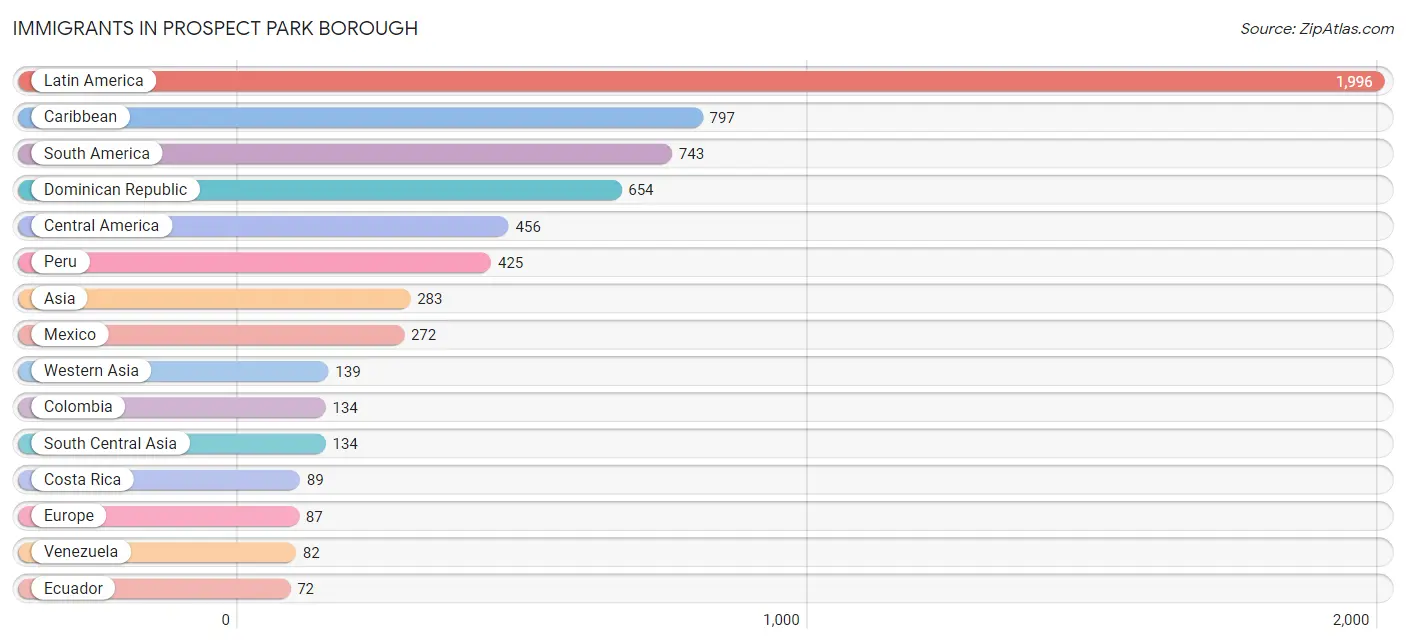
Immigrants in Prospect Park borough
The most numerous immigrant groups reported in Prospect Park borough came from Latin America (1,996 | 31.7%), Caribbean (797 | 12.7%), South America (743 | 11.8%), Dominican Republic (654 | 10.4%), and Central America (456 | 7.2%), together accounting for 73.8% of all Prospect Park borough residents.
| Immigration Origin | # Population | % Population |
| Africa | 29 | 0.5% |
| Asia | 283 | 4.5% |
| Bahamas | 24 | 0.4% |
| Bangladesh | 66 | 1.1% |
| Brazil | 22 | 0.4% |
| Caribbean | 797 | 12.7% |
| Central America | 456 | 7.2% |
| China | 10 | 0.2% |
| Colombia | 134 | 2.1% |
| Costa Rica | 89 | 1.4% |
| Cuba | 31 | 0.5% |
| Dominica | 20 | 0.3% |
| Dominican Republic | 654 | 10.4% |
| Eastern Africa | 29 | 0.5% |
| Eastern Asia | 10 | 0.2% |
| Eastern Europe | 38 | 0.6% |
| Ecuador | 72 | 1.1% |
| England | 49 | 0.8% |
| Europe | 87 | 1.4% |
| Guatemala | 51 | 0.8% |
| Guyana | 4 | 0.1% |
| Haiti | 44 | 0.7% |
| Honduras | 44 | 0.7% |
| India | 68 | 1.1% |
| Jamaica | 24 | 0.4% |
| Jordan | 55 | 0.9% |
| Kenya | 29 | 0.5% |
| Latin America | 1,996 | 31.7% |
| Lebanon | 18 | 0.3% |
| Mexico | 272 | 4.3% |
| North Macedonia | 38 | 0.6% |
| Northern Europe | 49 | 0.8% |
| Peru | 425 | 6.8% |
| South America | 743 | 11.8% |
| South Central Asia | 134 | 2.1% |
| Syria | 66 | 1.1% |
| Venezuela | 82 | 1.3% |
| Western Asia | 139 | 2.2% | View All 38 Rows |
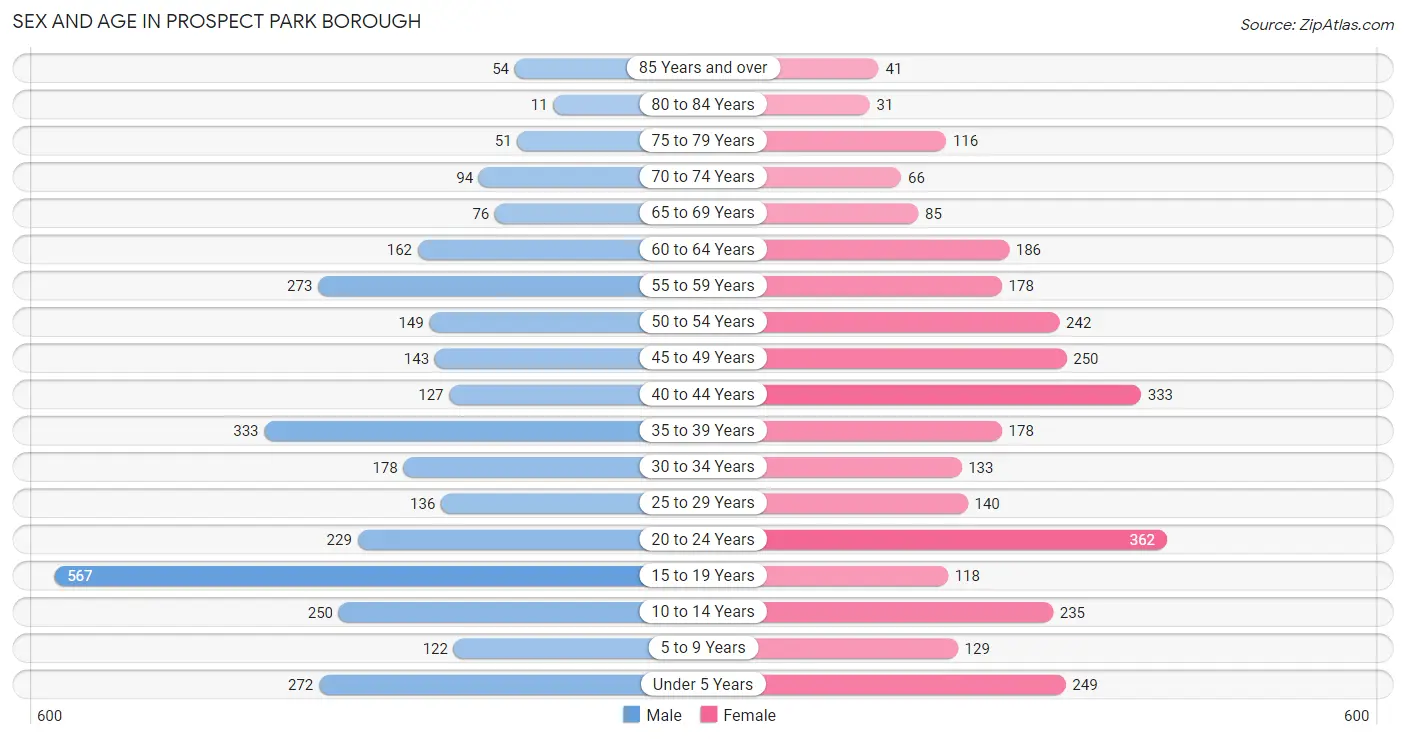
Sex and Age in Prospect Park borough
Sex and Age in Prospect Park borough
The most populous age groups in Prospect Park borough are 15 to 19 Years (567 | 17.6%) for men and 20 to 24 Years (362 | 11.8%) for women.
| Age Bracket | Male | Female |
| Under 5 Years | 272 (8.4%) | 249 (8.1%) |
| 5 to 9 Years | 122 (3.8%) | 129 (4.2%) |
| 10 to 14 Years | 250 (7.7%) | 235 (7.6%) |
| 15 to 19 Years | 567 (17.6%) | 118 (3.8%) |
| 20 to 24 Years | 229 (7.1%) | 362 (11.8%) |
| 25 to 29 Years | 136 (4.2%) | 140 (4.6%) |
| 30 to 34 Years | 178 (5.5%) | 133 (4.3%) |
| 35 to 39 Years | 333 (10.3%) | 178 (5.8%) |
| 40 to 44 Years | 127 (3.9%) | 333 (10.8%) |
| 45 to 49 Years | 143 (4.4%) | 250 (8.1%) |
| 50 to 54 Years | 149 (4.6%) | 242 (7.9%) |
| 55 to 59 Years | 273 (8.5%) | 178 (5.8%) |
| 60 to 64 Years | 162 (5.0%) | 186 (6.0%) |
| 65 to 69 Years | 76 (2.4%) | 85 (2.8%) |
| 70 to 74 Years | 94 (2.9%) | 66 (2.1%) |
| 75 to 79 Years | 51 (1.6%) | 116 (3.8%) |
| 80 to 84 Years | 11 (0.3%) | 31 (1.0%) |
| 85 Years and over | 54 (1.7%) | 41 (1.3%) |
| Total | 3,227 (100.0%) | 3,072 (100.0%) |
Families and Households in Prospect Park borough
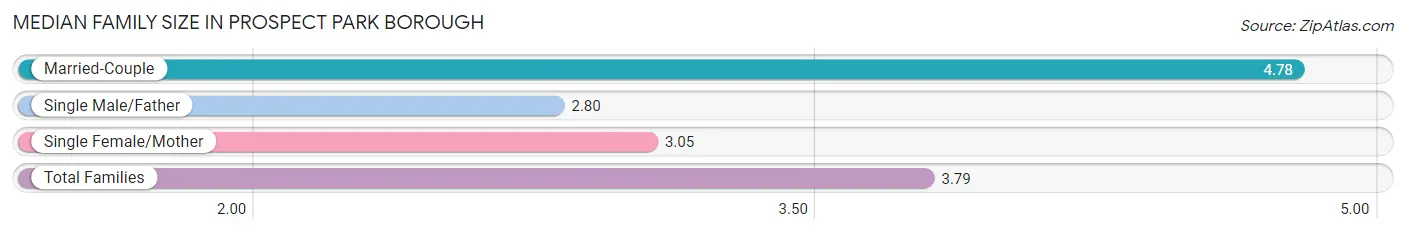
Median Family Size in Prospect Park borough
The median family size in Prospect Park borough is 3.79 persons per family, with married-couple families (655 | 44.9%) accounting for the largest median family size of 4.78 persons per family. On the other hand, single male/father families (211 | 14.5%) represent the smallest median family size with 2.80 persons per family.
| Family Type | # Families | Family Size |
| Married-Couple | 655 (44.9%) | 4.78 |
| Single Male/Father | 211 (14.5%) | 2.80 |
| Single Female/Mother | 592 (40.6%) | 3.05 |
| Total Families | 1,458 (100.0%) | 3.79 |
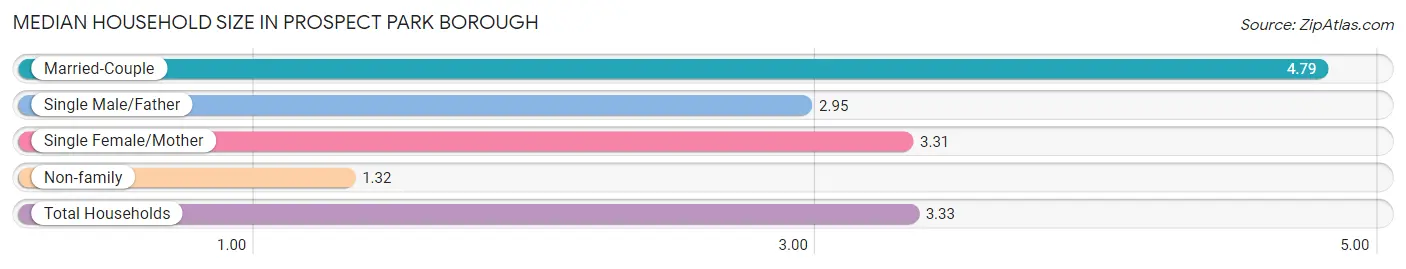
Median Household Size in Prospect Park borough
The median household size in Prospect Park borough is 3.33 persons per household, with married-couple households (655 | 34.6%) accounting for the largest median household size of 4.79 persons per household. non-family households (434 | 22.9%) represent the smallest median household size with 1.32 persons per household.
| Household Type | # Households | Household Size |
| Married-Couple | 655 (34.6%) | 4.79 |
| Single Male/Father | 211 (11.2%) | 2.95 |
| Single Female/Mother | 592 (31.3%) | 3.31 |
| Non-family | 434 (22.9%) | 1.32 |
| Total Households | 1,892 (100.0%) | 3.33 |
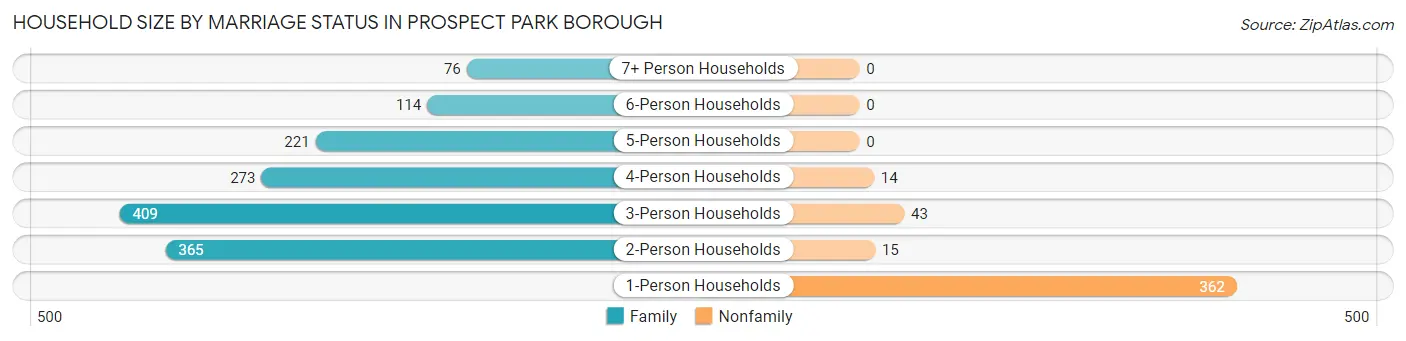
Household Size by Marriage Status in Prospect Park borough
Out of a total of 1,892 households in Prospect Park borough, 1,458 (77.1%) are family households, while 434 (22.9%) are nonfamily households. The most numerous type of family households are 3-person households, comprising 409, and the most common type of nonfamily households are 1-person households, comprising 362.
| Household Size | Family Households | Nonfamily Households |
| 1-Person Households | - | 362 (19.1%) |
| 2-Person Households | 365 (19.3%) | 15 (0.8%) |
| 3-Person Households | 409 (21.6%) | 43 (2.3%) |
| 4-Person Households | 273 (14.4%) | 14 (0.7%) |
| 5-Person Households | 221 (11.7%) | 0 (0.0%) |
| 6-Person Households | 114 (6.0%) | 0 (0.0%) |
| 7+ Person Households | 76 (4.0%) | 0 (0.0%) |
| Total | 1,458 (77.1%) | 434 (22.9%) |
Female Fertility in Prospect Park borough
Fertility by Age in Prospect Park borough
Average fertility rate in Prospect Park borough is 45.0 births per 1,000 women. Women in the age bracket of 20 to 34 years have the highest fertility rate with 94.0 births per 1,000 women. Women in the age bracket of 20 to 34 years acount for 85.7% of all women with births.
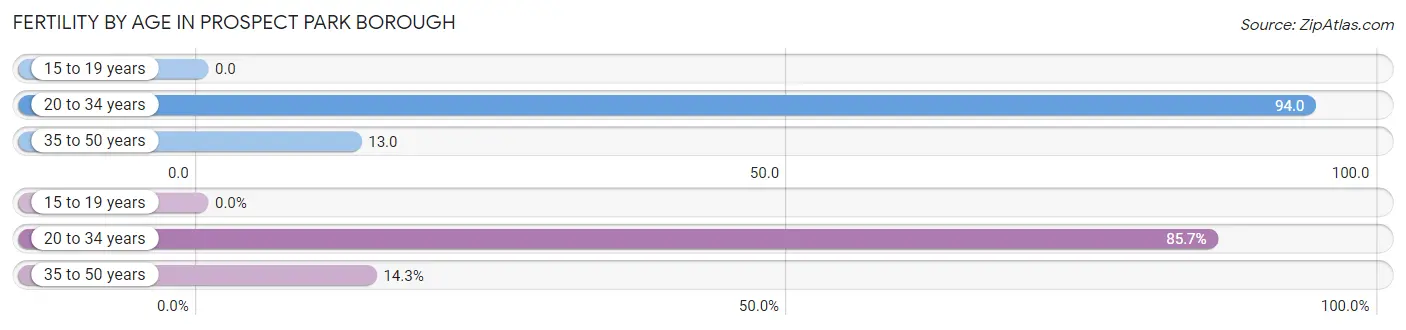
| Age Bracket | Women with Births | Births / 1,000 Women |
| 15 to 19 years | 0 (0.0%) | 0.0 |
| 20 to 34 years | 60 (85.7%) | 94.0 |
| 35 to 50 years | 10 (14.3%) | 13.0 |
| Total | 70 (100.0%) | 45.0 |
Fertility by Age by Marriage Status in Prospect Park borough
67.1% of women with births (70) in Prospect Park borough are married. The highest percentage of unmarried women with births falls into 35 to 50 years age bracket with 100.0% of them unmarried at the time of birth, while the lowest percentage of unmarried women with births belong to 20 to 34 years age bracket with 21.7% of them unmarried.
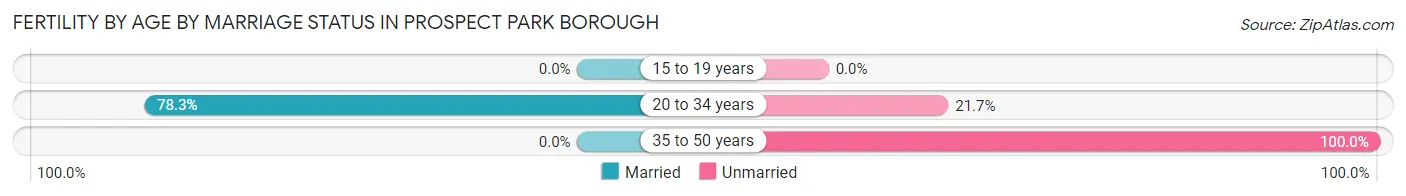
| Age Bracket | Married | Unmarried |
| 15 to 19 years | 0 (0.0%) | 0 (0.0%) |
| 20 to 34 years | 47 (78.3%) | 13 (21.7%) |
| 35 to 50 years | 0 (0.0%) | 10 (100.0%) |
| Total | 47 (67.1%) | 23 (32.9%) |
Fertility by Education in Prospect Park borough
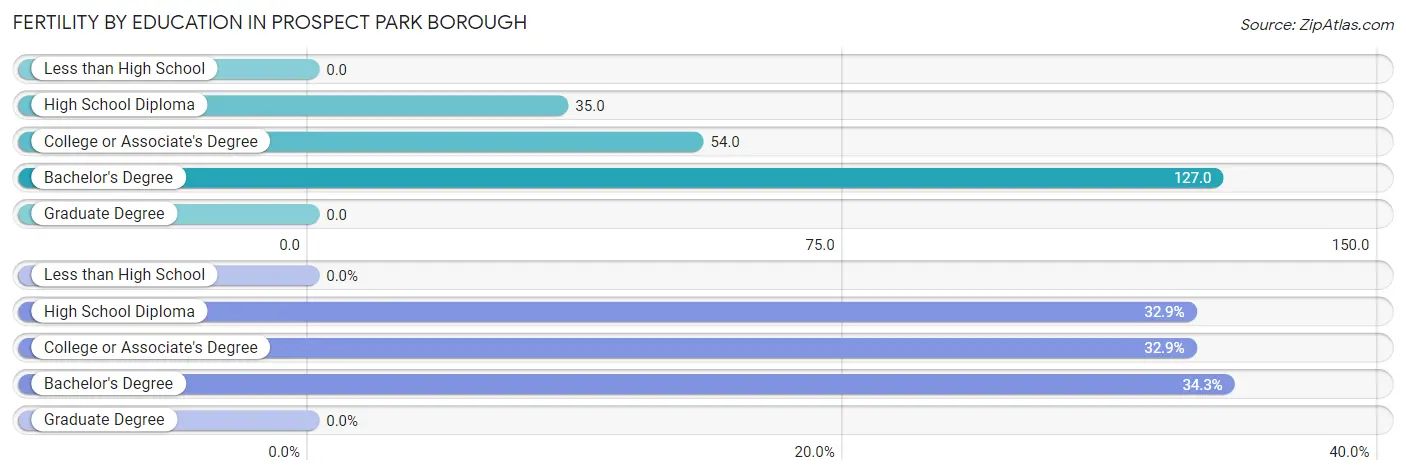
| Educational Attainment | Women with Births | Births / 1,000 Women |
| Less than High School | 0 (0.0%) | 0.0 |
| High School Diploma | 23 (32.9%) | 35.0 |
| College or Associate's Degree | 23 (32.9%) | 54.0 |
| Bachelor's Degree | 24 (34.3%) | 127.0 |
| Graduate Degree | 0 (0.0%) | 0.0 |
| Total | 70 (100.0%) | 45.0 |
Fertility by Education by Marriage Status in Prospect Park borough
32.9% of women with births in Prospect Park borough are unmarried. Women with the educational attainment of high school diploma are most likely to be married with 100.0% of them married at childbirth, while women with the educational attainment of college or associate's degree are least likely to be married with 100.0% of them unmarried at childbirth.
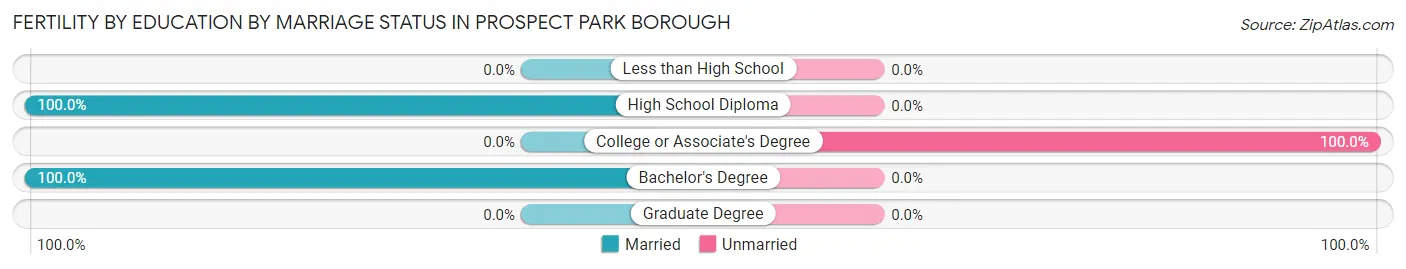
| Educational Attainment | Married | Unmarried |
| Less than High School | 0 (0.0%) | 0 (0.0%) |
| High School Diploma | 23 (100.0%) | 0 (0.0%) |
| College or Associate's Degree | 0 (0.0%) | 23 (100.0%) |
| Bachelor's Degree | 24 (100.0%) | 0 (0.0%) |
| Graduate Degree | 0 (0.0%) | 0 (0.0%) |
| Total | 47 (67.1%) | 23 (32.9%) |
Employment Characteristics in Prospect Park borough
Employment by Class of Employer in Prospect Park borough
Among the 2,812 employed individuals in Prospect Park borough, private company employees (2,070 | 73.6%), not-for-profit organizations (264 | 9.4%), and local government employees (203 | 7.2%) make up the most common classes of employment.
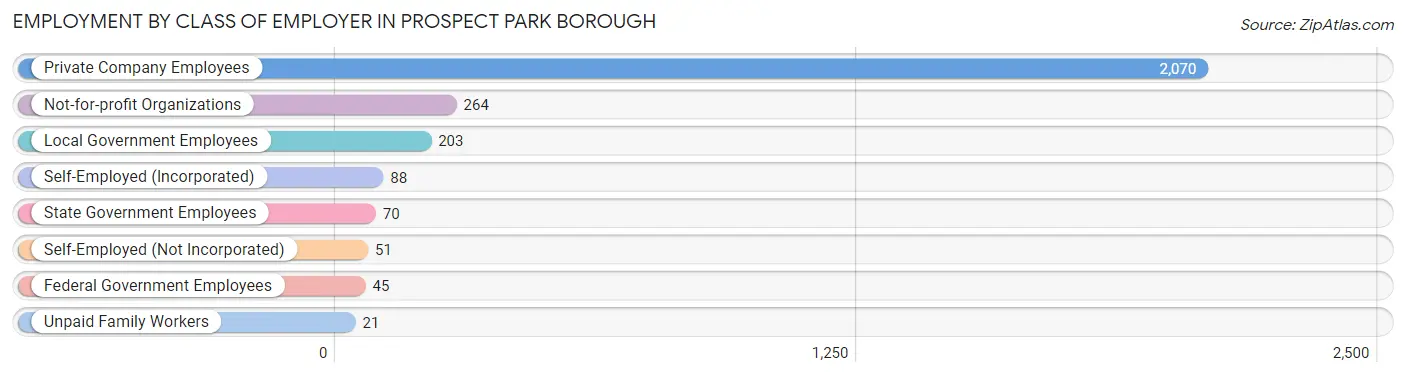
| Employer Class | # Employees | % Employees |
| Private Company Employees | 2,070 | 73.6% |
| Self-Employed (Incorporated) | 88 | 3.1% |
| Self-Employed (Not Incorporated) | 51 | 1.8% |
| Not-for-profit Organizations | 264 | 9.4% |
| Local Government Employees | 203 | 7.2% |
| State Government Employees | 70 | 2.5% |
| Federal Government Employees | 45 | 1.6% |
| Unpaid Family Workers | 21 | 0.7% |
| Total | 2,812 | 100.0% |
Employment Status by Age in Prospect Park borough
According to the labor force statistics for Prospect Park borough, out of the total population over 16 years of age (4,879), 64.8% or 3,162 individuals are in the labor force, with 9.0% or 285 of them unemployed. The age group with the highest labor force participation rate is 30 to 34 years, with 89.7% or 279 individuals in the labor force. Within the labor force, the 75 years and over age range has the highest percentage of unemployed individuals, with 32.4% or 11 of them being unemployed.
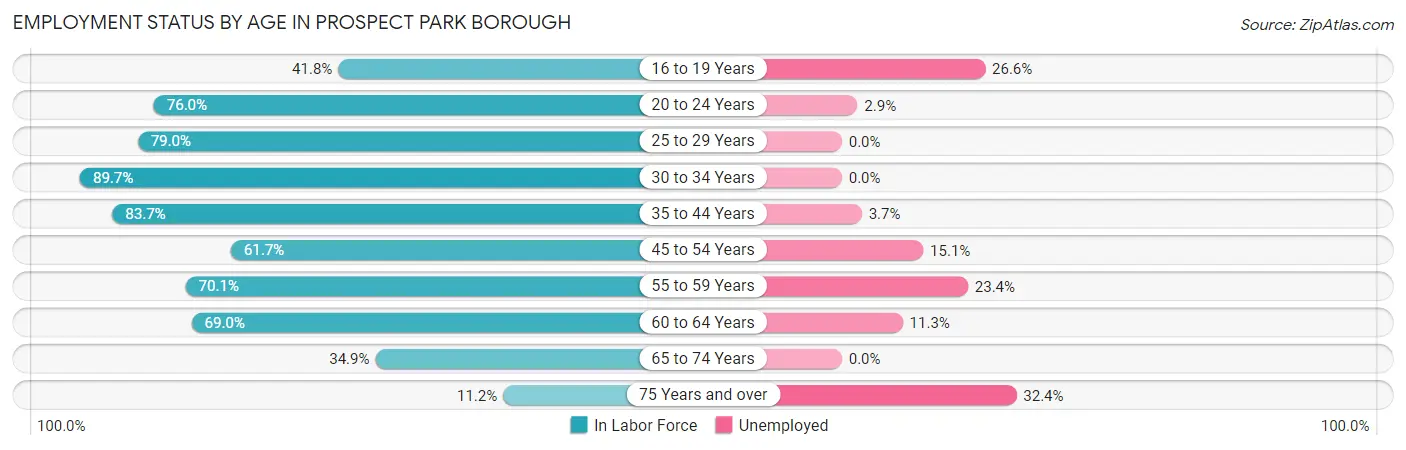
| Age Bracket | In Labor Force | Unemployed |
| 16 to 19 Years | 218 (41.8%) | 58 (26.6%) |
| 20 to 24 Years | 449 (76.0%) | 13 (2.9%) |
| 25 to 29 Years | 218 (79.0%) | 0 (0.0%) |
| 30 to 34 Years | 279 (89.7%) | 0 (0.0%) |
| 35 to 44 Years | 813 (83.7%) | 30 (3.7%) |
| 45 to 54 Years | 484 (61.7%) | 73 (15.1%) |
| 55 to 59 Years | 316 (70.1%) | 74 (23.4%) |
| 60 to 64 Years | 240 (69.0%) | 27 (11.3%) |
| 65 to 74 Years | 112 (34.9%) | 0 (0.0%) |
| 75 Years and over | 34 (11.2%) | 11 (32.4%) |
| Total | 3,162 (64.8%) | 285 (9.0%) |
Employment Status by Educational Attainment in Prospect Park borough
According to labor force statistics for Prospect Park borough, 74.8% of individuals (2,349) out of the total population between 25 and 64 years of age (3,141) are in the labor force, with 8.7% or 204 of them being unemployed. The group with the highest labor force participation rate are those with the educational attainment of bachelor's degree or higher, with 90.6% or 686 individuals in the labor force. Within the labor force, individuals with high school diploma education have the highest percentage of unemployment, with 12.4% or 101 of them being unemployed.
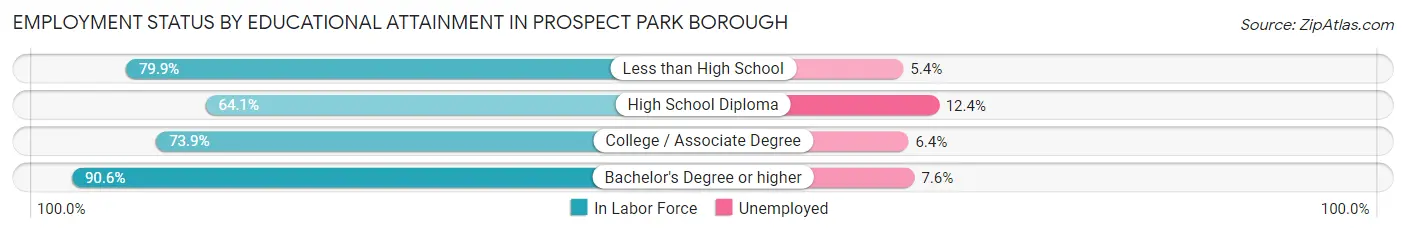
| Educational Attainment | In Labor Force | Unemployed |
| Less than High School | 350 (79.9%) | 24 (5.4%) |
| High School Diploma | 815 (64.1%) | 158 (12.4%) |
| College / Associate Degree | 499 (73.9%) | 43 (6.4%) |
| Bachelor's Degree or higher | 686 (90.6%) | 58 (7.6%) |
| Total | 2,349 (74.8%) | 273 (8.7%) |
Employment Occupations by Sex in Prospect Park borough
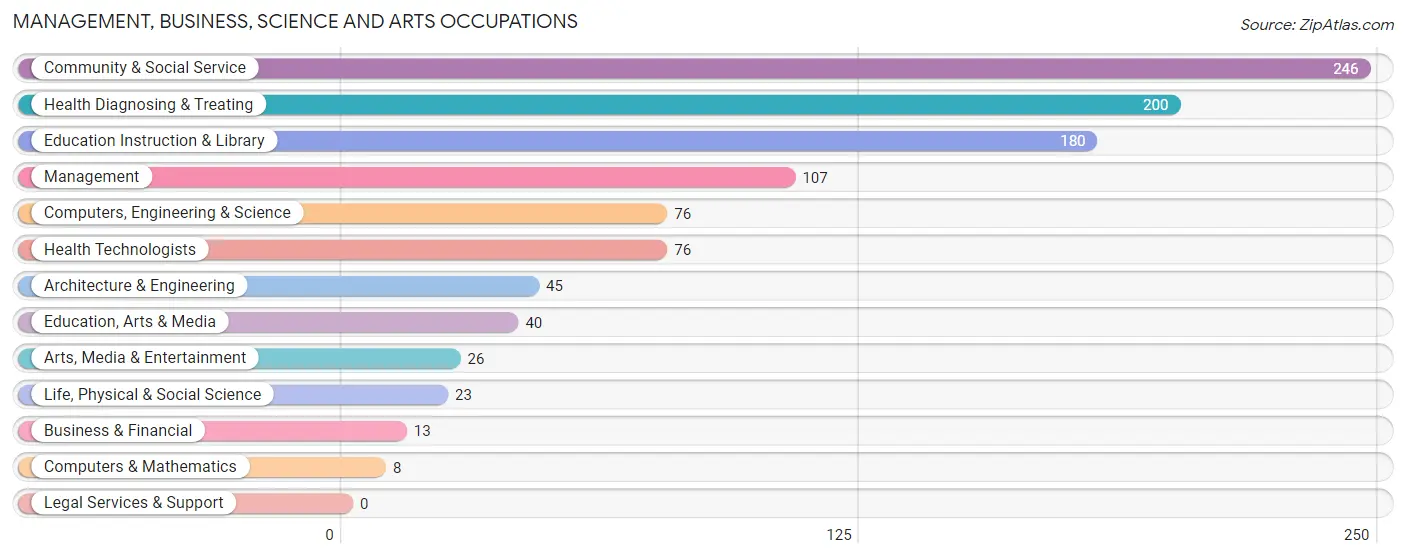
Management, Business, Science and Arts Occupations
The most common Management, Business, Science and Arts occupations in Prospect Park borough are Community & Social Service (246 | 8.6%), Health Diagnosing & Treating (200 | 7.0%), Education Instruction & Library (180 | 6.3%), Management (107 | 3.7%), and Computers, Engineering & Science (76 | 2.6%).
Management, Business, Science and Arts Occupations by Sex
Within the Management, Business, Science and Arts occupations in Prospect Park borough, the most male-oriented occupations are Computers & Mathematics (100.0%), Architecture & Engineering (100.0%), and Arts, Media & Entertainment (100.0%), while the most female-oriented occupations are Business & Financial (100.0%), Life, Physical & Social Science (100.0%), and Education, Arts & Media (97.5%).
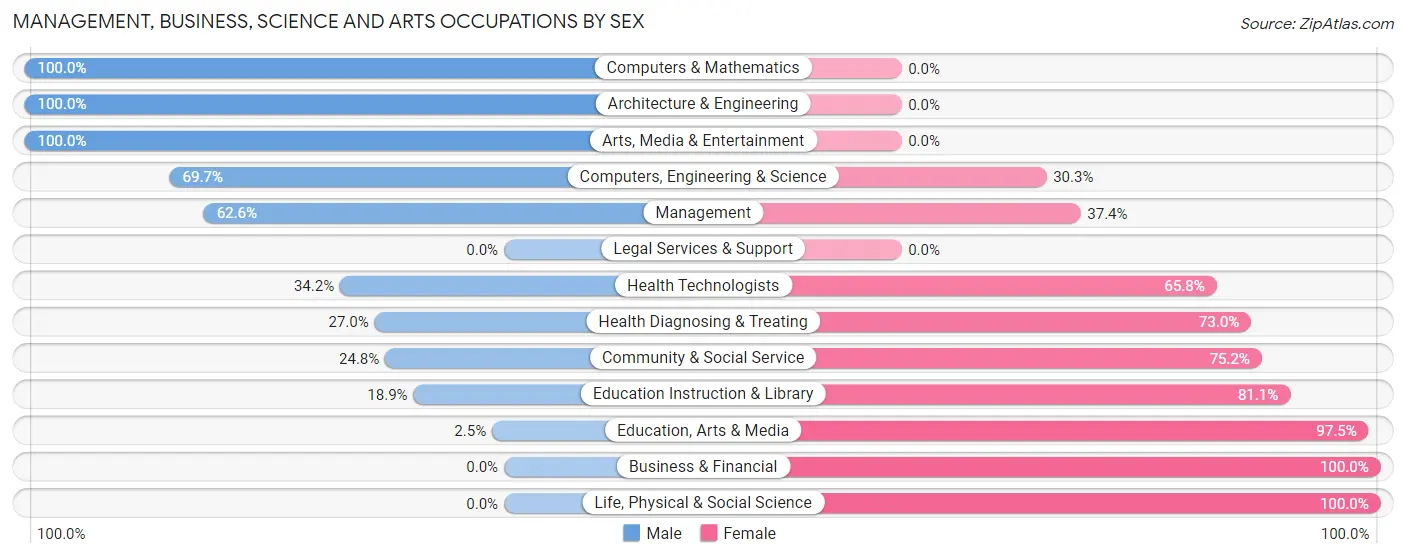
| Occupation | Male | Female |
| Management | 67 (62.6%) | 40 (37.4%) |
| Business & Financial | 0 (0.0%) | 13 (100.0%) |
| Computers, Engineering & Science | 53 (69.7%) | 23 (30.3%) |
| Computers & Mathematics | 8 (100.0%) | 0 (0.0%) |
| Architecture & Engineering | 45 (100.0%) | 0 (0.0%) |
| Life, Physical & Social Science | 0 (0.0%) | 23 (100.0%) |
| Community & Social Service | 61 (24.8%) | 185 (75.2%) |
| Education, Arts & Media | 1 (2.5%) | 39 (97.5%) |
| Legal Services & Support | 0 (0.0%) | 0 (0.0%) |
| Education Instruction & Library | 34 (18.9%) | 146 (81.1%) |
| Arts, Media & Entertainment | 26 (100.0%) | 0 (0.0%) |
| Health Diagnosing & Treating | 54 (27.0%) | 146 (73.0%) |
| Health Technologists | 26 (34.2%) | 50 (65.8%) |
| Total (Category) | 235 (36.6%) | 407 (63.4%) |
| Total (Overall) | 1,498 (52.1%) | 1,379 (47.9%) |
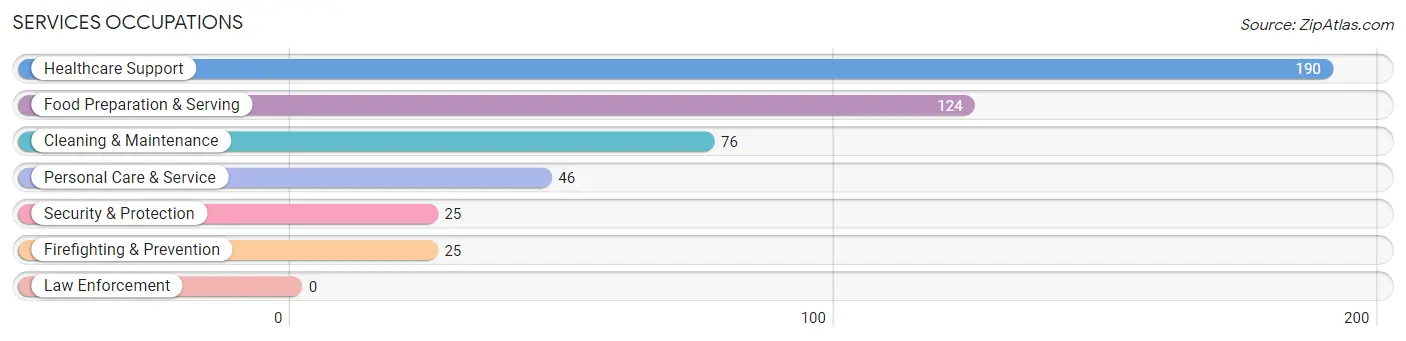
Services Occupations
The most common Services occupations in Prospect Park borough are Healthcare Support (190 | 6.6%), Food Preparation & Serving (124 | 4.3%), Cleaning & Maintenance (76 | 2.6%), Personal Care & Service (46 | 1.6%), and Security & Protection (25 | 0.9%).
Services Occupations by Sex
Within the Services occupations in Prospect Park borough, the most male-oriented occupations are Security & Protection (100.0%), Firefighting & Prevention (100.0%), and Cleaning & Maintenance (68.4%), while the most female-oriented occupations are Personal Care & Service (100.0%), Healthcare Support (80.5%), and Food Preparation & Serving (79.8%).
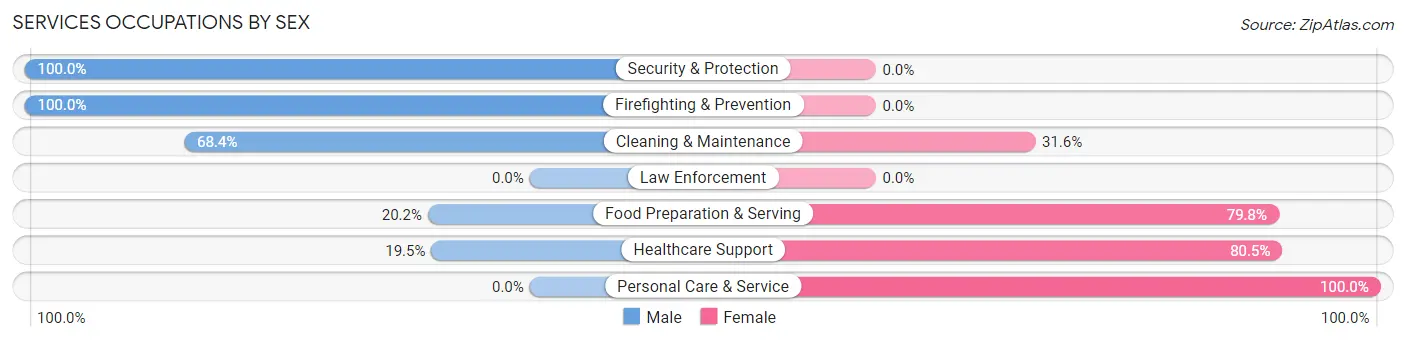
| Occupation | Male | Female |
| Healthcare Support | 37 (19.5%) | 153 (80.5%) |
| Security & Protection | 25 (100.0%) | 0 (0.0%) |
| Firefighting & Prevention | 25 (100.0%) | 0 (0.0%) |
| Law Enforcement | 0 (0.0%) | 0 (0.0%) |
| Food Preparation & Serving | 25 (20.2%) | 99 (79.8%) |
| Cleaning & Maintenance | 52 (68.4%) | 24 (31.6%) |
| Personal Care & Service | 0 (0.0%) | 46 (100.0%) |
| Total (Category) | 139 (30.1%) | 322 (69.9%) |
| Total (Overall) | 1,498 (52.1%) | 1,379 (47.9%) |
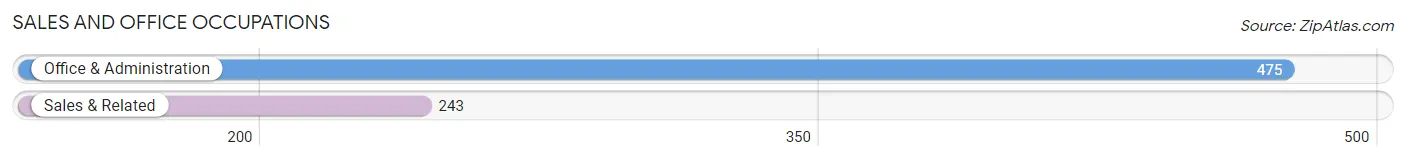
Sales and Office Occupations
The most common Sales and Office occupations in Prospect Park borough are Office & Administration (475 | 16.5%), and Sales & Related (243 | 8.5%).
Sales and Office Occupations by Sex
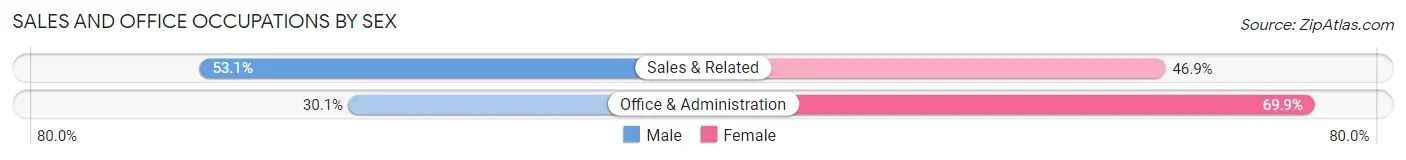
| Occupation | Male | Female |
| Sales & Related | 129 (53.1%) | 114 (46.9%) |
| Office & Administration | 143 (30.1%) | 332 (69.9%) |
| Total (Category) | 272 (37.9%) | 446 (62.1%) |
| Total (Overall) | 1,498 (52.1%) | 1,379 (47.9%) |
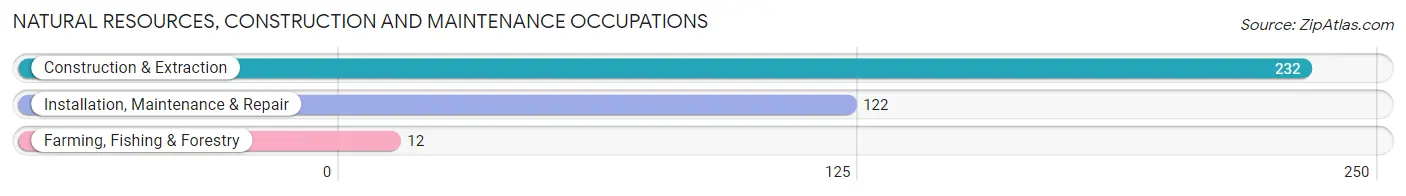
Natural Resources, Construction and Maintenance Occupations
The most common Natural Resources, Construction and Maintenance occupations in Prospect Park borough are Construction & Extraction (232 | 8.1%), Installation, Maintenance & Repair (122 | 4.2%), and Farming, Fishing & Forestry (12 | 0.4%).
Natural Resources, Construction and Maintenance Occupations by Sex
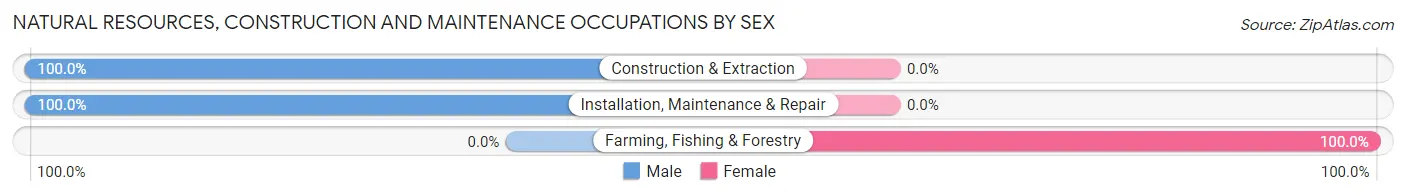
| Occupation | Male | Female |
| Farming, Fishing & Forestry | 0 (0.0%) | 12 (100.0%) |
| Construction & Extraction | 232 (100.0%) | 0 (0.0%) |
| Installation, Maintenance & Repair | 122 (100.0%) | 0 (0.0%) |
| Total (Category) | 354 (96.7%) | 12 (3.3%) |
| Total (Overall) | 1,498 (52.1%) | 1,379 (47.9%) |
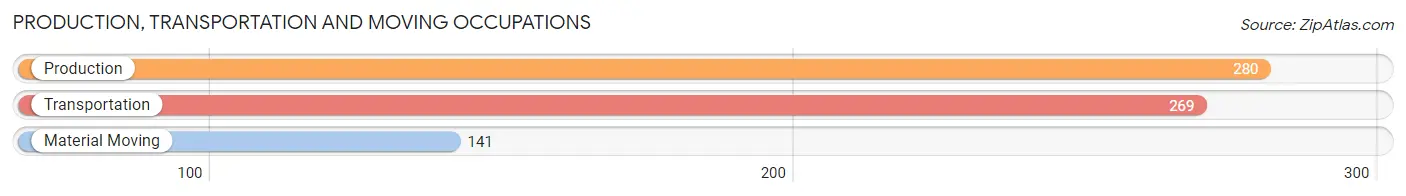
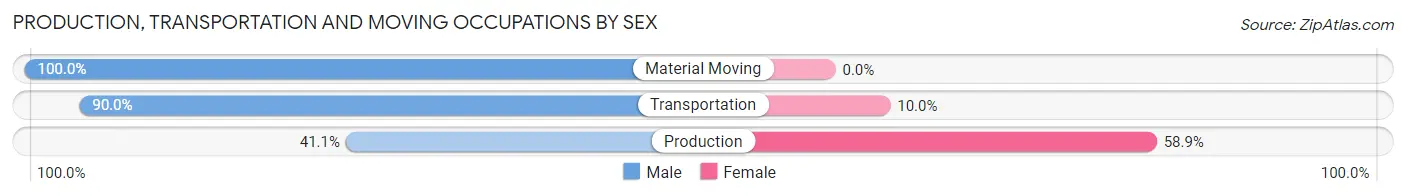
Production, Transportation and Moving Occupations
The most common Production, Transportation and Moving occupations in Prospect Park borough are Production (280 | 9.7%), Transportation (269 | 9.3%), and Material Moving (141 | 4.9%).
Production, Transportation and Moving Occupations by Sex
| Occupation | Male | Female |
| Production | 115 (41.1%) | 165 (58.9%) |
| Transportation | 242 (90.0%) | 27 (10.0%) |
| Material Moving | 141 (100.0%) | 0 (0.0%) |
| Total (Category) | 498 (72.2%) | 192 (27.8%) |
| Total (Overall) | 1,498 (52.1%) | 1,379 (47.9%) |
Employment Industries by Sex in Prospect Park borough
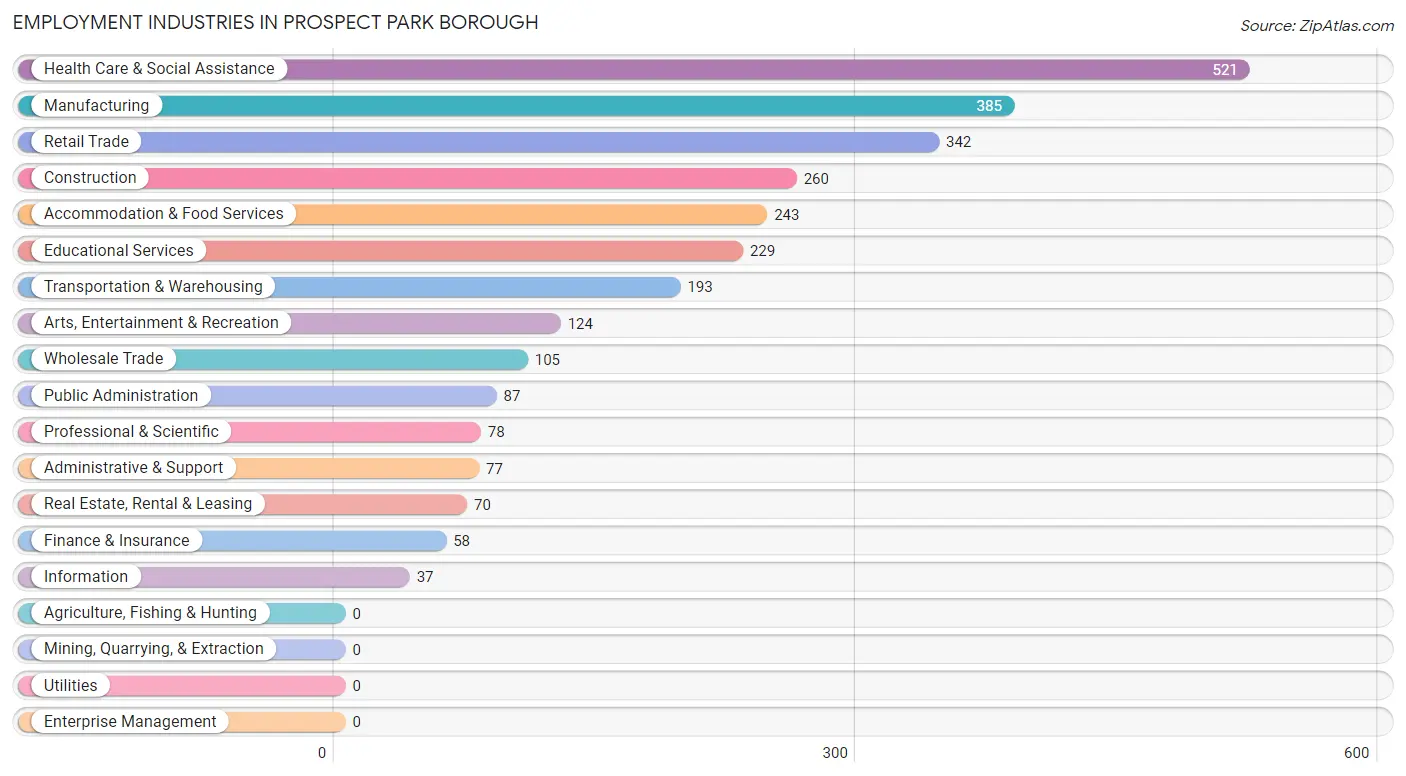
Employment Industries in Prospect Park borough
The major employment industries in Prospect Park borough include Health Care & Social Assistance (521 | 18.1%), Manufacturing (385 | 13.4%), Retail Trade (342 | 11.9%), Construction (260 | 9.0%), and Accommodation & Food Services (243 | 8.5%).
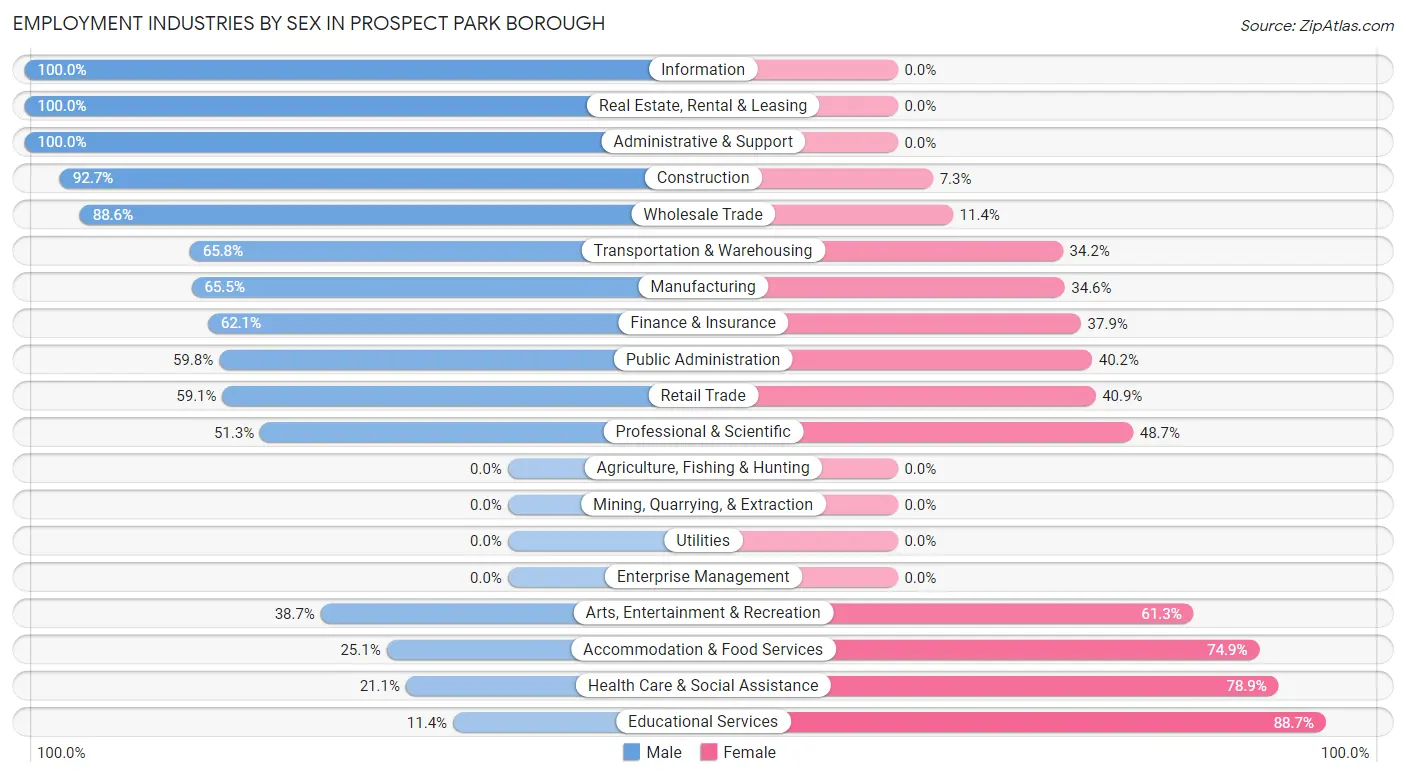
Employment Industries by Sex in Prospect Park borough
The Prospect Park borough industries that see more men than women are Information (100.0%), Real Estate, Rental & Leasing (100.0%), and Administrative & Support (100.0%), whereas the industries that tend to have a higher number of women are Educational Services (88.6%), Health Care & Social Assistance (78.9%), and Accommodation & Food Services (74.9%).
| Industry | Male | Female |
| Agriculture, Fishing & Hunting | 0 (0.0%) | 0 (0.0%) |
| Mining, Quarrying, & Extraction | 0 (0.0%) | 0 (0.0%) |
| Construction | 241 (92.7%) | 19 (7.3%) |
| Manufacturing | 252 (65.4%) | 133 (34.5%) |
| Wholesale Trade | 93 (88.6%) | 12 (11.4%) |
| Retail Trade | 202 (59.1%) | 140 (40.9%) |
| Transportation & Warehousing | 127 (65.8%) | 66 (34.2%) |
| Utilities | 0 (0.0%) | 0 (0.0%) |
| Information | 37 (100.0%) | 0 (0.0%) |
| Finance & Insurance | 36 (62.1%) | 22 (37.9%) |
| Real Estate, Rental & Leasing | 70 (100.0%) | 0 (0.0%) |
| Professional & Scientific | 40 (51.3%) | 38 (48.7%) |
| Enterprise Management | 0 (0.0%) | 0 (0.0%) |
| Administrative & Support | 77 (100.0%) | 0 (0.0%) |
| Educational Services | 26 (11.4%) | 203 (88.6%) |
| Health Care & Social Assistance | 110 (21.1%) | 411 (78.9%) |
| Arts, Entertainment & Recreation | 48 (38.7%) | 76 (61.3%) |
| Accommodation & Food Services | 61 (25.1%) | 182 (74.9%) |
| Public Administration | 52 (59.8%) | 35 (40.2%) |
| Total | 1,498 (52.1%) | 1,379 (47.9%) |
Education in Prospect Park borough
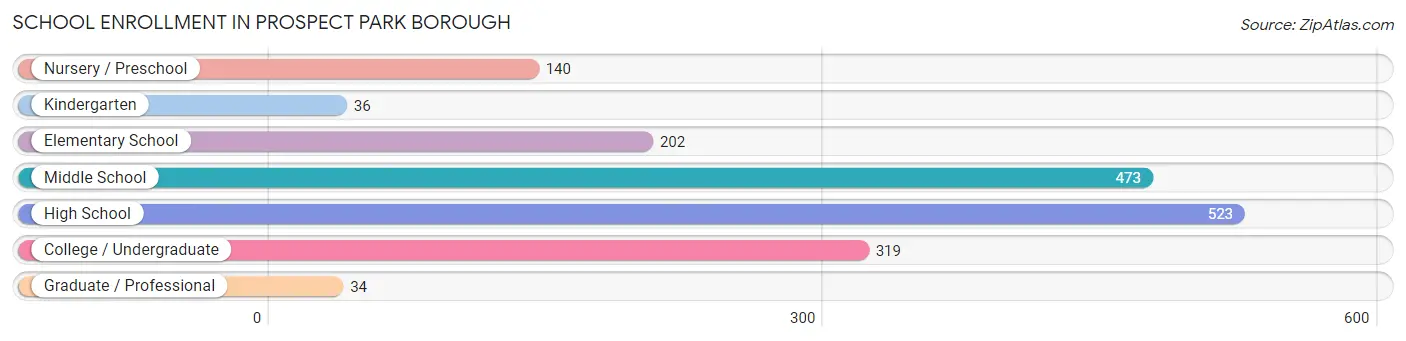
School Enrollment in Prospect Park borough
The most common levels of schooling among the 1,727 students in Prospect Park borough are high school (523 | 30.3%), middle school (473 | 27.4%), and college / undergraduate (319 | 18.5%).
| School Level | # Students | % Students |
| Nursery / Preschool | 140 | 8.1% |
| Kindergarten | 36 | 2.1% |
| Elementary School | 202 | 11.7% |
| Middle School | 473 | 27.4% |
| High School | 523 | 30.3% |
| College / Undergraduate | 319 | 18.5% |
| Graduate / Professional | 34 | 2.0% |
| Total | 1,727 | 100.0% |
School Enrollment by Age by Funding Source in Prospect Park borough
Out of a total of 1,727 students who are enrolled in schools in Prospect Park borough, 389 (22.5%) attend a private institution, while the remaining 1,338 (77.5%) are enrolled in public schools. The age group of 20 to 24 year olds has the highest likelihood of being enrolled in private schools, with 122 (48.2% in the age bracket) enrolled. Conversely, the age group of 10 to 14 year olds has the lowest likelihood of being enrolled in a private school, with 446 (92.0% in the age bracket) attending a public institution.
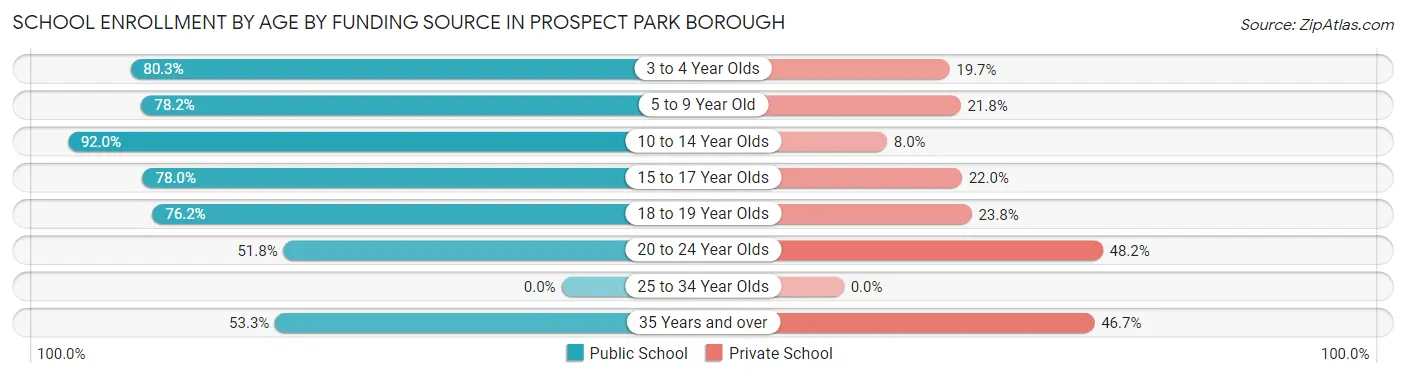
| Age Bracket | Public School | Private School |
| 3 to 4 Year Olds | 102 (80.3%) | 25 (19.7%) |
| 5 to 9 Year Old | 187 (78.2%) | 52 (21.8%) |
| 10 to 14 Year Olds | 446 (92.0%) | 39 (8.0%) |
| 15 to 17 Year Olds | 369 (78.0%) | 104 (22.0%) |
| 18 to 19 Year Olds | 80 (76.2%) | 25 (23.8%) |
| 20 to 24 Year Olds | 131 (51.8%) | 122 (48.2%) |
| 25 to 34 Year Olds | 0 (0.0%) | 0 (0.0%) |
| 35 Years and over | 24 (53.3%) | 21 (46.7%) |
| Total | 1,338 (77.5%) | 389 (22.5%) |
Educational Attainment by Field of Study in Prospect Park borough
Science & technology (172 | 19.1%), arts & humanities (140 | 15.5%), social sciences (101 | 11.2%), education (90 | 10.0%), and business (88 | 9.8%) are the most common fields of study among 902 individuals in Prospect Park borough who have obtained a bachelor's degree or higher.
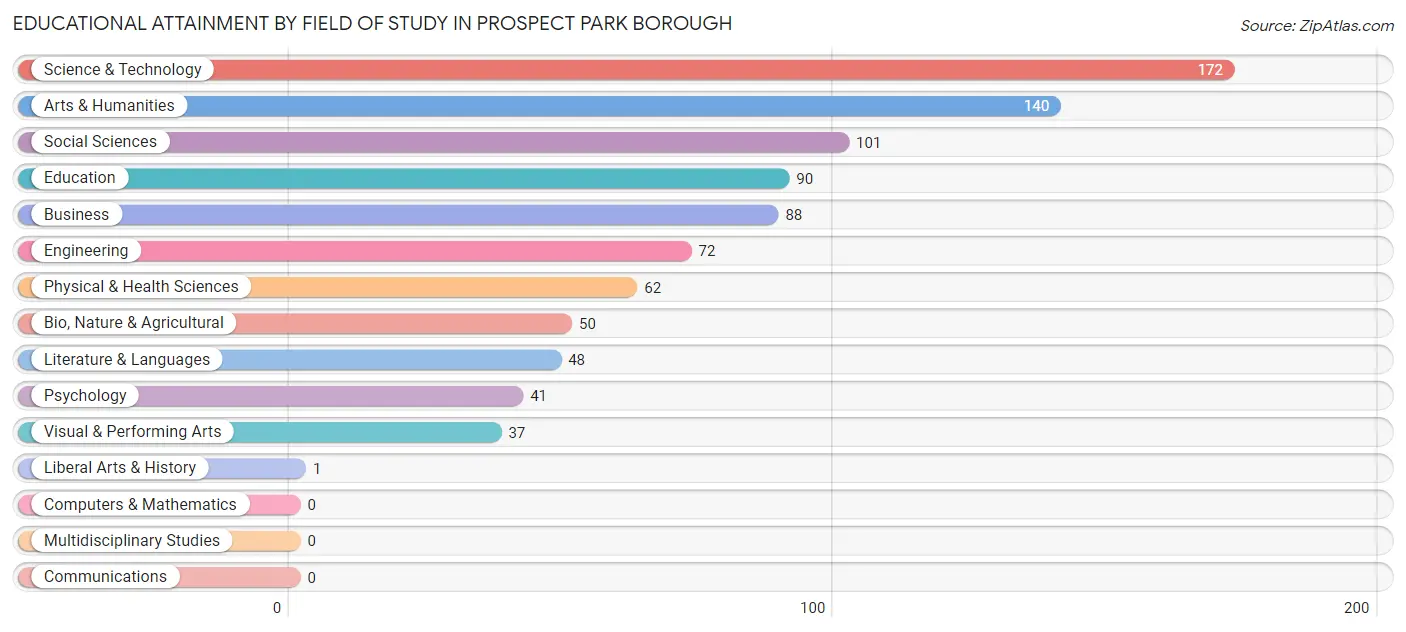
| Field of Study | # Graduates | % Graduates |
| Computers & Mathematics | 0 | 0.0% |
| Bio, Nature & Agricultural | 50 | 5.5% |
| Physical & Health Sciences | 62 | 6.9% |
| Psychology | 41 | 4.5% |
| Social Sciences | 101 | 11.2% |
| Engineering | 72 | 8.0% |
| Multidisciplinary Studies | 0 | 0.0% |
| Science & Technology | 172 | 19.1% |
| Business | 88 | 9.8% |
| Education | 90 | 10.0% |
| Literature & Languages | 48 | 5.3% |
| Liberal Arts & History | 1 | 0.1% |
| Visual & Performing Arts | 37 | 4.1% |
| Communications | 0 | 0.0% |
| Arts & Humanities | 140 | 15.5% |
| Total | 902 | 100.0% |
Transportation & Commute in Prospect Park borough
Vehicle Availability by Sex in Prospect Park borough
The most prevalent vehicle ownership categories in Prospect Park borough are males with 2 vehicles (526, accounting for 35.4%) and females with 2 vehicles (516, making up 39.7%).
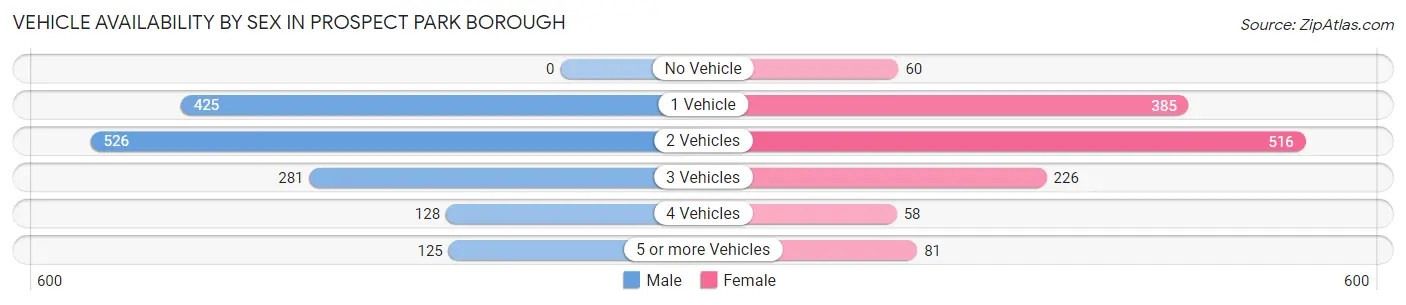
| Vehicles Available | Male | Female |
| No Vehicle | 0 (0.0%) | 60 (4.5%) |
| 1 Vehicle | 425 (28.6%) | 385 (29.0%) |
| 2 Vehicles | 526 (35.4%) | 516 (38.9%) |
| 3 Vehicles | 281 (18.9%) | 226 (17.0%) |
| 4 Vehicles | 128 (8.6%) | 58 (4.4%) |
| 5 or more Vehicles | 125 (8.4%) | 81 (6.1%) |
| Total | 1,485 (100.0%) | 1,326 (100.0%) |
Commute Time in Prospect Park borough
The most frequently occuring commute durations in Prospect Park borough are 15 to 19 minutes (616 commuters, 21.9%), 20 to 24 minutes (531 commuters, 18.9%), and 30 to 34 minutes (481 commuters, 17.1%).
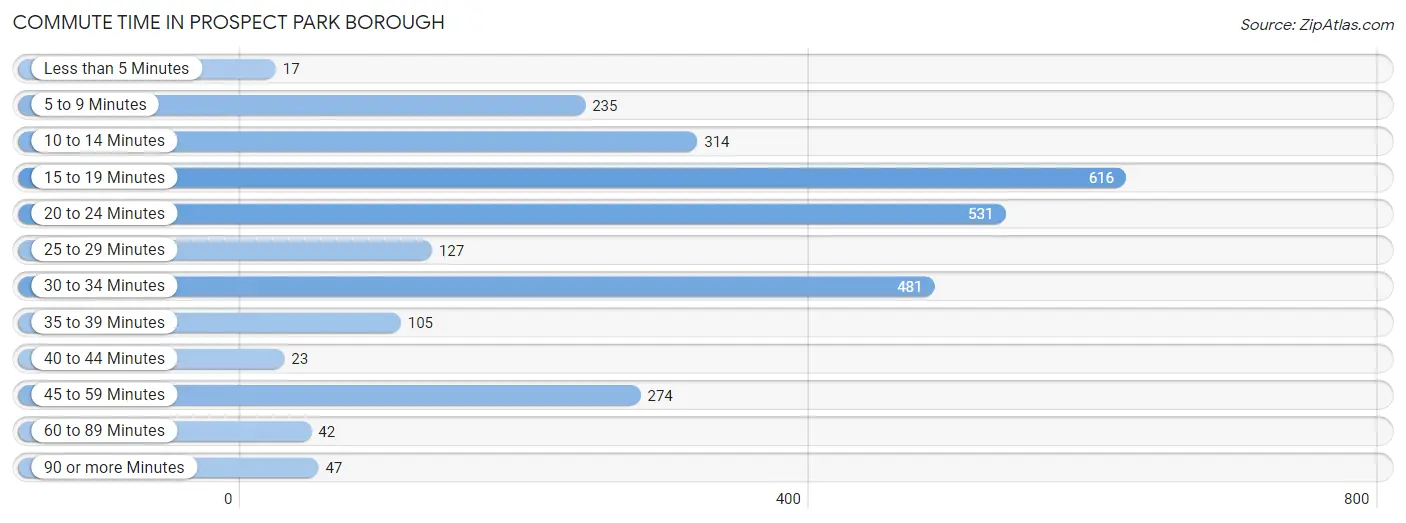
| Commute Time | # Commuters | % Commuters |
| Less than 5 Minutes | 17 | 0.6% |
| 5 to 9 Minutes | 235 | 8.4% |
| 10 to 14 Minutes | 314 | 11.2% |
| 15 to 19 Minutes | 616 | 21.9% |
| 20 to 24 Minutes | 531 | 18.9% |
| 25 to 29 Minutes | 127 | 4.5% |
| 30 to 34 Minutes | 481 | 17.1% |
| 35 to 39 Minutes | 105 | 3.7% |
| 40 to 44 Minutes | 23 | 0.8% |
| 45 to 59 Minutes | 274 | 9.7% |
| 60 to 89 Minutes | 42 | 1.5% |
| 90 or more Minutes | 47 | 1.7% |
Commute Time by Sex in Prospect Park borough
The most common commute times in Prospect Park borough are 15 to 19 minutes (399 commuters, 26.9%) for males and 20 to 24 minutes (286 commuters, 21.6%) for females.
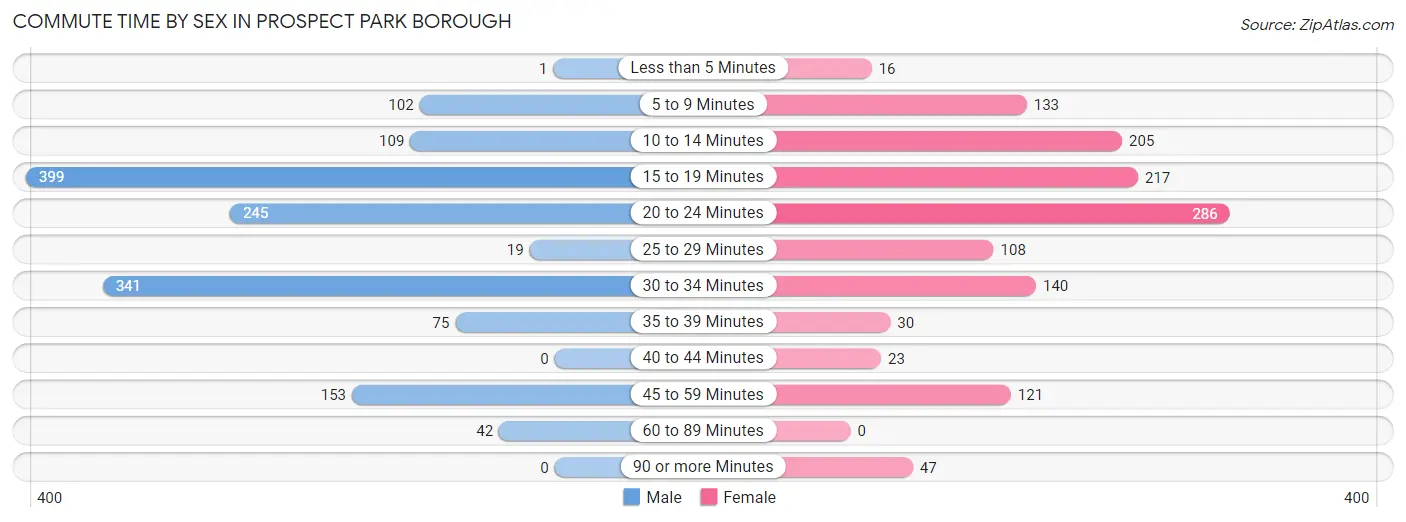
| Commute Time | Male | Female |
| Less than 5 Minutes | 1 (0.1%) | 16 (1.2%) |
| 5 to 9 Minutes | 102 (6.9%) | 133 (10.0%) |
| 10 to 14 Minutes | 109 (7.3%) | 205 (15.5%) |
| 15 to 19 Minutes | 399 (26.9%) | 217 (16.4%) |
| 20 to 24 Minutes | 245 (16.5%) | 286 (21.6%) |
| 25 to 29 Minutes | 19 (1.3%) | 108 (8.1%) |
| 30 to 34 Minutes | 341 (23.0%) | 140 (10.6%) |
| 35 to 39 Minutes | 75 (5.1%) | 30 (2.3%) |
| 40 to 44 Minutes | 0 (0.0%) | 23 (1.7%) |
| 45 to 59 Minutes | 153 (10.3%) | 121 (9.1%) |
| 60 to 89 Minutes | 42 (2.8%) | 0 (0.0%) |
| 90 or more Minutes | 0 (0.0%) | 47 (3.5%) |
Time of Departure to Work by Sex in Prospect Park borough
The most frequent times of departure to work in Prospect Park borough are 6:30 AM to 6:59 AM (311, 20.9%) for males and 8:00 AM to 8:29 AM (323, 24.4%) for females.
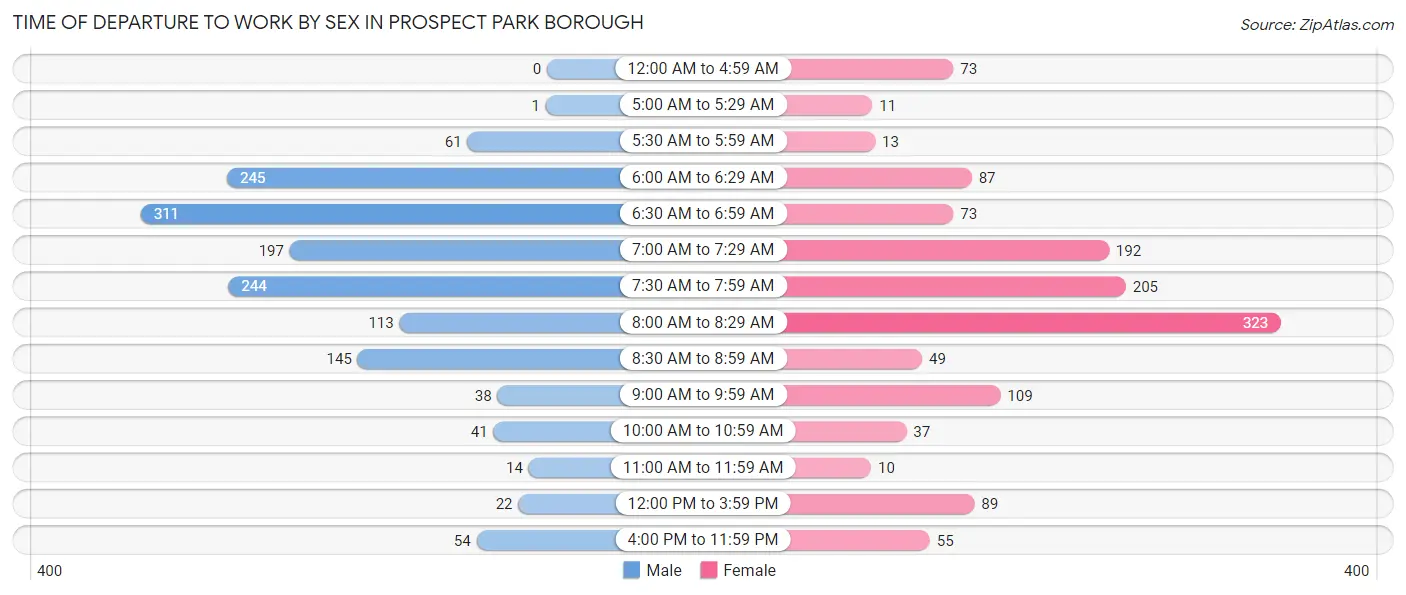
| Time of Departure | Male | Female |
| 12:00 AM to 4:59 AM | 0 (0.0%) | 73 (5.5%) |
| 5:00 AM to 5:29 AM | 1 (0.1%) | 11 (0.8%) |
| 5:30 AM to 5:59 AM | 61 (4.1%) | 13 (1.0%) |
| 6:00 AM to 6:29 AM | 245 (16.5%) | 87 (6.6%) |
| 6:30 AM to 6:59 AM | 311 (20.9%) | 73 (5.5%) |
| 7:00 AM to 7:29 AM | 197 (13.3%) | 192 (14.5%) |
| 7:30 AM to 7:59 AM | 244 (16.4%) | 205 (15.5%) |
| 8:00 AM to 8:29 AM | 113 (7.6%) | 323 (24.4%) |
| 8:30 AM to 8:59 AM | 145 (9.8%) | 49 (3.7%) |
| 9:00 AM to 9:59 AM | 38 (2.6%) | 109 (8.2%) |
| 10:00 AM to 10:59 AM | 41 (2.8%) | 37 (2.8%) |
| 11:00 AM to 11:59 AM | 14 (0.9%) | 10 (0.7%) |
| 12:00 PM to 3:59 PM | 22 (1.5%) | 89 (6.7%) |
| 4:00 PM to 11:59 PM | 54 (3.6%) | 55 (4.2%) |
| Total | 1,486 (100.0%) | 1,326 (100.0%) |
Housing Occupancy in Prospect Park borough
Occupancy by Ownership in Prospect Park borough
Of the total 1,892 dwellings in Prospect Park borough, owner-occupied units account for 706 (37.3%), while renter-occupied units make up 1,186 (62.7%).
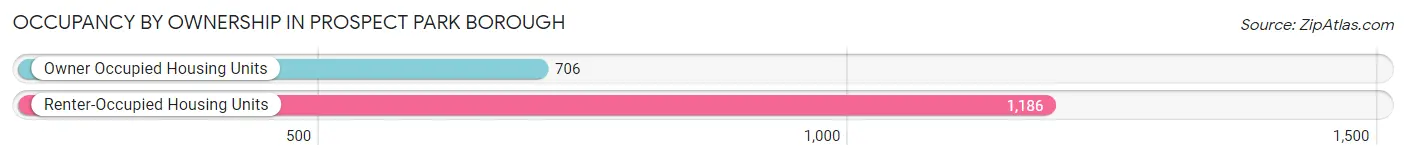
| Occupancy | # Housing Units | % Housing Units |
| Owner Occupied Housing Units | 706 | 37.3% |
| Renter-Occupied Housing Units | 1,186 | 62.7% |
| Total Occupied Housing Units | 1,892 | 100.0% |
Occupancy by Household Size in Prospect Park borough
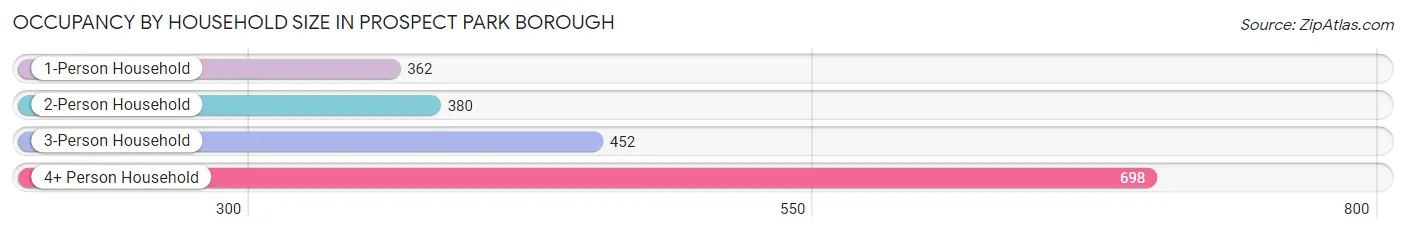
| Household Size | # Housing Units | % Housing Units |
| 1-Person Household | 362 | 19.1% |
| 2-Person Household | 380 | 20.1% |
| 3-Person Household | 452 | 23.9% |
| 4+ Person Household | 698 | 36.9% |
| Total Housing Units | 1,892 | 100.0% |
Occupancy by Ownership by Household Size in Prospect Park borough
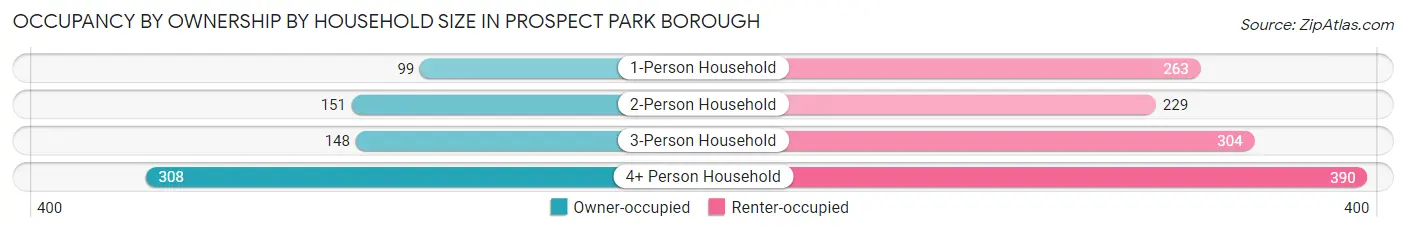
| Household Size | Owner-occupied | Renter-occupied |
| 1-Person Household | 99 (27.4%) | 263 (72.7%) |
| 2-Person Household | 151 (39.7%) | 229 (60.3%) |
| 3-Person Household | 148 (32.7%) | 304 (67.3%) |
| 4+ Person Household | 308 (44.1%) | 390 (55.9%) |
| Total Housing Units | 706 (37.3%) | 1,186 (62.7%) |
Occupancy by Educational Attainment in Prospect Park borough
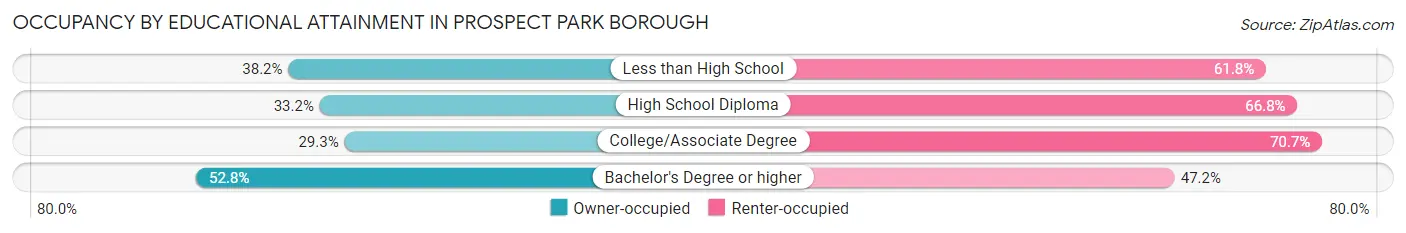
| Household Size | Owner-occupied | Renter-occupied |
| Less than High School | 87 (38.2%) | 141 (61.8%) |
| High School Diploma | 299 (33.2%) | 602 (66.8%) |
| College/Associate Degree | 103 (29.3%) | 249 (70.7%) |
| Bachelor's Degree or higher | 217 (52.8%) | 194 (47.2%) |
Occupancy by Age of Householder in Prospect Park borough
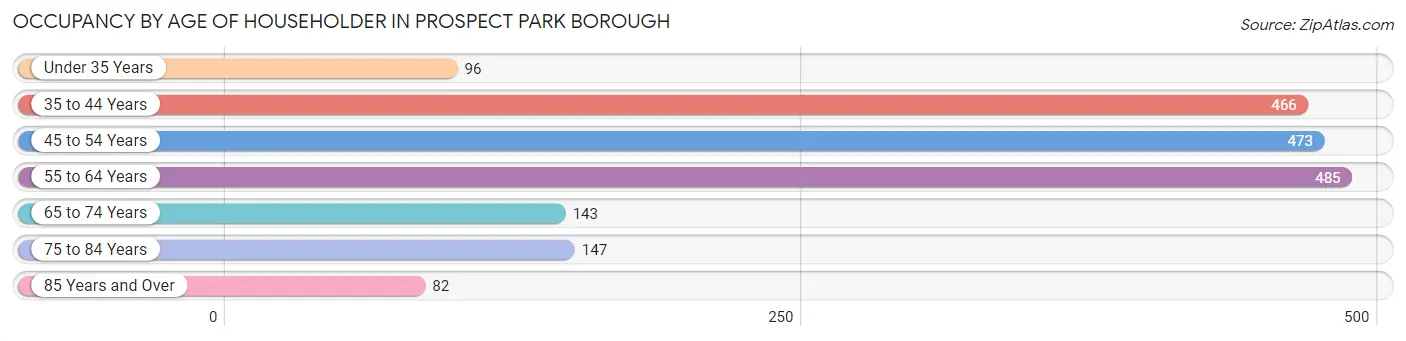
| Age Bracket | # Households | % Households |
| Under 35 Years | 96 | 5.1% |
| 35 to 44 Years | 466 | 24.6% |
| 45 to 54 Years | 473 | 25.0% |
| 55 to 64 Years | 485 | 25.6% |
| 65 to 74 Years | 143 | 7.6% |
| 75 to 84 Years | 147 | 7.8% |
| 85 Years and Over | 82 | 4.3% |
| Total | 1,892 | 100.0% |
Housing Finances in Prospect Park borough
Median Income by Occupancy in Prospect Park borough
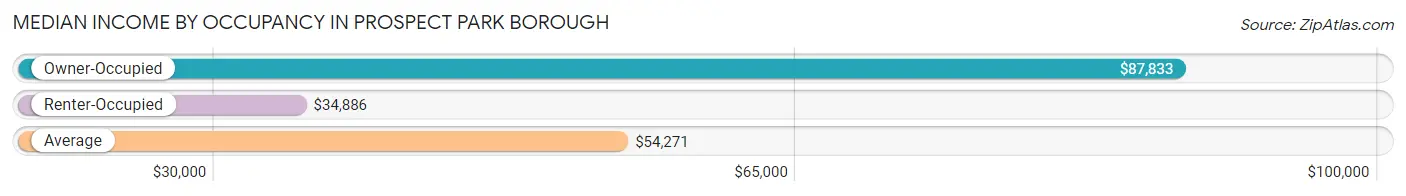
| Occupancy Type | # Households | Median Income |
| Owner-Occupied | 706 (37.3%) | $87,833 |
| Renter-Occupied | 1,186 (62.7%) | $34,886 |
| Average | 1,892 (100.0%) | $54,271 |
Occupancy by Householder Income Bracket in Prospect Park borough
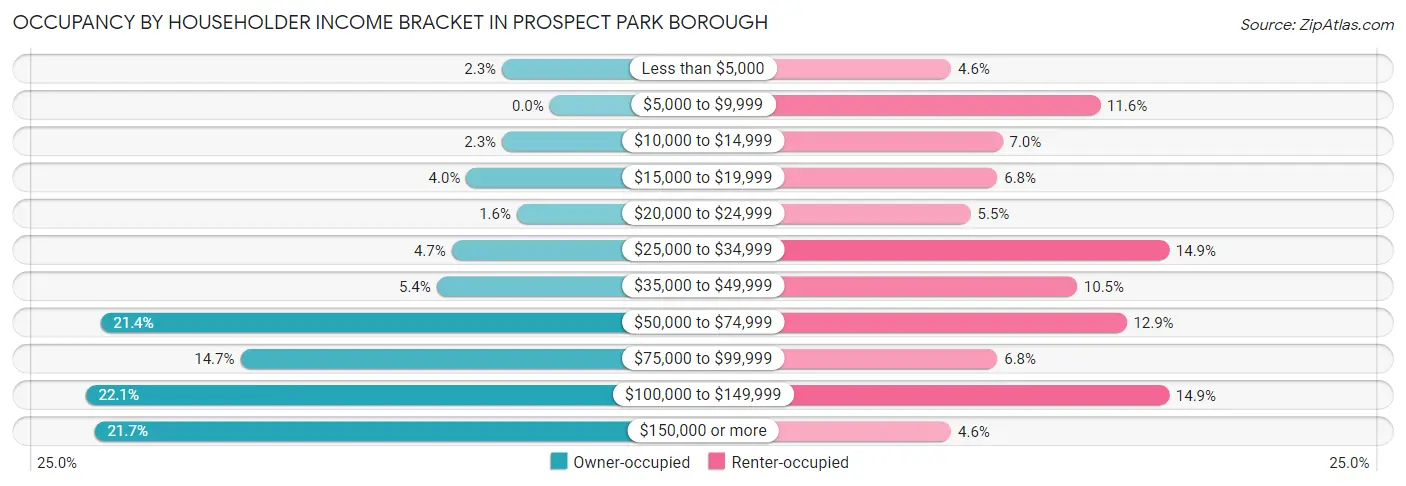
| Income Bracket | Owner-occupied | Renter-occupied |
| Less than $5,000 | 16 (2.3%) | 54 (4.5%) |
| $5,000 to $9,999 | 0 (0.0%) | 138 (11.6%) |
| $10,000 to $14,999 | 16 (2.3%) | 83 (7.0%) |
| $15,000 to $19,999 | 28 (4.0%) | 80 (6.8%) |
| $20,000 to $24,999 | 11 (1.6%) | 65 (5.5%) |
| $25,000 to $34,999 | 33 (4.7%) | 177 (14.9%) |
| $35,000 to $49,999 | 38 (5.4%) | 125 (10.5%) |
| $50,000 to $74,999 | 151 (21.4%) | 153 (12.9%) |
| $75,000 to $99,999 | 104 (14.7%) | 80 (6.8%) |
| $100,000 to $149,999 | 156 (22.1%) | 177 (14.9%) |
| $150,000 or more | 153 (21.7%) | 54 (4.5%) |
| Total | 706 (100.0%) | 1,186 (100.0%) |
Monthly Housing Cost Tiers in Prospect Park borough
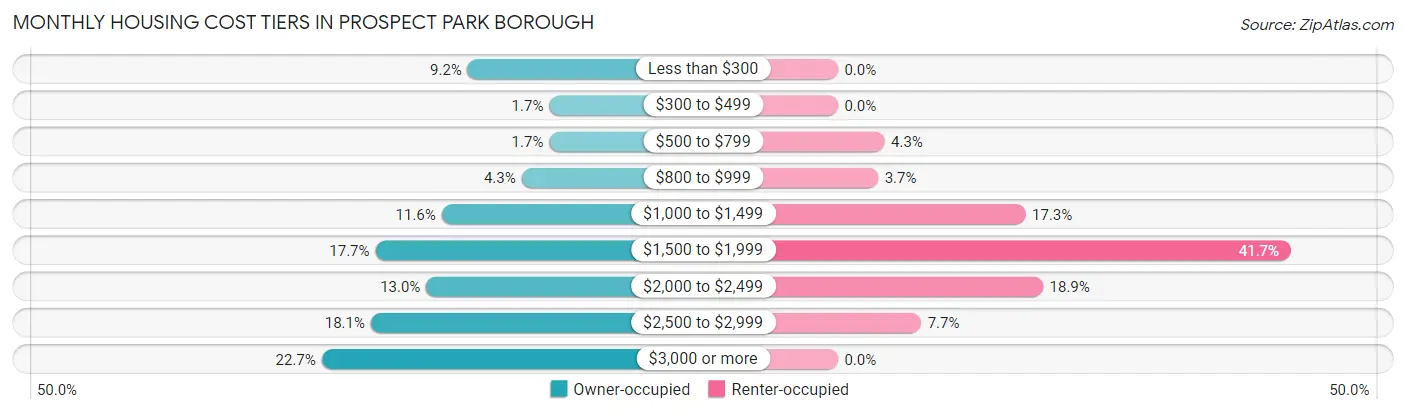
| Monthly Cost | Owner-occupied | Renter-occupied |
| Less than $300 | 65 (9.2%) | 0 (0.0%) |
| $300 to $499 | 12 (1.7%) | 0 (0.0%) |
| $500 to $799 | 12 (1.7%) | 51 (4.3%) |
| $800 to $999 | 30 (4.3%) | 44 (3.7%) |
| $1,000 to $1,499 | 82 (11.6%) | 205 (17.3%) |
| $1,500 to $1,999 | 125 (17.7%) | 495 (41.7%) |
| $2,000 to $2,499 | 92 (13.0%) | 224 (18.9%) |
| $2,500 to $2,999 | 128 (18.1%) | 91 (7.7%) |
| $3,000 or more | 160 (22.7%) | 0 (0.0%) |
| Total | 706 (100.0%) | 1,186 (100.0%) |
Physical Housing Characteristics in Prospect Park borough
Housing Structures in Prospect Park borough
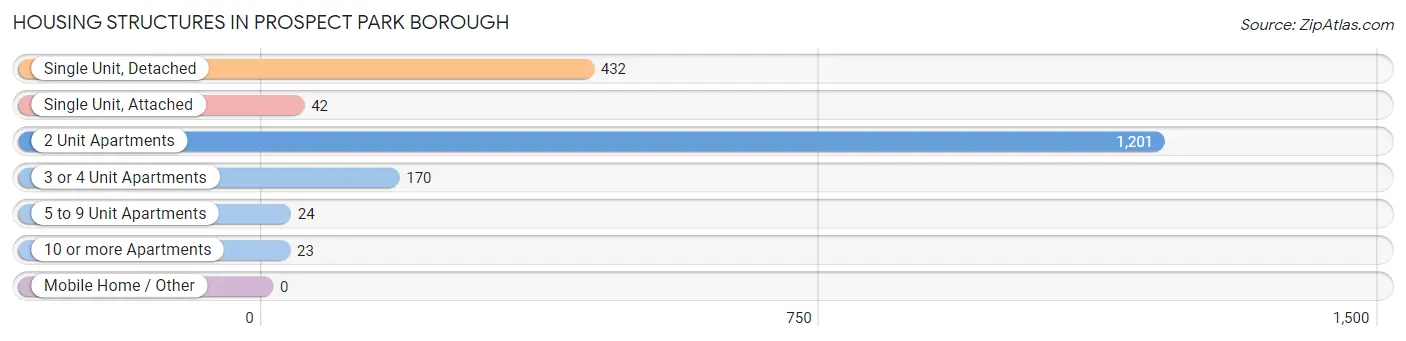
| Structure Type | # Housing Units | % Housing Units |
| Single Unit, Detached | 432 | 22.8% |
| Single Unit, Attached | 42 | 2.2% |
| 2 Unit Apartments | 1,201 | 63.5% |
| 3 or 4 Unit Apartments | 170 | 9.0% |
| 5 to 9 Unit Apartments | 24 | 1.3% |
| 10 or more Apartments | 23 | 1.2% |
| Mobile Home / Other | 0 | 0.0% |
| Total | 1,892 | 100.0% |
Housing Structures by Occupancy in Prospect Park borough
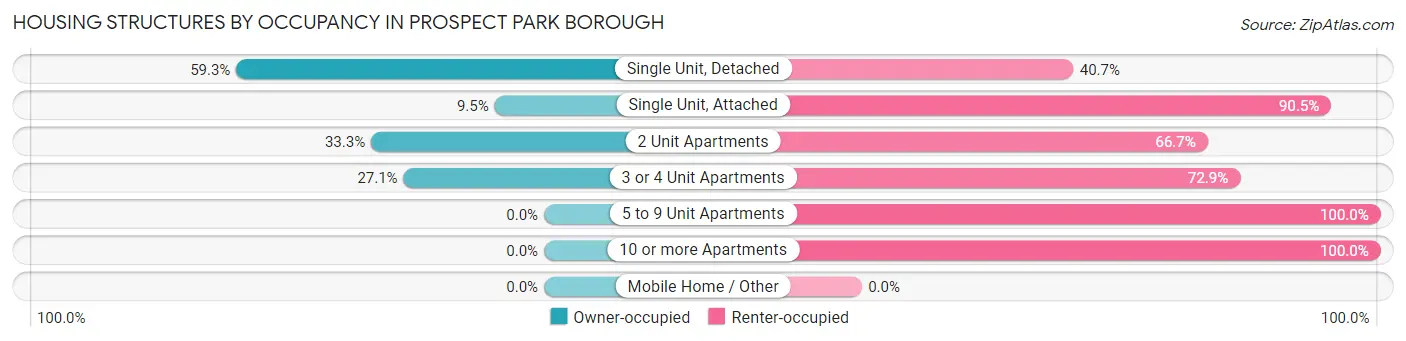
| Structure Type | Owner-occupied | Renter-occupied |
| Single Unit, Detached | 256 (59.3%) | 176 (40.7%) |
| Single Unit, Attached | 4 (9.5%) | 38 (90.5%) |
| 2 Unit Apartments | 400 (33.3%) | 801 (66.7%) |
| 3 or 4 Unit Apartments | 46 (27.1%) | 124 (72.9%) |
| 5 to 9 Unit Apartments | 0 (0.0%) | 24 (100.0%) |
| 10 or more Apartments | 0 (0.0%) | 23 (100.0%) |
| Mobile Home / Other | 0 (0.0%) | 0 (0.0%) |
| Total | 706 (37.3%) | 1,186 (62.7%) |
Housing Structures by Number of Rooms in Prospect Park borough
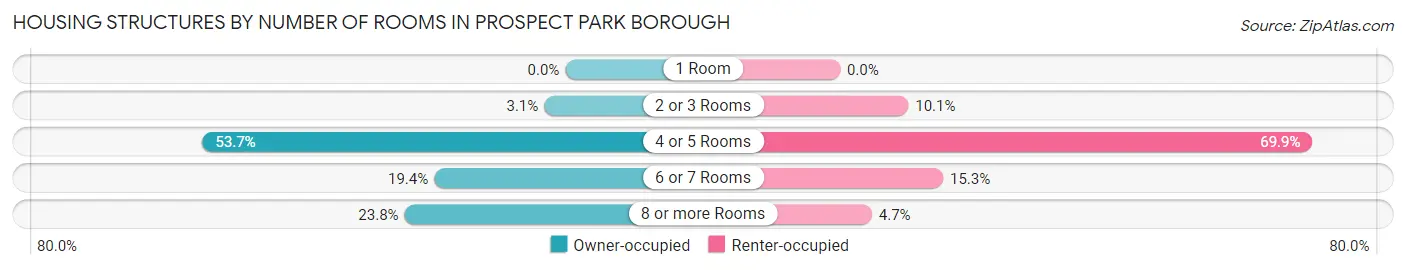
| Number of Rooms | Owner-occupied | Renter-occupied |
| 1 Room | 0 (0.0%) | 0 (0.0%) |
| 2 or 3 Rooms | 22 (3.1%) | 120 (10.1%) |
| 4 or 5 Rooms | 379 (53.7%) | 829 (69.9%) |
| 6 or 7 Rooms | 137 (19.4%) | 181 (15.3%) |
| 8 or more Rooms | 168 (23.8%) | 56 (4.7%) |
| Total | 706 (100.0%) | 1,186 (100.0%) |
Housing Structure by Heating Type in Prospect Park borough
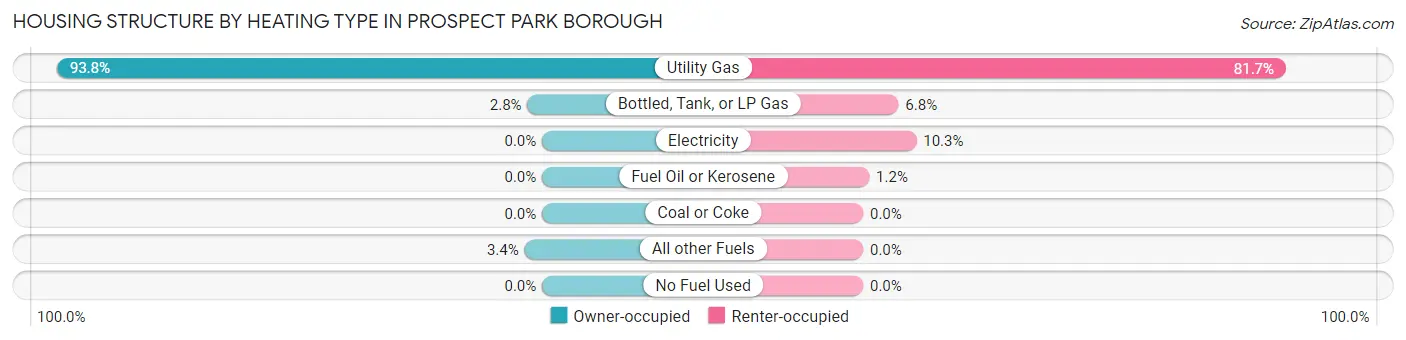
| Heating Type | Owner-occupied | Renter-occupied |
| Utility Gas | 662 (93.8%) | 969 (81.7%) |
| Bottled, Tank, or LP Gas | 20 (2.8%) | 81 (6.8%) |
| Electricity | 0 (0.0%) | 122 (10.3%) |
| Fuel Oil or Kerosene | 0 (0.0%) | 14 (1.2%) |
| Coal or Coke | 0 (0.0%) | 0 (0.0%) |
| All other Fuels | 24 (3.4%) | 0 (0.0%) |
| No Fuel Used | 0 (0.0%) | 0 (0.0%) |
| Total | 706 (100.0%) | 1,186 (100.0%) |
Household Vehicle Usage in Prospect Park borough
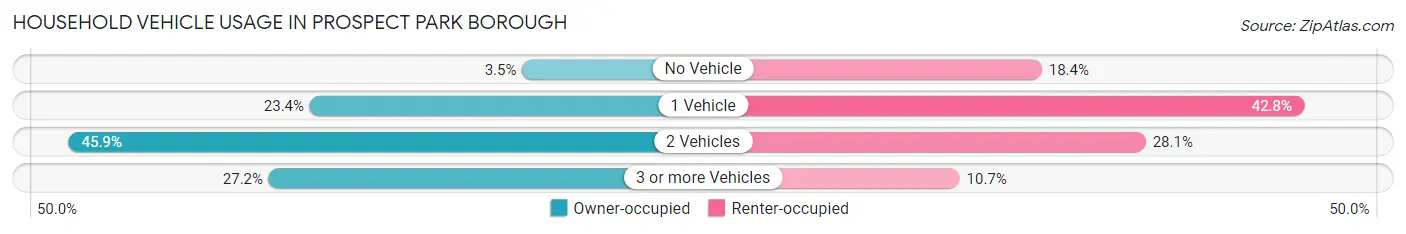
| Vehicles per Household | Owner-occupied | Renter-occupied |
| No Vehicle | 25 (3.5%) | 218 (18.4%) |
| 1 Vehicle | 165 (23.4%) | 508 (42.8%) |
| 2 Vehicles | 324 (45.9%) | 333 (28.1%) |
| 3 or more Vehicles | 192 (27.2%) | 127 (10.7%) |
| Total | 706 (100.0%) | 1,186 (100.0%) |
Real Estate & Mortgages in Prospect Park borough
Real Estate and Mortgage Overview in Prospect Park borough
| Characteristic | Without Mortgage | With Mortgage |
| Housing Units | 305 | 401 |
| Median Property Value | $285,000 | $389,000 |
| Median Household Income | $86,576 | $113 |
| Monthly Housing Costs | $1,263 | $160 |
| Real Estate Taxes | $10,001 | $0 |
Property Value by Mortgage Status in Prospect Park borough
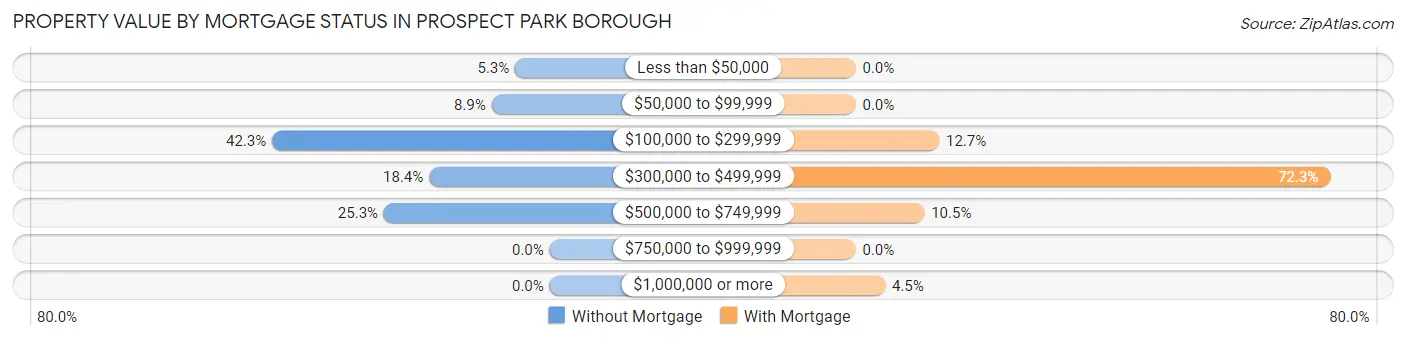
| Property Value | Without Mortgage | With Mortgage |
| Less than $50,000 | 16 (5.2%) | 0 (0.0%) |
| $50,000 to $99,999 | 27 (8.8%) | 0 (0.0%) |
| $100,000 to $299,999 | 129 (42.3%) | 51 (12.7%) |
| $300,000 to $499,999 | 56 (18.4%) | 290 (72.3%) |
| $500,000 to $749,999 | 77 (25.3%) | 42 (10.5%) |
| $750,000 to $999,999 | 0 (0.0%) | 0 (0.0%) |
| $1,000,000 or more | 0 (0.0%) | 18 (4.5%) |
| Total | 305 (100.0%) | 401 (100.0%) |
Household Income by Mortgage Status in Prospect Park borough
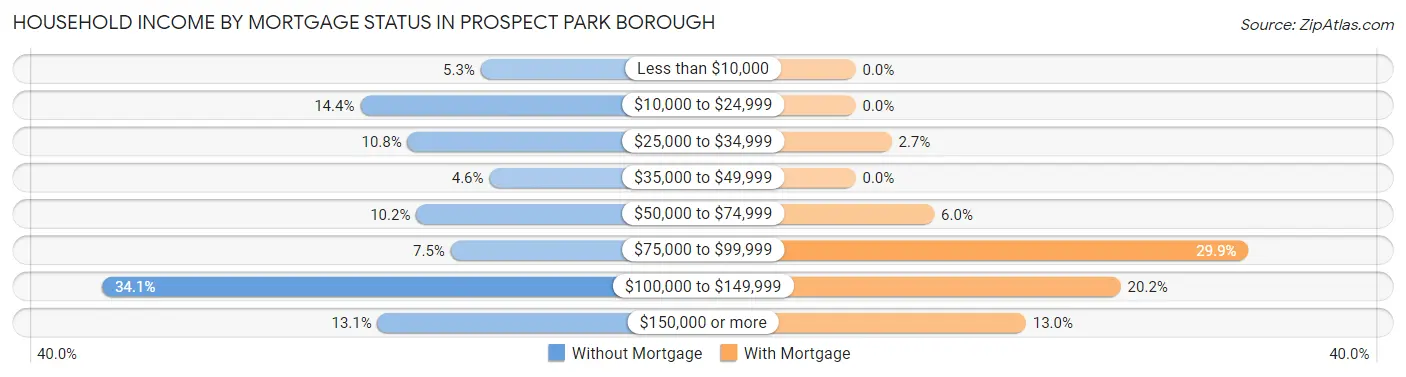
| Household Income | Without Mortgage | With Mortgage |
| Less than $10,000 | 16 (5.2%) | 0 (0.0%) |
| $10,000 to $24,999 | 44 (14.4%) | 0 (0.0%) |
| $25,000 to $34,999 | 33 (10.8%) | 11 (2.7%) |
| $35,000 to $49,999 | 14 (4.6%) | 0 (0.0%) |
| $50,000 to $74,999 | 31 (10.2%) | 24 (6.0%) |
| $75,000 to $99,999 | 23 (7.5%) | 120 (29.9%) |
| $100,000 to $149,999 | 104 (34.1%) | 81 (20.2%) |
| $150,000 or more | 40 (13.1%) | 52 (13.0%) |
| Total | 305 (100.0%) | 401 (100.0%) |
Property Value to Household Income Ratio in Prospect Park borough
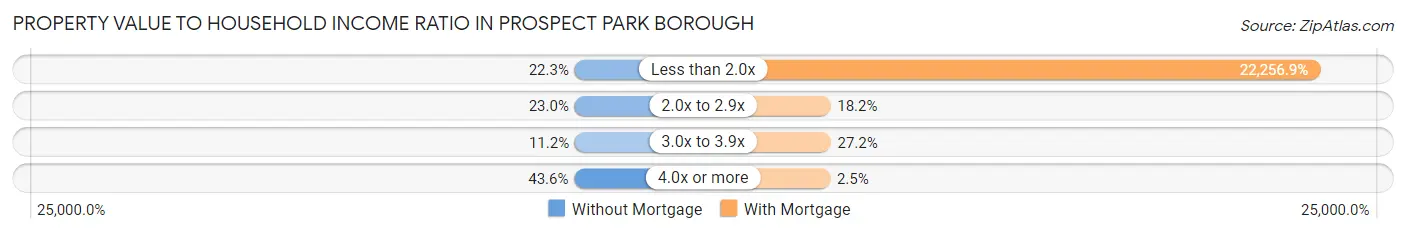
| Value-to-Income Ratio | Without Mortgage | With Mortgage |
| Less than 2.0x | 68 (22.3%) | 89,250 (22,256.9%) |
| 2.0x to 2.9x | 70 (23.0%) | 73 (18.2%) |
| 3.0x to 3.9x | 34 (11.2%) | 109 (27.2%) |
| 4.0x or more | 133 (43.6%) | 10 (2.5%) |
| Total | 305 (100.0%) | 401 (100.0%) |
Real Estate Taxes by Mortgage Status in Prospect Park borough
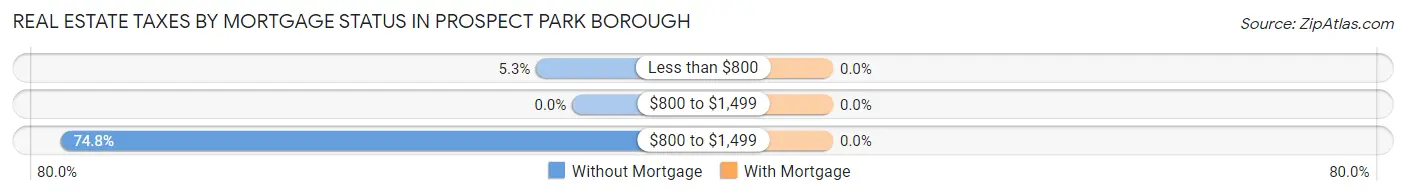
| Property Taxes | Without Mortgage | With Mortgage |
| Less than $800 | 16 (5.2%) | 0 (0.0%) |
| $800 to $1,499 | 0 (0.0%) | 0 (0.0%) |
| $800 to $1,499 | 228 (74.8%) | 0 (0.0%) |
| Total | 305 (100.0%) | 401 (100.0%) |
Health & Disability in Prospect Park borough
Health Insurance Coverage by Age in Prospect Park borough
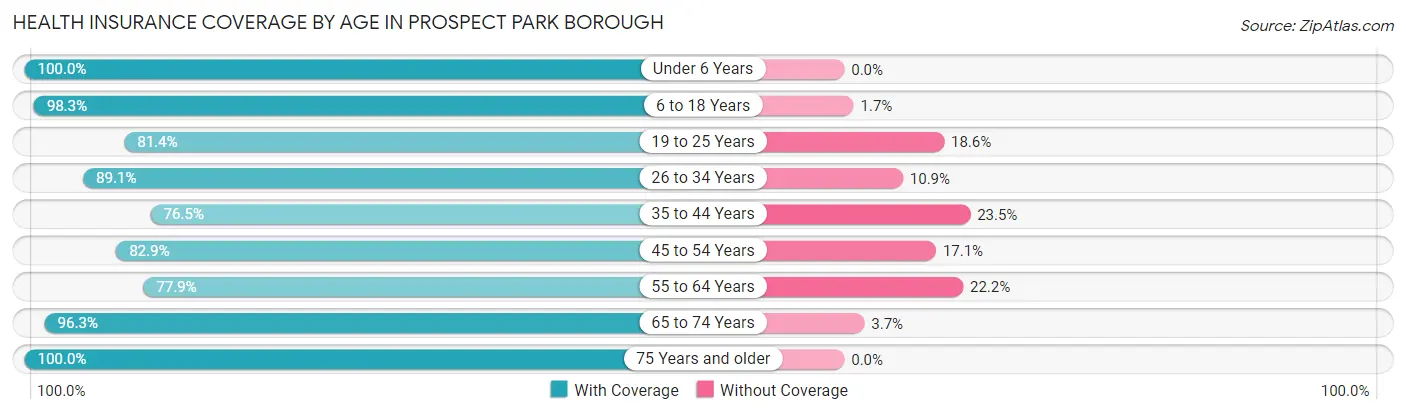
| Age Bracket | With Coverage | Without Coverage |
| Under 6 Years | 601 (100.0%) | 0 (0.0%) |
| 6 to 18 Years | 1,251 (98.3%) | 22 (1.7%) |
| 19 to 25 Years | 582 (81.4%) | 133 (18.6%) |
| 26 to 34 Years | 473 (89.1%) | 58 (10.9%) |
| 35 to 44 Years | 743 (76.5%) | 228 (23.5%) |
| 45 to 54 Years | 650 (82.9%) | 134 (17.1%) |
| 55 to 64 Years | 622 (77.8%) | 177 (22.2%) |
| 65 to 74 Years | 309 (96.3%) | 12 (3.7%) |
| 75 Years and older | 304 (100.0%) | 0 (0.0%) |
| Total | 5,535 (87.9%) | 764 (12.1%) |
Health Insurance Coverage by Citizenship Status in Prospect Park borough
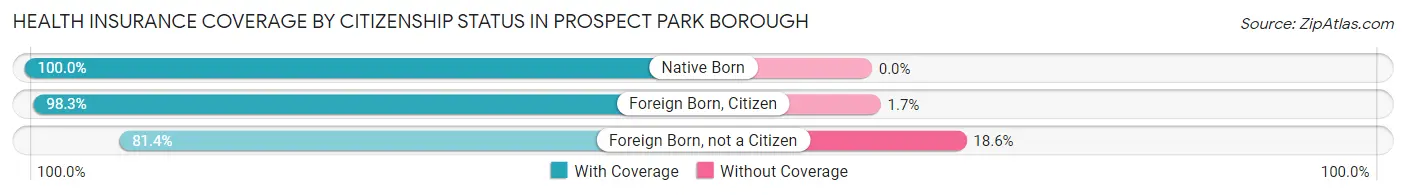
| Citizenship Status | With Coverage | Without Coverage |
| Native Born | 601 (100.0%) | 0 (0.0%) |
| Foreign Born, Citizen | 1,251 (98.3%) | 22 (1.7%) |
| Foreign Born, not a Citizen | 582 (81.4%) | 133 (18.6%) |
Health Insurance Coverage by Household Income in Prospect Park borough
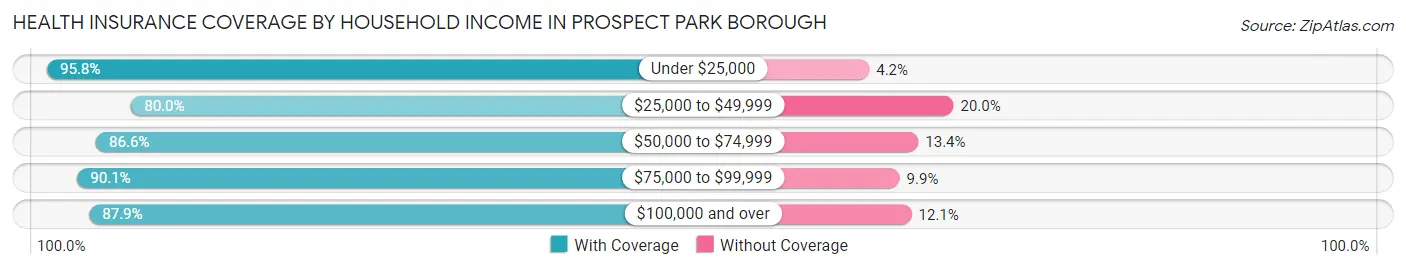
| Household Income | With Coverage | Without Coverage |
| Under $25,000 | 955 (95.8%) | 42 (4.2%) |
| $25,000 to $49,999 | 876 (80.0%) | 219 (20.0%) |
| $50,000 to $74,999 | 865 (86.6%) | 134 (13.4%) |
| $75,000 to $99,999 | 837 (90.1%) | 92 (9.9%) |
| $100,000 and over | 1,998 (87.9%) | 276 (12.1%) |
Public vs Private Health Insurance Coverage by Age in Prospect Park borough
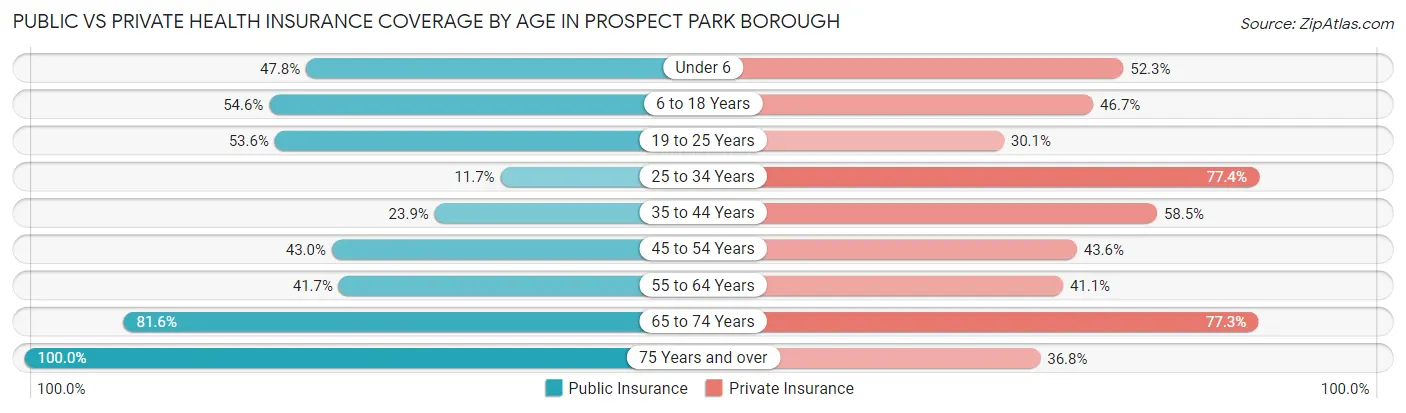
| Age Bracket | Public Insurance | Private Insurance |
| Under 6 | 287 (47.7%) | 314 (52.2%) |
| 6 to 18 Years | 695 (54.6%) | 594 (46.7%) |
| 19 to 25 Years | 383 (53.6%) | 215 (30.1%) |
| 25 to 34 Years | 62 (11.7%) | 411 (77.4%) |
| 35 to 44 Years | 232 (23.9%) | 568 (58.5%) |
| 45 to 54 Years | 337 (43.0%) | 342 (43.6%) |
| 55 to 64 Years | 333 (41.7%) | 328 (41.0%) |
| 65 to 74 Years | 262 (81.6%) | 248 (77.3%) |
| 75 Years and over | 304 (100.0%) | 112 (36.8%) |
| Total | 2,895 (46.0%) | 3,132 (49.7%) |
Disability Status by Sex by Age in Prospect Park borough
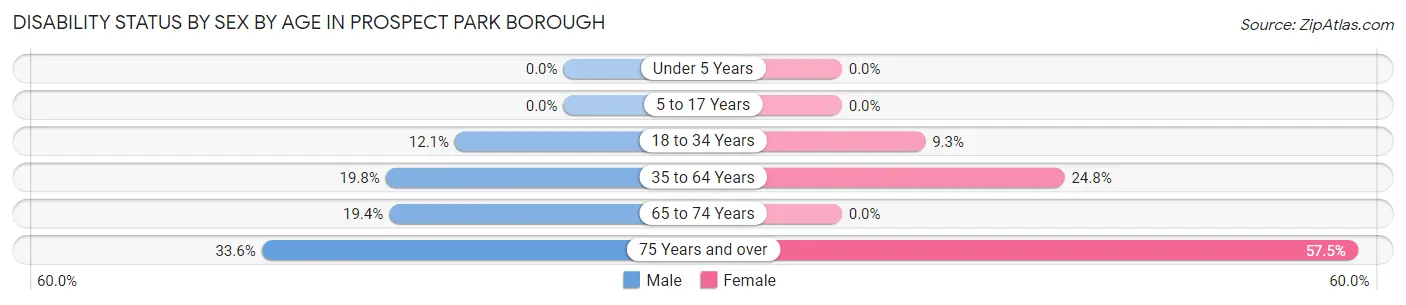
| Age Bracket | Male | Female |
| Under 5 Years | 0 (0.0%) | 0 (0.0%) |
| 5 to 17 Years | 0 (0.0%) | 0 (0.0%) |
| 18 to 34 Years | 86 (12.1%) | 63 (9.3%) |
| 35 to 64 Years | 235 (19.8%) | 339 (24.8%) |
| 65 to 74 Years | 33 (19.4%) | 0 (0.0%) |
| 75 Years and over | 39 (33.6%) | 108 (57.5%) |
Disability Class by Sex by Age in Prospect Park borough
Disability Class: Hearing Difficulty
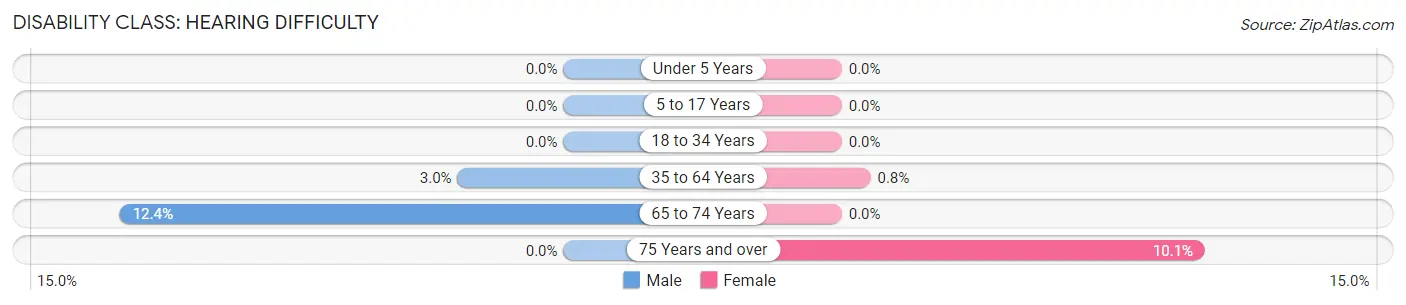
| Age Bracket | Male | Female |
| Under 5 Years | 0 (0.0%) | 0 (0.0%) |
| 5 to 17 Years | 0 (0.0%) | 0 (0.0%) |
| 18 to 34 Years | 0 (0.0%) | 0 (0.0%) |
| 35 to 64 Years | 35 (2.9%) | 11 (0.8%) |
| 65 to 74 Years | 21 (12.3%) | 0 (0.0%) |
| 75 Years and over | 0 (0.0%) | 19 (10.1%) |
Disability Class: Vision Difficulty
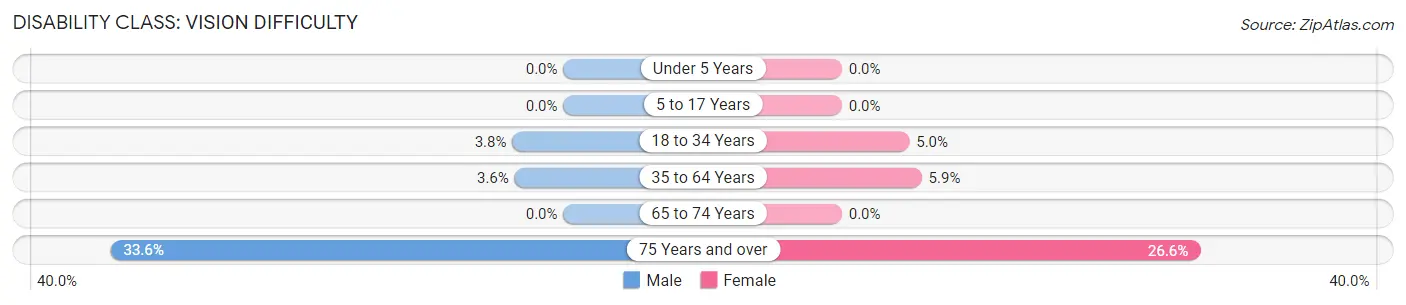
| Age Bracket | Male | Female |
| Under 5 Years | 0 (0.0%) | 0 (0.0%) |
| 5 to 17 Years | 0 (0.0%) | 0 (0.0%) |
| 18 to 34 Years | 27 (3.8%) | 34 (5.0%) |
| 35 to 64 Years | 43 (3.6%) | 81 (5.9%) |
| 65 to 74 Years | 0 (0.0%) | 0 (0.0%) |
| 75 Years and over | 39 (33.6%) | 50 (26.6%) |
Disability Class: Cognitive Difficulty
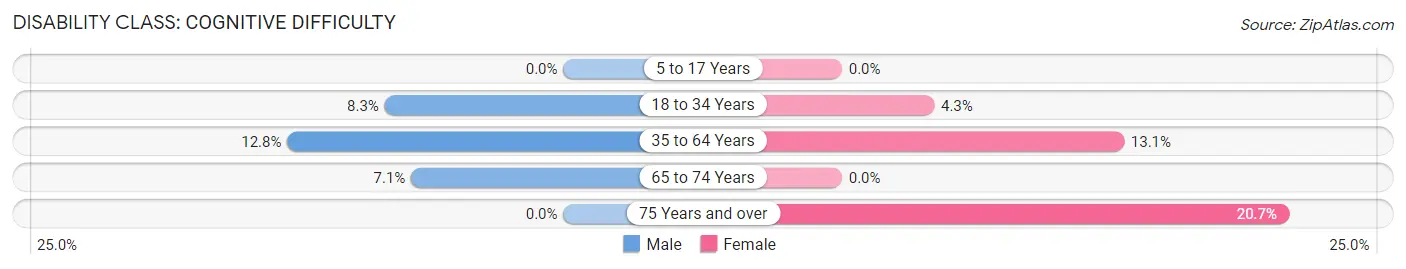
| Age Bracket | Male | Female |
| 5 to 17 Years | 0 (0.0%) | 0 (0.0%) |
| 18 to 34 Years | 59 (8.3%) | 29 (4.3%) |
| 35 to 64 Years | 152 (12.8%) | 179 (13.1%) |
| 65 to 74 Years | 12 (7.1%) | 0 (0.0%) |
| 75 Years and over | 0 (0.0%) | 39 (20.7%) |
Disability Class: Ambulatory Difficulty
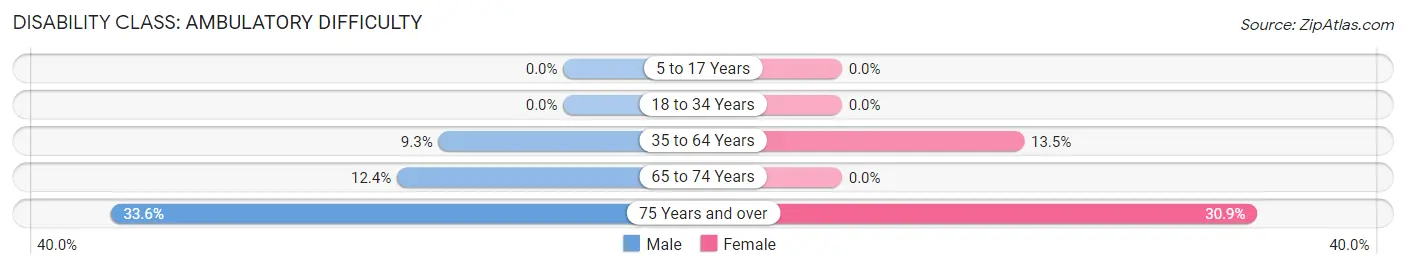
| Age Bracket | Male | Female |
| 5 to 17 Years | 0 (0.0%) | 0 (0.0%) |
| 18 to 34 Years | 0 (0.0%) | 0 (0.0%) |
| 35 to 64 Years | 110 (9.3%) | 185 (13.5%) |
| 65 to 74 Years | 21 (12.3%) | 0 (0.0%) |
| 75 Years and over | 39 (33.6%) | 58 (30.8%) |
Disability Class: Self-Care Difficulty
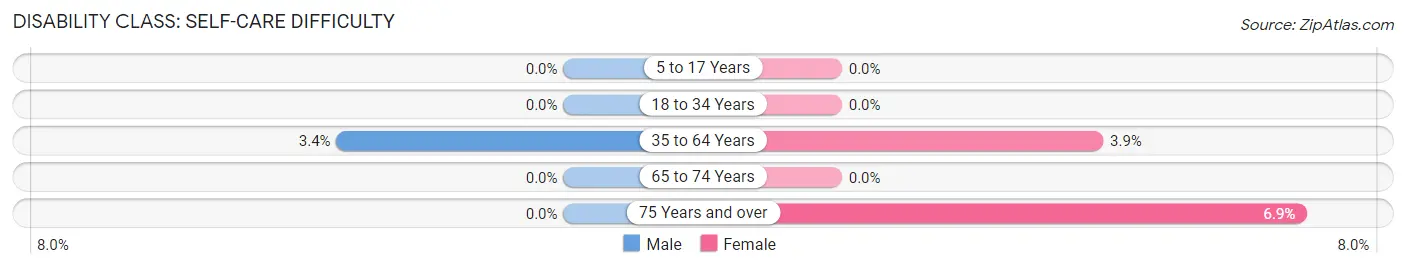
| Age Bracket | Male | Female |
| 5 to 17 Years | 0 (0.0%) | 0 (0.0%) |
| 18 to 34 Years | 0 (0.0%) | 0 (0.0%) |
| 35 to 64 Years | 40 (3.4%) | 53 (3.9%) |
| 65 to 74 Years | 0 (0.0%) | 0 (0.0%) |
| 75 Years and over | 0 (0.0%) | 13 (6.9%) |
Technology Access in Prospect Park borough
Computing Device Access in Prospect Park borough
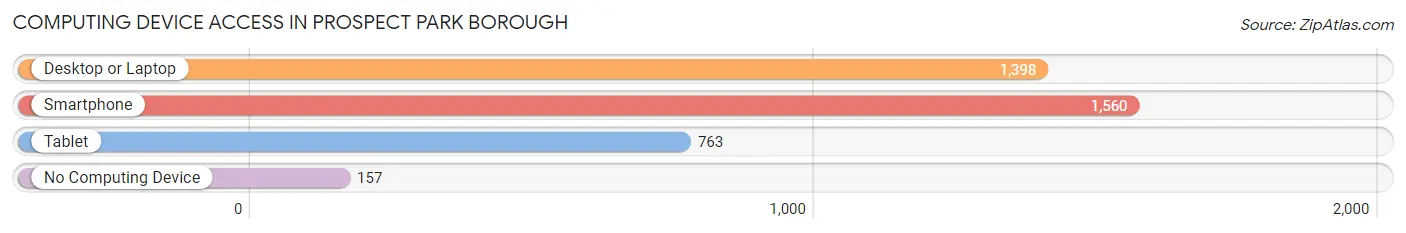
| Device Type | # Households | % Households |
| Desktop or Laptop | 1,398 | 73.9% |
| Smartphone | 1,560 | 82.5% |
| Tablet | 763 | 40.3% |
| No Computing Device | 157 | 8.3% |
| Total | 1,892 | 100.0% |
Internet Access in Prospect Park borough
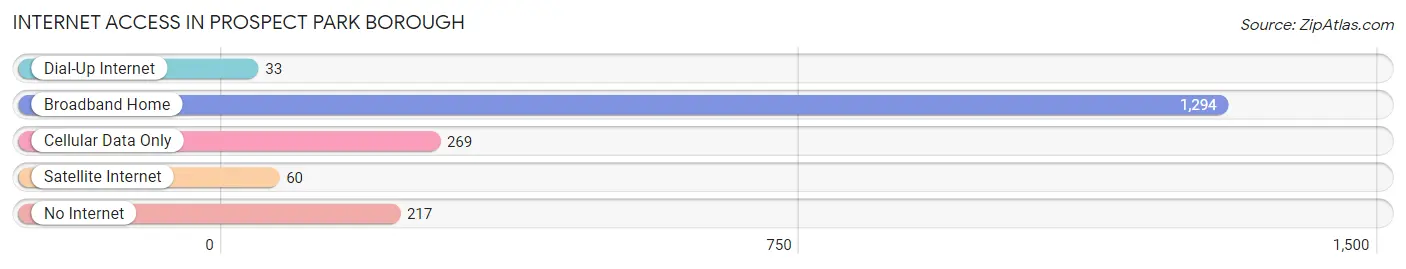
| Internet Type | # Households | % Households |
| Dial-Up Internet | 33 | 1.7% |
| Broadband Home | 1,294 | 68.4% |
| Cellular Data Only | 269 | 14.2% |
| Satellite Internet | 60 | 3.2% |
| No Internet | 217 | 11.5% |
| Total | 1,892 | 100.0% |
Prospect Park borough Summary
Prospect Park Borough is a small borough located in Passaic County, New Jersey. It is situated in the northern part of the state, just south of Paterson and about 20 miles northwest of New York City. The borough is home to a population of 5,865 people, according to the 2010 United States Census.
Geography
Prospect Park Borough is located at 40°51'25" North, 74°10'17" West (40.8569, -74.1714). It is situated in the northern part of Passaic County, just south of Paterson and about 20 miles northwest of New York City. The borough is bordered by the cities of Paterson and Clifton to the north, the boroughs of Haledon and North Haledon to the east, the borough of Hawthorne to the south, and the borough of Fair Lawn to the west.
The borough covers an area of 1.2 square miles, all of which is land. The borough is located in the Hackensack River watershed and is drained by the Passaic River. The borough is home to a number of parks, including Prospect Park, which is located in the center of the borough and is the largest park in the area.
Demographics
As of the 2010 United States Census, there were 5,865 people, 2,093 households, and 1,521 families residing in the borough. The population density was 4,919.2 people per square mile. The racial makeup of the borough was 68.2% White, 11.2% African American, 0.3% Native American, 8.2% Asian, 0.1% Pacific Islander, 8.2% from other races, and 3.9% from two or more races. Hispanic or Latino of any race were 22.3% of the population.
There were 2,093 households, out of which 33.2% had children under the age of 18 living with them, 51.2% were married couples living together, 14.2% had a female householder with no husband present, and 28.2% were non-families. 22.3% of all households were made up of individuals, and 8.2% had someone living alone who was 65 years of age or older. The average household size was 2.81 and the average family size was 3.30.
The median age in the borough was 36.7 years. 24.2% of residents were under the age of 18; 9.2% were between the ages of 18 and 24; 28.2% were from 25 to 44; 26.2% were from 45 to 64; and 12.2% were 65 years of age or older. The gender makeup of the borough was 48.2% male and 51.8% female.
Economy
The economy of Prospect Park Borough is largely based on the service industry. The borough is home to a number of restaurants, retail stores, and other businesses. The borough is also home to a number of industrial and manufacturing businesses, including a plastics factory and a printing company.
The median household income in the borough was $60,938, and the median family income was $68,958. About 8.2% of families and 10.2% of the population were below the poverty line, including 14.2% of those under age 18 and 8.2% of those age 65 or over.
Conclusion
Prospect Park Borough is a small borough located in Passaic County, New Jersey. It is situated in the northern part of the state, just south of Paterson and about 20 miles northwest of New York City. The borough is home to a population of 5,865 people, according to the 2010 United States Census. The borough covers an area of 1.2 square miles, all of which is land. The economy of Prospect Park Borough is largely based on the service industry, with a number of restaurants, retail stores, and other businesses located in the borough. The median household income in the borough was $60,938, and the median family income was $68,958.
Common Questions
What is Per Capita Income in Prospect Park borough?
Per Capita income in Prospect Park borough is $25,501.
What is the Median Family Income in Prospect Park borough?
Median Family Income in Prospect Park borough is $59,167.
What is the Median Household income in Prospect Park borough?
Median Household Income in Prospect Park borough is $54,271.
What is Income or Wage Gap in Prospect Park borough?
Income or Wage Gap in Prospect Park borough is 29.8%.
Women in Prospect Park borough earn 70.2 cents for every dollar earned by a man.
What is Inequality or Gini Index in Prospect Park borough?
Inequality or Gini Index in Prospect Park borough is 0.52.
What is the Total Population of Prospect Park borough?
Total Population of Prospect Park borough is 6,299.
What is the Total Male Population of Prospect Park borough?
Total Male Population of Prospect Park borough is 3,227.
What is the Total Female Population of Prospect Park borough?
Total Female Population of Prospect Park borough is 3,072.
What is the Ratio of Males per 100 Females in Prospect Park borough?
There are 105.05 Males per 100 Females in Prospect Park borough.
What is the Ratio of Females per 100 Males in Prospect Park borough?
There are 95.20 Females per 100 Males in Prospect Park borough.
What is the Median Population Age in Prospect Park borough?
Median Population Age in Prospect Park borough is 35.5 Years.
What is the Average Family Size in Prospect Park borough
Average Family Size in Prospect Park borough is 3.8 People.
What is the Average Household Size in Prospect Park borough
Average Household Size in Prospect Park borough is 3.3 People.
How Large is the Labor Force in Prospect Park borough?
There are 3,162 People in the Labor Forcein in Prospect Park borough.
What is the Percentage of People in the Labor Force in Prospect Park borough?
64.8% of People are in the Labor Force in Prospect Park borough.
What is the Unemployment Rate in Prospect Park borough?
Unemployment Rate in Prospect Park borough is 9.0%.