Cities with the Highest Percentage of Hispanic or Latino Population in Michigan
RELATED REPORTS & OPTIONS
Hispanic or Latino
Michigan
Compare Cities
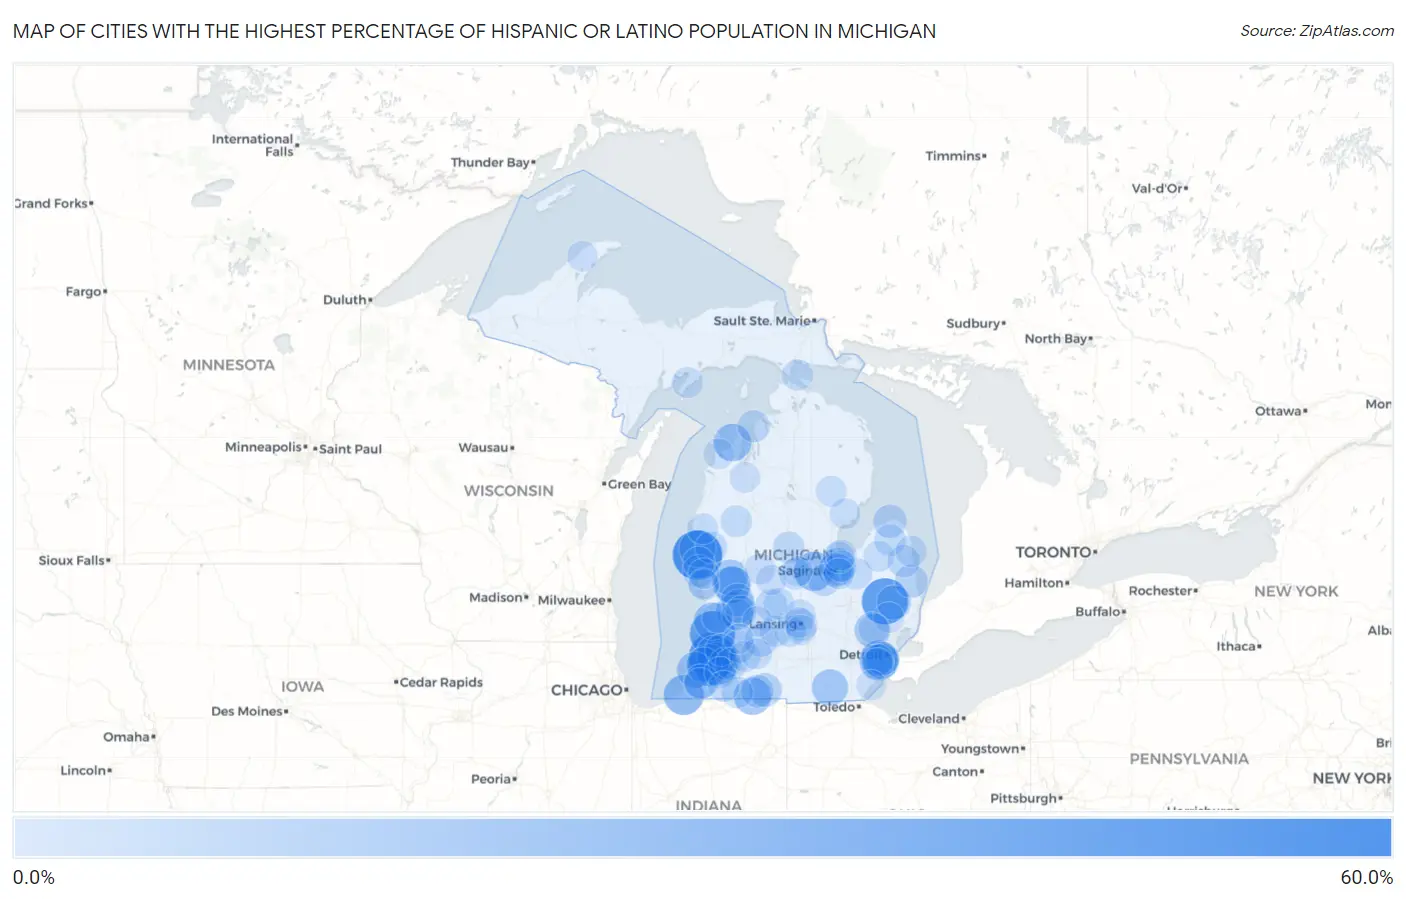
Map of Cities with the Highest Percentage of Hispanic or Latino Population in Michigan
0.0%
60.0%
Cities with the Highest Percentage of Hispanic or Latino Population in Michigan
| City | Hispanic or Latino | vs State | vs National | |
| 1. | Shelby | 51.6% | 5.5%(+46.2)#1 | 18.7%(+33.0)#1,880 |
| 2. | Bangor | 45.4% | 5.5%(+39.9)#2 | 18.7%(+26.8)#2,184 |
| 3. | Imlay City | 44.1% | 5.5%(+38.6)#3 | 18.7%(+25.5)#2,263 |
| 4. | Fennville | 42.2% | 5.5%(+36.7)#4 | 18.7%(+23.5)#2,383 |
| 5. | Lawrence | 36.0% | 5.5%(+30.6)#5 | 18.7%(+17.4)#2,802 |
| 6. | Hartford | 34.0% | 5.5%(+28.5)#6 | 18.7%(+15.3)#2,984 |
| 7. | Three Oaks | 29.9% | 5.5%(+24.4)#7 | 18.7%(+11.3)#3,406 |
| 8. | Merrill | 28.5% | 5.5%(+23.0)#8 | 18.7%(+9.86)#3,559 |
| 9. | Lincoln Park | 26.7% | 5.5%(+21.2)#9 | 18.7%(+8.04)#3,806 |
| 10. | Leland | 24.4% | 5.5%(+19.0)#10 | 18.7%(+5.78)#4,108 |
| 11. | Wyoming | 24.1% | 5.5%(+18.6)#11 | 18.7%(+5.41)#4,172 |
| 12. | Holland | 23.9% | 5.5%(+18.5)#12 | 18.7%(+5.28)#4,197 |
| 13. | Sturgis | 23.9% | 5.5%(+18.5)#13 | 18.7%(+5.28)#4,198 |
| 14. | Breedsville | 23.3% | 5.5%(+17.9)#14 | 18.7%(+4.68)#4,306 |
| 15. | Melvindale | 22.8% | 5.5%(+17.3)#15 | 18.7%(+4.13)#4,400 |
| 16. | Casnovia | 22.7% | 5.5%(+17.2)#16 | 18.7%(+4.06)#4,410 |
| 17. | Kent City | 22.6% | 5.5%(+17.1)#17 | 18.7%(+3.90)#4,438 |
| 18. | Hart | 22.3% | 5.5%(+16.8)#18 | 18.7%(+3.67)#4,476 |
| 19. | Benton Heights | 21.7% | 5.5%(+16.3)#19 | 18.7%(+3.09)#4,589 |
| 20. | Adrian | 21.7% | 5.5%(+16.2)#20 | 18.7%(+3.01)#4,602 |
| 21. | Grant | 21.0% | 5.5%(+15.5)#21 | 18.7%(+2.36)#4,740 |
| 22. | Pontiac | 20.6% | 5.5%(+15.2)#22 | 18.7%(+1.98)#4,820 |
| 23. | Mears | 20.6% | 5.5%(+15.1)#23 | 18.7%(+1.90)#4,835 |
| 24. | Watervliet | 19.5% | 5.5%(+14.1)#24 | 18.7%(+0.891)#5,077 |
| 25. | Ecorse | 19.1% | 5.5%(+13.6)#25 | 18.7%(+0.429)#5,173 |
| 26. | Capac | 17.0% | 5.5%(+11.5)#26 | 18.7%(-1.67)#5,742 |
| 27. | Eau Claire | 16.9% | 5.5%(+11.4)#27 | 18.7%(-1.76)#5,765 |
| 28. | Zilwaukee | 16.4% | 5.5%(+11.0)#28 | 18.7%(-2.21)#5,893 |
| 29. | Saginaw | 16.4% | 5.5%(+10.9)#29 | 18.7%(-2.24)#5,899 |
| 30. | Grand Rapids | 15.9% | 5.5%(+10.5)#30 | 18.7%(-2.70)#6,057 |
| 31. | Bronson | 15.7% | 5.5%(+10.2)#31 | 18.7%(-2.99)#6,151 |
| 32. | River Rouge | 15.5% | 5.5%(+9.99)#32 | 18.7%(-3.19)#6,208 |
| 33. | Dowling | 14.9% | 5.5%(+9.42)#33 | 18.7%(-3.76)#6,398 |
| 34. | Port Austin | 14.8% | 5.5%(+9.37)#34 | 18.7%(-3.81)#6,421 |
| 35. | Croswell | 14.6% | 5.5%(+9.12)#35 | 18.7%(-4.05)#6,515 |
| 36. | Comstock Park | 14.3% | 5.5%(+8.84)#36 | 18.7%(-4.33)#6,610 |
| 37. | Burr Oak | 13.8% | 5.5%(+8.31)#37 | 18.7%(-4.87)#6,799 |
| 38. | Whitehall | 13.5% | 5.5%(+7.99)#38 | 18.7%(-5.19)#6,946 |
| 39. | Palo | 13.0% | 5.5%(+7.55)#39 | 18.7%(-5.63)#7,133 |
| 40. | Deckerville | 12.9% | 5.5%(+7.46)#40 | 18.7%(-5.72)#7,167 |
| 41. | Norwood | 12.8% | 5.5%(+7.35)#41 | 18.7%(-5.83)#7,220 |
| 42. | Paw Paw | 12.7% | 5.5%(+7.22)#42 | 18.7%(-5.96)#7,279 |
| 43. | St Charles | 12.7% | 5.5%(+7.20)#43 | 18.7%(-5.98)#7,287 |
| 44. | Plainwell | 12.6% | 5.5%(+7.15)#44 | 18.7%(-6.03)#7,312 |
| 45. | Lansing | 12.5% | 5.5%(+7.01)#45 | 18.7%(-6.17)#7,363 |
| 46. | Walkerville | 12.3% | 5.5%(+6.79)#46 | 18.7%(-6.39)#7,459 |
| 47. | Buena Vista | 12.2% | 5.5%(+6.77)#47 | 18.7%(-6.41)#7,472 |
| 48. | Bloomingdale | 11.9% | 5.5%(+6.42)#48 | 18.7%(-6.76)#7,650 |
| 49. | Rosebush | 11.8% | 5.5%(+6.35)#49 | 18.7%(-6.83)#7,684 |
| 50. | Mattawan | 11.8% | 5.5%(+6.30)#50 | 18.7%(-6.88)#7,707 |
| 51. | Ionia | 11.7% | 5.5%(+6.22)#51 | 18.7%(-6.96)#7,756 |
| 52. | Allen Park | 11.7% | 5.5%(+6.21)#52 | 18.7%(-6.97)#7,760 |
| 53. | Berrien Springs | 11.6% | 5.5%(+6.10)#53 | 18.7%(-7.08)#7,819 |
| 54. | Rothbury | 11.5% | 5.5%(+6.08)#54 | 18.7%(-7.10)#7,831 |
| 55. | Luther | 11.5% | 5.5%(+6.05)#55 | 18.7%(-7.13)#7,836 |
| 56. | Vassar | 11.3% | 5.5%(+5.86)#56 | 18.7%(-7.32)#7,943 |
| 57. | Vermontville | 11.3% | 5.5%(+5.82)#57 | 18.7%(-7.35)#7,968 |
| 58. | Cutlerville | 11.1% | 5.5%(+5.64)#58 | 18.7%(-7.54)#8,063 |
| 59. | Ramsay | 11.0% | 5.5%(+5.56)#59 | 18.7%(-7.62)#8,105 |
| 60. | Alma | 11.0% | 5.5%(+5.51)#60 | 18.7%(-7.67)#8,133 |
| 61. | Bad Axe | 10.9% | 5.5%(+5.47)#61 | 18.7%(-7.71)#8,146 |
| 62. | Constantine | 10.9% | 5.5%(+5.41)#62 | 18.7%(-7.77)#8,187 |
| 63. | Potterville | 10.9% | 5.5%(+5.40)#63 | 18.7%(-7.78)#8,198 |
| 64. | Robin Glen Indiantown | 10.7% | 5.5%(+5.25)#64 | 18.7%(-7.93)#8,261 |
| 65. | Bay City | 10.6% | 5.5%(+5.16)#65 | 18.7%(-8.02)#8,322 |
| 66. | Forestville | 10.6% | 5.5%(+5.13)#66 | 18.7%(-8.05)#8,332 |
| 67. | Decatur | 10.6% | 5.5%(+5.13)#67 | 18.7%(-8.05)#8,333 |
| 68. | Southgate | 10.5% | 5.5%(+5.07)#68 | 18.7%(-8.11)#8,375 |
| 69. | Mackinac Island | 10.5% | 5.5%(+5.05)#69 | 18.7%(-8.13)#8,384 |
| 70. | Lyons | 10.5% | 5.5%(+5.03)#70 | 18.7%(-8.15)#8,398 |
| 71. | Kentwood | 10.4% | 5.5%(+4.89)#71 | 18.7%(-8.29)#8,490 |
| 72. | Vandalia | 10.3% | 5.5%(+4.81)#72 | 18.7%(-8.37)#8,540 |
| 73. | Scottville | 10.3% | 5.5%(+4.78)#73 | 18.7%(-8.40)#8,557 |
| 74. | Eastwood | 10.2% | 5.5%(+4.73)#74 | 18.7%(-8.45)#8,579 |
| 75. | Dewitt | 10.1% | 5.5%(+4.63)#75 | 18.7%(-8.55)#8,640 |
| 76. | Garden | 10.1% | 5.5%(+4.59)#76 | 18.7%(-8.59)#8,669 |
| 77. | Lupton | 9.7% | 5.5%(+4.27)#77 | 18.7%(-8.90)#8,879 |
| 78. | Muskegon | 9.7% | 5.5%(+4.22)#78 | 18.7%(-8.96)#8,904 |
| 79. | North Muskegon | 9.7% | 5.5%(+4.22)#79 | 18.7%(-8.96)#8,907 |
| 80. | Augusta | 9.6% | 5.5%(+4.16)#80 | 18.7%(-9.02)#8,955 |
| 81. | Cass City | 9.6% | 5.5%(+4.16)#81 | 18.7%(-9.02)#8,957 |
| 82. | Lakeview | 9.5% | 5.5%(+4.07)#82 | 18.7%(-9.11)#9,017 |
| 83. | Essexville | 9.5% | 5.5%(+4.02)#83 | 18.7%(-9.16)#9,057 |
| 84. | Turner | 9.5% | 5.5%(+3.99)#84 | 18.7%(-9.19)#9,080 |
| 85. | Bridgeport | 9.4% | 5.5%(+3.93)#85 | 18.7%(-9.24)#9,113 |
| 86. | Zeeland | 9.4% | 5.5%(+3.93)#86 | 18.7%(-9.25)#9,118 |
| 87. | Lakewood Club | 9.4% | 5.5%(+3.92)#87 | 18.7%(-9.26)#9,126 |
| 88. | Romeo | 9.3% | 5.5%(+3.78)#88 | 18.7%(-9.40)#9,214 |
| 89. | Glen Arbor | 9.2% | 5.5%(+3.75)#89 | 18.7%(-9.43)#9,251 |
| 90. | Ahmeek | 9.2% | 5.5%(+3.72)#90 | 18.7%(-9.46)#9,278 |
| 91. | Kingsley | 9.2% | 5.5%(+3.68)#91 | 18.7%(-9.50)#9,310 |
| 92. | Auburn Hills | 9.0% | 5.5%(+3.57)#92 | 18.7%(-9.61)#9,396 |
| 93. | Stanton | 9.0% | 5.5%(+3.50)#93 | 18.7%(-9.68)#9,451 |
| 94. | Edgemont Park | 8.8% | 5.5%(+3.28)#94 | 18.7%(-9.90)#9,622 |
| 95. | Freeport | 8.7% | 5.5%(+3.22)#95 | 18.7%(-9.96)#9,671 |
| 96. | Holt | 8.5% | 5.5%(+3.07)#96 | 18.7%(-10.1)#9,785 |
| 97. | Martin | 8.5% | 5.5%(+3.02)#97 | 18.7%(-10.2)#9,824 |
| 98. | St Louis | 8.4% | 5.5%(+2.94)#98 | 18.7%(-10.2)#9,889 |
| 99. | Cambria | 8.4% | 5.5%(+2.90)#99 | 18.7%(-10.3)#9,919 |
| 100. | Detroit Beach | 8.3% | 5.5%(+2.85)#100 | 18.7%(-10.3)#9,978 |
Common Questions
What are the Top 10 Cities with the Highest Percentage of Hispanic or Latino Population in Michigan?
Top 10 Cities with the Highest Percentage of Hispanic or Latino Population in Michigan are:
#1
51.6%
#2
45.4%
#3
44.1%
#4
42.2%
#5
36.0%
#6
34.0%
#7
29.9%
#8
28.5%
#9
26.7%
#10
24.4%
What city has the Highest Percentage of Hispanic or Latino Population in Michigan?
Shelby has the Highest Percentage of Hispanic or Latino Population in Michigan with 51.6%.
What is the Percentage of Hispanic or Latino Population in the State of Michigan?
Percentage of Hispanic or Latino Population in Michigan is 5.5%.
What is the Percentage of Hispanic or Latino Population in the United States?
Percentage of Hispanic or Latino Population in the United States is 18.7%.