Haledon borough, NJ Map & Demographics
Haledon borough Overview
$37,366
PER CAPITA INCOME
$106,724
AVG FAMILY INCOME
$98,462
AVG HOUSEHOLD INCOME
4.5%
WAGE / INCOME GAP [ % ]
95.5¢/ $1
WAGE / INCOME GAP [ $ ]
0.38
INEQUALITY / GINI INDEX
8,945
TOTAL POPULATION
4,387
MALE POPULATION
4,558
FEMALE POPULATION
96.25
MALES / 100 FEMALES
103.90
FEMALES / 100 MALES
39.5
MEDIAN AGE
3.1
AVG FAMILY SIZE
2.8
AVG HOUSEHOLD SIZE
4,980
LABOR FORCE [ PEOPLE ]
68.8%
PERCENT IN LABOR FORCE
5.8%
UNEMPLOYMENT RATE
Income in Haledon borough
Income Overview in Haledon borough
Per Capita Income in Haledon borough is $37,366, while median incomes of families and households are $106,724 and $98,462 respectively.
| Characteristic | Number | Measure |
| Per Capita Income | 8,945 | $37,366 |
| Median Family Income | 2,541 | $106,724 |
| Mean Family Income | 2,541 | $114,521 |
| Median Household Income | 3,192 | $98,462 |
| Mean Household Income | 3,192 | $103,589 |
| Income Deficit | 2,541 | $0 |
| Wage / Income Gap (%) | 8,945 | 4.54% |
| Wage / Income Gap ($) | 8,945 | 95.46¢ per $1 |
| Gini / Inequality Index | 8,945 | 0.38 |
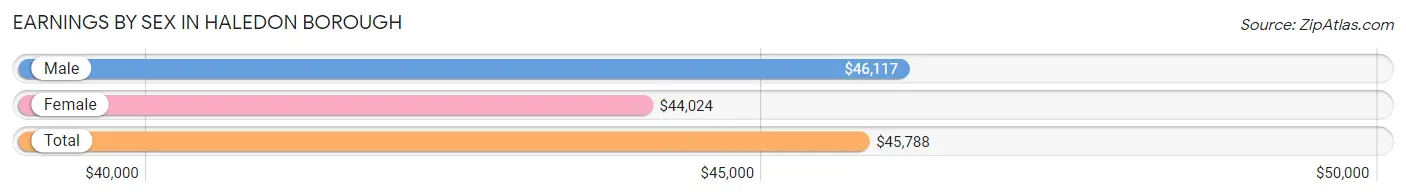
Earnings by Sex in Haledon borough
Average Earnings in Haledon borough are $45,788, $46,117 for men and $44,024 for women, a difference of 4.5%.
| Sex | Number | Average Earnings |
| Male | 2,753 (54.4%) | $46,117 |
| Female | 2,304 (45.6%) | $44,024 |
| Total | 5,057 (100.0%) | $45,788 |
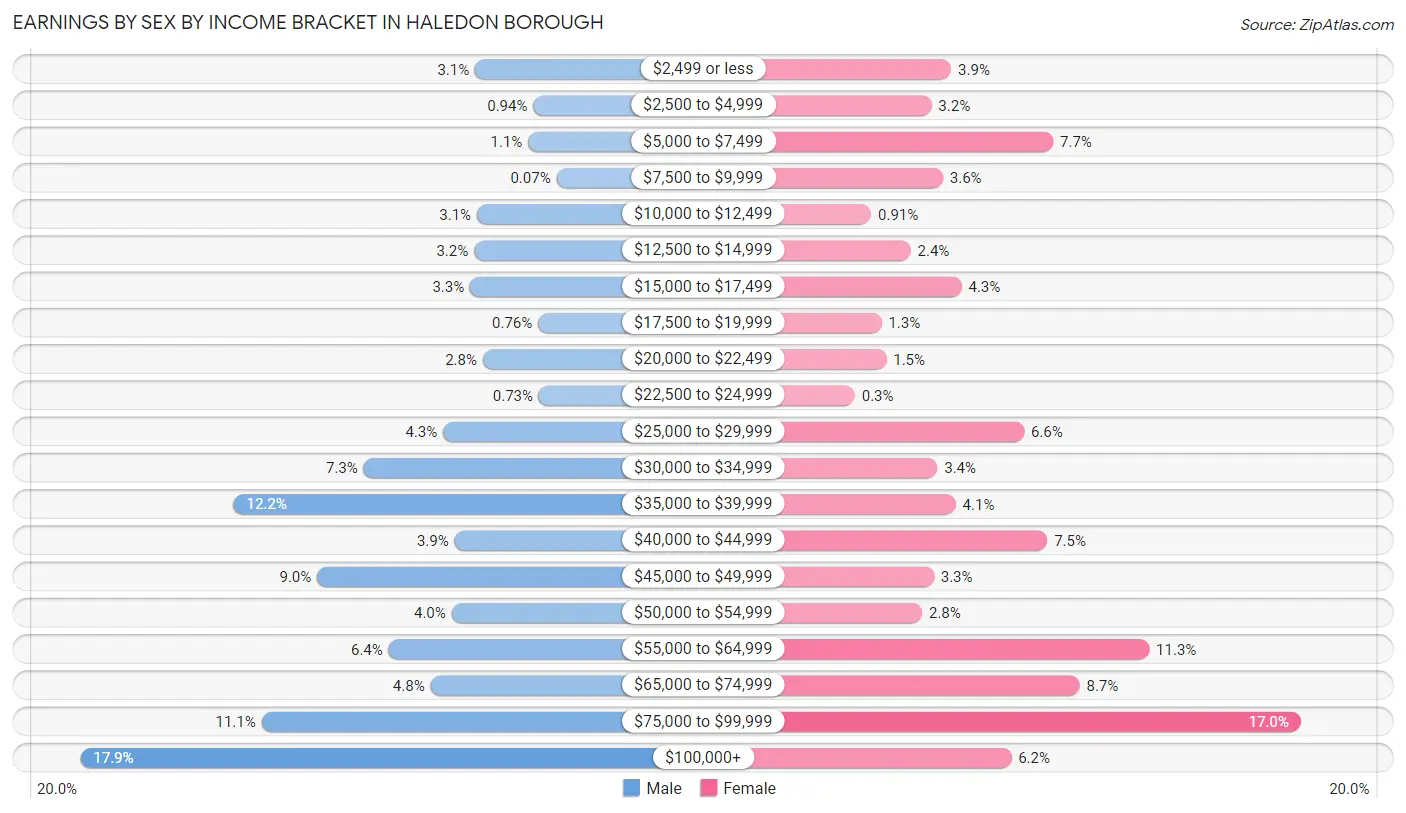
Earnings by Sex by Income Bracket in Haledon borough
The most common earnings brackets in Haledon borough are $100,000+ for men (493 | 17.9%) and $75,000 to $99,999 for women (392 | 17.0%).
| Income | Male | Female |
| $2,499 or less | 86 (3.1%) | 90 (3.9%) |
| $2,500 to $4,999 | 26 (0.9%) | 73 (3.2%) |
| $5,000 to $7,499 | 31 (1.1%) | 178 (7.7%) |
| $7,500 to $9,999 | 2 (0.1%) | 83 (3.6%) |
| $10,000 to $12,499 | 84 (3.0%) | 21 (0.9%) |
| $12,500 to $14,999 | 87 (3.2%) | 55 (2.4%) |
| $15,000 to $17,499 | 91 (3.3%) | 99 (4.3%) |
| $17,500 to $19,999 | 21 (0.8%) | 30 (1.3%) |
| $20,000 to $22,499 | 78 (2.8%) | 34 (1.5%) |
| $22,500 to $24,999 | 20 (0.7%) | 7 (0.3%) |
| $25,000 to $29,999 | 119 (4.3%) | 153 (6.6%) |
| $30,000 to $34,999 | 201 (7.3%) | 78 (3.4%) |
| $35,000 to $39,999 | 335 (12.2%) | 94 (4.1%) |
| $40,000 to $44,999 | 107 (3.9%) | 173 (7.5%) |
| $45,000 to $49,999 | 249 (9.0%) | 75 (3.3%) |
| $50,000 to $54,999 | 110 (4.0%) | 65 (2.8%) |
| $55,000 to $64,999 | 175 (6.4%) | 261 (11.3%) |
| $65,000 to $74,999 | 132 (4.8%) | 201 (8.7%) |
| $75,000 to $99,999 | 306 (11.1%) | 392 (17.0%) |
| $100,000+ | 493 (17.9%) | 142 (6.2%) |
| Total | 2,753 (100.0%) | 2,304 (100.0%) |
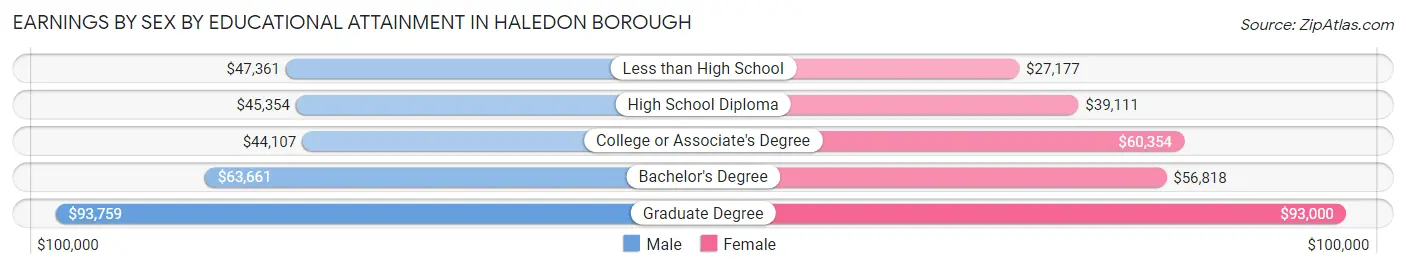
Earnings by Sex by Educational Attainment in Haledon borough
Average earnings in Haledon borough are $48,382 for men and $48,343 for women, a difference of 0.1%. Men with an educational attainment of graduate degree enjoy the highest average annual earnings of $93,759, while those with college or associate's degree education earn the least with $44,107. Women with an educational attainment of graduate degree earn the most with the average annual earnings of $93,000, while those with less than high school education have the smallest earnings of $27,177.
| Educational Attainment | Male Income | Female Income |
| Less than High School | $47,361 | $27,177 |
| High School Diploma | $45,354 | $39,111 |
| College or Associate's Degree | $44,107 | $60,354 |
| Bachelor's Degree | $63,661 | $56,818 |
| Graduate Degree | $93,759 | $93,000 |
| Total | $48,382 | $48,343 |
Family Income in Haledon borough
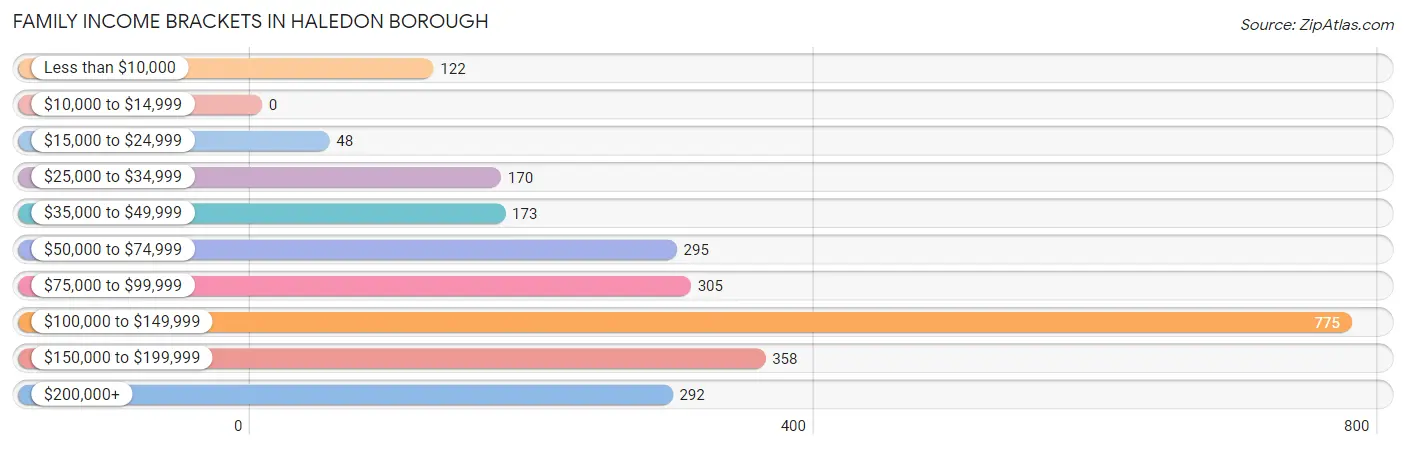
Family Income Brackets in Haledon borough
According to the Haledon borough family income data, there are 775 families falling into the $100,000 to $149,999 income range, which is the most common income bracket and makes up 30.5% of all families.
| Income Bracket | # Families | % Families |
| Less than $10,000 | 122 | 4.8% |
| $10,000 to $14,999 | 0 | 0.0% |
| $15,000 to $24,999 | 48 | 1.9% |
| $25,000 to $34,999 | 170 | 6.7% |
| $35,000 to $49,999 | 173 | 6.8% |
| $50,000 to $74,999 | 295 | 11.6% |
| $75,000 to $99,999 | 305 | 12.0% |
| $100,000 to $149,999 | 775 | 30.5% |
| $150,000 to $199,999 | 358 | 14.1% |
| $200,000+ | 292 | 11.5% |
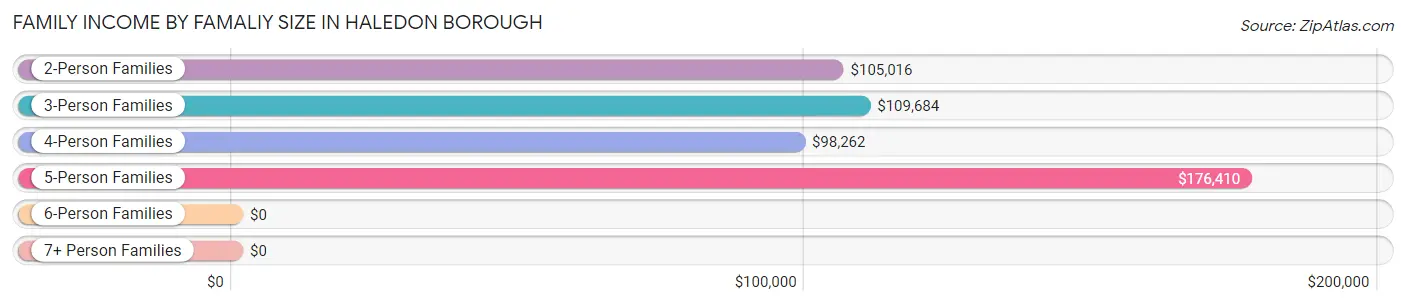
Family Income by Famaliy Size in Haledon borough
5-person families (189 | 7.4%) account for the highest median family income in Haledon borough with $176,410 per family, while 2-person families (884 | 34.8%) have the highest median income of $52,508 per family member.
| Income Bracket | # Families | Median Income |
| 2-Person Families | 884 (34.8%) | $105,016 |
| 3-Person Families | 827 (32.6%) | $109,684 |
| 4-Person Families | 617 (24.3%) | $98,262 |
| 5-Person Families | 189 (7.4%) | $176,410 |
| 6-Person Families | 24 (0.9%) | $0 |
| 7+ Person Families | 0 (0.0%) | $0 |
| Total | 2,541 (100.0%) | $106,724 |
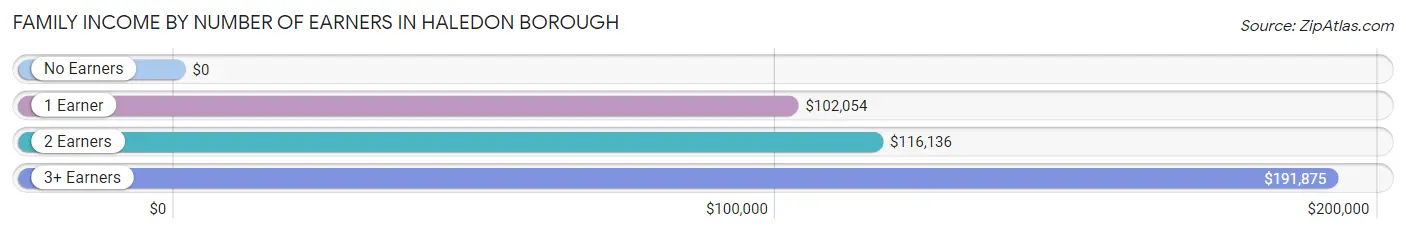
Family Income by Number of Earners in Haledon borough
| Number of Earners | # Families | Median Income |
| No Earners | 205 (8.1%) | $0 |
| 1 Earner | 871 (34.3%) | $102,054 |
| 2 Earners | 1,040 (40.9%) | $116,136 |
| 3+ Earners | 425 (16.7%) | $191,875 |
| Total | 2,541 (100.0%) | $106,724 |
Household Income in Haledon borough
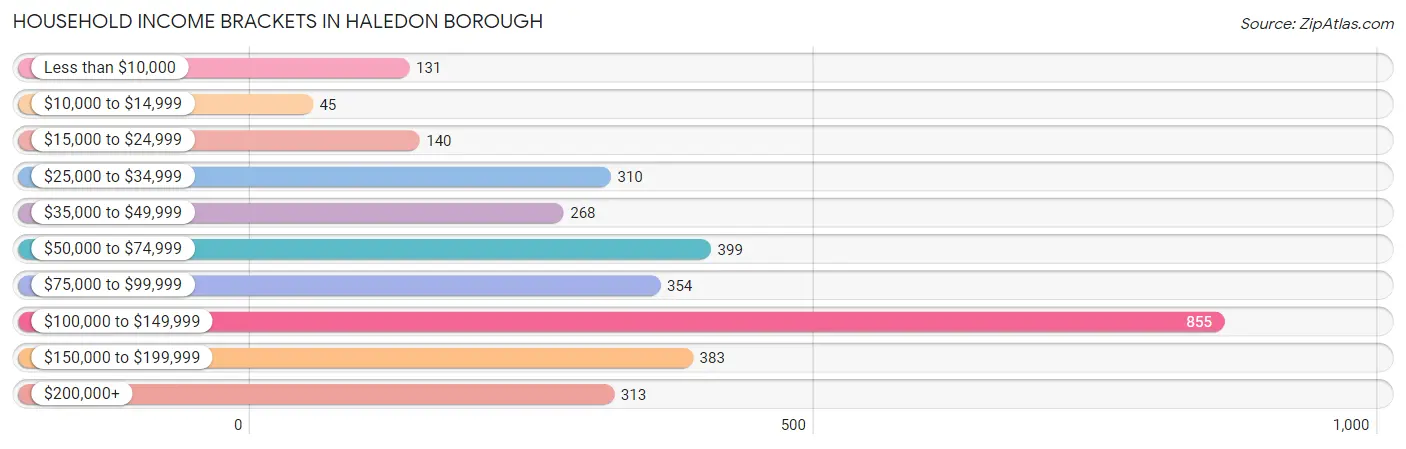
Household Income Brackets in Haledon borough
With 855 households falling in the category, the $100,000 to $149,999 income range is the most frequent in Haledon borough, accounting for 26.8% of all households. In contrast, only 45 households (1.4%) fall into the $10,000 to $14,999 income bracket, making it the least populous group.
| Income Bracket | # Households | % Households |
| Less than $10,000 | 131 | 4.1% |
| $10,000 to $14,999 | 45 | 1.4% |
| $15,000 to $24,999 | 140 | 4.4% |
| $25,000 to $34,999 | 310 | 9.7% |
| $35,000 to $49,999 | 268 | 8.4% |
| $50,000 to $74,999 | 399 | 12.5% |
| $75,000 to $99,999 | 354 | 11.1% |
| $100,000 to $149,999 | 855 | 26.8% |
| $150,000 to $199,999 | 383 | 12.0% |
| $200,000+ | 313 | 9.8% |
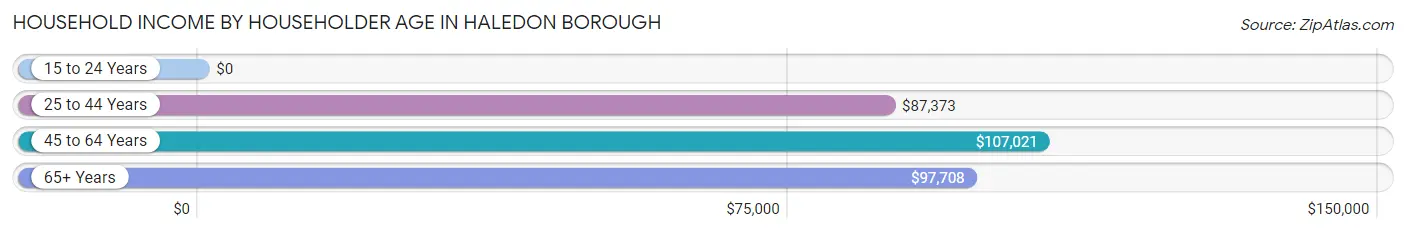
Household Income by Householder Age in Haledon borough
The median household income in Haledon borough is $98,462, with the highest median household income of $107,021 found in the 45 to 64 years age bracket for the primary householder. A total of 1,069 households (33.5%) fall into this category. Meanwhile, the 15 to 24 years age bracket for the primary householder has the lowest median household income of $0, with 13 households (0.4%) in this group.
| Income Bracket | # Households | Median Income |
| 15 to 24 Years | 13 (0.4%) | $0 |
| 25 to 44 Years | 1,291 (40.4%) | $87,373 |
| 45 to 64 Years | 1,069 (33.5%) | $107,021 |
| 65+ Years | 819 (25.7%) | $97,708 |
| Total | 3,192 (100.0%) | $98,462 |
Poverty in Haledon borough
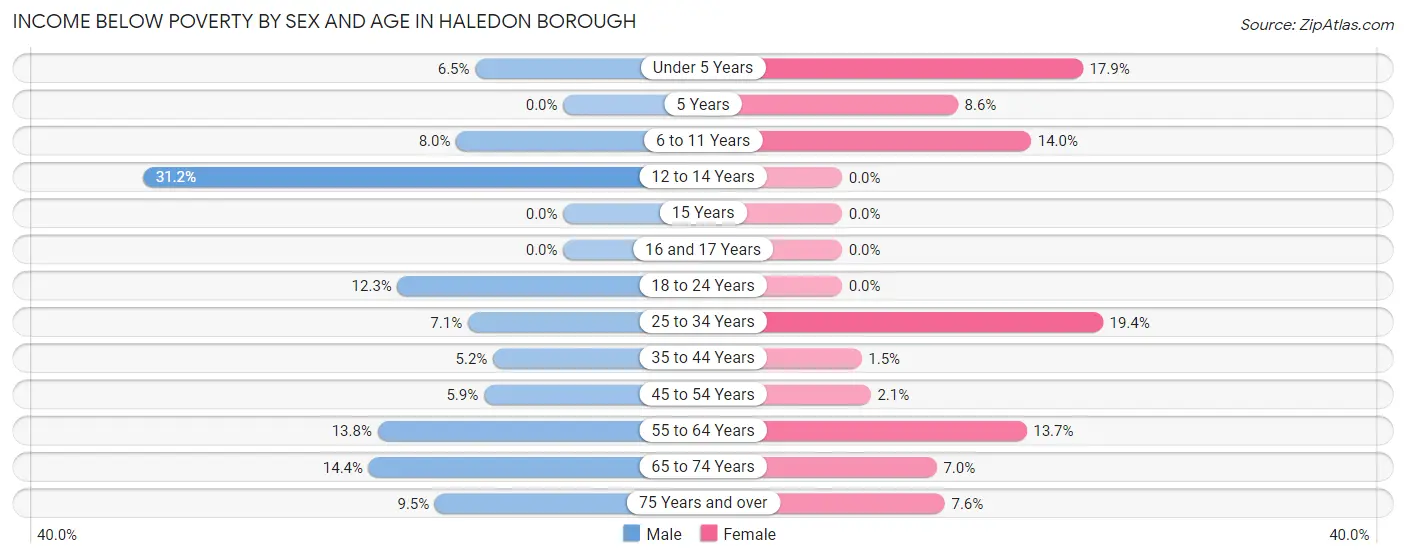
Income Below Poverty by Sex and Age in Haledon borough
With 9.2% poverty level for males and 8.0% for females among the residents of Haledon borough, 12 to 14 year old males and 25 to 34 year old females are the most vulnerable to poverty, with 59 males (31.2%) and 121 females (19.4%) in their respective age groups living below the poverty level.
| Age Bracket | Male | Female |
| Under 5 Years | 19 (6.5%) | 47 (17.9%) |
| 5 Years | 0 (0.0%) | 8 (8.6%) |
| 6 to 11 Years | 24 (8.0%) | 31 (14.0%) |
| 12 to 14 Years | 59 (31.2%) | 0 (0.0%) |
| 15 Years | 0 (0.0%) | 0 (0.0%) |
| 16 and 17 Years | 0 (0.0%) | 0 (0.0%) |
| 18 to 24 Years | 39 (12.3%) | 0 (0.0%) |
| 25 to 34 Years | 56 (7.1%) | 121 (19.4%) |
| 35 to 44 Years | 35 (5.2%) | 10 (1.5%) |
| 45 to 54 Years | 45 (5.9%) | 14 (2.1%) |
| 55 to 64 Years | 51 (13.8%) | 67 (13.7%) |
| 65 to 74 Years | 52 (14.4%) | 37 (7.0%) |
| 75 Years and over | 22 (9.5%) | 27 (7.6%) |
| Total | 402 (9.2%) | 362 (8.0%) |
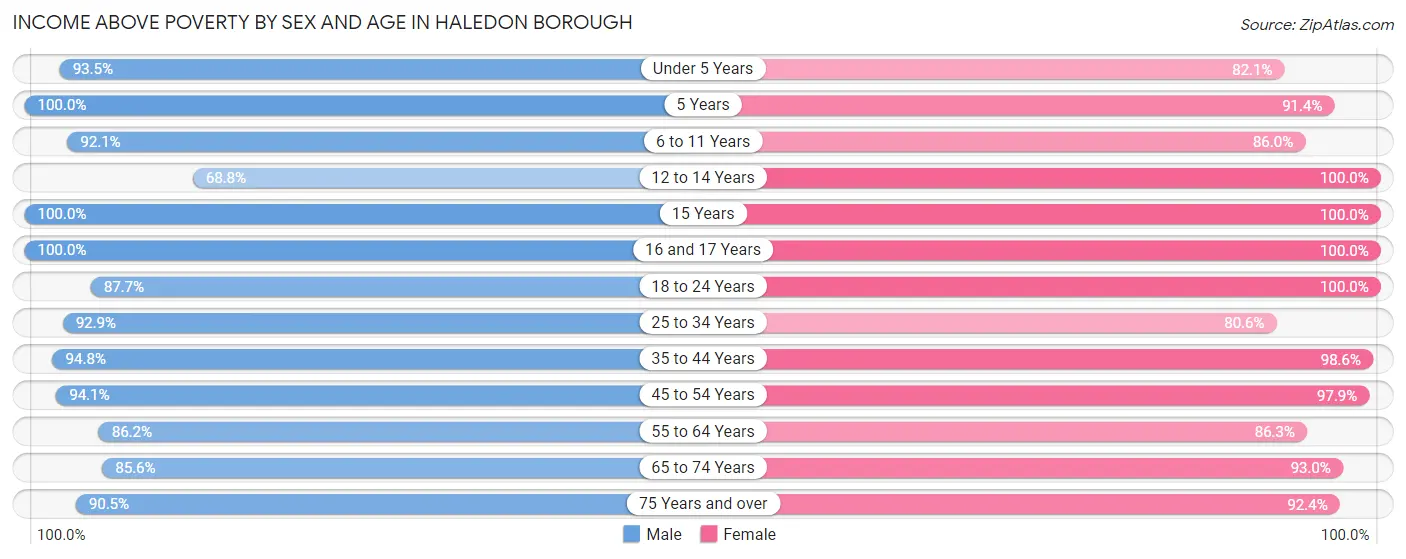
Income Above Poverty by Sex and Age in Haledon borough
According to the poverty statistics in Haledon borough, males aged 5 years and females aged 12 to 14 years are the age groups that are most secure financially, with 100.0% of males and 100.0% of females in these age groups living above the poverty line.
| Age Bracket | Male | Female |
| Under 5 Years | 272 (93.5%) | 216 (82.1%) |
| 5 Years | 33 (100.0%) | 85 (91.4%) |
| 6 to 11 Years | 278 (92.0%) | 190 (86.0%) |
| 12 to 14 Years | 130 (68.8%) | 214 (100.0%) |
| 15 Years | 28 (100.0%) | 64 (100.0%) |
| 16 and 17 Years | 39 (100.0%) | 179 (100.0%) |
| 18 to 24 Years | 278 (87.7%) | 174 (100.0%) |
| 25 to 34 Years | 735 (92.9%) | 504 (80.6%) |
| 35 to 44 Years | 637 (94.8%) | 681 (98.6%) |
| 45 to 54 Years | 719 (94.1%) | 642 (97.9%) |
| 55 to 64 Years | 319 (86.2%) | 422 (86.3%) |
| 65 to 74 Years | 308 (85.6%) | 489 (93.0%) |
| 75 Years and over | 209 (90.5%) | 327 (92.4%) |
| Total | 3,985 (90.8%) | 4,187 (92.0%) |
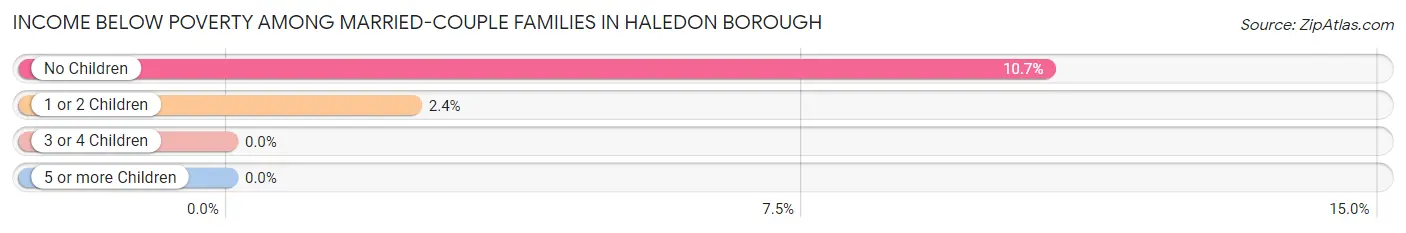
Income Below Poverty Among Married-Couple Families in Haledon borough
The poverty statistics for married-couple families in Haledon borough show that 6.8% or 95 of the total 1,400 families live below the poverty line. Families with no children have the highest poverty rate of 10.7%, comprising of 81 families. On the other hand, families with 3 or 4 children have the lowest poverty rate of 0.0%, which includes 0 families.
| Children | Above Poverty | Below Poverty |
| No Children | 678 (89.3%) | 81 (10.7%) |
| 1 or 2 Children | 569 (97.6%) | 14 (2.4%) |
| 3 or 4 Children | 58 (100.0%) | 0 (0.0%) |
| 5 or more Children | 0 (0.0%) | 0 (0.0%) |
| Total | 1,305 (93.2%) | 95 (6.8%) |
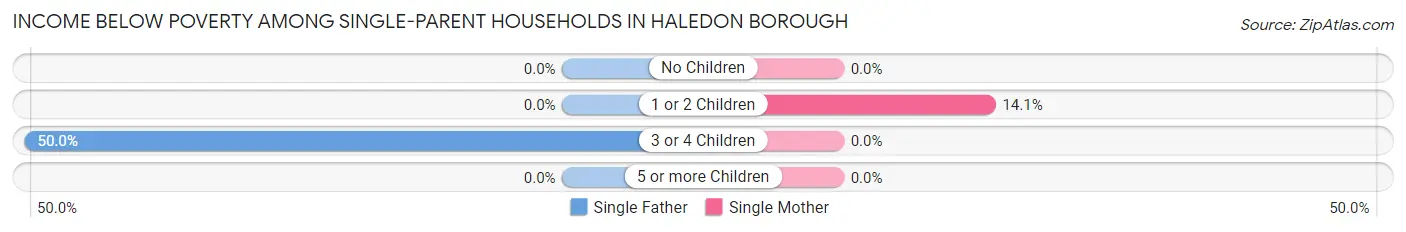
Income Below Poverty Among Single-Parent Households in Haledon borough
According to the poverty data in Haledon borough, 7.5% or 28 single-father households and 7.4% or 57 single-mother households are living below the poverty line. Among single-father households, those with 3 or 4 children have the highest poverty rate, with 28 households (50.0%) experiencing poverty. Likewise, among single-mother households, those with 1 or 2 children have the highest poverty rate, with 57 households (14.1%) falling below the poverty line.
| Children | Single Father | Single Mother |
| No Children | 0 (0.0%) | 0 (0.0%) |
| 1 or 2 Children | 0 (0.0%) | 57 (14.1%) |
| 3 or 4 Children | 28 (50.0%) | 0 (0.0%) |
| 5 or more Children | 0 (0.0%) | 0 (0.0%) |
| Total | 28 (7.5%) | 57 (7.4%) |
Income Below Poverty Among Married-Couple vs Single-Parent Households in Haledon borough
The poverty data for Haledon borough shows that 95 of the married-couple family households (6.8%) and 85 of the single-parent households (7.4%) are living below the poverty level. Within the married-couple family households, those with no children have the highest poverty rate, with 81 households (10.7%) falling below the poverty line. Among the single-parent households, those with 3 or 4 children have the highest poverty rate, with 28 household (29.5%) living below poverty.
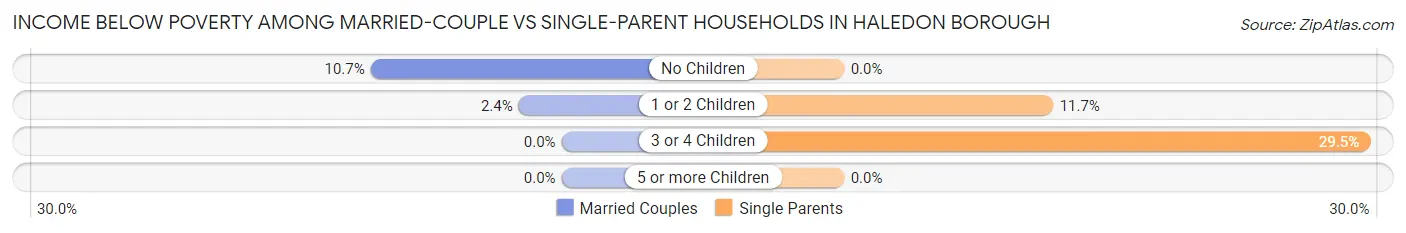
| Children | Married-Couple Families | Single-Parent Households |
| No Children | 81 (10.7%) | 0 (0.0%) |
| 1 or 2 Children | 14 (2.4%) | 57 (11.7%) |
| 3 or 4 Children | 0 (0.0%) | 28 (29.5%) |
| 5 or more Children | 0 (0.0%) | 0 (0.0%) |
| Total | 95 (6.8%) | 85 (7.4%) |
Race in Haledon borough
The most populous races in Haledon borough are Hispanic or Latino (4,874 | 54.5%), White / Caucasian (4,084 | 45.7%), and Some other Race (1,916 | 21.4%).
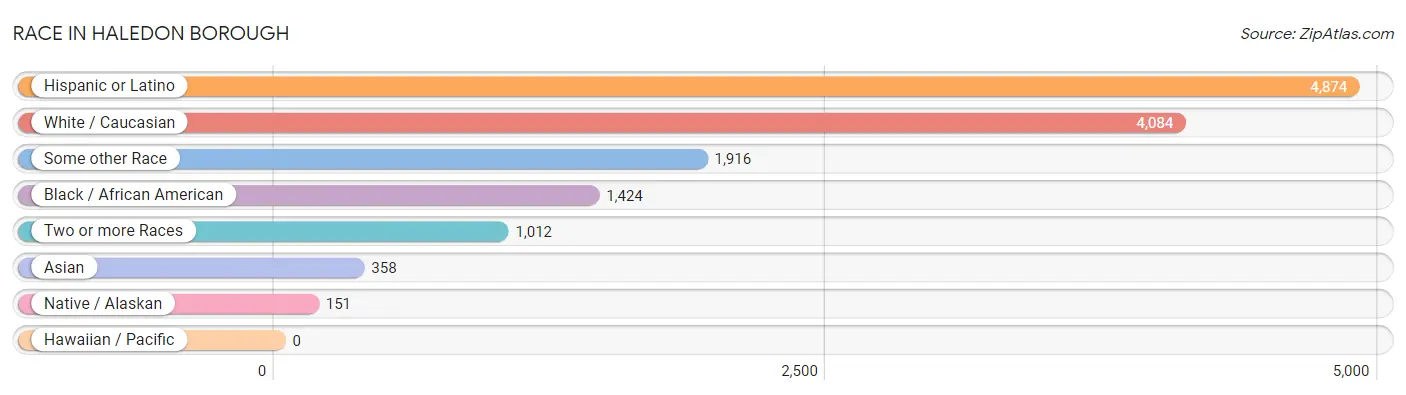
| Race | # Population | % Population |
| Asian | 358 | 4.0% |
| Black / African American | 1,424 | 15.9% |
| Hawaiian / Pacific | 0 | 0.0% |
| Hispanic or Latino | 4,874 | 54.5% |
| Native / Alaskan | 151 | 1.7% |
| White / Caucasian | 4,084 | 45.7% |
| Two or more Races | 1,012 | 11.3% |
| Some other Race | 1,916 | 21.4% |
| Total | 8,945 | 100.0% |
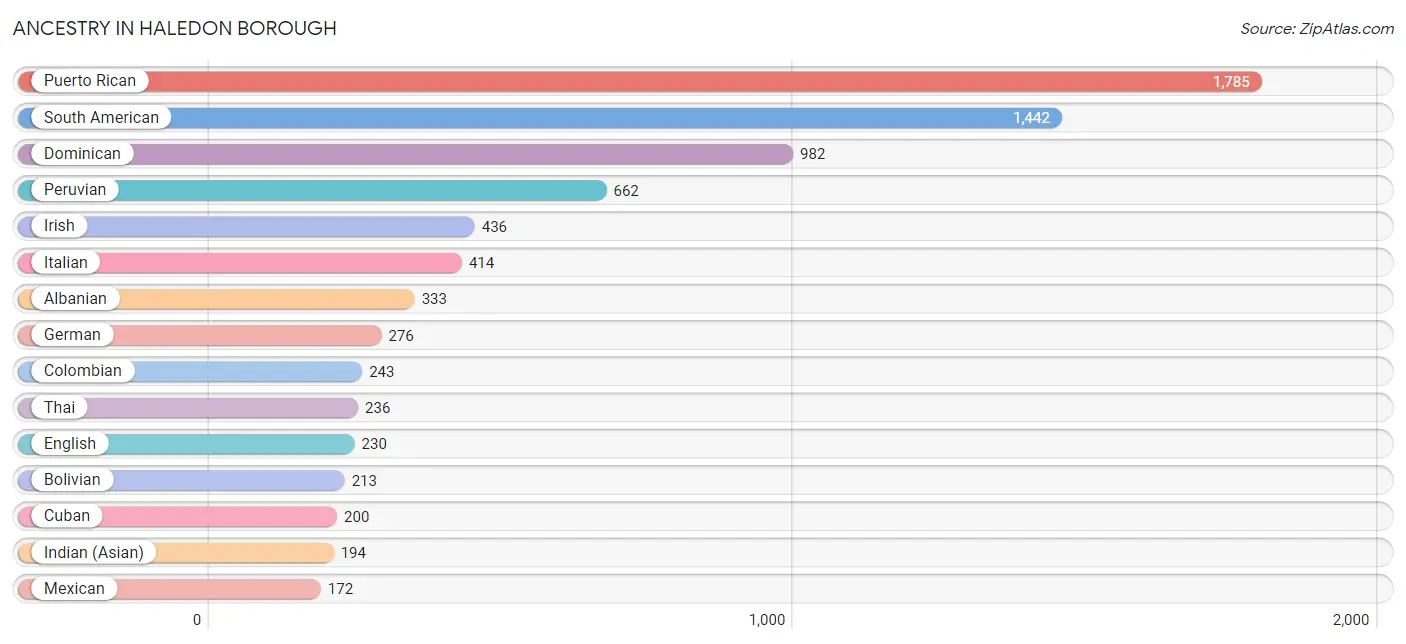
Ancestry in Haledon borough
The most populous ancestries reported in Haledon borough are Puerto Rican (1,785 | 20.0%), South American (1,442 | 16.1%), Dominican (982 | 11.0%), Peruvian (662 | 7.4%), and Irish (436 | 4.9%), together accounting for 59.3% of all Haledon borough residents.
| Ancestry | # Population | % Population |
| Albanian | 333 | 3.7% |
| American | 140 | 1.6% |
| Arab | 85 | 0.9% |
| Argentinean | 47 | 0.5% |
| Armenian | 5 | 0.1% |
| Austrian | 13 | 0.2% |
| Blackfeet | 43 | 0.5% |
| Bolivian | 213 | 2.4% |
| Burmese | 18 | 0.2% |
| Central American | 129 | 1.4% |
| Central American Indian | 82 | 0.9% |
| Colombian | 243 | 2.7% |
| Costa Rican | 15 | 0.2% |
| Cuban | 200 | 2.2% |
| Dominican | 982 | 11.0% |
| Dutch | 154 | 1.7% |
| Ecuadorian | 133 | 1.5% |
| English | 230 | 2.6% |
| European | 25 | 0.3% |
| French | 63 | 0.7% |
| German | 276 | 3.1% |
| Greek | 34 | 0.4% |
| Haitian | 25 | 0.3% |
| Honduran | 32 | 0.4% |
| Hungarian | 107 | 1.2% |
| Indian (Asian) | 194 | 2.2% |
| Irish | 436 | 4.9% |
| Italian | 414 | 4.6% |
| Jamaican | 20 | 0.2% |
| Korean | 24 | 0.3% |
| Lebanese | 5 | 0.1% |
| Lithuanian | 11 | 0.1% |
| Mexican | 172 | 1.9% |
| Mexican American Indian | 32 | 0.4% |
| Norwegian | 18 | 0.2% |
| Pakistani | 19 | 0.2% |
| Palestinian | 59 | 0.7% |
| Panamanian | 25 | 0.3% |
| Peruvian | 662 | 7.4% |
| Polish | 141 | 1.6% |
| Portuguese | 118 | 1.3% |
| Puerto Rican | 1,785 | 20.0% |
| Romanian | 36 | 0.4% |
| Russian | 36 | 0.4% |
| Salvadoran | 57 | 0.6% |
| Scottish | 50 | 0.6% |
| South American | 1,442 | 16.1% |
| South American Indian | 71 | 0.8% |
| Spaniard | 28 | 0.3% |
| Subsaharan African | 15 | 0.2% |
| Syrian | 21 | 0.2% |
| Thai | 236 | 2.6% |
| Trinidadian and Tobagonian | 19 | 0.2% |
| Turkish | 11 | 0.1% |
| Ukrainian | 13 | 0.2% |
| Venezuelan | 144 | 1.6% |
| West Indian | 35 | 0.4% | View All 57 Rows |
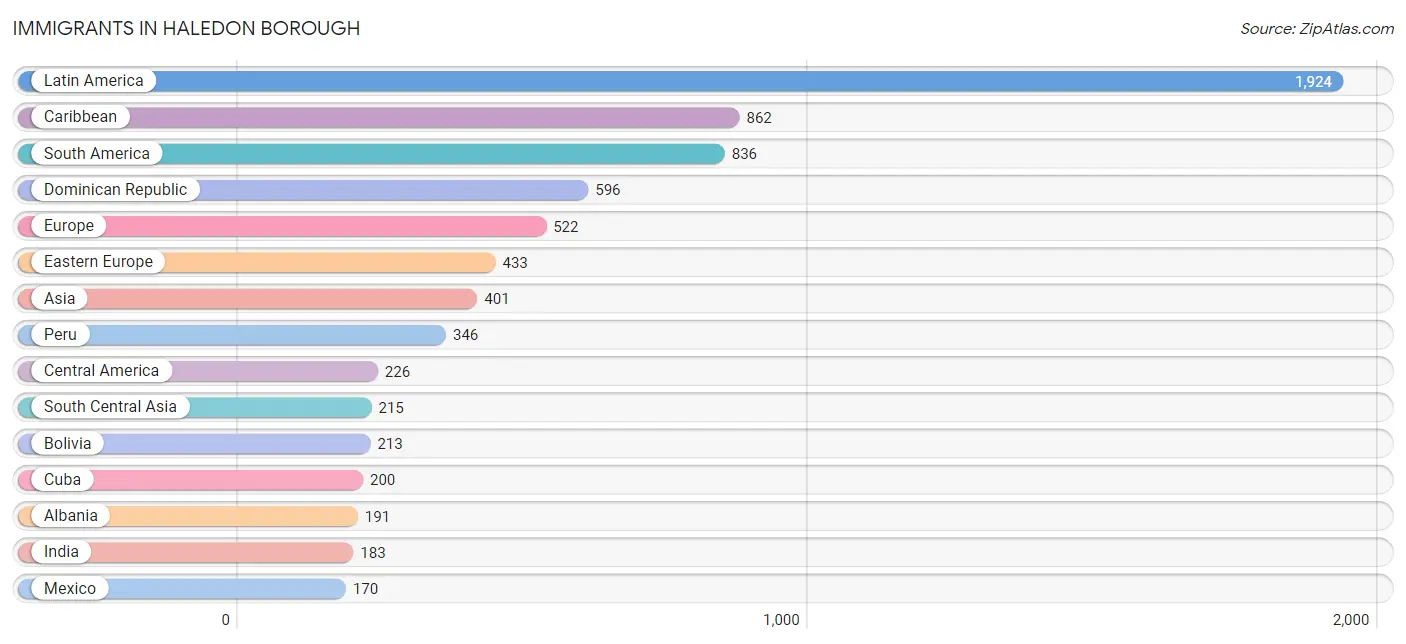
Immigrants in Haledon borough
The most numerous immigrant groups reported in Haledon borough came from Latin America (1,924 | 21.5%), Caribbean (862 | 9.6%), South America (836 | 9.3%), Dominican Republic (596 | 6.7%), and Europe (522 | 5.8%), together accounting for 53.0% of all Haledon borough residents.
| Immigration Origin | # Population | % Population |
| Africa | 20 | 0.2% |
| Albania | 191 | 2.1% |
| Argentina | 52 | 0.6% |
| Asia | 401 | 4.5% |
| Bangladesh | 32 | 0.4% |
| Bolivia | 213 | 2.4% |
| Caribbean | 862 | 9.6% |
| Central America | 226 | 2.5% |
| China | 27 | 0.3% |
| Colombia | 108 | 1.2% |
| Costa Rica | 15 | 0.2% |
| Cuba | 200 | 2.2% |
| Dominican Republic | 596 | 6.7% |
| Eastern Africa | 5 | 0.1% |
| Eastern Asia | 41 | 0.5% |
| Eastern Europe | 433 | 4.8% |
| Ecuador | 44 | 0.5% |
| England | 20 | 0.2% |
| Europe | 522 | 5.8% |
| Germany | 25 | 0.3% |
| Greece | 16 | 0.2% |
| Honduras | 16 | 0.2% |
| Hungary | 40 | 0.4% |
| India | 183 | 2.1% |
| Jamaica | 47 | 0.5% |
| Kenya | 5 | 0.1% |
| Korea | 14 | 0.2% |
| Latin America | 1,924 | 21.5% |
| Lebanon | 10 | 0.1% |
| Mexico | 170 | 1.9% |
| North Macedonia | 106 | 1.2% |
| Northern Europe | 20 | 0.2% |
| Panama | 25 | 0.3% |
| Peru | 346 | 3.9% |
| Philippines | 11 | 0.1% |
| Poland | 60 | 0.7% |
| Romania | 36 | 0.4% |
| South America | 836 | 9.3% |
| South Central Asia | 215 | 2.4% |
| South Eastern Asia | 30 | 0.3% |
| Southern Europe | 44 | 0.5% |
| Spain | 28 | 0.3% |
| Syria | 31 | 0.4% |
| Thailand | 19 | 0.2% |
| Trinidad and Tobago | 19 | 0.2% |
| Venezuela | 73 | 0.8% |
| Western Africa | 15 | 0.2% |
| Western Asia | 41 | 0.5% |
| Western Europe | 25 | 0.3% | View All 49 Rows |
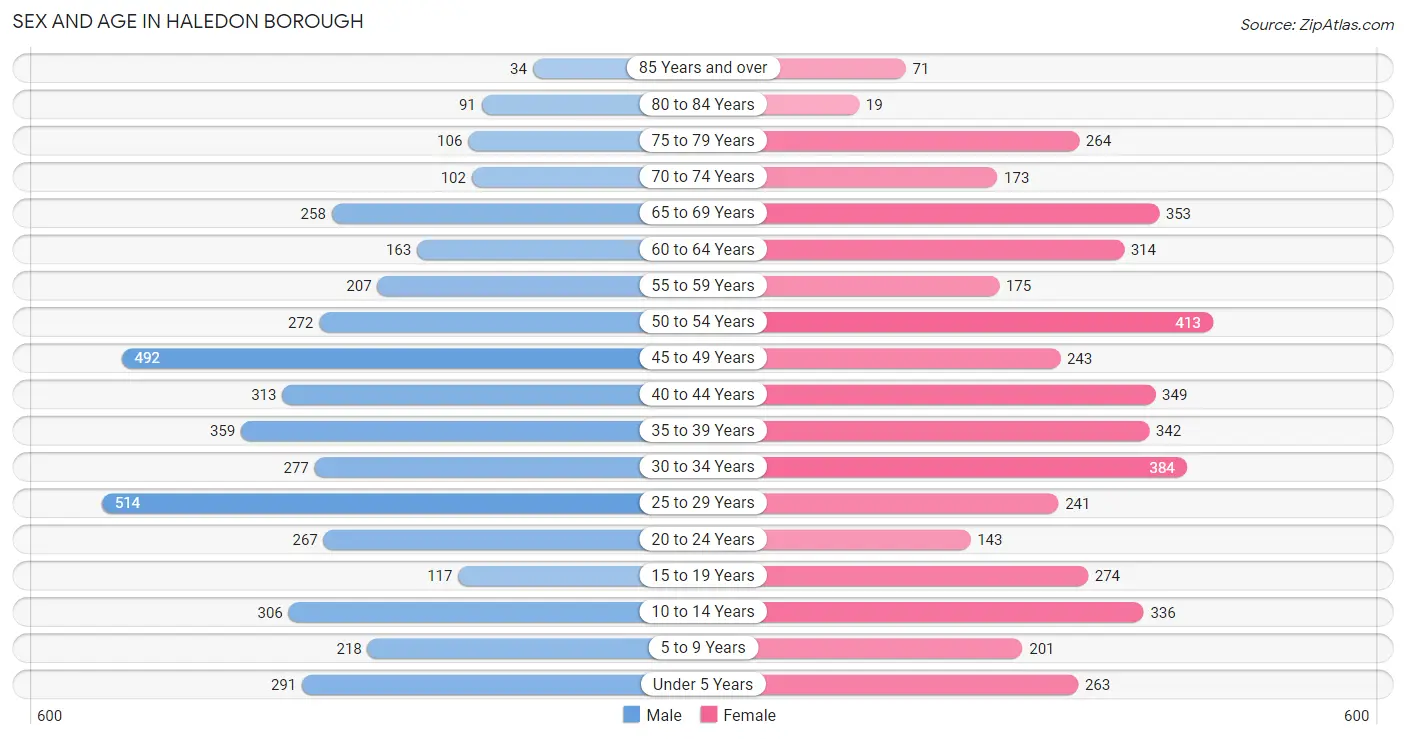
Sex and Age in Haledon borough
Sex and Age in Haledon borough
The most populous age groups in Haledon borough are 25 to 29 Years (514 | 11.7%) for men and 50 to 54 Years (413 | 9.1%) for women.
| Age Bracket | Male | Female |
| Under 5 Years | 291 (6.6%) | 263 (5.8%) |
| 5 to 9 Years | 218 (5.0%) | 201 (4.4%) |
| 10 to 14 Years | 306 (7.0%) | 336 (7.4%) |
| 15 to 19 Years | 117 (2.7%) | 274 (6.0%) |
| 20 to 24 Years | 267 (6.1%) | 143 (3.1%) |
| 25 to 29 Years | 514 (11.7%) | 241 (5.3%) |
| 30 to 34 Years | 277 (6.3%) | 384 (8.4%) |
| 35 to 39 Years | 359 (8.2%) | 342 (7.5%) |
| 40 to 44 Years | 313 (7.1%) | 349 (7.7%) |
| 45 to 49 Years | 492 (11.2%) | 243 (5.3%) |
| 50 to 54 Years | 272 (6.2%) | 413 (9.1%) |
| 55 to 59 Years | 207 (4.7%) | 175 (3.8%) |
| 60 to 64 Years | 163 (3.7%) | 314 (6.9%) |
| 65 to 69 Years | 258 (5.9%) | 353 (7.7%) |
| 70 to 74 Years | 102 (2.3%) | 173 (3.8%) |
| 75 to 79 Years | 106 (2.4%) | 264 (5.8%) |
| 80 to 84 Years | 91 (2.1%) | 19 (0.4%) |
| 85 Years and over | 34 (0.8%) | 71 (1.6%) |
| Total | 4,387 (100.0%) | 4,558 (100.0%) |
Families and Households in Haledon borough
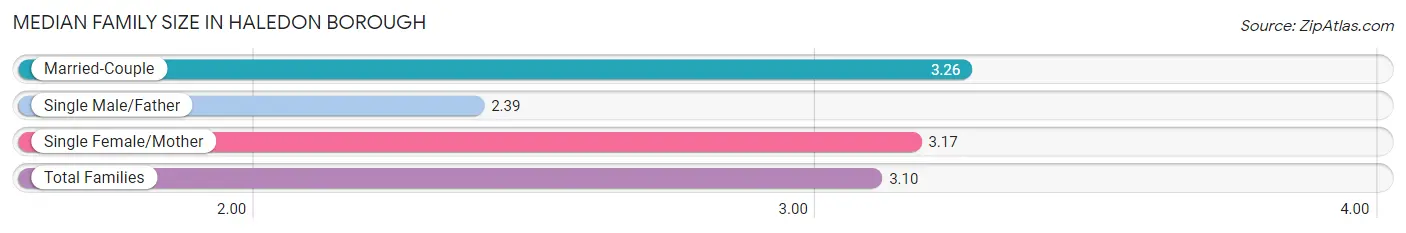
Median Family Size in Haledon borough
The median family size in Haledon borough is 3.10 persons per family, with married-couple families (1,400 | 55.1%) accounting for the largest median family size of 3.26 persons per family. On the other hand, single male/father families (374 | 14.7%) represent the smallest median family size with 2.39 persons per family.
| Family Type | # Families | Family Size |
| Married-Couple | 1,400 (55.1%) | 3.26 |
| Single Male/Father | 374 (14.7%) | 2.39 |
| Single Female/Mother | 767 (30.2%) | 3.17 |
| Total Families | 2,541 (100.0%) | 3.10 |
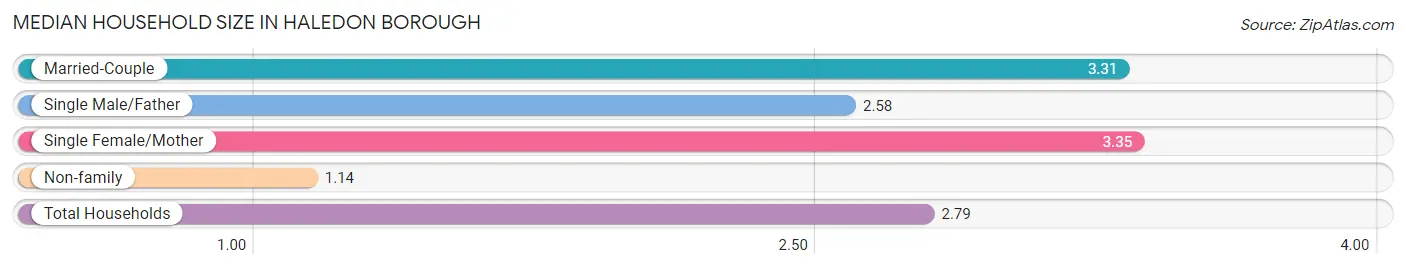
Median Household Size in Haledon borough
The median household size in Haledon borough is 2.79 persons per household, with single female/mother households (767 | 24.0%) accounting for the largest median household size of 3.35 persons per household. non-family households (651 | 20.4%) represent the smallest median household size with 1.14 persons per household.
| Household Type | # Households | Household Size |
| Married-Couple | 1,400 (43.9%) | 3.31 |
| Single Male/Father | 374 (11.7%) | 2.58 |
| Single Female/Mother | 767 (24.0%) | 3.35 |
| Non-family | 651 (20.4%) | 1.14 |
| Total Households | 3,192 (100.0%) | 2.79 |
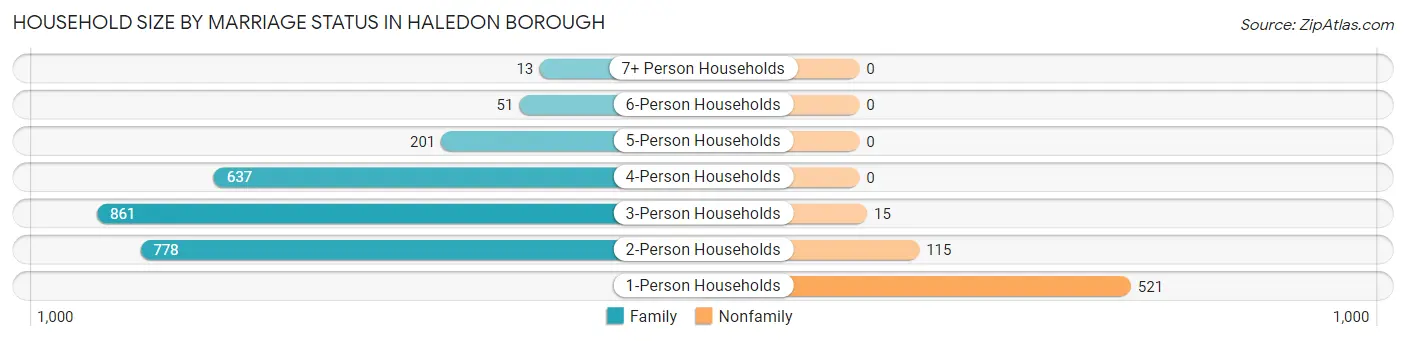
Household Size by Marriage Status in Haledon borough
Out of a total of 3,192 households in Haledon borough, 2,541 (79.6%) are family households, while 651 (20.4%) are nonfamily households. The most numerous type of family households are 3-person households, comprising 861, and the most common type of nonfamily households are 1-person households, comprising 521.
| Household Size | Family Households | Nonfamily Households |
| 1-Person Households | - | 521 (16.3%) |
| 2-Person Households | 778 (24.4%) | 115 (3.6%) |
| 3-Person Households | 861 (27.0%) | 15 (0.5%) |
| 4-Person Households | 637 (20.0%) | 0 (0.0%) |
| 5-Person Households | 201 (6.3%) | 0 (0.0%) |
| 6-Person Households | 51 (1.6%) | 0 (0.0%) |
| 7+ Person Households | 13 (0.4%) | 0 (0.0%) |
| Total | 2,541 (79.6%) | 651 (20.4%) |
Female Fertility in Haledon borough
Fertility by Age in Haledon borough
Average fertility rate in Haledon borough is 20.0 births per 1,000 women. Women in the age bracket of 35 to 50 years have the highest fertility rate with 40.0 births per 1,000 women. Women in the age bracket of 35 to 50 years acount for 100.0% of all women with births.
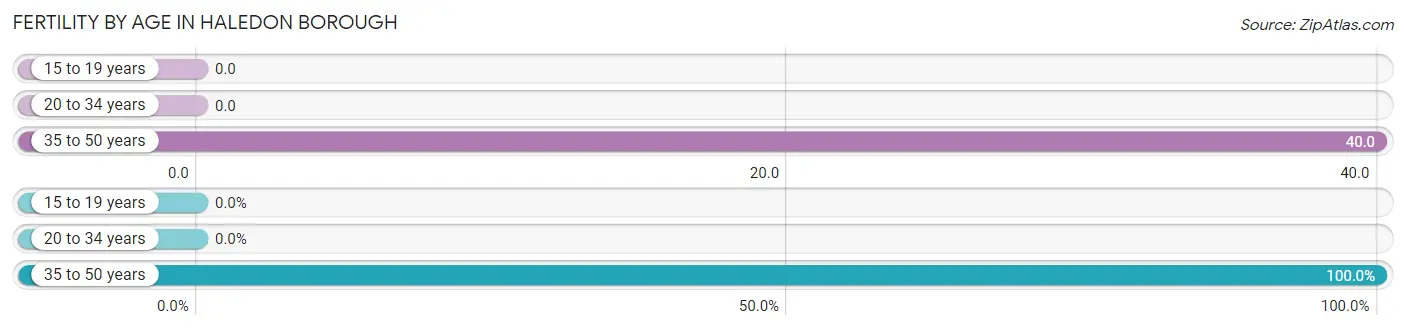
| Age Bracket | Women with Births | Births / 1,000 Women |
| 15 to 19 years | 0 (0.0%) | 0.0 |
| 20 to 34 years | 0 (0.0%) | 0.0 |
| 35 to 50 years | 40 (100.0%) | 40.0 |
| Total | 40 (100.0%) | 20.0 |
Fertility by Age by Marriage Status in Haledon borough
35.0% of women with births (40) in Haledon borough are married. The highest percentage of unmarried women with births falls into 35 to 50 years age bracket with 65.0% of them unmarried at the time of birth, while the lowest percentage of unmarried women with births belong to 35 to 50 years age bracket with 65.0% of them unmarried.
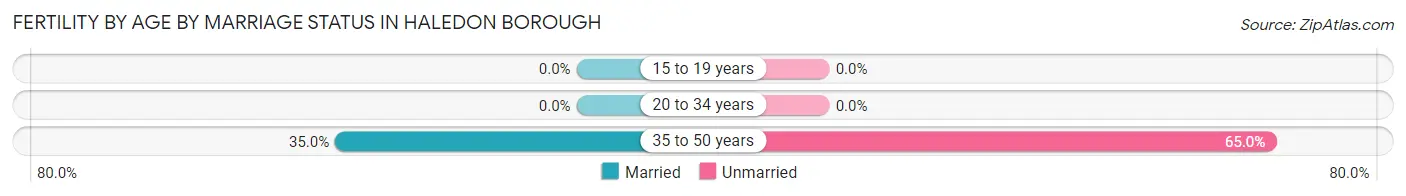
| Age Bracket | Married | Unmarried |
| 15 to 19 years | 0 (0.0%) | 0 (0.0%) |
| 20 to 34 years | 0 (0.0%) | 0 (0.0%) |
| 35 to 50 years | 14 (35.0%) | 26 (65.0%) |
| Total | 14 (35.0%) | 26 (65.0%) |
Fertility by Education in Haledon borough
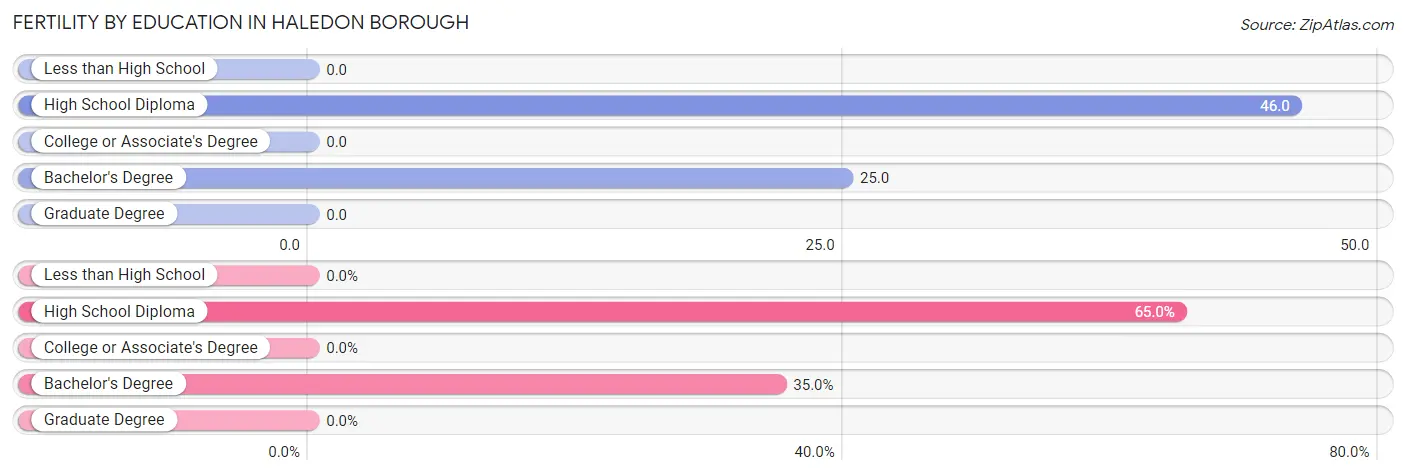
| Educational Attainment | Women with Births | Births / 1,000 Women |
| Less than High School | 0 (0.0%) | 0.0 |
| High School Diploma | 26 (65.0%) | 46.0 |
| College or Associate's Degree | 0 (0.0%) | 0.0 |
| Bachelor's Degree | 14 (35.0%) | 25.0 |
| Graduate Degree | 0 (0.0%) | 0.0 |
| Total | 40 (100.0%) | 20.0 |
Fertility by Education by Marriage Status in Haledon borough
65.0% of women with births in Haledon borough are unmarried. Women with the educational attainment of bachelor's degree are most likely to be married with 100.0% of them married at childbirth, while women with the educational attainment of high school diploma are least likely to be married with 100.0% of them unmarried at childbirth.
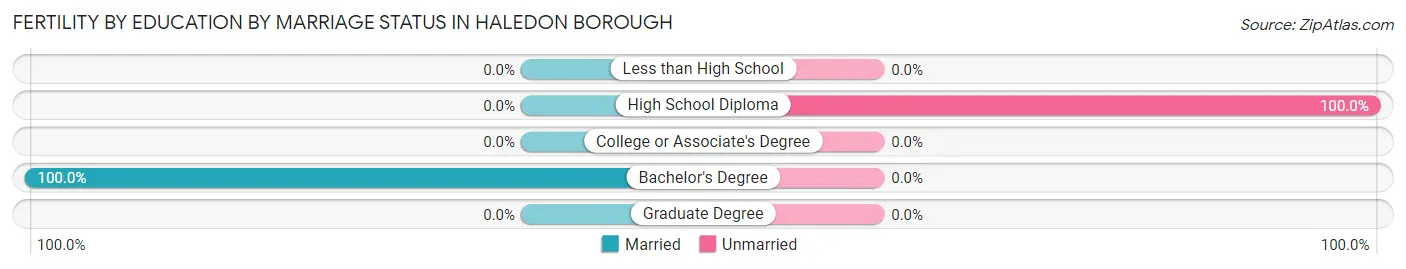
| Educational Attainment | Married | Unmarried |
| Less than High School | 0 (0.0%) | 0 (0.0%) |
| High School Diploma | 0 (0.0%) | 26 (100.0%) |
| College or Associate's Degree | 0 (0.0%) | 0 (0.0%) |
| Bachelor's Degree | 14 (100.0%) | 0 (0.0%) |
| Graduate Degree | 0 (0.0%) | 0 (0.0%) |
| Total | 14 (35.0%) | 26 (65.0%) |
Employment Characteristics in Haledon borough
Employment by Class of Employer in Haledon borough
Among the 4,627 employed individuals in Haledon borough, private company employees (3,524 | 76.2%), self-employed (not incorporated) (284 | 6.1%), and state government employees (261 | 5.6%) make up the most common classes of employment.
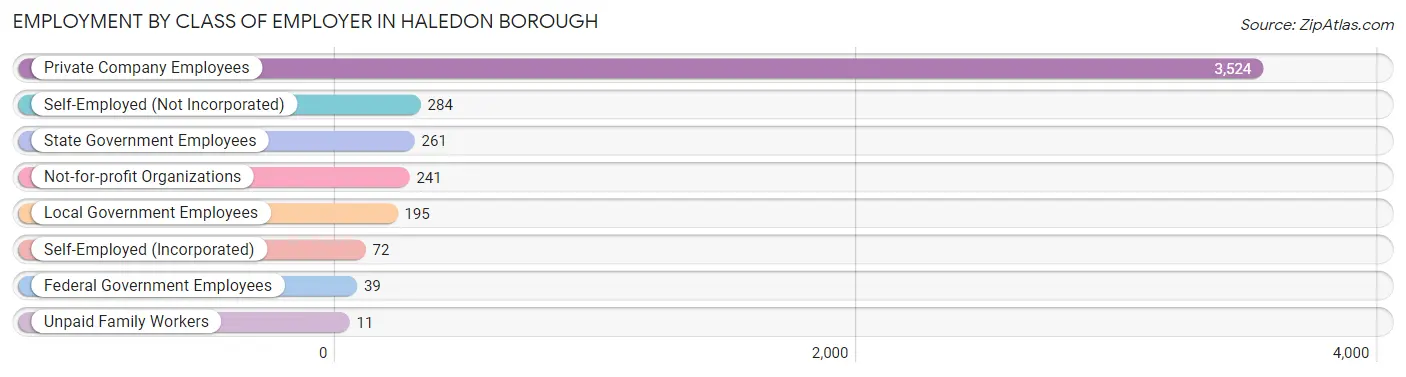
| Employer Class | # Employees | % Employees |
| Private Company Employees | 3,524 | 76.2% |
| Self-Employed (Incorporated) | 72 | 1.6% |
| Self-Employed (Not Incorporated) | 284 | 6.1% |
| Not-for-profit Organizations | 241 | 5.2% |
| Local Government Employees | 195 | 4.2% |
| State Government Employees | 261 | 5.6% |
| Federal Government Employees | 39 | 0.8% |
| Unpaid Family Workers | 11 | 0.2% |
| Total | 4,627 | 100.0% |
Employment Status by Age in Haledon borough
According to the labor force statistics for Haledon borough, out of the total population over 16 years of age (7,238), 68.8% or 4,980 individuals are in the labor force, with 5.8% or 289 of them unemployed. The age group with the highest labor force participation rate is 45 to 54 years, with 96.1% or 1,365 individuals in the labor force. Within the labor force, the 30 to 34 years age range has the highest percentage of unemployed individuals, with 12.3% or 60 of them being unemployed.
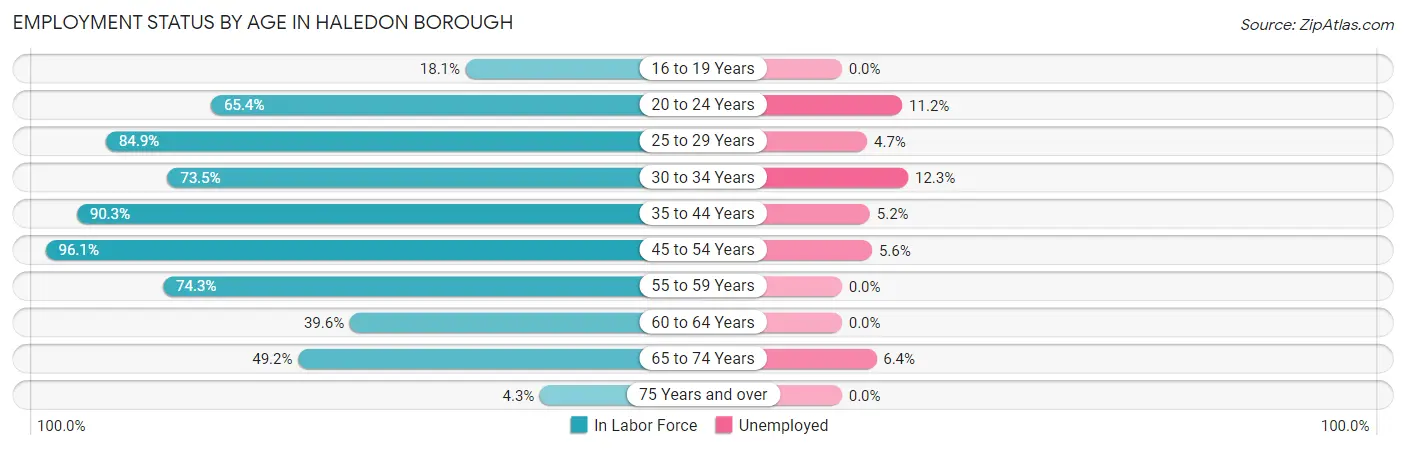
| Age Bracket | In Labor Force | Unemployed |
| 16 to 19 Years | 54 (18.1%) | 0 (0.0%) |
| 20 to 24 Years | 268 (65.4%) | 30 (11.2%) |
| 25 to 29 Years | 641 (84.9%) | 30 (4.7%) |
| 30 to 34 Years | 486 (73.5%) | 60 (12.3%) |
| 35 to 44 Years | 1,231 (90.3%) | 64 (5.2%) |
| 45 to 54 Years | 1,365 (96.1%) | 76 (5.6%) |
| 55 to 59 Years | 284 (74.3%) | 0 (0.0%) |
| 60 to 64 Years | 189 (39.6%) | 0 (0.0%) |
| 65 to 74 Years | 436 (49.2%) | 28 (6.4%) |
| 75 Years and over | 25 (4.3%) | 0 (0.0%) |
| Total | 4,980 (68.8%) | 289 (5.8%) |
Employment Status by Educational Attainment in Haledon borough
According to labor force statistics for Haledon borough, 83.0% of individuals (4,198) out of the total population between 25 and 64 years of age (5,058) are in the labor force, with 5.5% or 231 of them being unemployed. The group with the highest labor force participation rate are those with the educational attainment of college / associate degree, with 91.2% or 1,272 individuals in the labor force. Within the labor force, individuals with less than high school education have the highest percentage of unemployment, with 16.0% or 45 of them being unemployed.
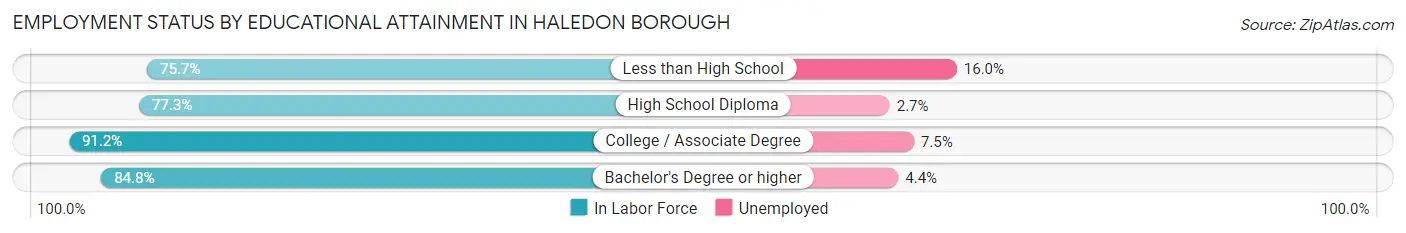
| Educational Attainment | In Labor Force | Unemployed |
| Less than High School | 281 (75.7%) | 59 (16.0%) |
| High School Diploma | 1,527 (77.3%) | 53 (2.7%) |
| College / Associate Degree | 1,272 (91.2%) | 105 (7.5%) |
| Bachelor's Degree or higher | 1,117 (84.8%) | 58 (4.4%) |
| Total | 4,198 (83.0%) | 278 (5.5%) |
Employment Occupations by Sex in Haledon borough
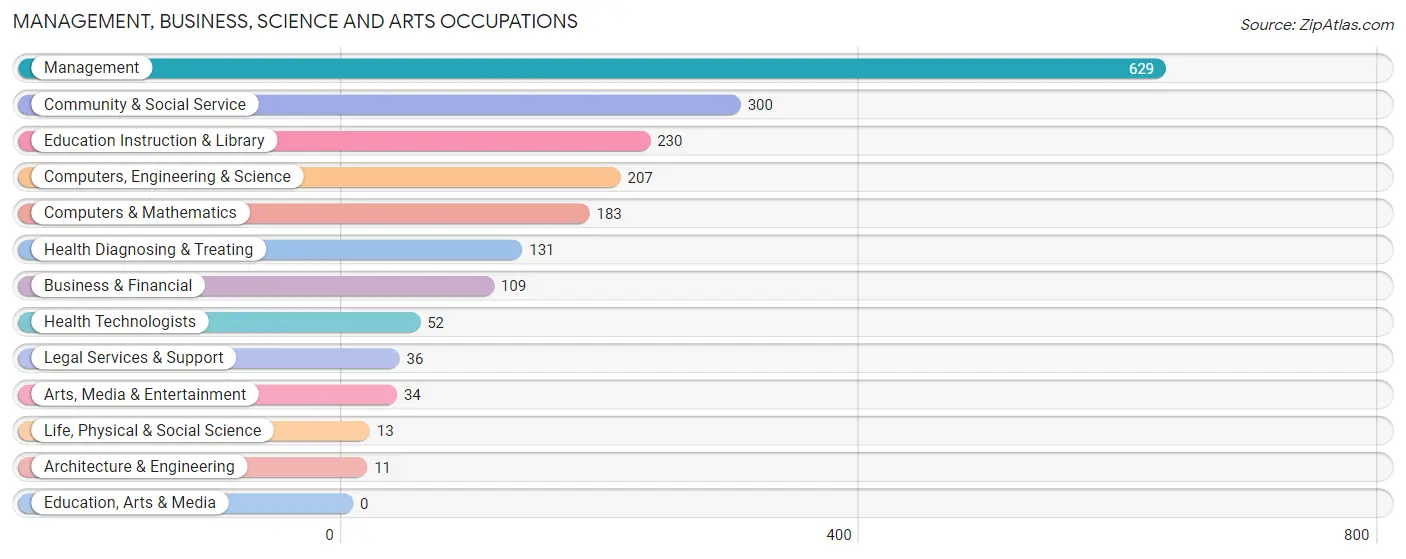
Management, Business, Science and Arts Occupations
The most common Management, Business, Science and Arts occupations in Haledon borough are Management (629 | 13.5%), Community & Social Service (300 | 6.4%), Education Instruction & Library (230 | 4.9%), Computers, Engineering & Science (207 | 4.4%), and Computers & Mathematics (183 | 3.9%).
Management, Business, Science and Arts Occupations by Sex
Within the Management, Business, Science and Arts occupations in Haledon borough, the most male-oriented occupations are Architecture & Engineering (100.0%), Computers & Mathematics (71.0%), and Legal Services & Support (69.4%), while the most female-oriented occupations are Life, Physical & Social Science (100.0%), Health Technologists (100.0%), and Business & Financial (92.7%).
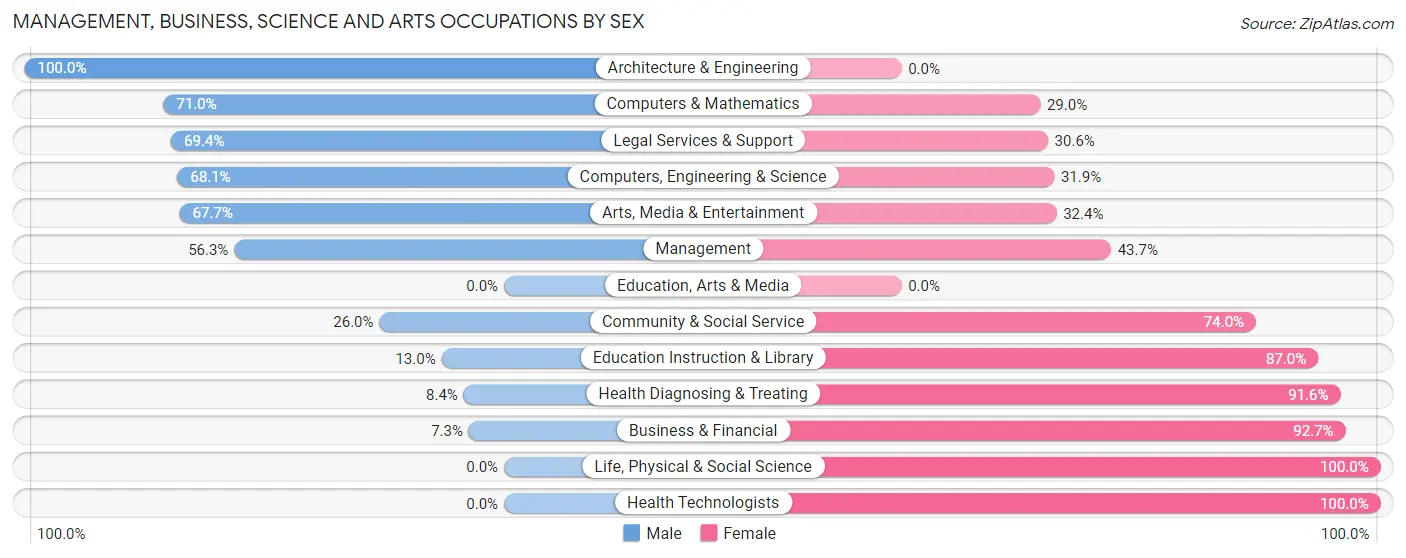
| Occupation | Male | Female |
| Management | 354 (56.3%) | 275 (43.7%) |
| Business & Financial | 8 (7.3%) | 101 (92.7%) |
| Computers, Engineering & Science | 141 (68.1%) | 66 (31.9%) |
| Computers & Mathematics | 130 (71.0%) | 53 (29.0%) |
| Architecture & Engineering | 11 (100.0%) | 0 (0.0%) |
| Life, Physical & Social Science | 0 (0.0%) | 13 (100.0%) |
| Community & Social Service | 78 (26.0%) | 222 (74.0%) |
| Education, Arts & Media | 0 (0.0%) | 0 (0.0%) |
| Legal Services & Support | 25 (69.4%) | 11 (30.6%) |
| Education Instruction & Library | 30 (13.0%) | 200 (87.0%) |
| Arts, Media & Entertainment | 23 (67.6%) | 11 (32.4%) |
| Health Diagnosing & Treating | 11 (8.4%) | 120 (91.6%) |
| Health Technologists | 0 (0.0%) | 52 (100.0%) |
| Total (Category) | 592 (43.0%) | 784 (57.0%) |
| Total (Overall) | 2,517 (53.9%) | 2,155 (46.1%) |
Services Occupations
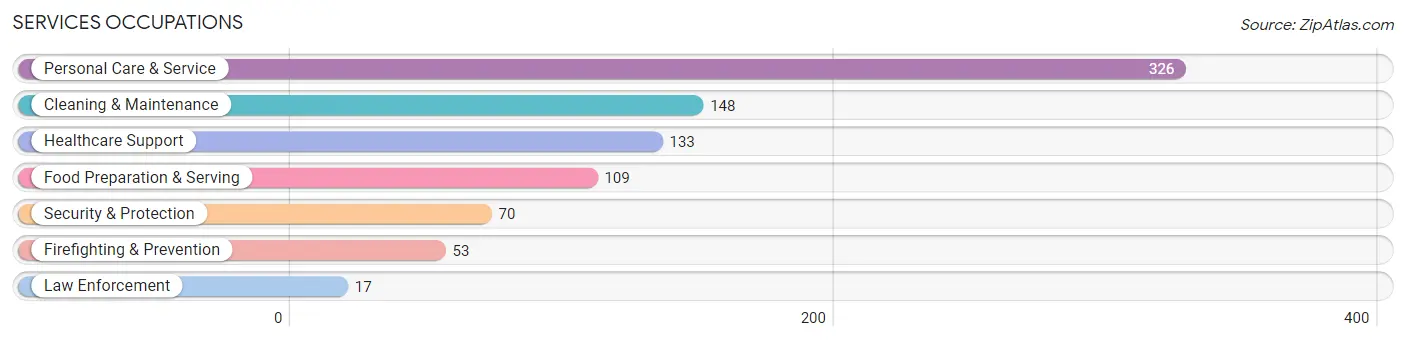
The most common Services occupations in Haledon borough are Personal Care & Service (326 | 7.0%), Cleaning & Maintenance (148 | 3.2%), Healthcare Support (133 | 2.9%), Food Preparation & Serving (109 | 2.3%), and Security & Protection (70 | 1.5%).
Services Occupations by Sex
Within the Services occupations in Haledon borough, the most male-oriented occupations are Firefighting & Prevention (100.0%), Security & Protection (75.7%), and Personal Care & Service (59.8%), while the most female-oriented occupations are Law Enforcement (100.0%), Food Preparation & Serving (78.0%), and Healthcare Support (57.9%).
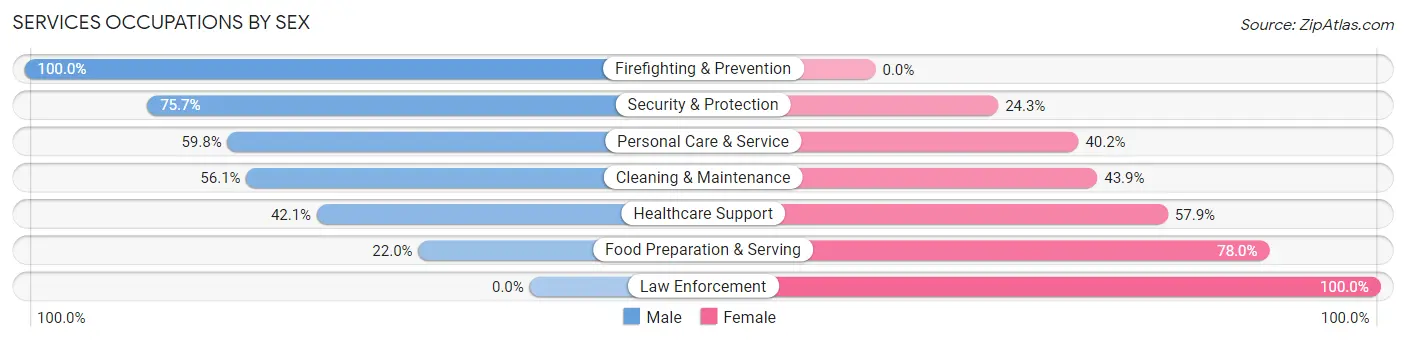
| Occupation | Male | Female |
| Healthcare Support | 56 (42.1%) | 77 (57.9%) |
| Security & Protection | 53 (75.7%) | 17 (24.3%) |
| Firefighting & Prevention | 53 (100.0%) | 0 (0.0%) |
| Law Enforcement | 0 (0.0%) | 17 (100.0%) |
| Food Preparation & Serving | 24 (22.0%) | 85 (78.0%) |
| Cleaning & Maintenance | 83 (56.1%) | 65 (43.9%) |
| Personal Care & Service | 195 (59.8%) | 131 (40.2%) |
| Total (Category) | 411 (52.3%) | 375 (47.7%) |
| Total (Overall) | 2,517 (53.9%) | 2,155 (46.1%) |
Sales and Office Occupations
The most common Sales and Office occupations in Haledon borough are Sales & Related (560 | 12.0%), and Office & Administration (526 | 11.3%).
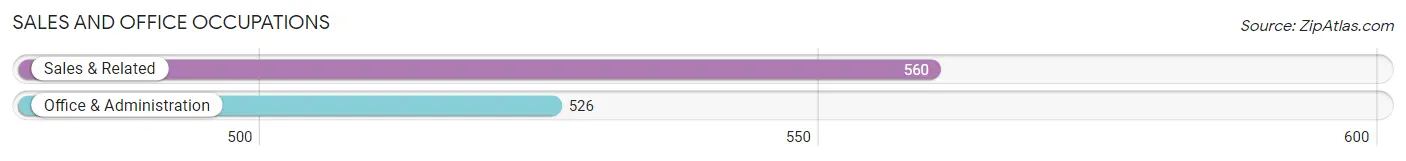
Sales and Office Occupations by Sex
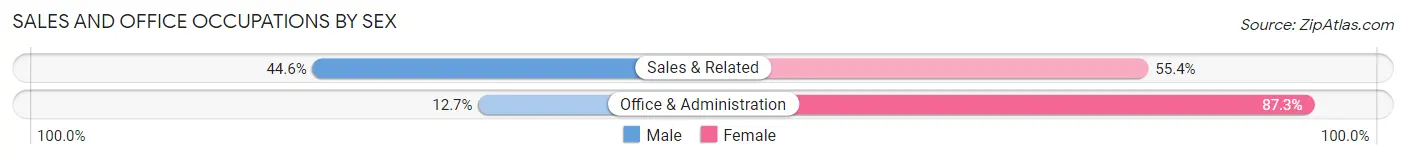
| Occupation | Male | Female |
| Sales & Related | 250 (44.6%) | 310 (55.4%) |
| Office & Administration | 67 (12.7%) | 459 (87.3%) |
| Total (Category) | 317 (29.2%) | 769 (70.8%) |
| Total (Overall) | 2,517 (53.9%) | 2,155 (46.1%) |
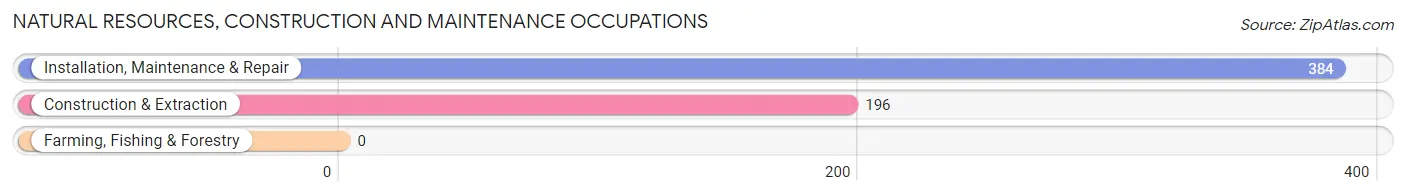
Natural Resources, Construction and Maintenance Occupations
The most common Natural Resources, Construction and Maintenance occupations in Haledon borough are Installation, Maintenance & Repair (384 | 8.2%), and Construction & Extraction (196 | 4.2%).
Natural Resources, Construction and Maintenance Occupations by Sex
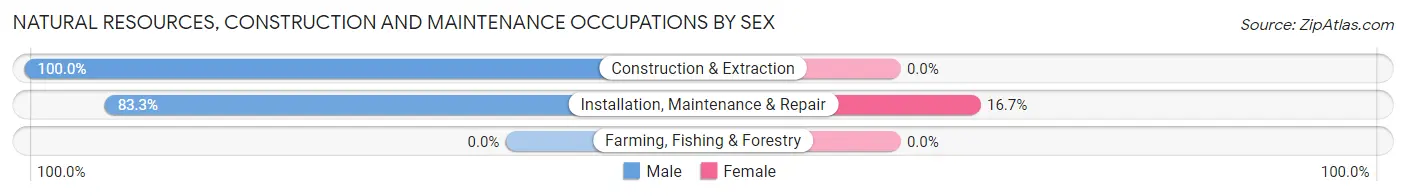
| Occupation | Male | Female |
| Farming, Fishing & Forestry | 0 (0.0%) | 0 (0.0%) |
| Construction & Extraction | 196 (100.0%) | 0 (0.0%) |
| Installation, Maintenance & Repair | 320 (83.3%) | 64 (16.7%) |
| Total (Category) | 516 (89.0%) | 64 (11.0%) |
| Total (Overall) | 2,517 (53.9%) | 2,155 (46.1%) |
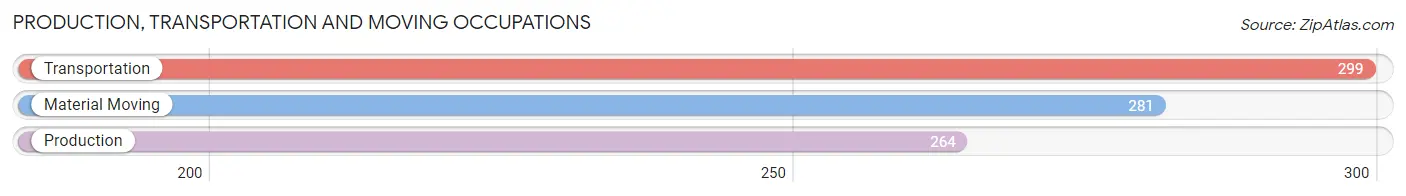
Production, Transportation and Moving Occupations
The most common Production, Transportation and Moving occupations in Haledon borough are Transportation (299 | 6.4%), Material Moving (281 | 6.0%), and Production (264 | 5.7%).
Production, Transportation and Moving Occupations by Sex
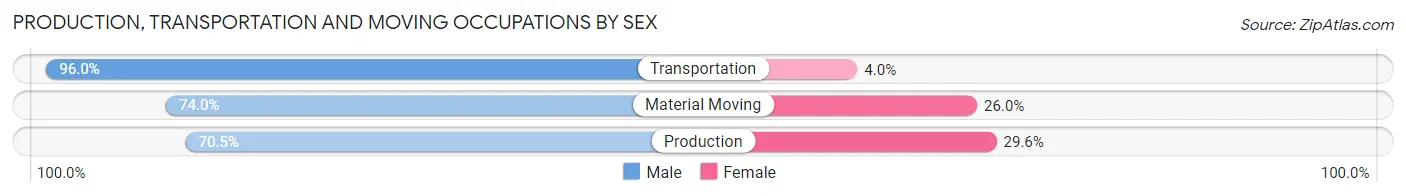
| Occupation | Male | Female |
| Production | 186 (70.5%) | 78 (29.5%) |
| Transportation | 287 (96.0%) | 12 (4.0%) |
| Material Moving | 208 (74.0%) | 73 (26.0%) |
| Total (Category) | 681 (80.7%) | 163 (19.3%) |
| Total (Overall) | 2,517 (53.9%) | 2,155 (46.1%) |
Employment Industries by Sex in Haledon borough
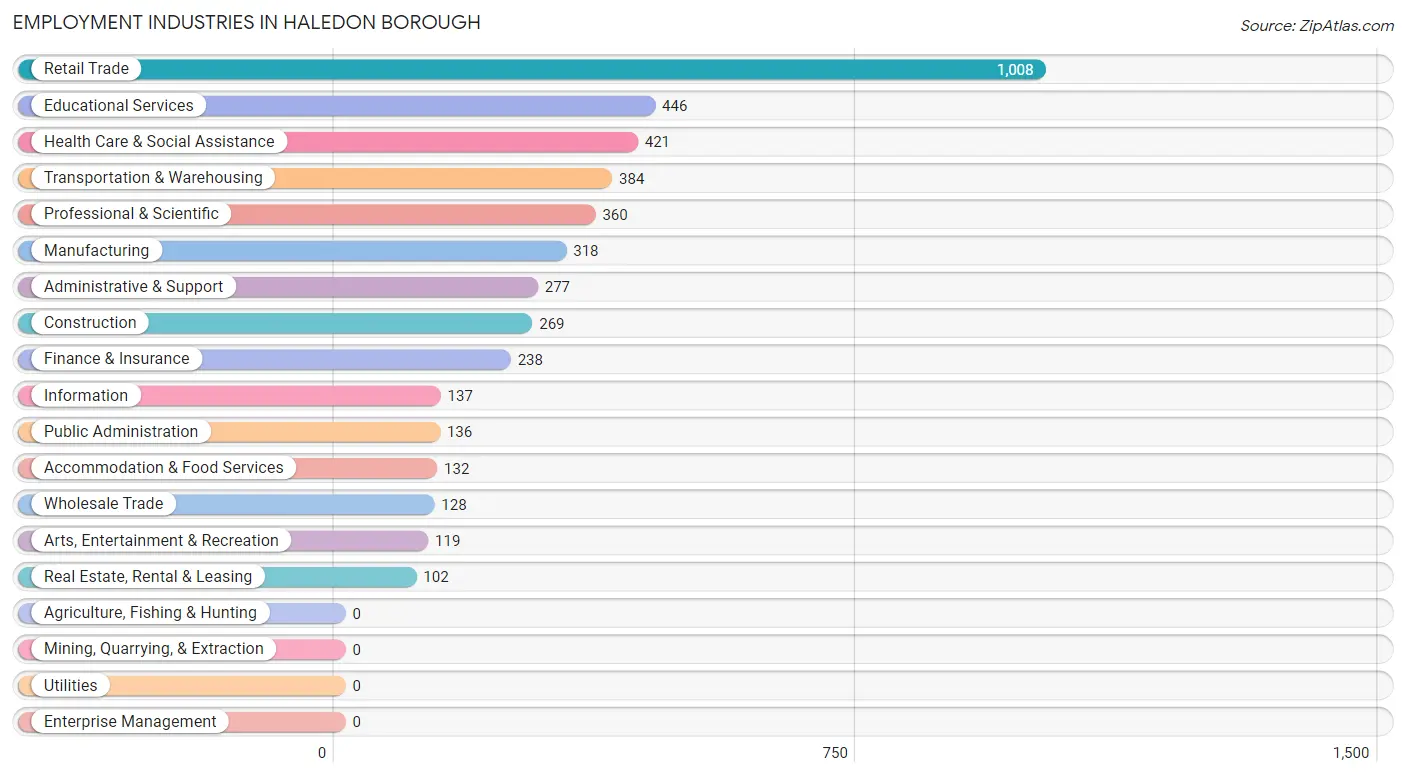
Employment Industries in Haledon borough
The major employment industries in Haledon borough include Retail Trade (1,008 | 21.6%), Educational Services (446 | 9.6%), Health Care & Social Assistance (421 | 9.0%), Transportation & Warehousing (384 | 8.2%), and Professional & Scientific (360 | 7.7%).
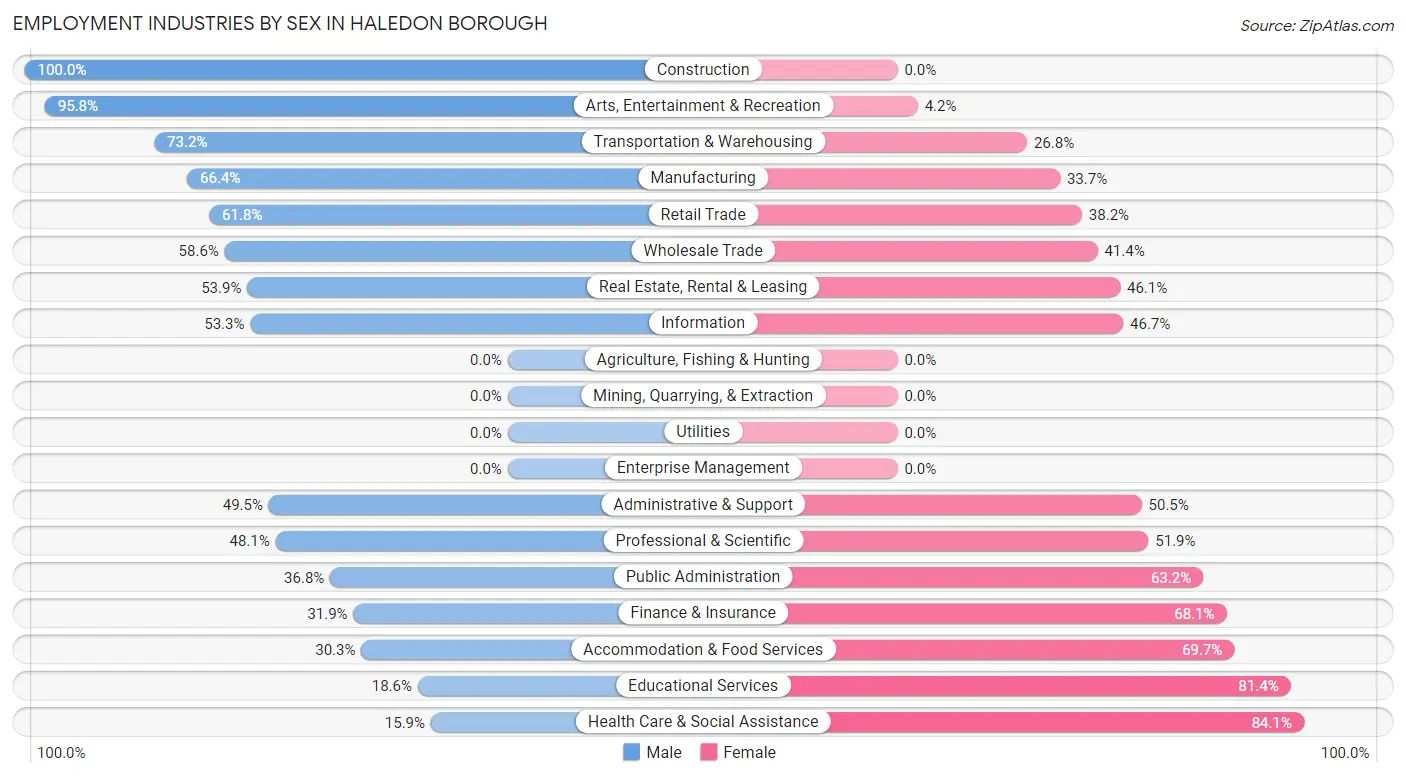
Employment Industries by Sex in Haledon borough
The Haledon borough industries that see more men than women are Construction (100.0%), Arts, Entertainment & Recreation (95.8%), and Transportation & Warehousing (73.2%), whereas the industries that tend to have a higher number of women are Health Care & Social Assistance (84.1%), Educational Services (81.4%), and Accommodation & Food Services (69.7%).
| Industry | Male | Female |
| Agriculture, Fishing & Hunting | 0 (0.0%) | 0 (0.0%) |
| Mining, Quarrying, & Extraction | 0 (0.0%) | 0 (0.0%) |
| Construction | 269 (100.0%) | 0 (0.0%) |
| Manufacturing | 211 (66.3%) | 107 (33.7%) |
| Wholesale Trade | 75 (58.6%) | 53 (41.4%) |
| Retail Trade | 623 (61.8%) | 385 (38.2%) |
| Transportation & Warehousing | 281 (73.2%) | 103 (26.8%) |
| Utilities | 0 (0.0%) | 0 (0.0%) |
| Information | 73 (53.3%) | 64 (46.7%) |
| Finance & Insurance | 76 (31.9%) | 162 (68.1%) |
| Real Estate, Rental & Leasing | 55 (53.9%) | 47 (46.1%) |
| Professional & Scientific | 173 (48.1%) | 187 (51.9%) |
| Enterprise Management | 0 (0.0%) | 0 (0.0%) |
| Administrative & Support | 137 (49.5%) | 140 (50.5%) |
| Educational Services | 83 (18.6%) | 363 (81.4%) |
| Health Care & Social Assistance | 67 (15.9%) | 354 (84.1%) |
| Arts, Entertainment & Recreation | 114 (95.8%) | 5 (4.2%) |
| Accommodation & Food Services | 40 (30.3%) | 92 (69.7%) |
| Public Administration | 50 (36.8%) | 86 (63.2%) |
| Total | 2,517 (53.9%) | 2,155 (46.1%) |
Education in Haledon borough
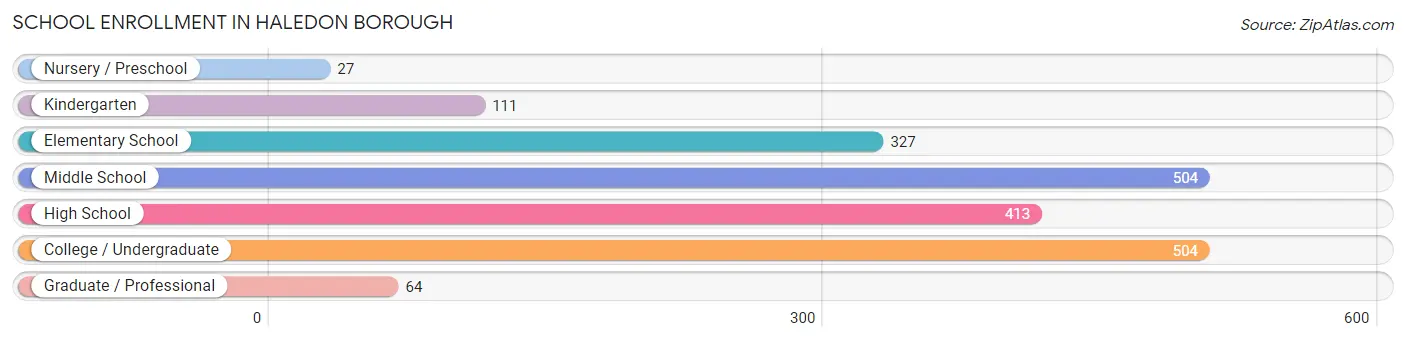
School Enrollment in Haledon borough
The most common levels of schooling among the 1,950 students in Haledon borough are middle school (504 | 25.9%), college / undergraduate (504 | 25.9%), and high school (413 | 21.2%).
| School Level | # Students | % Students |
| Nursery / Preschool | 27 | 1.4% |
| Kindergarten | 111 | 5.7% |
| Elementary School | 327 | 16.8% |
| Middle School | 504 | 25.9% |
| High School | 413 | 21.2% |
| College / Undergraduate | 504 | 25.9% |
| Graduate / Professional | 64 | 3.3% |
| Total | 1,950 | 100.0% |
School Enrollment by Age by Funding Source in Haledon borough
Out of a total of 1,950 students who are enrolled in schools in Haledon borough, 275 (14.1%) attend a private institution, while the remaining 1,675 (85.9%) are enrolled in public schools. The age group of 35 years and over has the highest likelihood of being enrolled in private schools, with 42 (60.0% in the age bracket) enrolled. Conversely, the age group of 3 to 4 year olds has the lowest likelihood of being enrolled in a private school, with 19 (100.0% in the age bracket) attending a public institution.
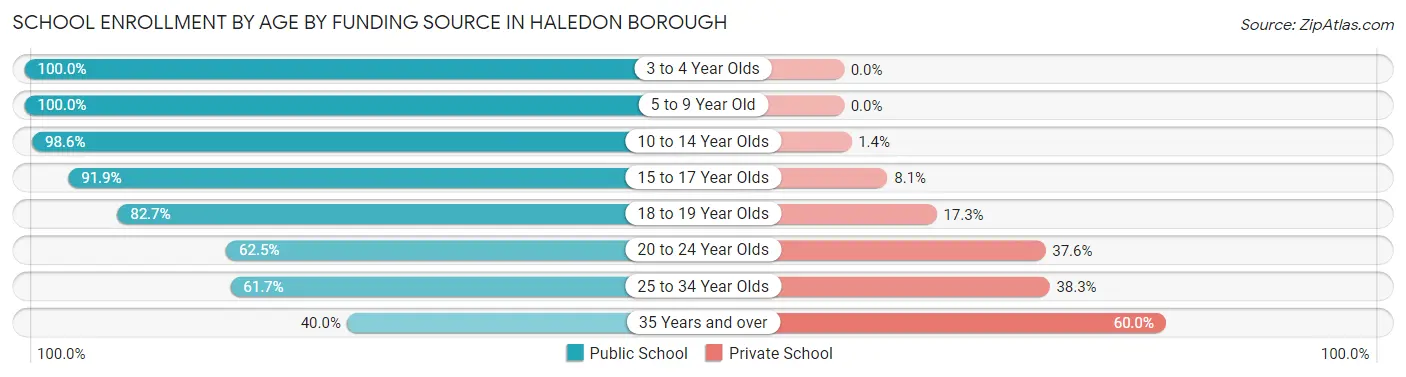
| Age Bracket | Public School | Private School |
| 3 to 4 Year Olds | 19 (100.0%) | 0 (0.0%) |
| 5 to 9 Year Old | 384 (100.0%) | 0 (0.0%) |
| 10 to 14 Year Olds | 633 (98.6%) | 9 (1.4%) |
| 15 to 17 Year Olds | 237 (91.9%) | 21 (8.1%) |
| 18 to 19 Year Olds | 67 (82.7%) | 14 (17.3%) |
| 20 to 24 Year Olds | 168 (62.5%) | 101 (37.6%) |
| 25 to 34 Year Olds | 140 (61.7%) | 87 (38.3%) |
| 35 Years and over | 28 (40.0%) | 42 (60.0%) |
| Total | 1,675 (85.9%) | 275 (14.1%) |
Educational Attainment by Field of Study in Haledon borough
Business (658 | 35.4%), engineering (197 | 10.6%), education (177 | 9.5%), literature & languages (134 | 7.2%), and social sciences (123 | 6.6%) are the most common fields of study among 1,860 individuals in Haledon borough who have obtained a bachelor's degree or higher.
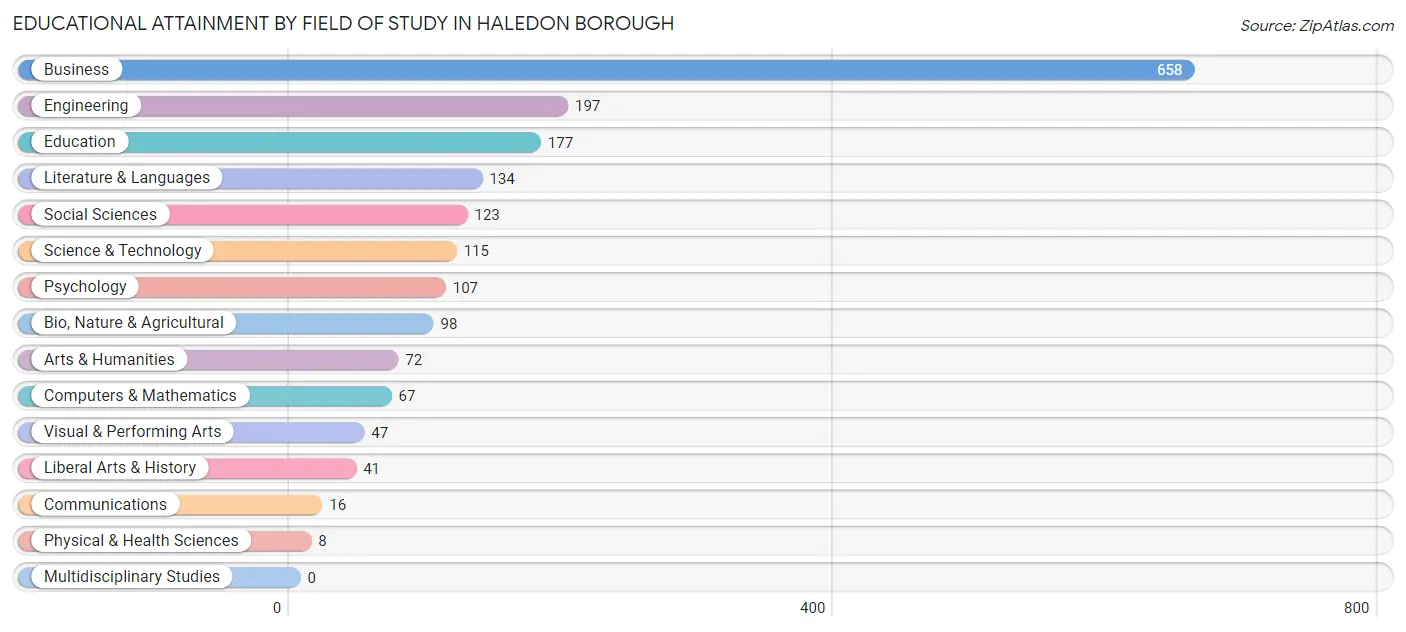
| Field of Study | # Graduates | % Graduates |
| Computers & Mathematics | 67 | 3.6% |
| Bio, Nature & Agricultural | 98 | 5.3% |
| Physical & Health Sciences | 8 | 0.4% |
| Psychology | 107 | 5.8% |
| Social Sciences | 123 | 6.6% |
| Engineering | 197 | 10.6% |
| Multidisciplinary Studies | 0 | 0.0% |
| Science & Technology | 115 | 6.2% |
| Business | 658 | 35.4% |
| Education | 177 | 9.5% |
| Literature & Languages | 134 | 7.2% |
| Liberal Arts & History | 41 | 2.2% |
| Visual & Performing Arts | 47 | 2.5% |
| Communications | 16 | 0.9% |
| Arts & Humanities | 72 | 3.9% |
| Total | 1,860 | 100.0% |
Transportation & Commute in Haledon borough
Vehicle Availability by Sex in Haledon borough
The most prevalent vehicle ownership categories in Haledon borough are males with 2 vehicles (815, accounting for 32.5%) and females with 2 vehicles (645, making up 38.7%).
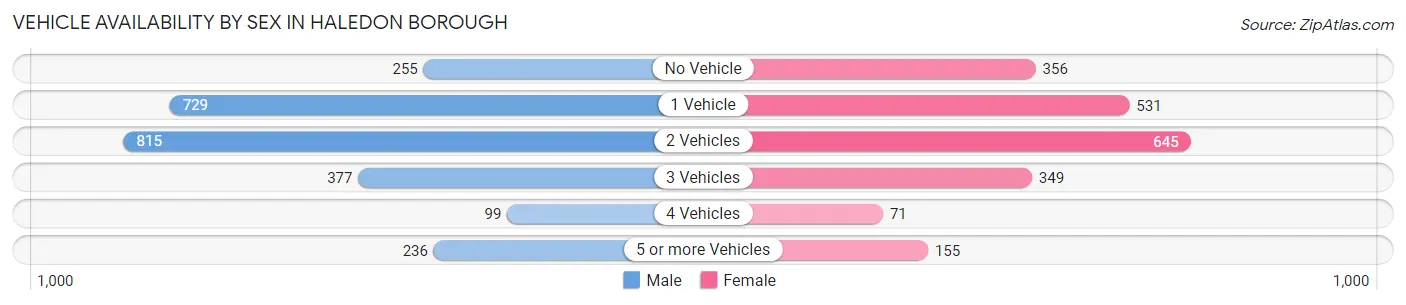
| Vehicles Available | Male | Female |
| No Vehicle | 255 (10.2%) | 356 (16.9%) |
| 1 Vehicle | 729 (29.0%) | 531 (25.2%) |
| 2 Vehicles | 815 (32.5%) | 645 (30.6%) |
| 3 Vehicles | 377 (15.0%) | 349 (16.6%) |
| 4 Vehicles | 99 (3.9%) | 71 (3.4%) |
| 5 or more Vehicles | 236 (9.4%) | 155 (7.4%) |
| Total | 2,511 (100.0%) | 2,107 (100.0%) |
Commute Time in Haledon borough
The most frequently occuring commute durations in Haledon borough are 15 to 19 minutes (905 commuters, 21.2%), 20 to 24 minutes (685 commuters, 16.1%), and 25 to 29 minutes (583 commuters, 13.7%).
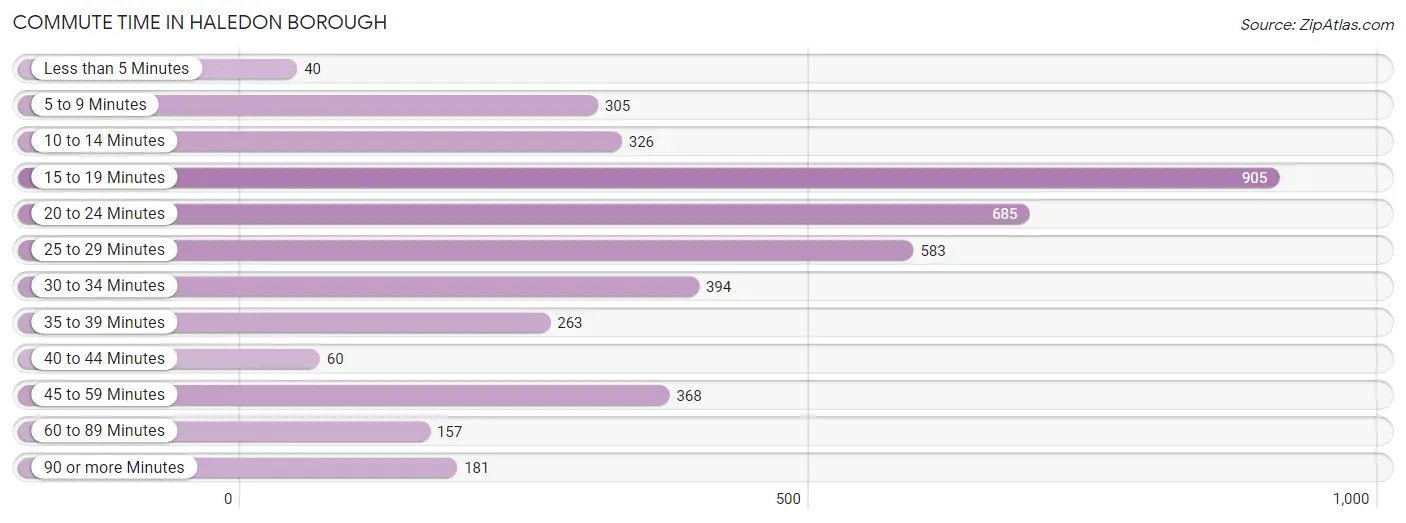
| Commute Time | # Commuters | % Commuters |
| Less than 5 Minutes | 40 | 0.9% |
| 5 to 9 Minutes | 305 | 7.1% |
| 10 to 14 Minutes | 326 | 7.6% |
| 15 to 19 Minutes | 905 | 21.2% |
| 20 to 24 Minutes | 685 | 16.1% |
| 25 to 29 Minutes | 583 | 13.7% |
| 30 to 34 Minutes | 394 | 9.2% |
| 35 to 39 Minutes | 263 | 6.2% |
| 40 to 44 Minutes | 60 | 1.4% |
| 45 to 59 Minutes | 368 | 8.6% |
| 60 to 89 Minutes | 157 | 3.7% |
| 90 or more Minutes | 181 | 4.2% |
Commute Time by Sex in Haledon borough
The most common commute times in Haledon borough are 15 to 19 minutes (514 commuters, 22.3%) for males and 15 to 19 minutes (391 commuters, 19.9%) for females.
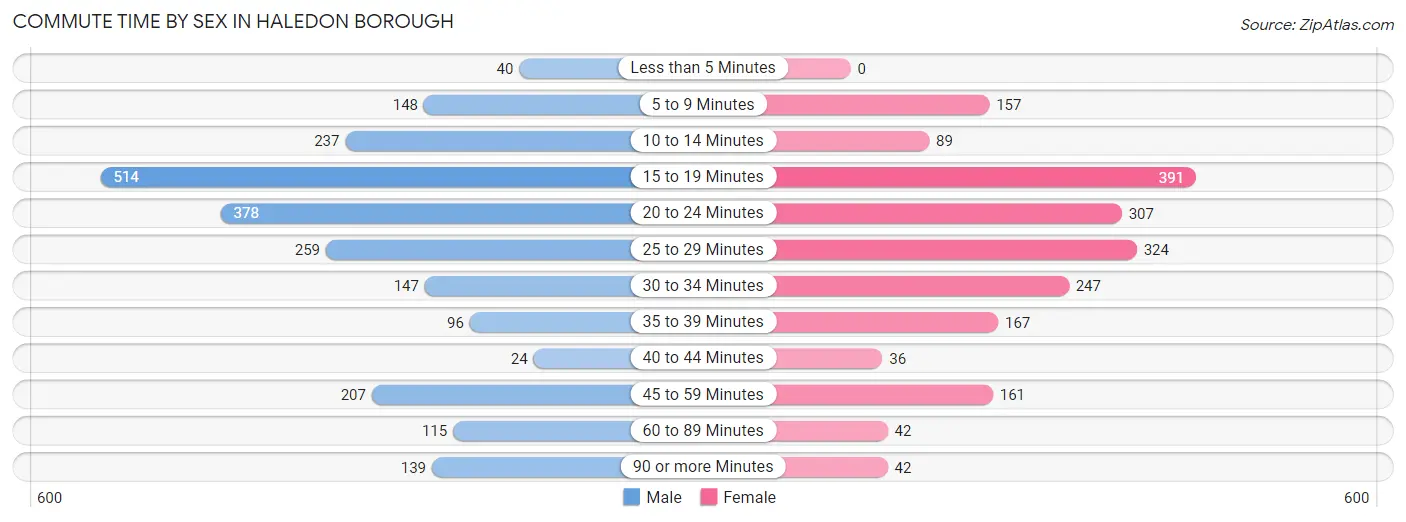
| Commute Time | Male | Female |
| Less than 5 Minutes | 40 (1.7%) | 0 (0.0%) |
| 5 to 9 Minutes | 148 (6.4%) | 157 (8.0%) |
| 10 to 14 Minutes | 237 (10.3%) | 89 (4.5%) |
| 15 to 19 Minutes | 514 (22.3%) | 391 (19.9%) |
| 20 to 24 Minutes | 378 (16.4%) | 307 (15.6%) |
| 25 to 29 Minutes | 259 (11.2%) | 324 (16.5%) |
| 30 to 34 Minutes | 147 (6.4%) | 247 (12.6%) |
| 35 to 39 Minutes | 96 (4.2%) | 167 (8.5%) |
| 40 to 44 Minutes | 24 (1.0%) | 36 (1.8%) |
| 45 to 59 Minutes | 207 (9.0%) | 161 (8.2%) |
| 60 to 89 Minutes | 115 (5.0%) | 42 (2.1%) |
| 90 or more Minutes | 139 (6.0%) | 42 (2.1%) |
Time of Departure to Work by Sex in Haledon borough
The most frequent times of departure to work in Haledon borough are 7:30 AM to 7:59 AM (470, 20.4%) for males and 7:30 AM to 7:59 AM (416, 21.2%) for females.
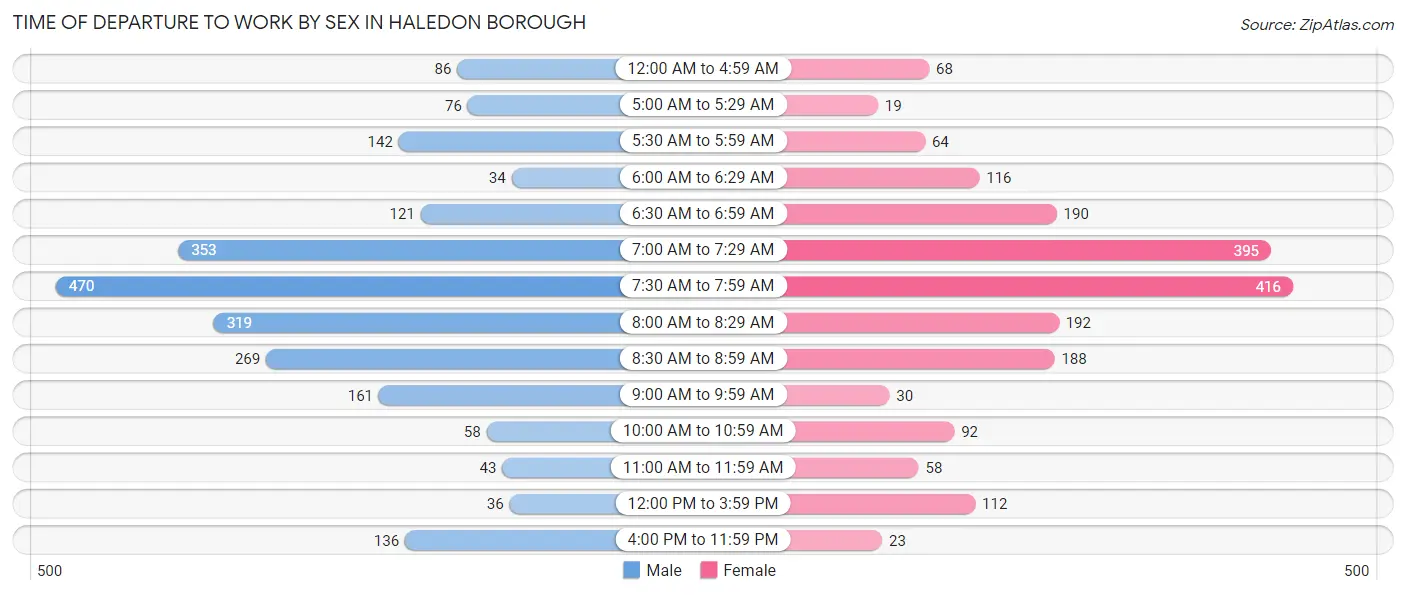
| Time of Departure | Male | Female |
| 12:00 AM to 4:59 AM | 86 (3.7%) | 68 (3.5%) |
| 5:00 AM to 5:29 AM | 76 (3.3%) | 19 (1.0%) |
| 5:30 AM to 5:59 AM | 142 (6.2%) | 64 (3.3%) |
| 6:00 AM to 6:29 AM | 34 (1.5%) | 116 (5.9%) |
| 6:30 AM to 6:59 AM | 121 (5.2%) | 190 (9.7%) |
| 7:00 AM to 7:29 AM | 353 (15.3%) | 395 (20.1%) |
| 7:30 AM to 7:59 AM | 470 (20.4%) | 416 (21.2%) |
| 8:00 AM to 8:29 AM | 319 (13.9%) | 192 (9.8%) |
| 8:30 AM to 8:59 AM | 269 (11.7%) | 188 (9.6%) |
| 9:00 AM to 9:59 AM | 161 (7.0%) | 30 (1.5%) |
| 10:00 AM to 10:59 AM | 58 (2.5%) | 92 (4.7%) |
| 11:00 AM to 11:59 AM | 43 (1.9%) | 58 (2.9%) |
| 12:00 PM to 3:59 PM | 36 (1.6%) | 112 (5.7%) |
| 4:00 PM to 11:59 PM | 136 (5.9%) | 23 (1.2%) |
| Total | 2,304 (100.0%) | 1,963 (100.0%) |
Housing Occupancy in Haledon borough
Occupancy by Ownership in Haledon borough
Of the total 3,192 dwellings in Haledon borough, owner-occupied units account for 1,582 (49.6%), while renter-occupied units make up 1,610 (50.4%).
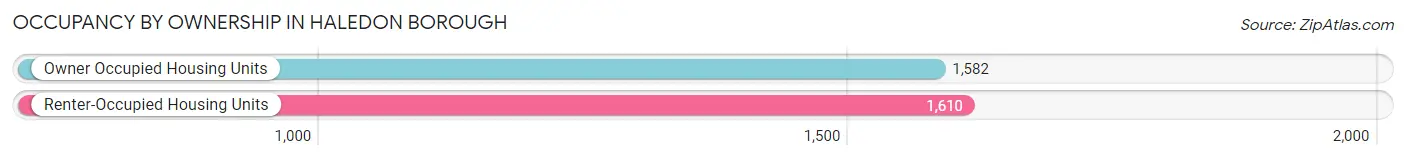
| Occupancy | # Housing Units | % Housing Units |
| Owner Occupied Housing Units | 1,582 | 49.6% |
| Renter-Occupied Housing Units | 1,610 | 50.4% |
| Total Occupied Housing Units | 3,192 | 100.0% |
Occupancy by Household Size in Haledon borough
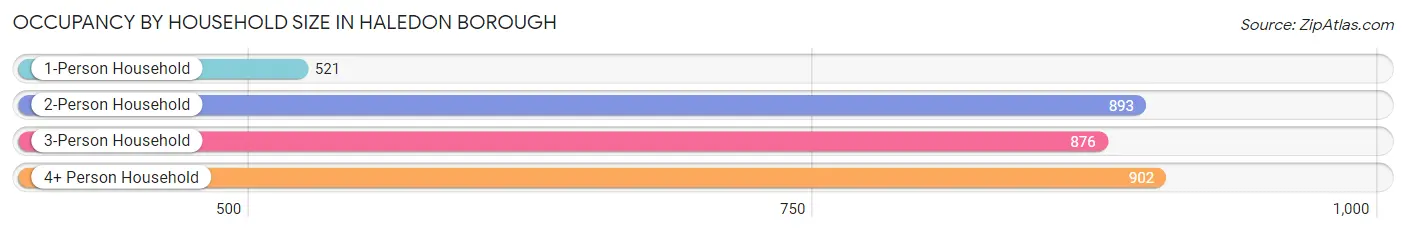
| Household Size | # Housing Units | % Housing Units |
| 1-Person Household | 521 | 16.3% |
| 2-Person Household | 893 | 28.0% |
| 3-Person Household | 876 | 27.4% |
| 4+ Person Household | 902 | 28.3% |
| Total Housing Units | 3,192 | 100.0% |
Occupancy by Ownership by Household Size in Haledon borough
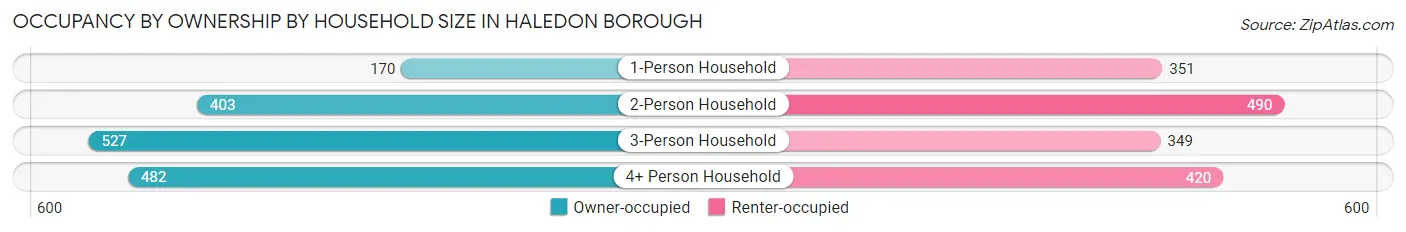
| Household Size | Owner-occupied | Renter-occupied |
| 1-Person Household | 170 (32.6%) | 351 (67.4%) |
| 2-Person Household | 403 (45.1%) | 490 (54.9%) |
| 3-Person Household | 527 (60.2%) | 349 (39.8%) |
| 4+ Person Household | 482 (53.4%) | 420 (46.6%) |
| Total Housing Units | 1,582 (49.6%) | 1,610 (50.4%) |
Occupancy by Educational Attainment in Haledon borough
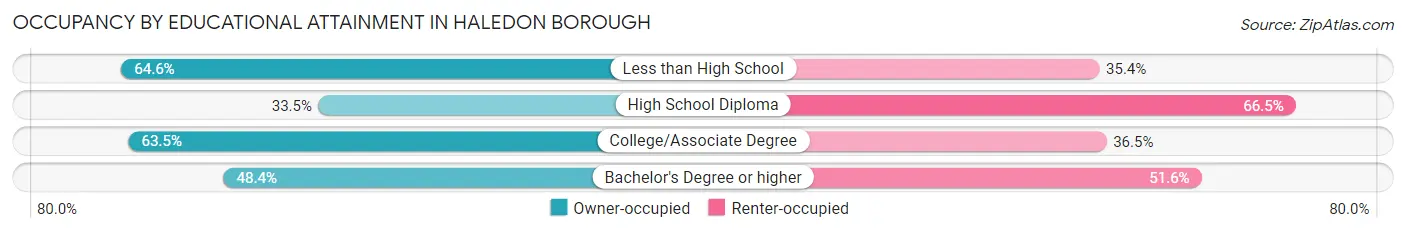
| Household Size | Owner-occupied | Renter-occupied |
| Less than High School | 181 (64.6%) | 99 (35.4%) |
| High School Diploma | 335 (33.5%) | 665 (66.5%) |
| College/Associate Degree | 590 (63.5%) | 339 (36.5%) |
| Bachelor's Degree or higher | 476 (48.4%) | 507 (51.6%) |
Occupancy by Age of Householder in Haledon borough
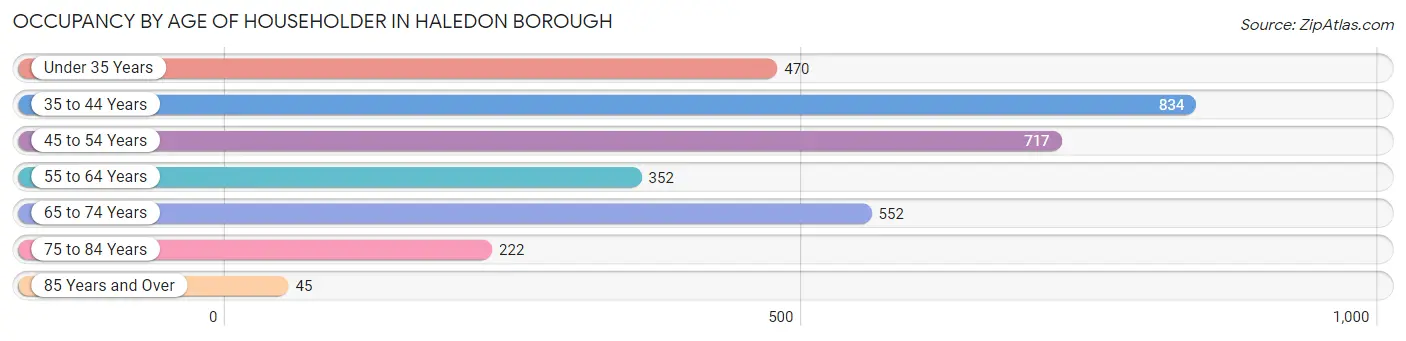
| Age Bracket | # Households | % Households |
| Under 35 Years | 470 | 14.7% |
| 35 to 44 Years | 834 | 26.1% |
| 45 to 54 Years | 717 | 22.5% |
| 55 to 64 Years | 352 | 11.0% |
| 65 to 74 Years | 552 | 17.3% |
| 75 to 84 Years | 222 | 7.0% |
| 85 Years and Over | 45 | 1.4% |
| Total | 3,192 | 100.0% |
Housing Finances in Haledon borough
Median Income by Occupancy in Haledon borough
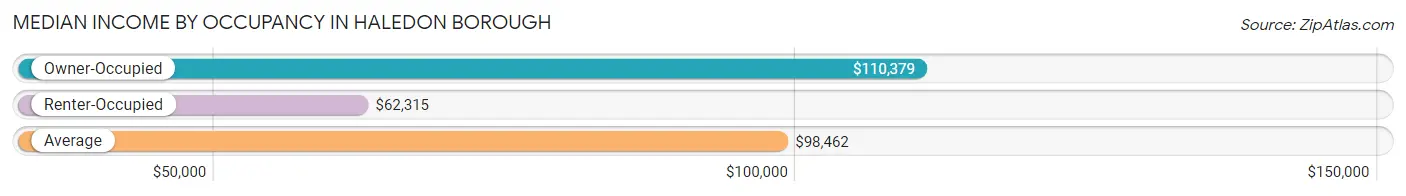
| Occupancy Type | # Households | Median Income |
| Owner-Occupied | 1,582 (49.6%) | $110,379 |
| Renter-Occupied | 1,610 (50.4%) | $62,315 |
| Average | 3,192 (100.0%) | $98,462 |
Occupancy by Householder Income Bracket in Haledon borough
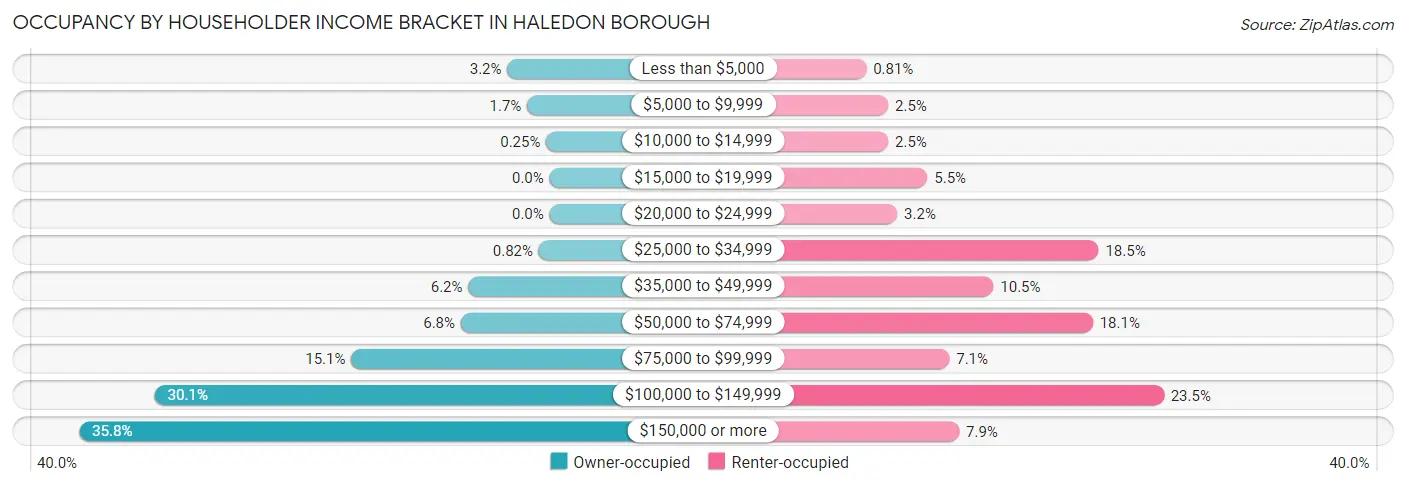
| Income Bracket | Owner-occupied | Renter-occupied |
| Less than $5,000 | 51 (3.2%) | 13 (0.8%) |
| $5,000 to $9,999 | 27 (1.7%) | 40 (2.5%) |
| $10,000 to $14,999 | 4 (0.3%) | 40 (2.5%) |
| $15,000 to $19,999 | 0 (0.0%) | 88 (5.5%) |
| $20,000 to $24,999 | 0 (0.0%) | 51 (3.2%) |
| $25,000 to $34,999 | 13 (0.8%) | 298 (18.5%) |
| $35,000 to $49,999 | 98 (6.2%) | 169 (10.5%) |
| $50,000 to $74,999 | 107 (6.8%) | 291 (18.1%) |
| $75,000 to $99,999 | 239 (15.1%) | 115 (7.1%) |
| $100,000 to $149,999 | 476 (30.1%) | 378 (23.5%) |
| $150,000 or more | 567 (35.8%) | 127 (7.9%) |
| Total | 1,582 (100.0%) | 1,610 (100.0%) |
Monthly Housing Cost Tiers in Haledon borough
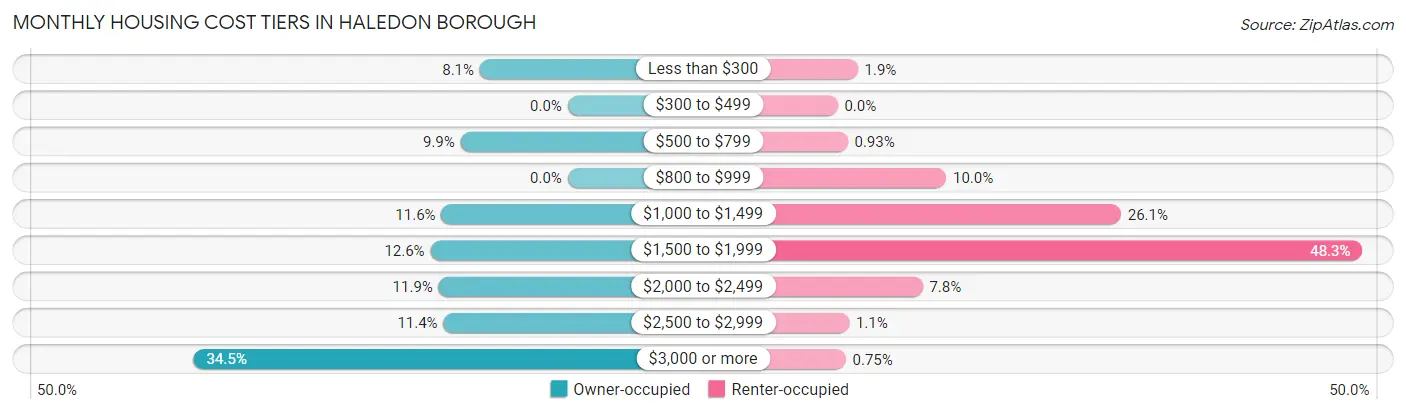
| Monthly Cost | Owner-occupied | Renter-occupied |
| Less than $300 | 128 (8.1%) | 30 (1.9%) |
| $300 to $499 | 0 (0.0%) | 0 (0.0%) |
| $500 to $799 | 156 (9.9%) | 15 (0.9%) |
| $800 to $999 | 0 (0.0%) | 161 (10.0%) |
| $1,000 to $1,499 | 184 (11.6%) | 420 (26.1%) |
| $1,500 to $1,999 | 200 (12.6%) | 778 (48.3%) |
| $2,000 to $2,499 | 188 (11.9%) | 126 (7.8%) |
| $2,500 to $2,999 | 181 (11.4%) | 17 (1.1%) |
| $3,000 or more | 545 (34.4%) | 12 (0.7%) |
| Total | 1,582 (100.0%) | 1,610 (100.0%) |
Physical Housing Characteristics in Haledon borough
Housing Structures in Haledon borough
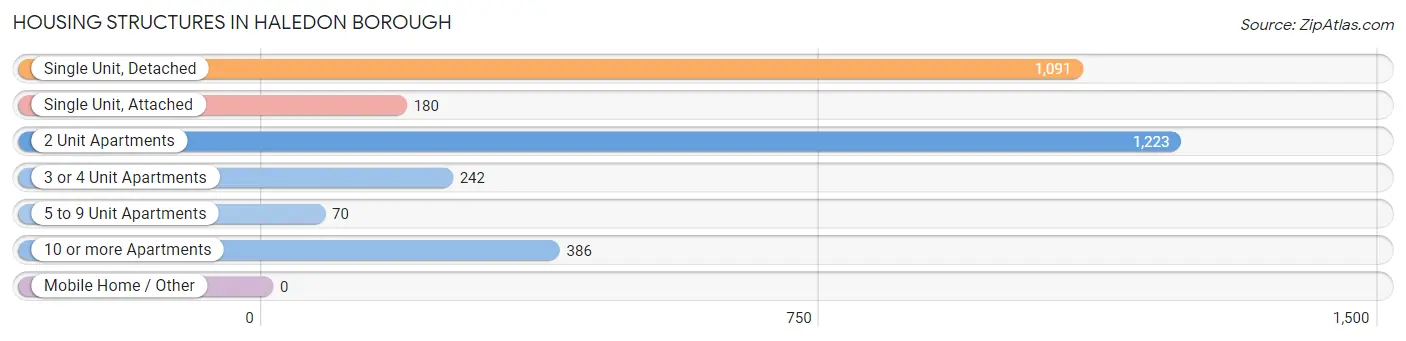
| Structure Type | # Housing Units | % Housing Units |
| Single Unit, Detached | 1,091 | 34.2% |
| Single Unit, Attached | 180 | 5.6% |
| 2 Unit Apartments | 1,223 | 38.3% |
| 3 or 4 Unit Apartments | 242 | 7.6% |
| 5 to 9 Unit Apartments | 70 | 2.2% |
| 10 or more Apartments | 386 | 12.1% |
| Mobile Home / Other | 0 | 0.0% |
| Total | 3,192 | 100.0% |
Housing Structures by Occupancy in Haledon borough
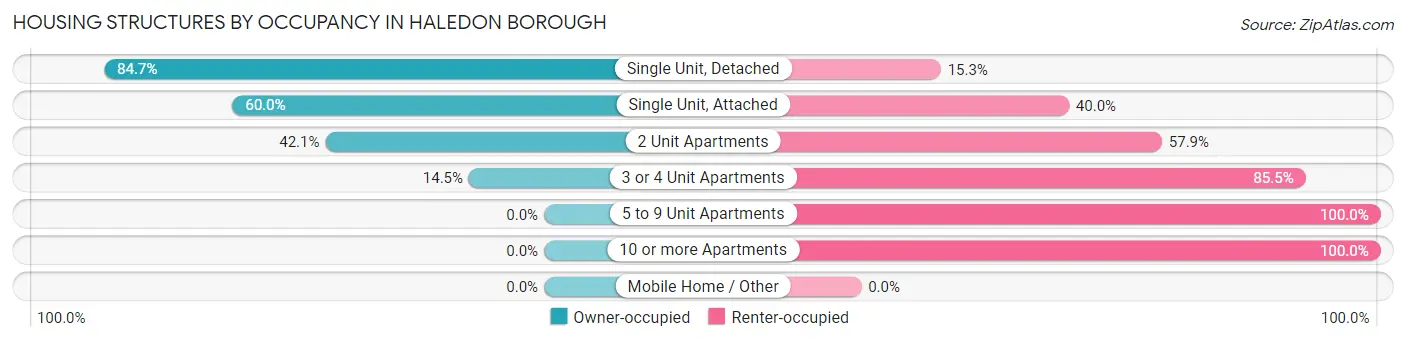
| Structure Type | Owner-occupied | Renter-occupied |
| Single Unit, Detached | 924 (84.7%) | 167 (15.3%) |
| Single Unit, Attached | 108 (60.0%) | 72 (40.0%) |
| 2 Unit Apartments | 515 (42.1%) | 708 (57.9%) |
| 3 or 4 Unit Apartments | 35 (14.5%) | 207 (85.5%) |
| 5 to 9 Unit Apartments | 0 (0.0%) | 70 (100.0%) |
| 10 or more Apartments | 0 (0.0%) | 386 (100.0%) |
| Mobile Home / Other | 0 (0.0%) | 0 (0.0%) |
| Total | 1,582 (49.6%) | 1,610 (50.4%) |
Housing Structures by Number of Rooms in Haledon borough
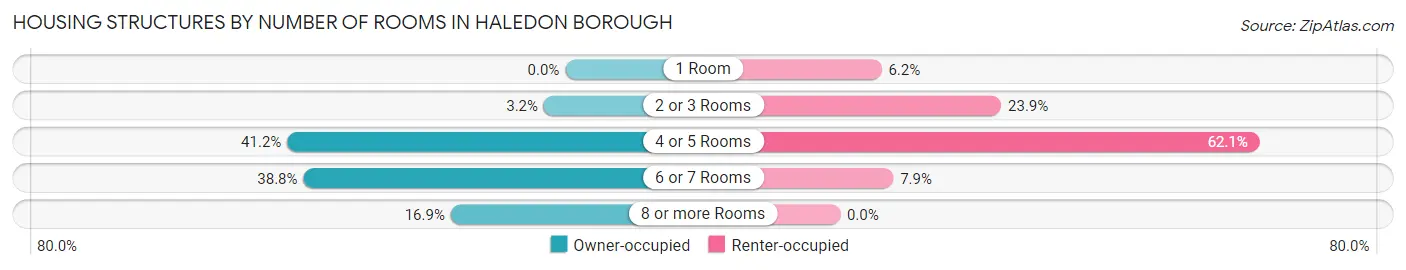
| Number of Rooms | Owner-occupied | Renter-occupied |
| 1 Room | 0 (0.0%) | 99 (6.1%) |
| 2 or 3 Rooms | 50 (3.2%) | 384 (23.8%) |
| 4 or 5 Rooms | 651 (41.1%) | 1,000 (62.1%) |
| 6 or 7 Rooms | 613 (38.8%) | 127 (7.9%) |
| 8 or more Rooms | 268 (16.9%) | 0 (0.0%) |
| Total | 1,582 (100.0%) | 1,610 (100.0%) |
Housing Structure by Heating Type in Haledon borough
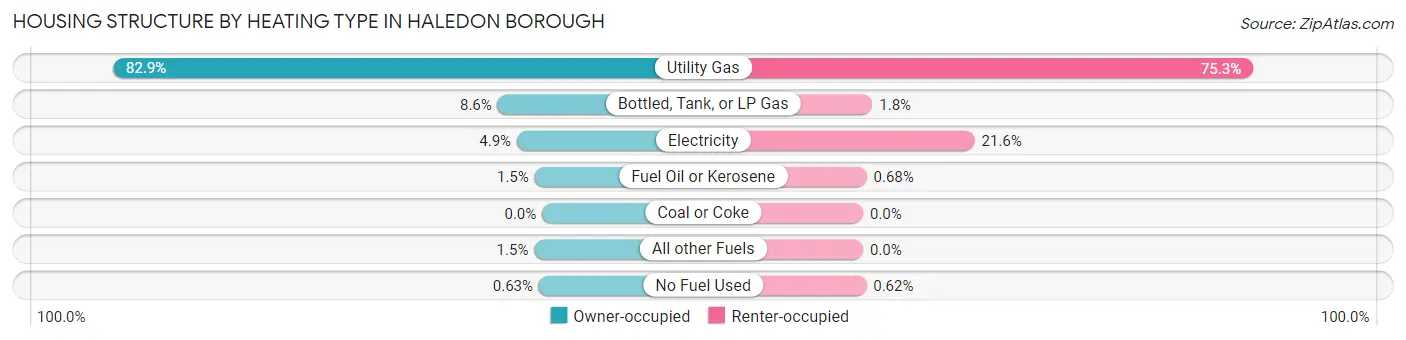
| Heating Type | Owner-occupied | Renter-occupied |
| Utility Gas | 1,312 (82.9%) | 1,213 (75.3%) |
| Bottled, Tank, or LP Gas | 136 (8.6%) | 29 (1.8%) |
| Electricity | 77 (4.9%) | 347 (21.5%) |
| Fuel Oil or Kerosene | 23 (1.5%) | 11 (0.7%) |
| Coal or Coke | 0 (0.0%) | 0 (0.0%) |
| All other Fuels | 24 (1.5%) | 0 (0.0%) |
| No Fuel Used | 10 (0.6%) | 10 (0.6%) |
| Total | 1,582 (100.0%) | 1,610 (100.0%) |
Household Vehicle Usage in Haledon borough
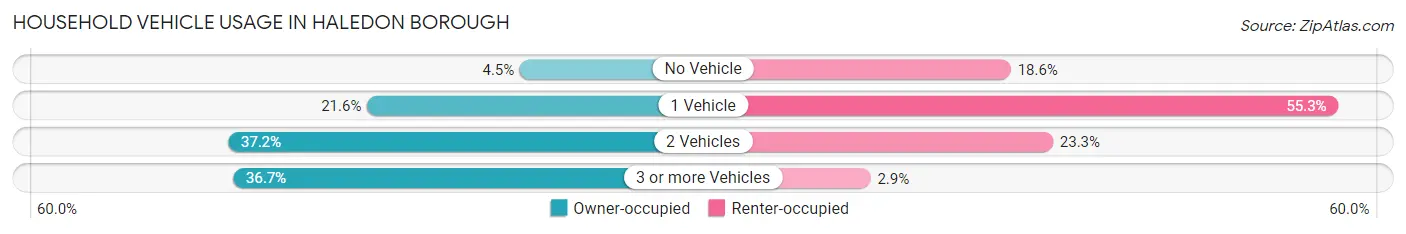
| Vehicles per Household | Owner-occupied | Renter-occupied |
| No Vehicle | 71 (4.5%) | 299 (18.6%) |
| 1 Vehicle | 342 (21.6%) | 890 (55.3%) |
| 2 Vehicles | 589 (37.2%) | 375 (23.3%) |
| 3 or more Vehicles | 580 (36.7%) | 46 (2.9%) |
| Total | 1,582 (100.0%) | 1,610 (100.0%) |
Real Estate & Mortgages in Haledon borough
Real Estate and Mortgage Overview in Haledon borough
| Characteristic | Without Mortgage | With Mortgage |
| Housing Units | 463 | 1,119 |
| Median Property Value | $317,100 | $335,800 |
| Median Household Income | $108,199 | $511 |
| Monthly Housing Costs | $1,208 | $531 |
| Real Estate Taxes | $10,001 | $64 |
Property Value by Mortgage Status in Haledon borough
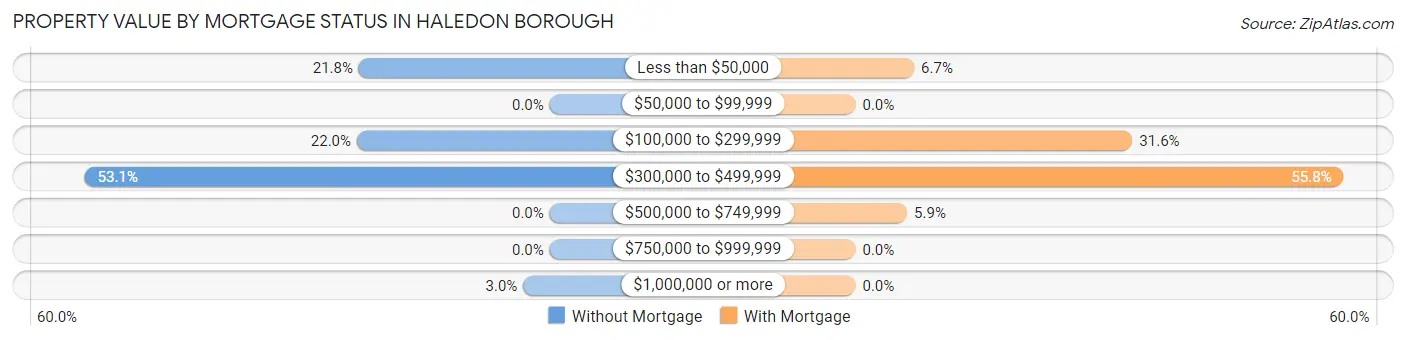
| Property Value | Without Mortgage | With Mortgage |
| Less than $50,000 | 101 (21.8%) | 75 (6.7%) |
| $50,000 to $99,999 | 0 (0.0%) | 0 (0.0%) |
| $100,000 to $299,999 | 102 (22.0%) | 354 (31.6%) |
| $300,000 to $499,999 | 246 (53.1%) | 624 (55.8%) |
| $500,000 to $749,999 | 0 (0.0%) | 66 (5.9%) |
| $750,000 to $999,999 | 0 (0.0%) | 0 (0.0%) |
| $1,000,000 or more | 14 (3.0%) | 0 (0.0%) |
| Total | 463 (100.0%) | 1,119 (100.0%) |
Household Income by Mortgage Status in Haledon borough
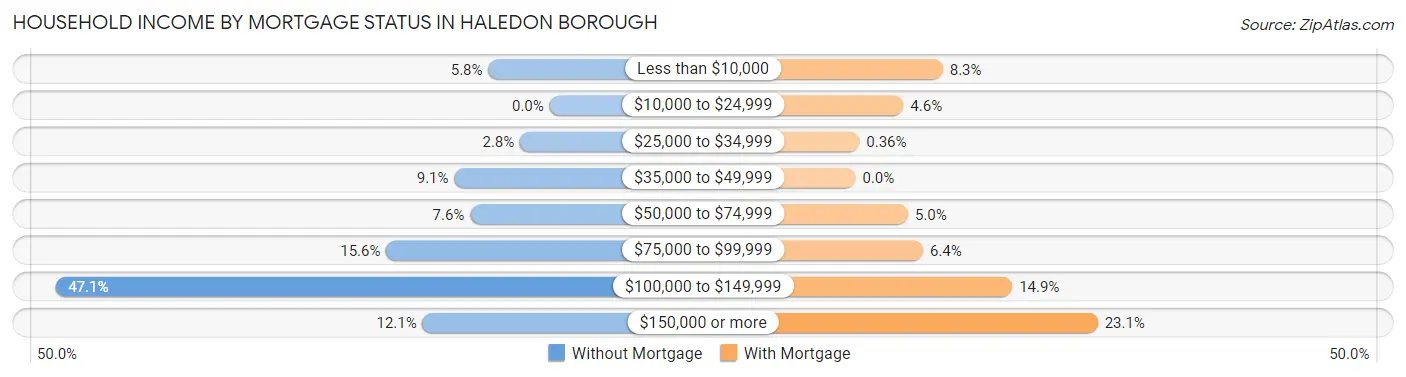
| Household Income | Without Mortgage | With Mortgage |
| Less than $10,000 | 27 (5.8%) | 93 (8.3%) |
| $10,000 to $24,999 | 0 (0.0%) | 51 (4.6%) |
| $25,000 to $34,999 | 13 (2.8%) | 4 (0.4%) |
| $35,000 to $49,999 | 42 (9.1%) | 0 (0.0%) |
| $50,000 to $74,999 | 35 (7.6%) | 56 (5.0%) |
| $75,000 to $99,999 | 72 (15.5%) | 72 (6.4%) |
| $100,000 to $149,999 | 218 (47.1%) | 167 (14.9%) |
| $150,000 or more | 56 (12.1%) | 258 (23.1%) |
| Total | 463 (100.0%) | 1,119 (100.0%) |
Property Value to Household Income Ratio in Haledon borough
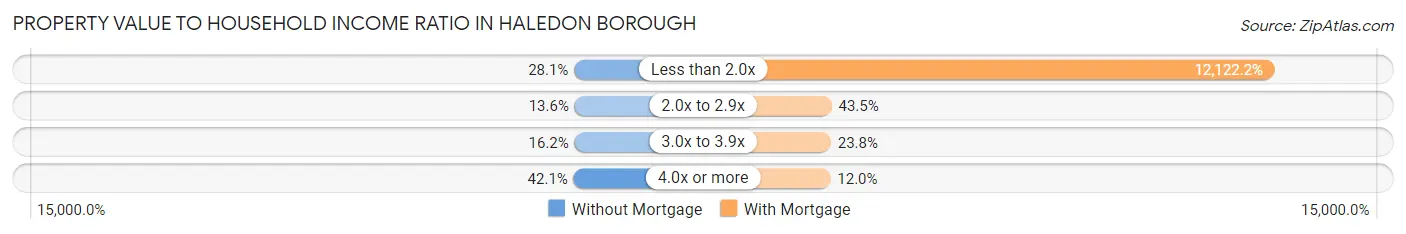
| Value-to-Income Ratio | Without Mortgage | With Mortgage |
| Less than 2.0x | 130 (28.1%) | 135,647 (12,122.2%) |
| 2.0x to 2.9x | 63 (13.6%) | 487 (43.5%) |
| 3.0x to 3.9x | 75 (16.2%) | 266 (23.8%) |
| 4.0x or more | 195 (42.1%) | 134 (12.0%) |
| Total | 463 (100.0%) | 1,119 (100.0%) |
Real Estate Taxes by Mortgage Status in Haledon borough
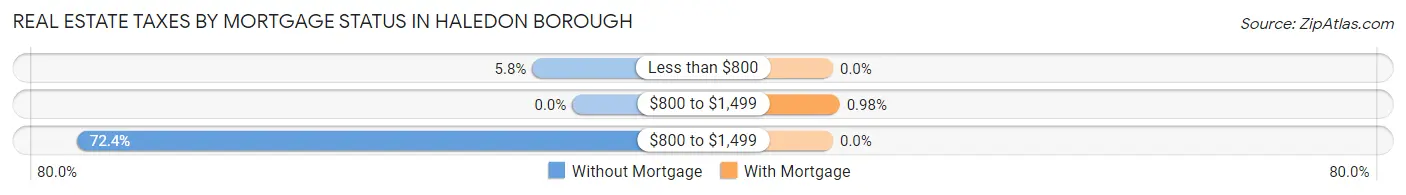
| Property Taxes | Without Mortgage | With Mortgage |
| Less than $800 | 27 (5.8%) | 0 (0.0%) |
| $800 to $1,499 | 0 (0.0%) | 11 (1.0%) |
| $800 to $1,499 | 335 (72.4%) | 0 (0.0%) |
| Total | 463 (100.0%) | 1,119 (100.0%) |
Health & Disability in Haledon borough
Health Insurance Coverage by Age in Haledon borough
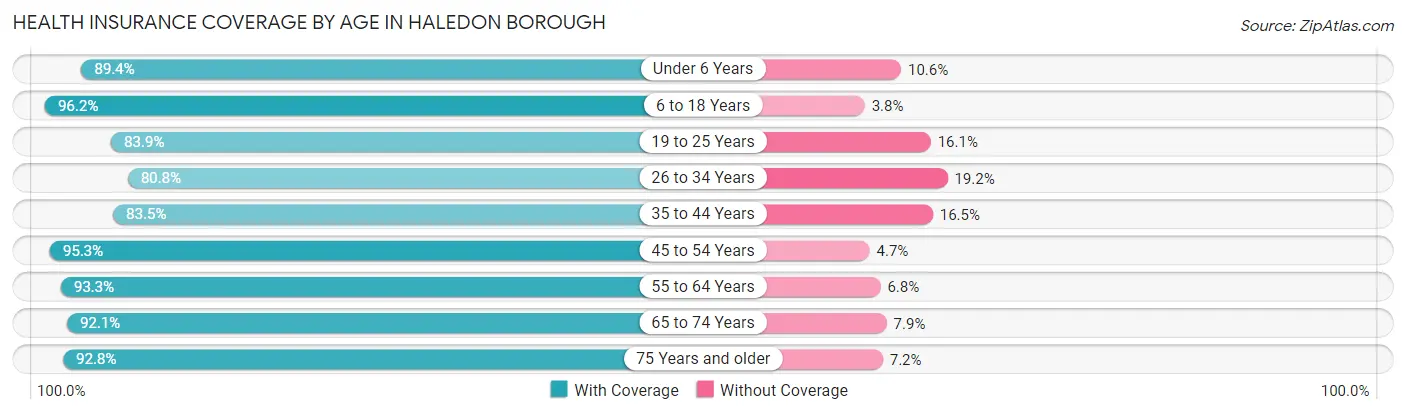
| Age Bracket | With Coverage | Without Coverage |
| Under 6 Years | 608 (89.4%) | 72 (10.6%) |
| 6 to 18 Years | 1,262 (96.2%) | 50 (3.8%) |
| 19 to 25 Years | 515 (83.9%) | 99 (16.1%) |
| 26 to 34 Years | 974 (80.8%) | 232 (19.2%) |
| 35 to 44 Years | 1,138 (83.5%) | 225 (16.5%) |
| 45 to 54 Years | 1,353 (95.3%) | 67 (4.7%) |
| 55 to 64 Years | 801 (93.2%) | 58 (6.8%) |
| 65 to 74 Years | 816 (92.1%) | 70 (7.9%) |
| 75 Years and older | 543 (92.8%) | 42 (7.2%) |
| Total | 8,010 (89.7%) | 915 (10.2%) |
Health Insurance Coverage by Citizenship Status in Haledon borough
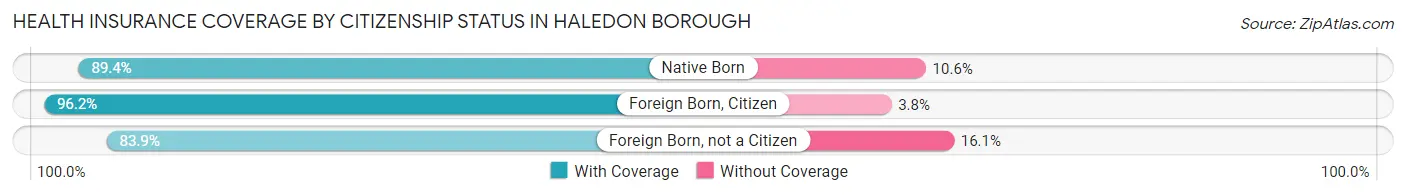
| Citizenship Status | With Coverage | Without Coverage |
| Native Born | 608 (89.4%) | 72 (10.6%) |
| Foreign Born, Citizen | 1,262 (96.2%) | 50 (3.8%) |
| Foreign Born, not a Citizen | 515 (83.9%) | 99 (16.1%) |
Health Insurance Coverage by Household Income in Haledon borough
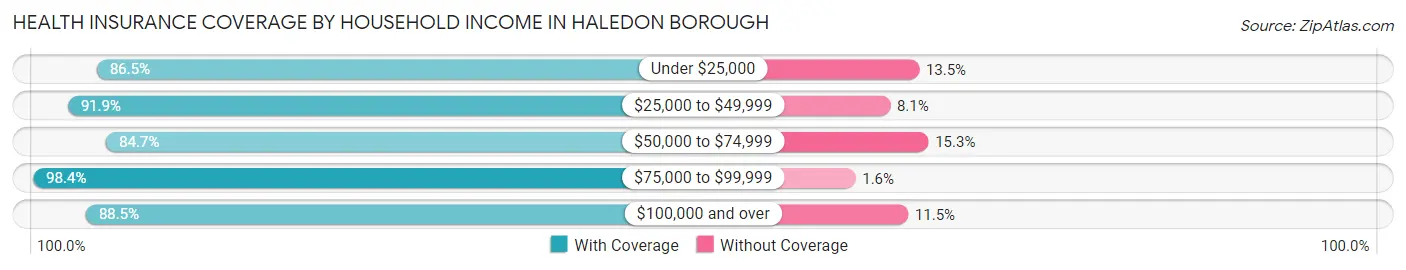
| Household Income | With Coverage | Without Coverage |
| Under $25,000 | 403 (86.5%) | 63 (13.5%) |
| $25,000 to $49,999 | 1,320 (91.9%) | 116 (8.1%) |
| $50,000 to $74,999 | 855 (84.7%) | 154 (15.3%) |
| $75,000 to $99,999 | 1,178 (98.4%) | 19 (1.6%) |
| $100,000 and over | 4,235 (88.5%) | 548 (11.5%) |
Public vs Private Health Insurance Coverage by Age in Haledon borough
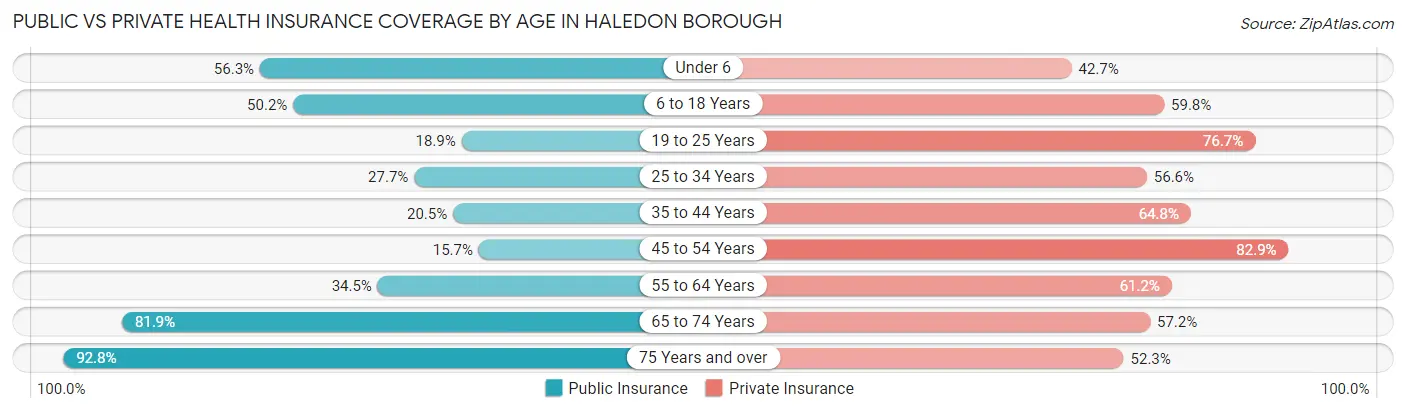
| Age Bracket | Public Insurance | Private Insurance |
| Under 6 | 383 (56.3%) | 290 (42.6%) |
| 6 to 18 Years | 658 (50.1%) | 785 (59.8%) |
| 19 to 25 Years | 116 (18.9%) | 471 (76.7%) |
| 25 to 34 Years | 334 (27.7%) | 683 (56.6%) |
| 35 to 44 Years | 279 (20.5%) | 883 (64.8%) |
| 45 to 54 Years | 223 (15.7%) | 1,177 (82.9%) |
| 55 to 64 Years | 296 (34.5%) | 526 (61.2%) |
| 65 to 74 Years | 726 (81.9%) | 507 (57.2%) |
| 75 Years and over | 543 (92.8%) | 306 (52.3%) |
| Total | 3,558 (39.9%) | 5,628 (63.1%) |
Disability Status by Sex by Age in Haledon borough
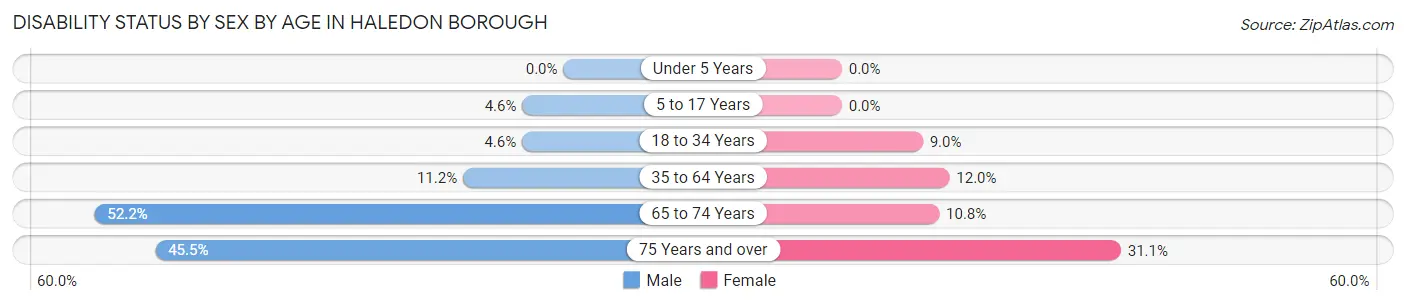
| Age Bracket | Male | Female |
| Under 5 Years | 0 (0.0%) | 0 (0.0%) |
| 5 to 17 Years | 27 (4.6%) | 0 (0.0%) |
| 18 to 34 Years | 50 (4.6%) | 72 (9.0%) |
| 35 to 64 Years | 202 (11.2%) | 220 (12.0%) |
| 65 to 74 Years | 188 (52.2%) | 57 (10.8%) |
| 75 Years and over | 105 (45.5%) | 110 (31.1%) |
Disability Class by Sex by Age in Haledon borough
Disability Class: Hearing Difficulty
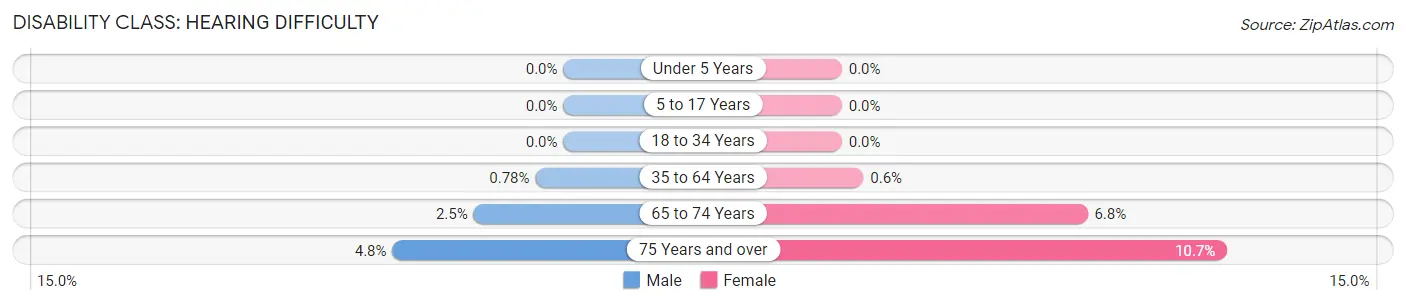
| Age Bracket | Male | Female |
| Under 5 Years | 0 (0.0%) | 0 (0.0%) |
| 5 to 17 Years | 0 (0.0%) | 0 (0.0%) |
| 18 to 34 Years | 0 (0.0%) | 0 (0.0%) |
| 35 to 64 Years | 14 (0.8%) | 11 (0.6%) |
| 65 to 74 Years | 9 (2.5%) | 36 (6.8%) |
| 75 Years and over | 11 (4.8%) | 38 (10.7%) |
Disability Class: Vision Difficulty
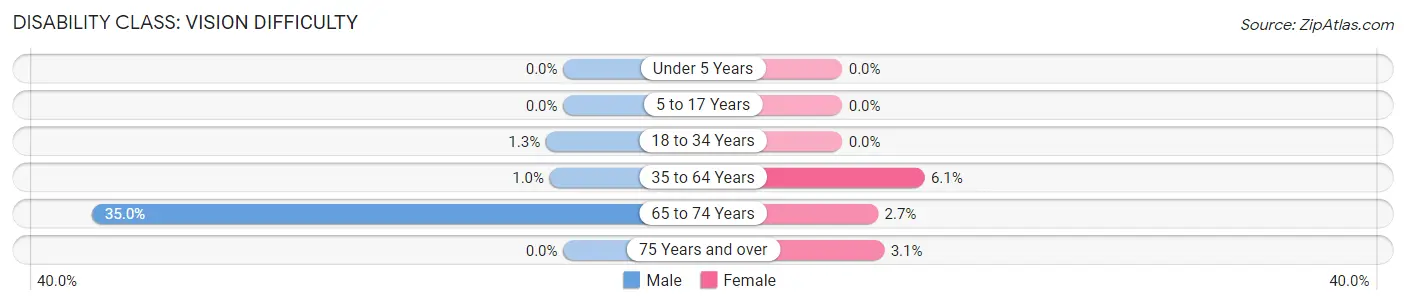
| Age Bracket | Male | Female |
| Under 5 Years | 0 (0.0%) | 0 (0.0%) |
| 5 to 17 Years | 0 (0.0%) | 0 (0.0%) |
| 18 to 34 Years | 14 (1.3%) | 0 (0.0%) |
| 35 to 64 Years | 18 (1.0%) | 112 (6.1%) |
| 65 to 74 Years | 126 (35.0%) | 14 (2.7%) |
| 75 Years and over | 0 (0.0%) | 11 (3.1%) |
Disability Class: Cognitive Difficulty
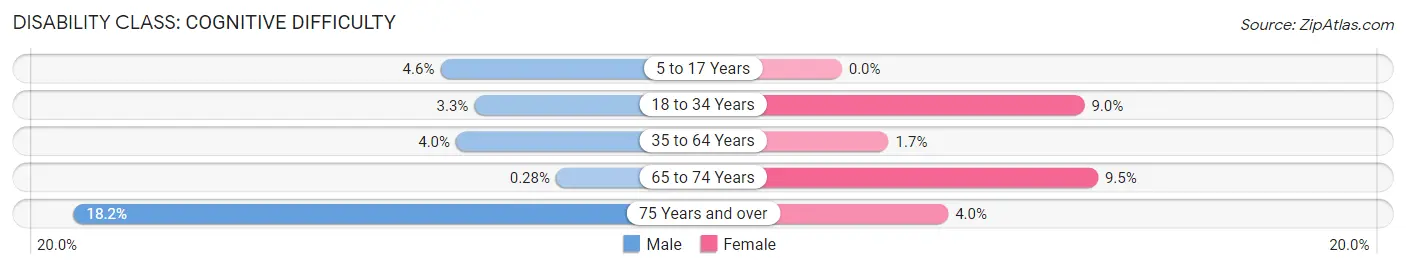
| Age Bracket | Male | Female |
| 5 to 17 Years | 27 (4.6%) | 0 (0.0%) |
| 18 to 34 Years | 36 (3.3%) | 72 (9.0%) |
| 35 to 64 Years | 72 (4.0%) | 32 (1.7%) |
| 65 to 74 Years | 1 (0.3%) | 50 (9.5%) |
| 75 Years and over | 42 (18.2%) | 14 (4.0%) |
Disability Class: Ambulatory Difficulty
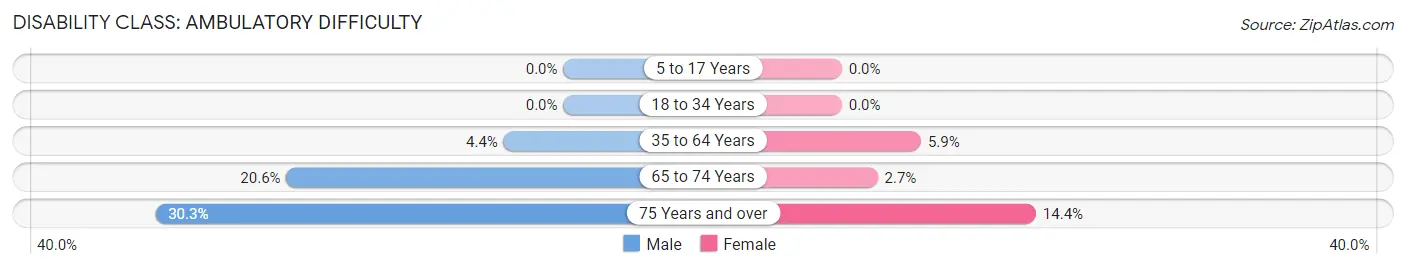
| Age Bracket | Male | Female |
| 5 to 17 Years | 0 (0.0%) | 0 (0.0%) |
| 18 to 34 Years | 0 (0.0%) | 0 (0.0%) |
| 35 to 64 Years | 80 (4.4%) | 108 (5.9%) |
| 65 to 74 Years | 74 (20.6%) | 14 (2.7%) |
| 75 Years and over | 70 (30.3%) | 51 (14.4%) |
Disability Class: Self-Care Difficulty
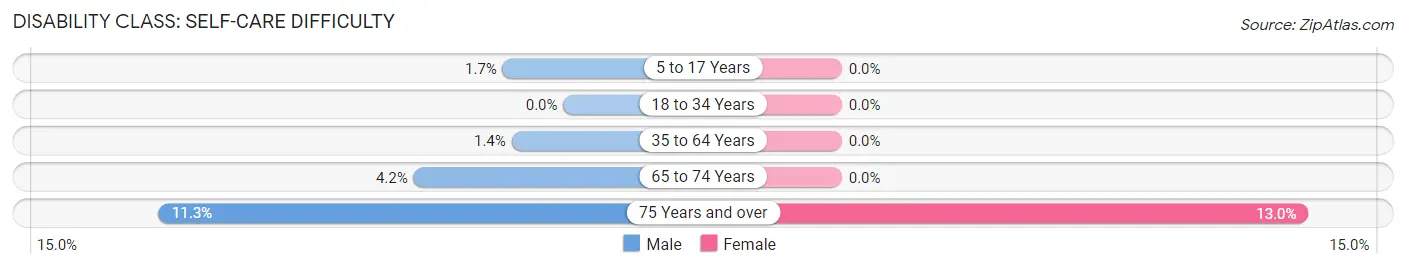
| Age Bracket | Male | Female |
| 5 to 17 Years | 10 (1.7%) | 0 (0.0%) |
| 18 to 34 Years | 0 (0.0%) | 0 (0.0%) |
| 35 to 64 Years | 26 (1.4%) | 0 (0.0%) |
| 65 to 74 Years | 15 (4.2%) | 0 (0.0%) |
| 75 Years and over | 26 (11.3%) | 46 (13.0%) |
Technology Access in Haledon borough
Computing Device Access in Haledon borough
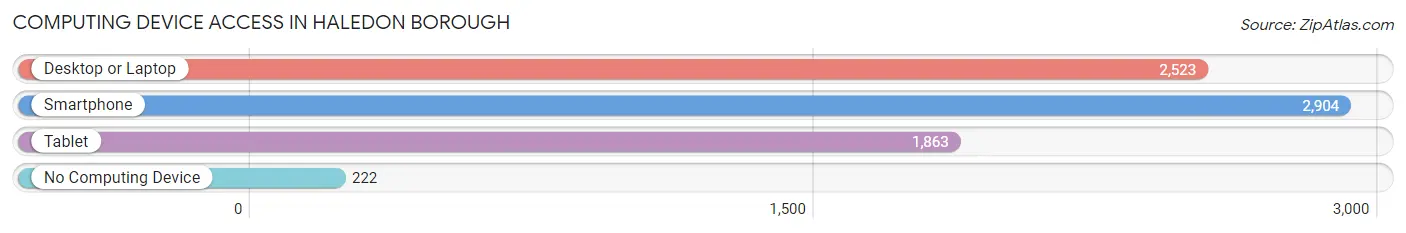
| Device Type | # Households | % Households |
| Desktop or Laptop | 2,523 | 79.0% |
| Smartphone | 2,904 | 91.0% |
| Tablet | 1,863 | 58.4% |
| No Computing Device | 222 | 7.0% |
| Total | 3,192 | 100.0% |
Internet Access in Haledon borough
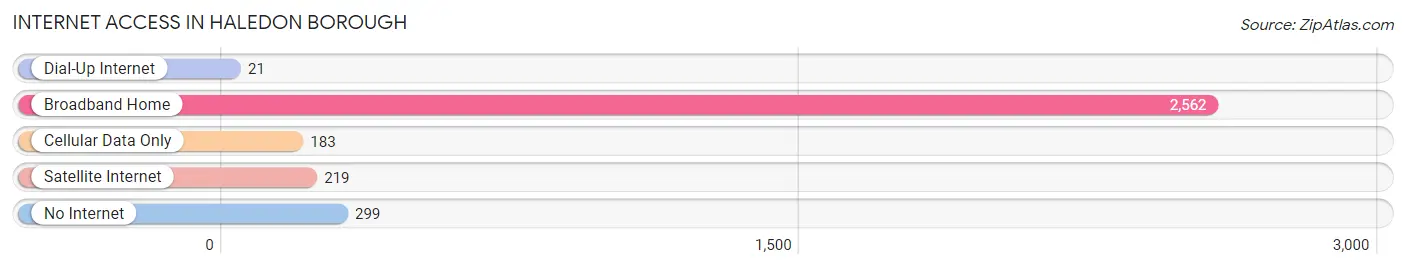
| Internet Type | # Households | % Households |
| Dial-Up Internet | 21 | 0.7% |
| Broadband Home | 2,562 | 80.3% |
| Cellular Data Only | 183 | 5.7% |
| Satellite Internet | 219 | 6.9% |
| No Internet | 299 | 9.4% |
| Total | 3,192 | 100.0% |
Haledon borough Summary
Haledon Borough is a small borough located in Passaic County, New Jersey. It is situated in the northern part of the state, just west of Paterson and about 20 miles northwest of Newark. The borough is home to a population of 8,318 people, according to the 2010 United States Census.
History
Haledon Borough was originally part of the larger area known as Manchester Township, which was established in 1775. In 1894, Manchester Township was divided into two separate municipalities, Haledon and North Haledon. The two towns were officially incorporated as boroughs in 1908.
The name “Haledon” is derived from the Dutch word “halen”, which means “to draw” or “to haul”. This is likely a reference to the area’s history as a farming community, as the land was used to grow crops and haul them to market.
Geography
Haledon Borough is located in the northern part of Passaic County, New Jersey. It is situated just west of Paterson and about 20 miles northwest of Newark. The borough is bordered by North Haledon to the north, Prospect Park to the east, Paterson to the south, and Totowa to the west.
The borough covers an area of 1.2 square miles, all of which is land. The terrain is mostly flat, with some rolling hills in the northern part of the borough. The highest point in the borough is located at the intersection of High Mountain Road and Belmont Avenue, which is approximately 400 feet above sea level.
Economy
Haledon Borough’s economy is largely based on manufacturing and retail. The borough is home to several factories, including a paper mill, a plastics factory, and a printing plant. There are also several retail stores in the borough, including a grocery store, a pharmacy, and a hardware store.
The borough also has a number of small businesses, including restaurants, auto repair shops, and beauty salons. The borough is also home to a number of professional offices, including doctors, lawyers, and accountants.
Demographics
As of the 2010 United States Census, Haledon Borough had a population of 8,318 people. The racial makeup of the borough was 79.3% White, 8.2% African American, 0.3% Native American, 4.2% Asian, and 6.9% from other races. Hispanic or Latino of any race were 18.2% of the population.
The median household income in the borough was $60,945, and the median family income was $71,917. The per capita income was $27,945. About 8.2% of families and 10.2% of the population were below the poverty line, including 14.2% of those under age 18 and 8.2% of those age 65 or over.
Haledon Borough is a small borough with a rich history and a diverse population. The borough’s economy is largely based on manufacturing and retail, and there are a number of small businesses in the area. The borough is also home to a number of professional offices, and the median household income is higher than the national average.
Common Questions
What is Per Capita Income in Haledon borough?
Per Capita income in Haledon borough is $37,366.
What is the Median Family Income in Haledon borough?
Median Family Income in Haledon borough is $106,724.
What is the Median Household income in Haledon borough?
Median Household Income in Haledon borough is $98,462.
What is Income or Wage Gap in Haledon borough?
Income or Wage Gap in Haledon borough is 4.5%.
Women in Haledon borough earn 95.5 cents for every dollar earned by a man.
What is Inequality or Gini Index in Haledon borough?
Inequality or Gini Index in Haledon borough is 0.38.
What is the Total Population of Haledon borough?
Total Population of Haledon borough is 8,945.
What is the Total Male Population of Haledon borough?
Total Male Population of Haledon borough is 4,387.
What is the Total Female Population of Haledon borough?
Total Female Population of Haledon borough is 4,558.
What is the Ratio of Males per 100 Females in Haledon borough?
There are 96.25 Males per 100 Females in Haledon borough.
What is the Ratio of Females per 100 Males in Haledon borough?
There are 103.90 Females per 100 Males in Haledon borough.
What is the Median Population Age in Haledon borough?
Median Population Age in Haledon borough is 39.5 Years.
What is the Average Family Size in Haledon borough
Average Family Size in Haledon borough is 3.1 People.
What is the Average Household Size in Haledon borough
Average Household Size in Haledon borough is 2.8 People.
How Large is the Labor Force in Haledon borough?
There are 4,980 People in the Labor Forcein in Haledon borough.
What is the Percentage of People in the Labor Force in Haledon borough?
68.8% of People are in the Labor Force in Haledon borough.
What is the Unemployment Rate in Haledon borough?
Unemployment Rate in Haledon borough is 5.8%.