Cities with the Highest Percentage of Hispanic or Latino Population in Mississippi
RELATED REPORTS & OPTIONS
Hispanic or Latino
Mississippi
Compare Cities
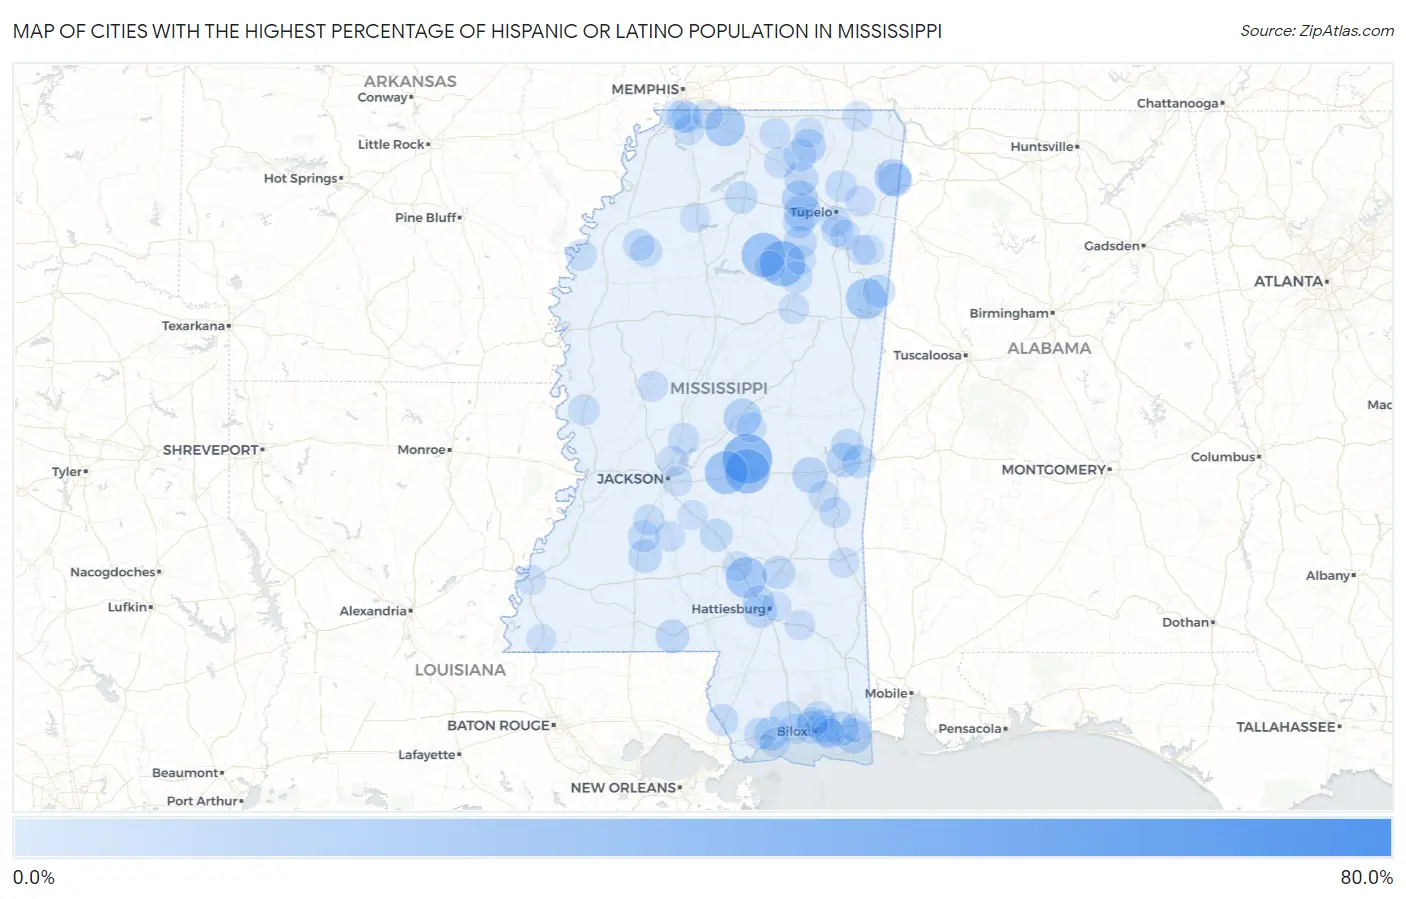
Map of Cities with the Highest Percentage of Hispanic or Latino Population in Mississippi
0.0%
80.0%
Cities with the Highest Percentage of Hispanic or Latino Population in Mississippi
| City | Hispanic or Latino | vs State | vs National | |
| 1. | Glen Allan | 79.9% | 3.3%(+76.6)#1 | 18.7%(+61.3)#1,013 |
| 2. | Bethlehem | 69.0% | 3.3%(+65.7)#2 | 18.7%(+50.4)#1,283 |
| 3. | Pheba | 45.5% | 3.3%(+42.2)#3 | 18.7%(+26.8)#2,181 |
| 4. | Hillsboro | 38.8% | 3.3%(+35.5)#4 | 18.7%(+20.1)#2,585 |
| 5. | Bolivar | 36.7% | 3.3%(+33.5)#5 | 18.7%(+18.1)#2,731 |
| 6. | Eastabuchie | 31.8% | 3.3%(+28.5)#6 | 18.7%(+13.1)#3,197 |
| 7. | Vardaman | 31.0% | 3.3%(+27.7)#7 | 18.7%(+12.3)#3,287 |
| 8. | Forest | 30.0% | 3.3%(+26.7)#8 | 18.7%(+11.3)#3,398 |
| 9. | Lakeview | 29.7% | 3.3%(+26.4)#9 | 18.7%(+11.0)#3,436 |
| 10. | Pittsboro | 29.6% | 3.3%(+26.3)#10 | 18.7%(+11.0)#3,445 |
| 11. | Morton | 27.2% | 3.3%(+23.9)#11 | 18.7%(+8.56)#3,734 |
| 12. | Seminary | 23.7% | 3.3%(+20.4)#12 | 18.7%(+5.06)#4,234 |
| 13. | Columbus Afb | 23.1% | 3.3%(+19.8)#13 | 18.7%(+4.46)#4,345 |
| 14. | Byhalia | 22.1% | 3.3%(+18.8)#14 | 18.7%(+3.41)#4,530 |
| 15. | Carthage | 17.4% | 3.3%(+14.1)#15 | 18.7%(-1.25)#5,608 |
| 16. | New Site | 16.9% | 3.3%(+13.6)#16 | 18.7%(-1.78)#5,767 |
| 17. | Pontotoc | 16.8% | 3.3%(+13.6)#17 | 18.7%(-1.81)#5,776 |
| 18. | Belmont | 15.1% | 3.3%(+11.8)#18 | 18.7%(-3.57)#6,327 |
| 19. | Ecru | 15.0% | 3.3%(+11.7)#19 | 18.7%(-3.62)#6,349 |
| 20. | Chunky | 14.2% | 3.3%(+10.9)#20 | 18.7%(-4.42)#6,641 |
| 21. | Winterville | 13.3% | 3.3%(+10.1)#21 | 18.7%(-5.32)#6,997 |
| 22. | Pascagoula | 13.2% | 3.3%(+9.93)#22 | 18.7%(-5.44)#7,042 |
| 23. | Marion | 12.6% | 3.3%(+9.34)#23 | 18.7%(-6.02)#7,310 |
| 24. | Gautier | 12.3% | 3.3%(+9.02)#24 | 18.7%(-6.35)#7,440 |
| 25. | Ripley | 11.8% | 3.3%(+8.52)#25 | 18.7%(-6.85)#7,695 |
| 26. | Victoria | 11.4% | 3.3%(+8.12)#26 | 18.7%(-7.25)#7,905 |
| 27. | Golden | 11.3% | 3.3%(+8.04)#27 | 18.7%(-7.33)#7,950 |
| 28. | Oak Grove | 11.0% | 3.3%(+7.68)#28 | 18.7%(-7.69)#8,139 |
| 29. | Delisle | 10.9% | 3.3%(+7.65)#29 | 18.7%(-7.72)#8,156 |
| 30. | Tylertown | 10.9% | 3.3%(+7.57)#30 | 18.7%(-7.80)#8,209 |
| 31. | Gulf Hills | 10.8% | 3.3%(+7.52)#31 | 18.7%(-7.85)#8,230 |
| 32. | Beauregard | 10.8% | 3.3%(+7.52)#32 | 18.7%(-7.85)#8,231 |
| 33. | West Hattiesburg | 10.8% | 3.3%(+7.51)#33 | 18.7%(-7.86)#8,232 |
| 34. | New Albany | 10.7% | 3.3%(+7.44)#34 | 18.7%(-7.93)#8,263 |
| 35. | New Houlka | 10.3% | 3.3%(+7.00)#35 | 18.7%(-8.37)#8,539 |
| 36. | Ellisville | 10.1% | 3.3%(+6.77)#36 | 18.7%(-8.60)#8,676 |
| 37. | Toomsuba | 9.6% | 3.3%(+6.33)#37 | 18.7%(-9.04)#8,966 |
| 38. | Caledonia | 9.5% | 3.3%(+6.25)#38 | 18.7%(-9.12)#9,027 |
| 39. | Magee | 9.3% | 3.3%(+6.05)#39 | 18.7%(-9.32)#9,157 |
| 40. | Blue Mountain | 9.2% | 3.3%(+5.90)#40 | 18.7%(-9.47)#9,287 |
| 41. | University | 9.0% | 3.3%(+5.71)#41 | 18.7%(-9.66)#9,436 |
| 42. | Biloxi | 9.0% | 3.3%(+5.68)#42 | 18.7%(-9.69)#9,459 |
| 43. | Horn Lake | 8.8% | 3.3%(+5.56)#43 | 18.7%(-9.81)#9,548 |
| 44. | Meridian Station | 8.8% | 3.3%(+5.51)#44 | 18.7%(-9.85)#9,578 |
| 45. | Diamondhead | 8.3% | 3.3%(+5.06)#45 | 18.7%(-10.3)#9,951 |
| 46. | Woodland | 8.3% | 3.3%(+5.00)#46 | 18.7%(-10.4)#10,018 |
| 47. | Latimer | 8.2% | 3.3%(+4.92)#47 | 18.7%(-10.4)#10,087 |
| 48. | Lyman | 8.2% | 3.3%(+4.91)#48 | 18.7%(-10.5)#10,098 |
| 49. | Algoma | 7.8% | 3.3%(+4.51)#49 | 18.7%(-10.9)#10,471 |
| 50. | Ocean Springs | 7.8% | 3.3%(+4.48)#50 | 18.7%(-10.9)#10,508 |
| 51. | Guntown | 7.6% | 3.3%(+4.31)#51 | 18.7%(-11.1)#10,687 |
| 52. | Hazlehurst | 7.6% | 3.3%(+4.27)#52 | 18.7%(-11.1)#10,727 |
| 53. | Nicholson | 7.5% | 3.3%(+4.25)#53 | 18.7%(-11.1)#10,741 |
| 54. | Shannon | 7.4% | 3.3%(+4.11)#54 | 18.7%(-11.3)#10,867 |
| 55. | Sumner | 7.4% | 3.3%(+4.07)#55 | 18.7%(-11.3)#10,898 |
| 56. | Tutwiler | 7.3% | 3.3%(+4.05)#56 | 18.7%(-11.3)#10,922 |
| 57. | Rawls Springs | 7.2% | 3.3%(+3.97)#57 | 18.7%(-11.4)#10,999 |
| 58. | Canton | 7.1% | 3.3%(+3.81)#58 | 18.7%(-11.6)#11,143 |
| 59. | Hickory Flat | 7.0% | 3.3%(+3.70)#59 | 18.7%(-11.7)#11,253 |
| 60. | Ridgeland | 6.8% | 3.3%(+3.48)#60 | 18.7%(-11.9)#11,490 |
| 61. | Cary | 6.8% | 3.3%(+3.48)#61 | 18.7%(-11.9)#11,496 |
| 62. | Enterprise | 6.6% | 3.3%(+3.33)#62 | 18.7%(-12.0)#11,655 |
| 63. | Quitman | 6.5% | 3.3%(+3.19)#63 | 18.7%(-12.2)#11,814 |
| 64. | Gunnison | 6.4% | 3.3%(+3.10)#64 | 18.7%(-12.3)#11,920 |
| 65. | Verona | 6.2% | 3.3%(+2.93)#65 | 18.7%(-12.4)#12,112 |
| 66. | Snow Lake Shores | 6.0% | 3.3%(+2.76)#66 | 18.7%(-12.6)#12,329 |
| 67. | Crystal Springs | 5.9% | 3.3%(+2.65)#67 | 18.7%(-12.7)#12,457 |
| 68. | Hatley | 5.7% | 3.3%(+2.41)#68 | 18.7%(-13.0)#12,760 |
| 69. | Eden | 5.7% | 3.3%(+2.40)#69 | 18.7%(-13.0)#12,774 |
| 70. | Maben | 5.7% | 3.3%(+2.38)#70 | 18.7%(-13.0)#12,808 |
| 71. | Mantachie | 5.6% | 3.3%(+2.32)#71 | 18.7%(-13.1)#12,881 |
| 72. | D Iberville | 5.6% | 3.3%(+2.30)#72 | 18.7%(-13.1)#12,899 |
| 73. | Derma | 5.5% | 3.3%(+2.21)#73 | 18.7%(-13.2)#13,009 |
| 74. | Georgetown | 5.4% | 3.3%(+2.14)#74 | 18.7%(-13.2)#13,089 |
| 75. | Gulfport | 5.4% | 3.3%(+2.12)#75 | 18.7%(-13.3)#13,137 |
| 76. | Waynesboro | 5.4% | 3.3%(+2.12)#76 | 18.7%(-13.3)#13,140 |
| 77. | Southaven | 5.2% | 3.3%(+1.95)#77 | 18.7%(-13.4)#13,395 |
| 78. | Hernando | 5.2% | 3.3%(+1.90)#78 | 18.7%(-13.5)#13,454 |
| 79. | Randolph | 5.1% | 3.3%(+1.83)#79 | 18.7%(-13.5)#13,539 |
| 80. | Nettleton | 5.1% | 3.3%(+1.83)#80 | 18.7%(-13.5)#13,542 |
| 81. | Olive Branch | 5.1% | 3.3%(+1.82)#81 | 18.7%(-13.5)#13,564 |
| 82. | New Augusta | 5.1% | 3.3%(+1.82)#82 | 18.7%(-13.6)#13,570 |
| 83. | Standing Pine | 5.1% | 3.3%(+1.78)#83 | 18.7%(-13.6)#13,644 |
| 84. | Corinth | 5.0% | 3.3%(+1.70)#84 | 18.7%(-13.7)#13,754 |
| 85. | Kirkville | 5.0% | 3.3%(+1.69)#85 | 18.7%(-13.7)#13,769 |
| 86. | Lynchburg | 4.6% | 3.3%(+1.33)#86 | 18.7%(-14.0)#14,280 |
| 87. | Rena Lara | 4.6% | 3.3%(+1.33)#87 | 18.7%(-14.0)#14,301 |
| 88. | Gulf Park Estates | 4.6% | 3.3%(+1.28)#88 | 18.7%(-14.1)#14,374 |
| 89. | Falkner | 4.6% | 3.3%(+1.27)#89 | 18.7%(-14.1)#14,392 |
| 90. | Collins | 4.5% | 3.3%(+1.25)#90 | 18.7%(-14.1)#14,425 |
| 91. | Pope | 4.5% | 3.3%(+1.25)#91 | 18.7%(-14.1)#14,427 |
| 92. | Pass Christian | 4.4% | 3.3%(+1.13)#92 | 18.7%(-14.2)#14,596 |
| 93. | Petal | 4.3% | 3.3%(+1.05)#93 | 18.7%(-14.3)#14,719 |
| 94. | Pearl | 4.2% | 3.3%(+0.922)#94 | 18.7%(-14.4)#14,937 |
| 95. | Houston | 4.2% | 3.3%(+0.917)#95 | 18.7%(-14.5)#14,947 |
| 96. | Amory | 4.1% | 3.3%(+0.828)#96 | 18.7%(-14.5)#15,106 |
| 97. | Braxton | 4.1% | 3.3%(+0.808)#97 | 18.7%(-14.6)#15,140 |
| 98. | Moss Point | 4.0% | 3.3%(+0.767)#98 | 18.7%(-14.6)#15,204 |
| 99. | Natchez | 4.0% | 3.3%(+0.737)#99 | 18.7%(-14.6)#15,252 |
| 100. | Woodville | 4.0% | 3.3%(+0.721)#100 | 18.7%(-14.6)#15,278 |
Common Questions
What are the Top 10 Cities with the Highest Percentage of Hispanic or Latino Population in Mississippi?
Top 10 Cities with the Highest Percentage of Hispanic or Latino Population in Mississippi are:
What city has the Highest Percentage of Hispanic or Latino Population in Mississippi?
Hillsboro has the Highest Percentage of Hispanic or Latino Population in Mississippi with 38.8%.
What is the Percentage of Hispanic or Latino Population in the State of Mississippi?
Percentage of Hispanic or Latino Population in Mississippi is 3.3%.
What is the Percentage of Hispanic or Latino Population in the United States?
Percentage of Hispanic or Latino Population in the United States is 18.7%.