Cities with the Highest Percentage of Hispanic or Latino Population in Massachusetts
RELATED REPORTS & OPTIONS
Hispanic or Latino
Massachusetts
Compare Cities
Map of Cities with the Highest Percentage of Hispanic or Latino Population in Massachusetts
0.0%
100.0%
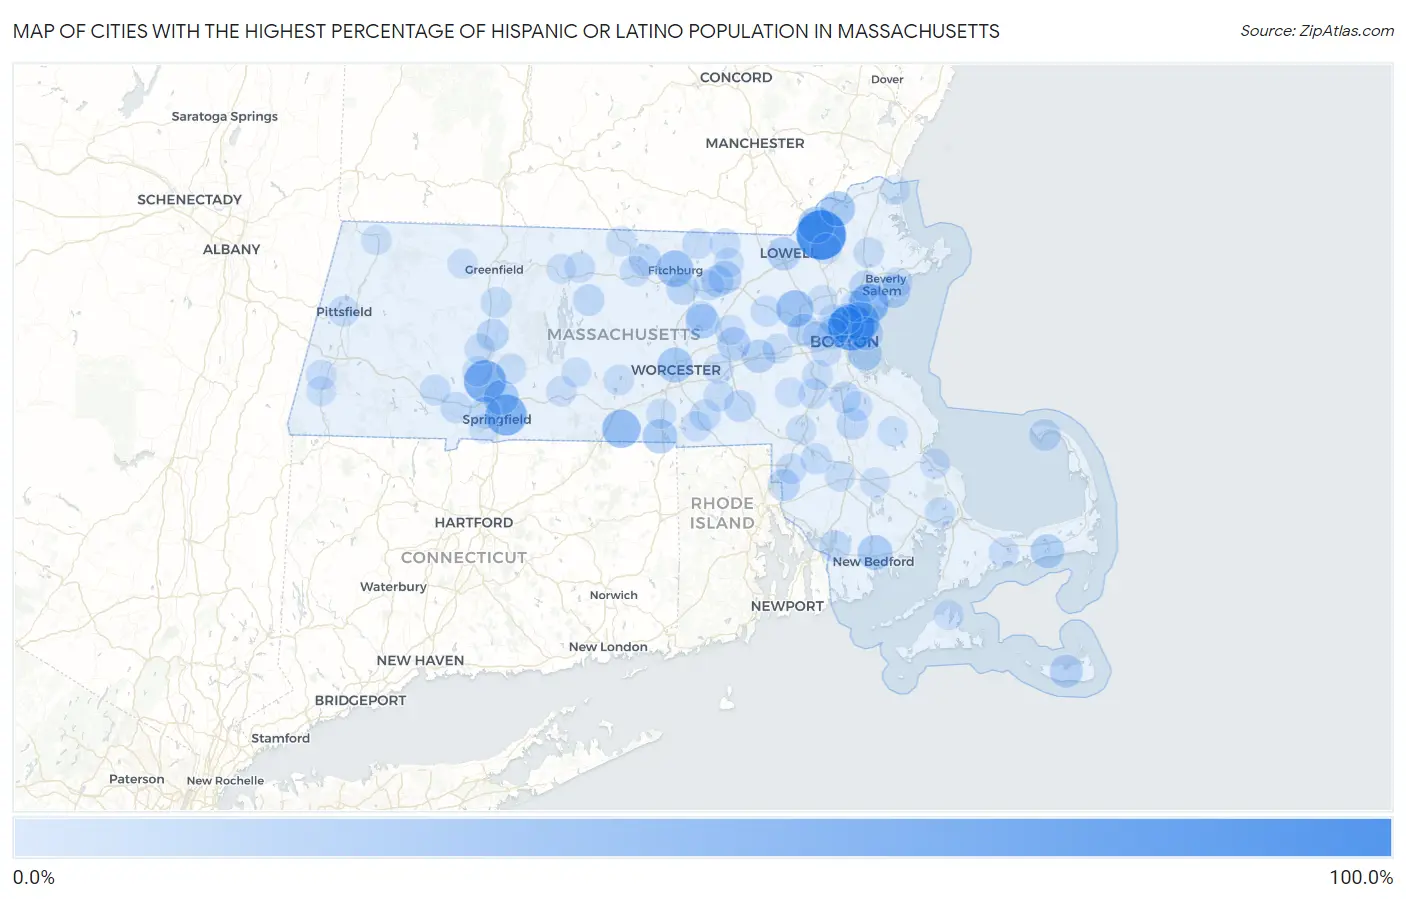
Cities with the Highest Percentage of Hispanic or Latino Population in Massachusetts
| City | Hispanic or Latino | vs State | vs National | |
| 1. | Lawrence | 82.0% | 12.6%(+69.4)#1 | 18.7%(+63.3)#965 |
| 2. | Chelsea | 67.4% | 12.6%(+54.8)#2 | 18.7%(+48.8)#1,329 |
| 3. | Holyoke | 51.7% | 12.6%(+39.1)#3 | 18.7%(+33.0)#1,879 |
| 4. | Springfield | 48.3% | 12.6%(+35.7)#4 | 18.7%(+29.6)#2,050 |
| 5. | Lynn | 42.9% | 12.6%(+30.3)#5 | 18.7%(+24.3)#2,333 |
| 6. | Revere | 39.9% | 12.6%(+27.3)#6 | 18.7%(+21.3)#2,507 |
| 7. | Southbridge Town | 36.0% | 12.6%(+23.4)#7 | 18.7%(+17.4)#2,806 |
| 8. | Hanscom Afb | 32.0% | 12.6%(+19.4)#8 | 18.7%(+13.3)#3,177 |
| 9. | Fitchburg | 30.6% | 12.6%(+18.0)#9 | 18.7%(+11.9)#3,334 |
| 10. | Methuen Town | 29.9% | 12.6%(+17.4)#10 | 18.7%(+11.3)#3,402 |
| 11. | Everett | 29.1% | 12.6%(+16.5)#11 | 18.7%(+10.5)#3,497 |
| 12. | Worcester | 24.6% | 12.6%(+12.0)#12 | 18.7%(+5.94)#4,075 |
| 13. | Haverhill | 24.2% | 12.6%(+11.7)#13 | 18.7%(+5.60)#4,134 |
| 14. | Chicopee | 24.0% | 12.6%(+11.4)#14 | 18.7%(+5.37)#4,182 |
| 15. | New Bedford | 23.4% | 12.6%(+10.9)#15 | 18.7%(+4.79)#4,280 |
| 16. | Webster | 21.9% | 12.6%(+9.34)#16 | 18.7%(+3.28)#4,551 |
| 17. | Clinton | 20.9% | 12.6%(+8.26)#17 | 18.7%(+2.20)#4,774 |
| 18. | Boston | 19.6% | 12.6%(+6.98)#18 | 18.7%(+0.916)#5,071 |
| 19. | West Dennis | 19.5% | 12.6%(+6.88)#19 | 18.7%(+0.821)#5,099 |
| 20. | Salem | 19.0% | 12.6%(+6.43)#20 | 18.7%(+0.371)#5,189 |
| 21. | Winthrop Town | 18.2% | 12.6%(+5.61)#21 | 18.7%(-0.450)#5,381 |
| 22. | Lowell | 17.8% | 12.6%(+5.18)#22 | 18.7%(-0.878)#5,509 |
| 23. | Framingham | 17.5% | 12.6%(+4.92)#23 | 18.7%(-1.14)#5,578 |
| 24. | Ayer | 17.4% | 12.6%(+4.86)#24 | 18.7%(-1.20)#5,592 |
| 25. | Marlborough | 16.9% | 12.6%(+4.35)#25 | 18.7%(-1.72)#5,754 |
| 26. | Nantucket | 16.5% | 12.6%(+3.93)#26 | 18.7%(-2.13)#5,864 |
| 27. | Waltham | 15.3% | 12.6%(+2.72)#27 | 18.7%(-3.35)#6,255 |
| 28. | Hatfield | 14.0% | 12.6%(+1.46)#28 | 18.7%(-4.60)#6,707 |
| 29. | Leominster | 13.9% | 12.6%(+1.33)#29 | 18.7%(-4.73)#6,751 |
| 30. | North Seekonk | 13.5% | 12.6%(+0.910)#30 | 18.7%(-5.15)#6,922 |
| 31. | South Ashburnham | 13.4% | 12.6%(+0.852)#31 | 18.7%(-5.21)#6,952 |
| 32. | Devens | 12.9% | 12.6%(+0.286)#32 | 18.7%(-5.78)#7,199 |
| 33. | Milford | 12.4% | 12.6%(-0.210)#33 | 18.7%(-6.27)#7,404 |
| 34. | Fall River | 12.3% | 12.6%(-0.267)#34 | 18.7%(-6.33)#7,431 |
| 35. | Brockton | 12.3% | 12.6%(-0.288)#35 | 18.7%(-6.35)#7,438 |
| 36. | Provincetown | 12.2% | 12.6%(-0.385)#36 | 18.7%(-6.45)#7,493 |
| 37. | West Springfield Town | 11.9% | 12.6%(-0.700)#37 | 18.7%(-6.76)#7,652 |
| 38. | Randolph Town | 11.7% | 12.6%(-0.889)#38 | 18.7%(-6.95)#7,750 |
| 39. | Peabody | 11.7% | 12.6%(-0.915)#39 | 18.7%(-6.98)#7,765 |
| 40. | Petersham | 11.3% | 12.6%(-1.32)#40 | 18.7%(-7.38)#7,982 |
| 41. | Somerville | 10.9% | 12.6%(-1.71)#41 | 18.7%(-7.77)#8,193 |
| 42. | Saugus | 10.6% | 12.6%(-2.04)#42 | 18.7%(-8.10)#8,362 |
| 43. | Whitinsville | 10.5% | 12.6%(-2.10)#43 | 18.7%(-8.16)#8,407 |
| 44. | Westfield | 10.4% | 12.6%(-2.22)#44 | 18.7%(-8.29)#8,488 |
| 45. | Norton Center | 10.0% | 12.6%(-2.63)#45 | 18.7%(-8.69)#8,738 |
| 46. | South Deerfield | 9.2% | 12.6%(-3.42)#46 | 18.7%(-9.49)#9,299 |
| 47. | Russell | 9.1% | 12.6%(-3.51)#47 | 18.7%(-9.58)#9,367 |
| 48. | Malden | 9.1% | 12.6%(-3.53)#48 | 18.7%(-9.60)#9,386 |
| 49. | West Concord | 8.9% | 12.6%(-3.68)#49 | 18.7%(-9.74)#9,489 |
| 50. | Cambridge | 8.7% | 12.6%(-3.86)#50 | 18.7%(-9.92)#9,641 |
| 51. | Upton | 8.5% | 12.6%(-4.12)#51 | 18.7%(-10.2)#9,832 |
| 52. | Pittsfield | 8.4% | 12.6%(-4.15)#52 | 18.7%(-10.2)#9,856 |
| 53. | White Island Shores | 8.4% | 12.6%(-4.18)#53 | 18.7%(-10.2)#9,886 |
| 54. | Medford | 8.4% | 12.6%(-4.23)#54 | 18.7%(-10.3)#9,934 |
| 55. | Gardner | 8.3% | 12.6%(-4.24)#55 | 18.7%(-10.3)#9,945 |
| 56. | Pepperell | 8.2% | 12.6%(-4.38)#56 | 18.7%(-10.4)#10,083 |
| 57. | Andover | 8.1% | 12.6%(-4.47)#57 | 18.7%(-10.5)#10,156 |
| 58. | East Brookfield | 8.1% | 12.6%(-4.49)#58 | 18.7%(-10.5)#10,175 |
| 59. | Amherst | 8.0% | 12.6%(-4.56)#59 | 18.7%(-10.6)#10,264 |
| 60. | Shirley | 8.0% | 12.6%(-4.57)#60 | 18.7%(-10.6)#10,270 |
| 61. | Athol | 8.0% | 12.6%(-4.61)#61 | 18.7%(-10.7)#10,306 |
| 62. | Topsfield | 7.9% | 12.6%(-4.66)#62 | 18.7%(-10.7)#10,353 |
| 63. | Northampton | 7.9% | 12.6%(-4.66)#63 | 18.7%(-10.7)#10,354 |
| 64. | Easthampton Town | 7.9% | 12.6%(-4.68)#64 | 18.7%(-10.7)#10,371 |
| 65. | Norwood | 7.8% | 12.6%(-4.75)#65 | 18.7%(-10.8)#10,429 |
| 66. | Attleboro | 7.7% | 12.6%(-4.88)#66 | 18.7%(-10.9)#10,556 |
| 67. | Taunton | 7.7% | 12.6%(-4.88)#67 | 18.7%(-10.9)#10,560 |
| 68. | Dedham | 7.6% | 12.6%(-4.97)#68 | 18.7%(-11.0)#10,654 |
| 69. | Townsend | 7.5% | 12.6%(-5.07)#69 | 18.7%(-11.1)#10,761 |
| 70. | East Douglas | 7.4% | 12.6%(-5.17)#70 | 18.7%(-11.2)#10,849 |
| 71. | Westborough | 7.3% | 12.6%(-5.31)#71 | 18.7%(-11.4)#10,969 |
| 72. | Hudson | 7.2% | 12.6%(-5.42)#72 | 18.7%(-11.5)#11,069 |
| 73. | Palmer Town | 7.1% | 12.6%(-5.49)#73 | 18.7%(-11.6)#11,138 |
| 74. | South Lancaster | 7.1% | 12.6%(-5.53)#74 | 18.7%(-11.6)#11,179 |
| 75. | Barnstable Town | 6.9% | 12.6%(-5.67)#75 | 18.7%(-11.7)#11,323 |
| 76. | Holbrook | 6.9% | 12.6%(-5.67)#76 | 18.7%(-11.7)#11,335 |
| 77. | Housatonic | 6.6% | 12.6%(-5.99)#77 | 18.7%(-12.1)#11,671 |
| 78. | Brookline | 6.6% | 12.6%(-6.01)#78 | 18.7%(-12.1)#11,700 |
| 79. | Watertown Town | 6.5% | 12.6%(-6.05)#79 | 18.7%(-12.1)#11,734 |
| 80. | Hanson | 6.5% | 12.6%(-6.12)#80 | 18.7%(-12.2)#11,818 |
| 81. | Granby | 6.5% | 12.6%(-6.13)#81 | 18.7%(-12.2)#11,829 |
| 82. | Beverly | 6.5% | 12.6%(-6.13)#82 | 18.7%(-12.2)#11,830 |
| 83. | North Adams | 6.4% | 12.6%(-6.18)#83 | 18.7%(-12.2)#11,897 |
| 84. | Oxford | 6.4% | 12.6%(-6.21)#84 | 18.7%(-12.3)#11,934 |
| 85. | Foxborough | 6.3% | 12.6%(-6.25)#85 | 18.7%(-12.3)#11,976 |
| 86. | Greenfield | 6.3% | 12.6%(-6.28)#86 | 18.7%(-12.3)#12,001 |
| 87. | Plymouth | 6.3% | 12.6%(-6.29)#87 | 18.7%(-12.4)#12,009 |
| 88. | Cochituate | 6.2% | 12.6%(-6.38)#88 | 18.7%(-12.4)#12,114 |
| 89. | Winchendon | 6.2% | 12.6%(-6.43)#89 | 18.7%(-12.5)#12,179 |
| 90. | Salisbury | 6.1% | 12.6%(-6.46)#90 | 18.7%(-12.5)#12,218 |
| 91. | Woburn | 6.1% | 12.6%(-6.53)#91 | 18.7%(-12.6)#12,305 |
| 92. | Groton | 5.9% | 12.6%(-6.68)#92 | 18.7%(-12.7)#12,476 |
| 93. | Middleborough Center | 5.9% | 12.6%(-6.68)#93 | 18.7%(-12.7)#12,485 |
| 94. | Medfield | 5.9% | 12.6%(-6.69)#94 | 18.7%(-12.7)#12,486 |
| 95. | Vineyard Haven | 5.8% | 12.6%(-6.76)#95 | 18.7%(-12.8)#12,595 |
| 96. | Shelburne Falls | 5.8% | 12.6%(-6.82)#96 | 18.7%(-12.9)#12,663 |
| 97. | Great Barrington | 5.7% | 12.6%(-6.88)#97 | 18.7%(-12.9)#12,729 |
| 98. | Ware | 5.7% | 12.6%(-6.90)#98 | 18.7%(-13.0)#12,764 |
| 99. | Agawam Town | 5.7% | 12.6%(-6.92)#99 | 18.7%(-13.0)#12,804 |
| 100. | Orange | 5.5% | 12.6%(-7.07)#100 | 18.7%(-13.1)#12,973 |
Common Questions
What are the Top 10 Cities with the Highest Percentage of Hispanic or Latino Population in Massachusetts?
Top 10 Cities with the Highest Percentage of Hispanic or Latino Population in Massachusetts are:
#1
82.0%
#2
67.4%
#3
51.7%
#4
48.3%
#5
42.9%
#6
39.9%
#7
36.0%
#8
32.0%
#9
30.6%
#10
29.9%
What city has the Highest Percentage of Hispanic or Latino Population in Massachusetts?
Lawrence has the Highest Percentage of Hispanic or Latino Population in Massachusetts with 82.0%.
What is the Percentage of Hispanic or Latino Population in the State of Massachusetts?
Percentage of Hispanic or Latino Population in Massachusetts is 12.6%.
What is the Percentage of Hispanic or Latino Population in the United States?
Percentage of Hispanic or Latino Population in the United States is 18.7%.