Cities with the Highest Percentage of Hispanic or Latino Population in Iowa
RELATED REPORTS & OPTIONS
Hispanic or Latino
Iowa
Compare Cities
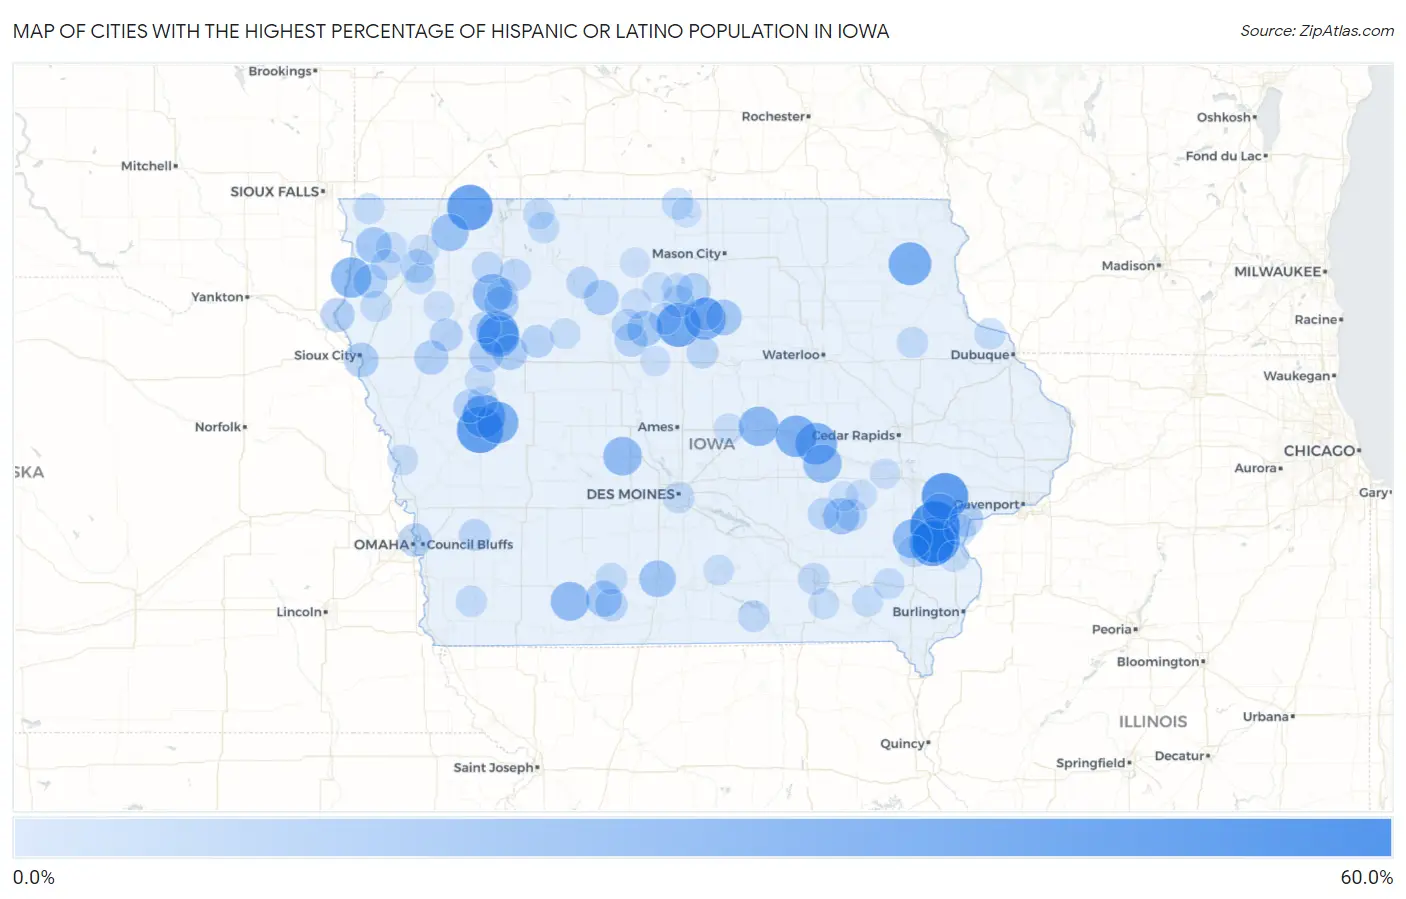
Map of Cities with the Highest Percentage of Hispanic or Latino Population in Iowa
0.0%
60.0%
Cities with the Highest Percentage of Hispanic or Latino Population in Iowa
| City | Hispanic or Latino | vs State | vs National | |
| 1. | Conesville | 58.2% | 6.5%(+51.7)#1 | 18.7%(+39.6)#1,619 |
| 2. | Fredonia | 51.3% | 6.5%(+44.8)#2 | 18.7%(+32.7)#1,892 |
| 3. | West Liberty | 50.9% | 6.5%(+44.4)#3 | 18.7%(+32.3)#1,906 |
| 4. | Denison | 49.9% | 6.5%(+43.4)#4 | 18.7%(+31.3)#1,960 |
| 5. | Harris | 48.2% | 6.5%(+41.6)#5 | 18.7%(+29.5)#2,056 |
| 6. | Columbus City | 46.7% | 6.5%(+40.2)#6 | 18.7%(+28.1)#2,125 |
| 7. | Galt | 44.0% | 6.5%(+37.5)#7 | 18.7%(+25.3)#2,271 |
| 8. | Deloit | 42.0% | 6.5%(+35.5)#8 | 18.7%(+23.4)#2,388 |
| 9. | Columbus Junction | 41.5% | 6.5%(+35.0)#9 | 18.7%(+22.8)#2,415 |
| 10. | Postville | 41.2% | 6.5%(+34.6)#10 | 18.7%(+22.5)#2,434 |
| 11. | Storm Lake | 39.5% | 6.5%(+32.9)#11 | 18.7%(+20.8)#2,542 |
| 12. | Vail | 38.9% | 6.5%(+32.3)#12 | 18.7%(+20.2)#2,576 |
| 13. | Coulter | 38.8% | 6.5%(+32.3)#13 | 18.7%(+20.2)#2,579 |
| 14. | Chelsea | 38.7% | 6.5%(+32.1)#14 | 18.7%(+20.0)#2,595 |
| 15. | Tama | 38.4% | 6.5%(+31.9)#15 | 18.7%(+19.7)#2,618 |
| 16. | Lakeside | 36.8% | 6.5%(+30.2)#16 | 18.7%(+18.1)#2,724 |
| 17. | Wever | 35.4% | 6.5%(+28.9)#17 | 18.7%(+16.7)#2,854 |
| 18. | Hawarden | 35.3% | 6.5%(+28.7)#18 | 18.7%(+16.6)#2,865 |
| 19. | Marshalltown | 33.6% | 6.5%(+27.0)#19 | 18.7%(+14.9)#3,014 |
| 20. | Linn Grove | 33.1% | 6.5%(+26.6)#20 | 18.7%(+14.4)#3,066 |
| 21. | Ainsworth | 32.4% | 6.5%(+25.9)#21 | 18.7%(+13.7)#3,130 |
| 22. | Lenox | 31.6% | 6.5%(+25.0)#22 | 18.7%(+12.9)#3,217 |
| 23. | Perry | 31.2% | 6.5%(+24.6)#23 | 18.7%(+12.5)#3,267 |
| 24. | Hartwick | 30.6% | 6.5%(+24.0)#24 | 18.7%(+11.9)#3,335 |
| 25. | Melvin | 28.0% | 6.5%(+21.4)#25 | 18.7%(+9.30)#3,636 |
| 26. | Osceola | 26.5% | 6.5%(+19.9)#26 | 18.7%(+7.80)#3,835 |
| 27. | Webster | 25.5% | 6.5%(+19.0)#27 | 18.7%(+6.87)#3,955 |
| 28. | Shannon City | 24.7% | 6.5%(+18.2)#28 | 18.7%(+6.07)#4,054 |
| 29. | Nichols | 24.4% | 6.5%(+17.9)#29 | 18.7%(+5.77)#4,112 |
| 30. | Rock Valley | 24.2% | 6.5%(+17.6)#30 | 18.7%(+5.53)#4,145 |
| 31. | Hampton | 24.1% | 6.5%(+17.5)#31 | 18.7%(+5.42)#4,171 |
| 32. | Eagle Grove | 23.9% | 6.5%(+17.4)#32 | 18.7%(+5.28)#4,199 |
| 33. | Bode | 22.1% | 6.5%(+15.5)#33 | 18.7%(+3.40)#4,531 |
| 34. | Nemaha | 21.8% | 6.5%(+15.2)#34 | 18.7%(+3.13)#4,579 |
| 35. | Sioux City | 21.4% | 6.5%(+14.8)#35 | 18.7%(+2.72)#4,665 |
| 36. | Rembrandt | 21.2% | 6.5%(+14.7)#36 | 18.7%(+2.58)#4,697 |
| 37. | Correctionville | 20.7% | 6.5%(+14.2)#37 | 18.7%(+2.09)#4,795 |
| 38. | Schaller | 20.3% | 6.5%(+13.7)#38 | 18.7%(+1.61)#4,904 |
| 39. | Westfield | 20.1% | 6.5%(+13.6)#39 | 18.7%(+1.50)#4,934 |
| 40. | Muscatine | 20.1% | 6.5%(+13.6)#40 | 18.7%(+1.45)#4,946 |
| 41. | Ireton | 19.8% | 6.5%(+13.3)#41 | 18.7%(+1.17)#5,002 |
| 42. | Meservey | 19.6% | 6.5%(+13.0)#42 | 18.7%(+0.921)#5,068 |
| 43. | Hospers | 19.4% | 6.5%(+12.9)#43 | 18.7%(+0.796)#5,107 |
| 44. | Carter Lake | 18.8% | 6.5%(+12.3)#44 | 18.7%(+0.184)#5,221 |
| 45. | Schleswig | 18.5% | 6.5%(+12.0)#45 | 18.7%(-0.110)#5,289 |
| 46. | Vincent | 18.5% | 6.5%(+11.9)#46 | 18.7%(-0.164)#5,305 |
| 47. | Fonda | 17.8% | 6.5%(+11.2)#47 | 18.7%(-0.863)#5,499 |
| 48. | Latimer | 17.7% | 6.5%(+11.2)#48 | 18.7%(-0.929)#5,525 |
| 49. | Quimby | 17.6% | 6.5%(+11.1)#49 | 18.7%(-1.02)#5,545 |
| 50. | Tingley | 17.0% | 6.5%(+10.4)#50 | 18.7%(-1.69)#5,749 |
| 51. | South English | 15.9% | 6.5%(+9.33)#51 | 18.7%(-2.78)#6,088 |
| 52. | West Bend | 15.7% | 6.5%(+9.16)#52 | 18.7%(-2.95)#6,141 |
| 53. | Alden | 15.7% | 6.5%(+9.12)#53 | 18.7%(-2.99)#6,152 |
| 54. | Oakland | 15.6% | 6.5%(+9.07)#54 | 18.7%(-3.04)#6,165 |
| 55. | Belmond | 15.6% | 6.5%(+9.06)#55 | 18.7%(-3.05)#6,171 |
| 56. | Clarion | 15.6% | 6.5%(+9.03)#56 | 18.7%(-3.07)#6,182 |
| 57. | Thor | 15.5% | 6.5%(+9.00)#57 | 18.7%(-3.11)#6,195 |
| 58. | Gillett Grove | 15.4% | 6.5%(+8.84)#58 | 18.7%(-3.27)#6,231 |
| 59. | Thornburg | 15.3% | 6.5%(+8.71)#59 | 18.7%(-3.40)#6,274 |
| 60. | Alta | 15.2% | 6.5%(+8.68)#60 | 18.7%(-3.43)#6,283 |
| 61. | Fruitland | 15.0% | 6.5%(+8.45)#61 | 18.7%(-3.66)#6,358 |
| 62. | Ottumwa | 14.9% | 6.5%(+8.36)#62 | 18.7%(-3.75)#6,392 |
| 63. | Mystic | 14.6% | 6.5%(+8.08)#63 | 18.7%(-4.02)#6,507 |
| 64. | Royal | 14.5% | 6.5%(+7.97)#64 | 18.7%(-4.14)#6,547 |
| 65. | Crawfordsville | 14.4% | 6.5%(+7.90)#65 | 18.7%(-4.21)#6,568 |
| 66. | Afton | 14.4% | 6.5%(+7.85)#66 | 18.7%(-4.26)#6,588 |
| 67. | Wallingford | 14.4% | 6.5%(+7.83)#67 | 18.7%(-4.28)#6,595 |
| 68. | Des Moines | 14.3% | 6.5%(+7.80)#68 | 18.7%(-4.31)#6,604 |
| 69. | Sioux Rapids | 14.2% | 6.5%(+7.62)#69 | 18.7%(-4.49)#6,659 |
| 70. | Scarville | 14.0% | 6.5%(+7.49)#70 | 18.7%(-4.62)#6,712 |
| 71. | Balltown | 13.8% | 6.5%(+7.25)#71 | 18.7%(-4.86)#6,794 |
| 72. | Dundee | 13.8% | 6.5%(+7.24)#72 | 18.7%(-4.87)#6,801 |
| 73. | Goodell | 13.8% | 6.5%(+7.21)#73 | 18.7%(-4.90)#6,811 |
| 74. | Imogene | 13.7% | 6.5%(+7.18)#74 | 18.7%(-4.93)#6,822 |
| 75. | Estherville | 13.7% | 6.5%(+7.16)#75 | 18.7%(-4.95)#6,829 |
| 76. | Brunsville | 13.7% | 6.5%(+7.15)#76 | 18.7%(-4.96)#6,834 |
| 77. | Birmingham | 13.6% | 6.5%(+7.03)#77 | 18.7%(-5.08)#6,883 |
| 78. | Hull | 13.5% | 6.5%(+7.00)#78 | 18.7%(-5.10)#6,900 |
| 79. | Sioux Center | 13.2% | 6.5%(+6.71)#79 | 18.7%(-5.40)#7,023 |
| 80. | Granville | 13.2% | 6.5%(+6.70)#80 | 18.7%(-5.41)#7,028 |
| 81. | Lester | 13.2% | 6.5%(+6.66)#81 | 18.7%(-5.45)#7,046 |
| 82. | Lockridge | 13.2% | 6.5%(+6.62)#82 | 18.7%(-5.49)#7,065 |
| 83. | Wapello | 13.0% | 6.5%(+6.46)#83 | 18.7%(-5.65)#7,140 |
| 84. | Floris | 12.7% | 6.5%(+6.20)#84 | 18.7%(-5.91)#7,263 |
| 85. | Kanawha | 12.7% | 6.5%(+6.18)#85 | 18.7%(-5.93)#7,272 |
| 86. | Palmer | 12.6% | 6.5%(+6.06)#86 | 18.7%(-6.05)#7,321 |
| 87. | Parnell | 12.4% | 6.5%(+5.91)#87 | 18.7%(-6.20)#7,378 |
| 88. | Sheldon | 12.4% | 6.5%(+5.86)#88 | 18.7%(-6.25)#7,391 |
| 89. | Little Sioux | 12.3% | 6.5%(+5.75)#89 | 18.7%(-6.36)#7,447 |
| 90. | Kiron | 12.3% | 6.5%(+5.73)#90 | 18.7%(-6.38)#7,456 |
| 91. | Williamson | 12.2% | 6.5%(+5.69)#91 | 18.7%(-6.42)#7,479 |
| 92. | Arthur | 12.2% | 6.5%(+5.61)#92 | 18.7%(-6.49)#7,516 |
| 93. | State Center | 12.1% | 6.5%(+5.55)#93 | 18.7%(-6.56)#7,553 |
| 94. | Cleghorn | 12.0% | 6.5%(+5.43)#94 | 18.7%(-6.68)#7,608 |
| 95. | Oxford | 11.8% | 6.5%(+5.28)#95 | 18.7%(-6.83)#7,683 |
| 96. | Renwick | 11.7% | 6.5%(+5.20)#96 | 18.7%(-6.91)#7,725 |
| 97. | Webster City | 11.4% | 6.5%(+4.87)#97 | 18.7%(-7.24)#7,898 |
| 98. | Wesley | 11.0% | 6.5%(+4.44)#98 | 18.7%(-7.67)#8,126 |
| 99. | Millersburg | 11.0% | 6.5%(+4.43)#99 | 18.7%(-7.68)#8,137 |
| 100. | Lake Mills | 10.9% | 6.5%(+4.35)#100 | 18.7%(-7.76)#8,184 |
Common Questions
What are the Top 10 Cities with the Highest Percentage of Hispanic or Latino Population in Iowa?
Top 10 Cities with the Highest Percentage of Hispanic or Latino Population in Iowa are:
#1
58.2%
#2
51.3%
#3
50.9%
#4
49.9%
#5
48.2%
#6
46.7%
#7
44.0%
#8
42.0%
#9
41.5%
#10
41.2%
What city has the Highest Percentage of Hispanic or Latino Population in Iowa?
Conesville has the Highest Percentage of Hispanic or Latino Population in Iowa with 58.2%.
What is the Percentage of Hispanic or Latino Population in the State of Iowa?
Percentage of Hispanic or Latino Population in Iowa is 6.5%.
What is the Percentage of Hispanic or Latino Population in the United States?
Percentage of Hispanic or Latino Population in the United States is 18.7%.