Cities with the Highest Percentage of Hispanic or Latino Population in Ohio
RELATED REPORTS & OPTIONS
Hispanic or Latino
Ohio
Compare Cities
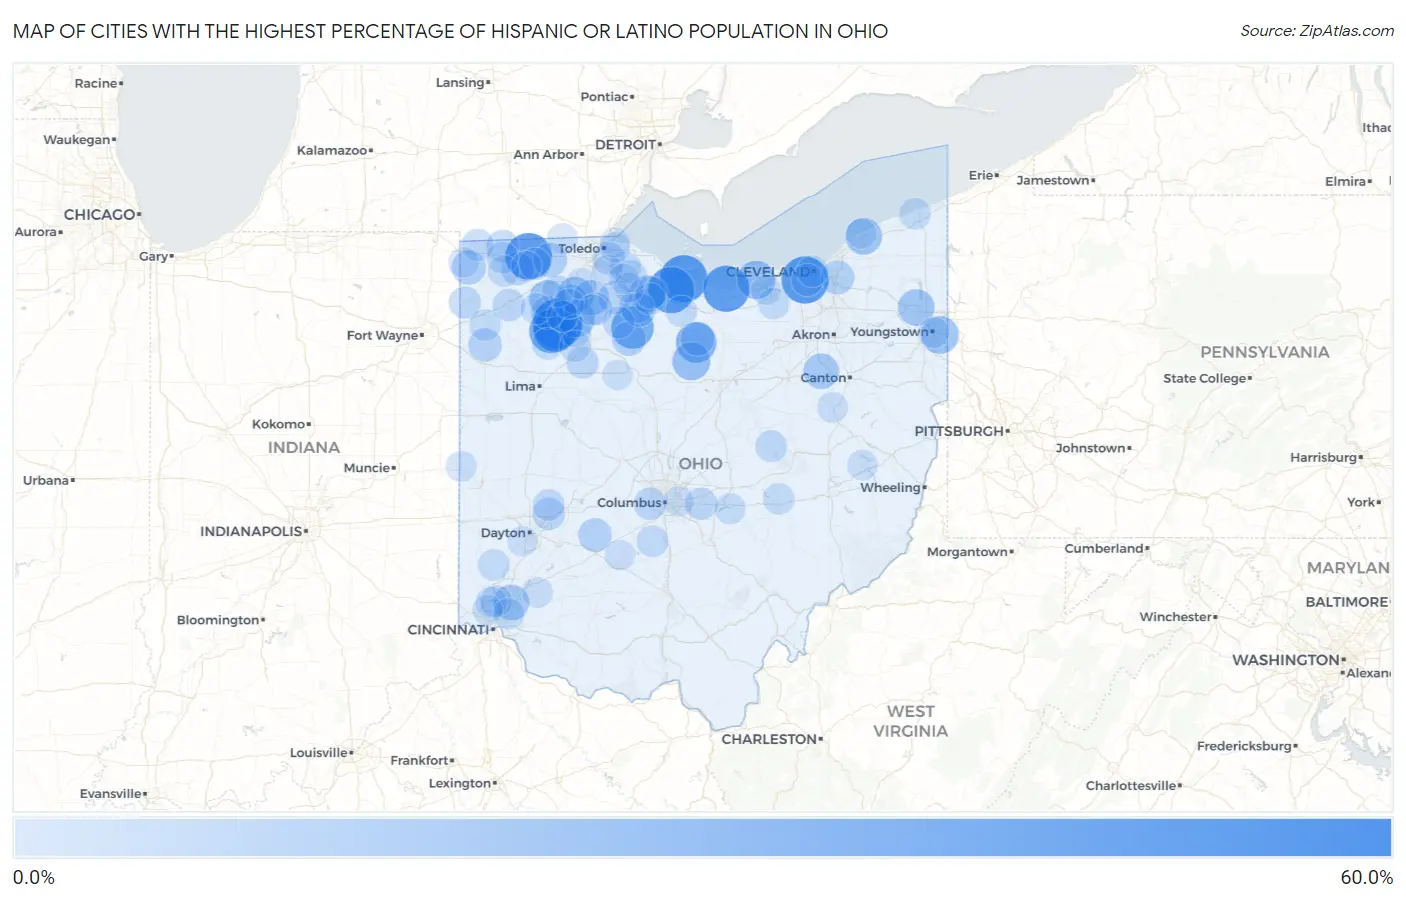
Map of Cities with the Highest Percentage of Hispanic or Latino Population in Ohio
0.0%
60.0%
Cities with the Highest Percentage of Hispanic or Latino Population in Ohio
| City | Hispanic or Latino | vs State | vs National | |
| 1. | Belmore | 54.3% | 4.2%(+50.1)#1 | 18.7%(+35.6)#1,771 |
| 2. | Crystal Rock | 49.1% | 4.2%(+44.9)#2 | 18.7%(+30.4)#2,002 |
| 3. | Linndale | 48.9% | 4.2%(+44.7)#3 | 18.7%(+30.3)#2,012 |
| 4. | Tedrow | 47.2% | 4.2%(+43.0)#4 | 18.7%(+28.5)#2,105 |
| 5. | Vickery | 46.6% | 4.2%(+42.4)#5 | 18.7%(+28.0)#2,129 |
| 6. | Mitiwanga | 46.6% | 4.2%(+42.4)#6 | 18.7%(+27.9)#2,131 |
| 7. | West Leipsic | 40.9% | 4.2%(+36.7)#7 | 18.7%(+22.2)#2,450 |
| 8. | Leipsic | 40.8% | 4.2%(+36.6)#8 | 18.7%(+22.2)#2,457 |
| 9. | New Haven Cdp Huron County | 38.1% | 4.2%(+33.9)#9 | 18.7%(+19.4)#2,642 |
| 10. | Bascom | 38.0% | 4.2%(+33.8)#10 | 18.7%(+19.3)#2,652 |
| 11. | Celeryville | 33.0% | 4.2%(+28.8)#11 | 18.7%(+14.4)#3,074 |
| 12. | Lorain | 28.2% | 4.2%(+24.0)#12 | 18.7%(+9.54)#3,607 |
| 13. | Tiro | 27.3% | 4.2%(+23.1)#13 | 18.7%(+8.62)#3,723 |
| 14. | Campbell | 26.6% | 4.2%(+22.4)#14 | 18.7%(+7.91)#3,825 |
| 15. | Hoytville | 25.5% | 4.2%(+21.3)#15 | 18.7%(+6.89)#3,953 |
| 16. | Malinta | 24.9% | 4.2%(+20.7)#16 | 18.7%(+6.27)#4,027 |
| 17. | Painesville | 24.3% | 4.2%(+20.1)#17 | 18.7%(+5.62)#4,128 |
| 18. | Morgandale | 23.9% | 4.2%(+19.7)#18 | 18.7%(+5.23)#4,210 |
| 19. | Stony Prairie | 23.5% | 4.2%(+19.3)#19 | 18.7%(+4.88)#4,262 |
| 20. | Weston | 23.2% | 4.2%(+19.0)#20 | 18.7%(+4.54)#4,332 |
| 21. | Brecon | 21.8% | 4.2%(+17.6)#21 | 18.7%(+3.17)#4,570 |
| 22. | North Lawrence | 21.8% | 4.2%(+17.6)#22 | 18.7%(+3.15)#4,574 |
| 23. | Portage | 20.7% | 4.2%(+16.5)#23 | 18.7%(+2.02)#4,810 |
| 24. | Ai | 20.4% | 4.2%(+16.2)#24 | 18.7%(+1.76)#4,867 |
| 25. | Blakeslee | 18.8% | 4.2%(+14.5)#25 | 18.7%(+0.098)#5,239 |
| 26. | Delta | 18.7% | 4.2%(+14.5)#26 | 18.7%(+0.047)#5,257 |
| 27. | New Riegel | 18.3% | 4.2%(+14.1)#27 | 18.7%(-0.359)#5,357 |
| 28. | Burgoon | 18.2% | 4.2%(+14.0)#28 | 18.7%(-0.430)#5,375 |
| 29. | Willard | 18.2% | 4.2%(+14.0)#29 | 18.7%(-0.442)#5,378 |
| 30. | Woodmere | 17.9% | 4.2%(+13.7)#30 | 18.7%(-0.789)#5,481 |
| 31. | South Solon | 17.4% | 4.2%(+13.2)#31 | 18.7%(-1.25)#5,609 |
| 32. | Haviland | 17.1% | 4.2%(+12.9)#32 | 18.7%(-1.52)#5,696 |
| 33. | Bettsville | 17.0% | 4.2%(+12.8)#33 | 18.7%(-1.62)#5,732 |
| 34. | Milton Center | 17.0% | 4.2%(+12.8)#34 | 18.7%(-1.63)#5,734 |
| 35. | Bradner | 16.4% | 4.2%(+12.2)#35 | 18.7%(-2.29)#5,923 |
| 36. | Archbold | 16.2% | 4.2%(+12.0)#36 | 18.7%(-2.43)#5,972 |
| 37. | Hamler | 15.4% | 4.2%(+11.2)#37 | 18.7%(-3.23)#6,214 |
| 38. | Defiance | 15.0% | 4.2%(+10.8)#38 | 18.7%(-3.61)#6,343 |
| 39. | Alvordton | 15.0% | 4.2%(+10.8)#39 | 18.7%(-3.65)#6,354 |
| 40. | Crystal Lakes | 14.8% | 4.2%(+10.6)#40 | 18.7%(-3.82)#6,424 |
| 41. | Walbridge | 14.8% | 4.2%(+10.6)#41 | 18.7%(-3.83)#6,429 |
| 42. | Jerry City | 14.8% | 4.2%(+10.6)#42 | 18.7%(-3.89)#6,455 |
| 43. | Lincoln Village | 14.7% | 4.2%(+10.5)#43 | 18.7%(-3.94)#6,481 |
| 44. | Fremont | 14.7% | 4.2%(+10.5)#44 | 18.7%(-3.97)#6,489 |
| 45. | Jenera | 14.1% | 4.2%(+9.94)#45 | 18.7%(-4.51)#6,667 |
| 46. | Brooklyn | 14.0% | 4.2%(+9.81)#46 | 18.7%(-4.64)#6,719 |
| 47. | Etna | 14.0% | 4.2%(+9.79)#47 | 18.7%(-4.66)#6,729 |
| 48. | Lake Seneca | 13.9% | 4.2%(+9.70)#48 | 18.7%(-4.75)#6,757 |
| 49. | Wauseon | 13.9% | 4.2%(+9.66)#49 | 18.7%(-4.79)#6,774 |
| 50. | Hicksville | 13.6% | 4.2%(+9.42)#50 | 18.7%(-5.04)#6,861 |
| 51. | Mcclure | 13.6% | 4.2%(+9.35)#51 | 18.7%(-5.10)#6,894 |
| 52. | Fostoria | 13.5% | 4.2%(+9.31)#52 | 18.7%(-5.14)#6,916 |
| 53. | Nellie | 13.5% | 4.2%(+9.27)#53 | 18.7%(-5.18)#6,939 |
| 54. | Elmore | 13.4% | 4.2%(+9.17)#54 | 18.7%(-5.29)#6,982 |
| 55. | Springdale | 13.2% | 4.2%(+8.98)#55 | 18.7%(-5.47)#7,052 |
| 56. | West Unity | 13.2% | 4.2%(+8.95)#56 | 18.7%(-5.50)#7,070 |
| 57. | Mccomb | 13.1% | 4.2%(+8.95)#57 | 18.7%(-5.51)#7,071 |
| 58. | New Carlisle | 13.1% | 4.2%(+8.87)#58 | 18.7%(-5.59)#7,100 |
| 59. | Genoa | 13.0% | 4.2%(+8.84)#59 | 18.7%(-5.61)#7,117 |
| 60. | Darbyville | 12.8% | 4.2%(+8.63)#60 | 18.7%(-5.82)#7,216 |
| 61. | Jacksonburg | 12.8% | 4.2%(+8.62)#61 | 18.7%(-5.83)#7,225 |
| 62. | Stryker | 12.8% | 4.2%(+8.55)#62 | 18.7%(-5.90)#7,257 |
| 63. | Ottawa | 12.8% | 4.2%(+8.55)#63 | 18.7%(-5.90)#7,258 |
| 64. | Ashtabula | 12.7% | 4.2%(+8.48)#64 | 18.7%(-5.97)#7,282 |
| 65. | Paulding | 12.7% | 4.2%(+8.47)#65 | 18.7%(-5.98)#7,288 |
| 66. | Ballville | 12.6% | 4.2%(+8.40)#66 | 18.7%(-6.05)#7,320 |
| 67. | Cleveland | 12.5% | 4.2%(+8.31)#67 | 18.7%(-6.14)#7,350 |
| 68. | North Zanesville | 12.4% | 4.2%(+8.18)#68 | 18.7%(-6.27)#7,403 |
| 69. | Benton Ridge | 12.3% | 4.2%(+8.09)#69 | 18.7%(-6.36)#7,445 |
| 70. | Flat Rock | 12.3% | 4.2%(+8.09)#70 | 18.7%(-6.37)#7,450 |
| 71. | Grafton | 12.2% | 4.2%(+7.96)#71 | 18.7%(-6.49)#7,514 |
| 72. | Holgate | 12.0% | 4.2%(+7.77)#72 | 18.7%(-6.68)#7,607 |
| 73. | Reno Beach | 11.9% | 4.2%(+7.67)#73 | 18.7%(-6.78)#7,658 |
| 74. | Thornport | 11.6% | 4.2%(+7.43)#74 | 18.7%(-7.02)#7,782 |
| 75. | Deshler | 11.6% | 4.2%(+7.35)#75 | 18.7%(-7.10)#7,828 |
| 76. | Forest Park | 11.5% | 4.2%(+7.31)#76 | 18.7%(-7.14)#7,846 |
| 77. | Kenwood | 11.5% | 4.2%(+7.26)#77 | 18.7%(-7.19)#7,876 |
| 78. | Tontogany | 11.3% | 4.2%(+7.11)#78 | 18.7%(-7.35)#7,957 |
| 79. | Cygnet | 11.3% | 4.2%(+7.07)#79 | 18.7%(-7.38)#7,980 |
| 80. | Youngstown | 11.2% | 4.2%(+7.01)#80 | 18.7%(-7.45)#8,012 |
| 81. | Strasburg | 11.2% | 4.2%(+6.96)#81 | 18.7%(-7.49)#8,044 |
| 82. | Union City | 11.1% | 4.2%(+6.86)#82 | 18.7%(-7.59)#8,093 |
| 83. | Metamora | 11.0% | 4.2%(+6.84)#83 | 18.7%(-7.61)#8,099 |
| 84. | Morrow | 10.8% | 4.2%(+6.62)#84 | 18.7%(-7.83)#8,220 |
| 85. | Freeport | 10.8% | 4.2%(+6.58)#85 | 18.7%(-7.88)#8,242 |
| 86. | Stony Ridge | 10.5% | 4.2%(+6.27)#86 | 18.7%(-8.18)#8,425 |
| 87. | Edon | 10.4% | 4.2%(+6.22)#87 | 18.7%(-8.23)#8,459 |
| 88. | Kirby | 10.4% | 4.2%(+6.22)#88 | 18.7%(-8.24)#8,463 |
| 89. | Bloomingburg | 10.3% | 4.2%(+6.07)#89 | 18.7%(-8.38)#8,546 |
| 90. | Pettisville | 10.2% | 4.2%(+6.03)#90 | 18.7%(-8.42)#8,568 |
| 91. | Whitehall | 10.1% | 4.2%(+5.95)#91 | 18.7%(-8.50)#8,616 |
| 92. | Moraine | 10.1% | 4.2%(+5.90)#92 | 18.7%(-8.55)#8,641 |
| 93. | Elyria | 9.9% | 4.2%(+5.74)#93 | 18.7%(-8.71)#8,759 |
| 94. | Skyline Acres | 9.9% | 4.2%(+5.72)#94 | 18.7%(-8.73)#8,767 |
| 95. | Custar | 9.9% | 4.2%(+5.72)#95 | 18.7%(-8.73)#8,770 |
| 96. | Oregon | 9.8% | 4.2%(+5.64)#96 | 18.7%(-8.82)#8,816 |
| 97. | Gibsonburg | 9.7% | 4.2%(+5.52)#97 | 18.7%(-8.93)#8,893 |
| 98. | Fairport Harbor | 9.7% | 4.2%(+5.51)#98 | 18.7%(-8.94)#8,896 |
| 99. | Harbor View | 9.7% | 4.2%(+5.48)#99 | 18.7%(-8.97)#8,922 |
| 100. | Woodville | 9.5% | 4.2%(+5.27)#100 | 18.7%(-9.19)#9,070 |
Common Questions
What are the Top 10 Cities with the Highest Percentage of Hispanic or Latino Population in Ohio?
Top 10 Cities with the Highest Percentage of Hispanic or Latino Population in Ohio are:
#1
54.3%
#2
49.1%
#3
48.9%
#4
47.2%
#5
46.6%
#6
46.6%
#7
40.9%
#8
40.8%
#9
38.0%
#10
33.0%
What city has the Highest Percentage of Hispanic or Latino Population in Ohio?
Belmore has the Highest Percentage of Hispanic or Latino Population in Ohio with 54.3%.
What is the Percentage of Hispanic or Latino Population in the State of Ohio?
Percentage of Hispanic or Latino Population in Ohio is 4.2%.
What is the Percentage of Hispanic or Latino Population in the United States?
Percentage of Hispanic or Latino Population in the United States is 18.7%.