South Bound Brook borough, NJ Map & Demographics
South Bound Brook borough Overview
$39,845
PER CAPITA INCOME
$106,122
AVG FAMILY INCOME
$92,625
AVG HOUSEHOLD INCOME
3.7%
WAGE / INCOME GAP [ % ]
96.3¢/ $1
WAGE / INCOME GAP [ $ ]
0.37
INEQUALITY / GINI INDEX
4,838
TOTAL POPULATION
2,445
MALE POPULATION
2,393
FEMALE POPULATION
102.17
MALES / 100 FEMALES
97.87
FEMALES / 100 MALES
37.7
MEDIAN AGE
3.1
AVG FAMILY SIZE
2.5
AVG HOUSEHOLD SIZE
3,018
LABOR FORCE [ PEOPLE ]
76.1%
PERCENT IN LABOR FORCE
7.3%
UNEMPLOYMENT RATE
Income in South Bound Brook borough
Income Overview in South Bound Brook borough
Per Capita Income in South Bound Brook borough is $39,845, while median incomes of families and households are $106,122 and $92,625 respectively.
| Characteristic | Number | Measure |
| Per Capita Income | 4,838 | $39,845 |
| Median Family Income | 1,301 | $106,122 |
| Mean Family Income | 1,301 | $110,699 |
| Median Household Income | 1,951 | $92,625 |
| Mean Household Income | 1,951 | $99,347 |
| Income Deficit | 1,301 | $0 |
| Wage / Income Gap (%) | 4,838 | 3.73% |
| Wage / Income Gap ($) | 4,838 | 96.27¢ per $1 |
| Gini / Inequality Index | 4,838 | 0.37 |
Earnings by Sex in South Bound Brook borough
Average Earnings in South Bound Brook borough are $47,951, $47,415 for men and $49,250 for women, a difference of 3.7%.
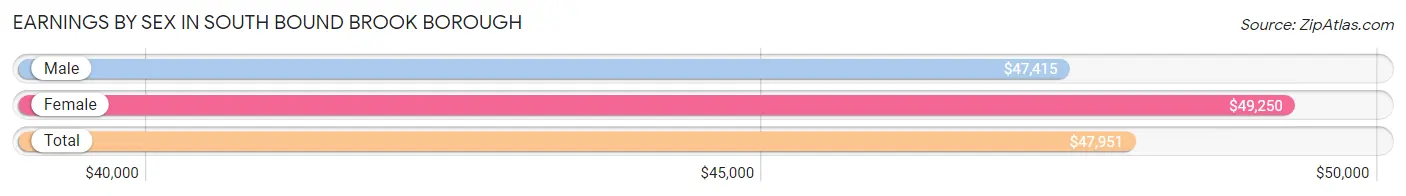
| Sex | Number | Average Earnings |
| Male | 1,708 (56.2%) | $47,415 |
| Female | 1,331 (43.8%) | $49,250 |
| Total | 3,039 (100.0%) | $47,951 |
Earnings by Sex by Income Bracket in South Bound Brook borough
The most common earnings brackets in South Bound Brook borough are $75,000 to $99,999 for men (266 | 15.6%) and $55,000 to $64,999 for women (229 | 17.2%).
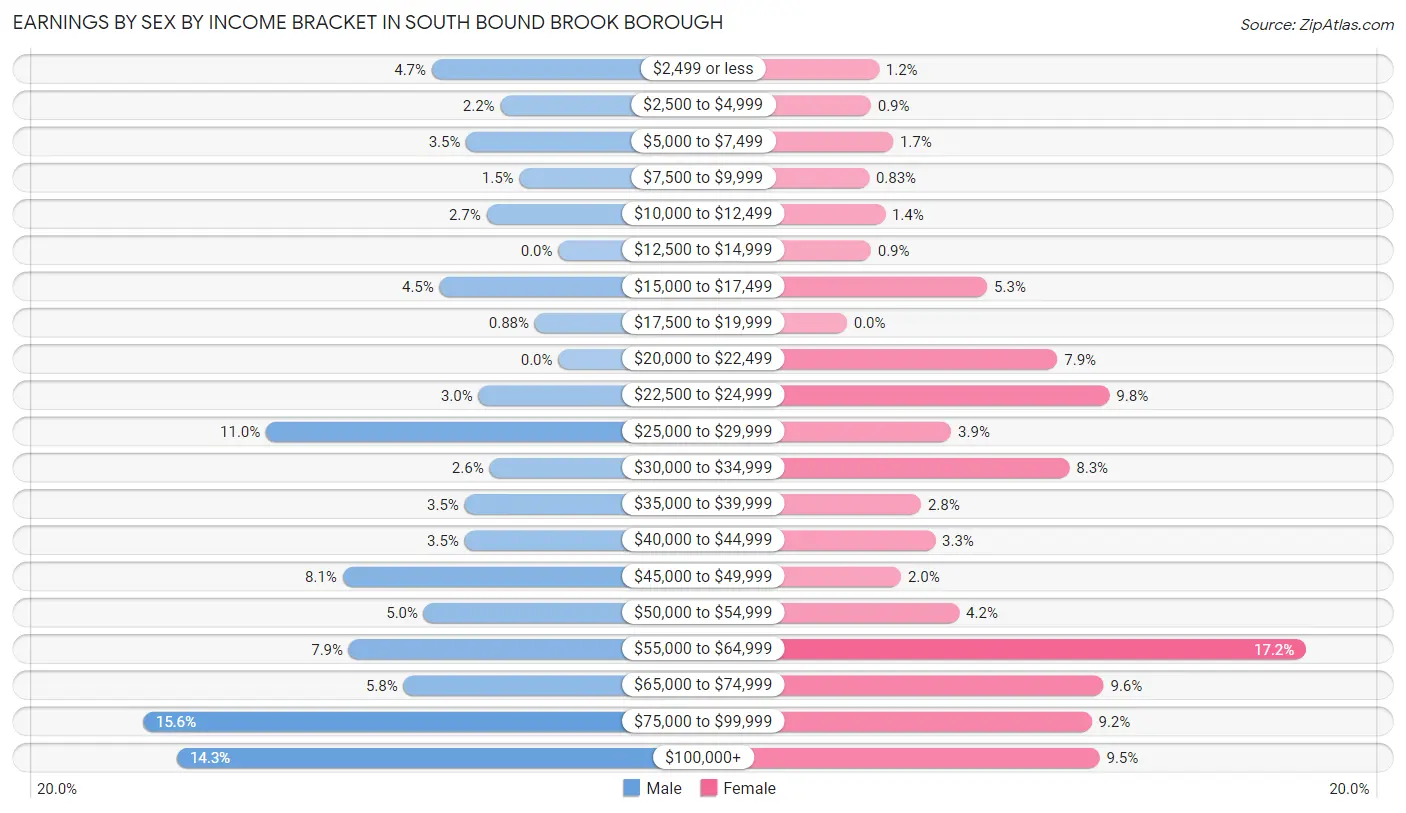
| Income | Male | Female |
| $2,499 or less | 81 (4.7%) | 16 (1.2%) |
| $2,500 to $4,999 | 37 (2.2%) | 12 (0.9%) |
| $5,000 to $7,499 | 59 (3.5%) | 23 (1.7%) |
| $7,500 to $9,999 | 25 (1.5%) | 11 (0.8%) |
| $10,000 to $12,499 | 46 (2.7%) | 19 (1.4%) |
| $12,500 to $14,999 | 0 (0.0%) | 12 (0.9%) |
| $15,000 to $17,499 | 76 (4.4%) | 70 (5.3%) |
| $17,500 to $19,999 | 15 (0.9%) | 0 (0.0%) |
| $20,000 to $22,499 | 0 (0.0%) | 105 (7.9%) |
| $22,500 to $24,999 | 51 (3.0%) | 131 (9.8%) |
| $25,000 to $29,999 | 187 (11.0%) | 52 (3.9%) |
| $30,000 to $34,999 | 44 (2.6%) | 111 (8.3%) |
| $35,000 to $39,999 | 60 (3.5%) | 37 (2.8%) |
| $40,000 to $44,999 | 60 (3.5%) | 44 (3.3%) |
| $45,000 to $49,999 | 138 (8.1%) | 27 (2.0%) |
| $50,000 to $54,999 | 86 (5.0%) | 56 (4.2%) |
| $55,000 to $64,999 | 134 (7.9%) | 229 (17.2%) |
| $65,000 to $74,999 | 99 (5.8%) | 128 (9.6%) |
| $75,000 to $99,999 | 266 (15.6%) | 122 (9.2%) |
| $100,000+ | 244 (14.3%) | 126 (9.5%) |
| Total | 1,708 (100.0%) | 1,331 (100.0%) |
Earnings by Sex by Educational Attainment in South Bound Brook borough
Average earnings in South Bound Brook borough are $56,813 for men and $52,781 for women, a difference of 7.1%. Men with an educational attainment of graduate degree enjoy the highest average annual earnings of $94,700, while those with high school diploma education earn the least with $36,992. Women with an educational attainment of bachelor's degree earn the most with the average annual earnings of $60,679, while those with high school diploma education have the smallest earnings of $39,531.
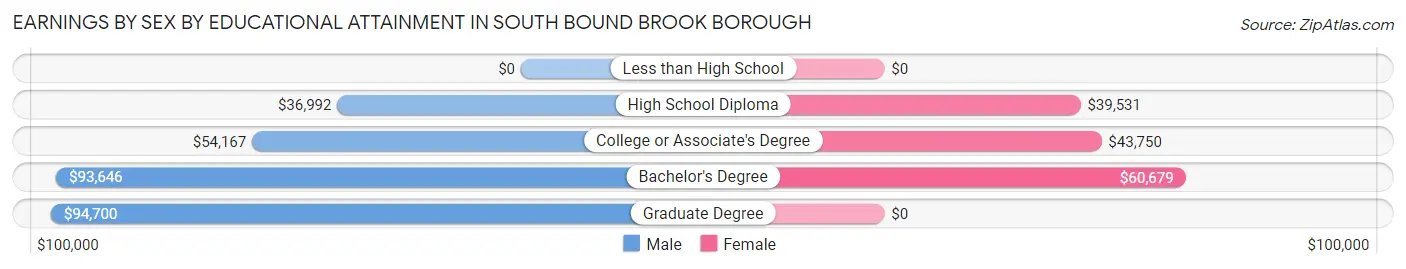
| Educational Attainment | Male Income | Female Income |
| Less than High School | - | - |
| High School Diploma | $36,992 | $39,531 |
| College or Associate's Degree | $54,167 | $43,750 |
| Bachelor's Degree | $93,646 | $60,679 |
| Graduate Degree | $94,700 | $0 |
| Total | $56,813 | $52,781 |
Family Income in South Bound Brook borough
Family Income Brackets in South Bound Brook borough
According to the South Bound Brook borough family income data, there are 471 families falling into the $100,000 to $149,999 income range, which is the most common income bracket and makes up 36.2% of all families. Conversely, the $10,000 to $14,999 income bracket is the least frequent group with only 9 families (0.7%) belonging to this category.
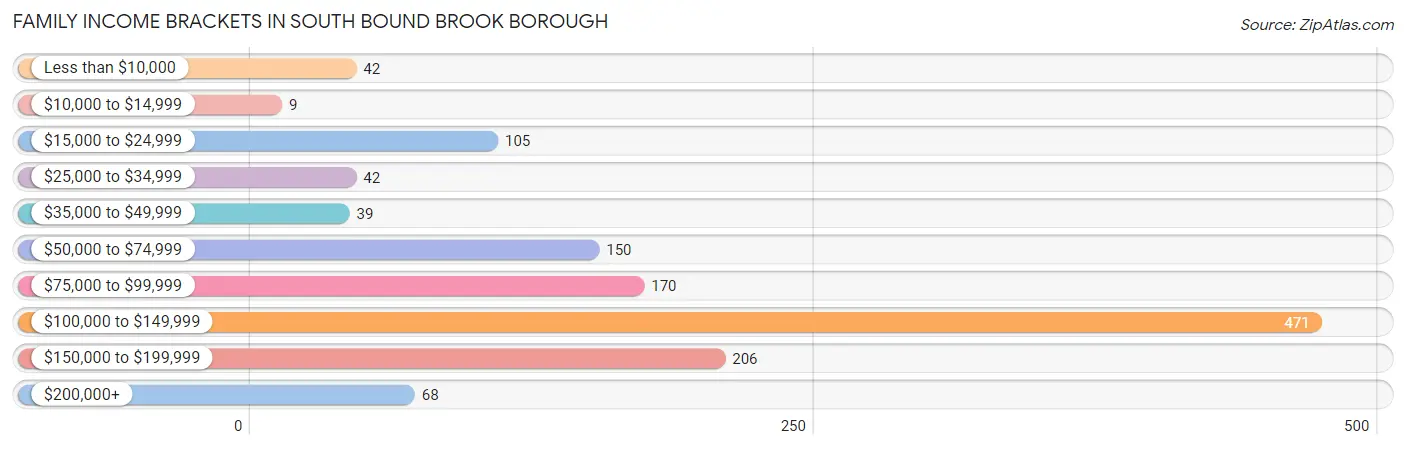
| Income Bracket | # Families | % Families |
| Less than $10,000 | 42 | 3.2% |
| $10,000 to $14,999 | 9 | 0.7% |
| $15,000 to $24,999 | 105 | 8.1% |
| $25,000 to $34,999 | 42 | 3.2% |
| $35,000 to $49,999 | 39 | 3.0% |
| $50,000 to $74,999 | 150 | 11.5% |
| $75,000 to $99,999 | 170 | 13.1% |
| $100,000 to $149,999 | 471 | 36.2% |
| $150,000 to $199,999 | 206 | 15.8% |
| $200,000+ | 68 | 5.2% |
Family Income by Famaliy Size in South Bound Brook borough
3-person families (370 | 28.4%) account for the highest median family income in South Bound Brook borough with $111,800 per family, while 2-person families (592 | 45.5%) have the highest median income of $53,201 per family member.
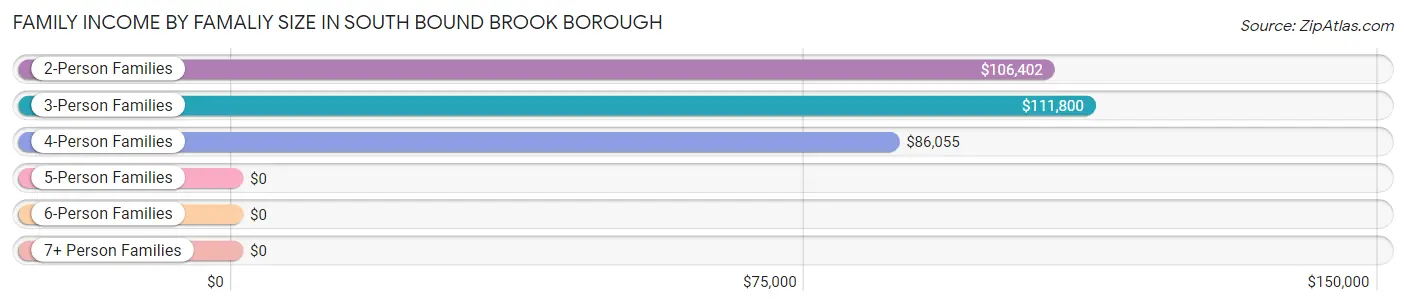
| Income Bracket | # Families | Median Income |
| 2-Person Families | 592 (45.5%) | $106,402 |
| 3-Person Families | 370 (28.4%) | $111,800 |
| 4-Person Families | 181 (13.9%) | $86,055 |
| 5-Person Families | 122 (9.4%) | $0 |
| 6-Person Families | 19 (1.5%) | $0 |
| 7+ Person Families | 17 (1.3%) | $0 |
| Total | 1,301 (100.0%) | $106,122 |
Family Income by Number of Earners in South Bound Brook borough
The median family income in South Bound Brook borough is $106,122, with families comprising 3+ earners (165) having the highest median family income of $171,544, while families with 1 earner (363) have the lowest median family income of $54,141, accounting for 12.7% and 27.9% of families, respectively.
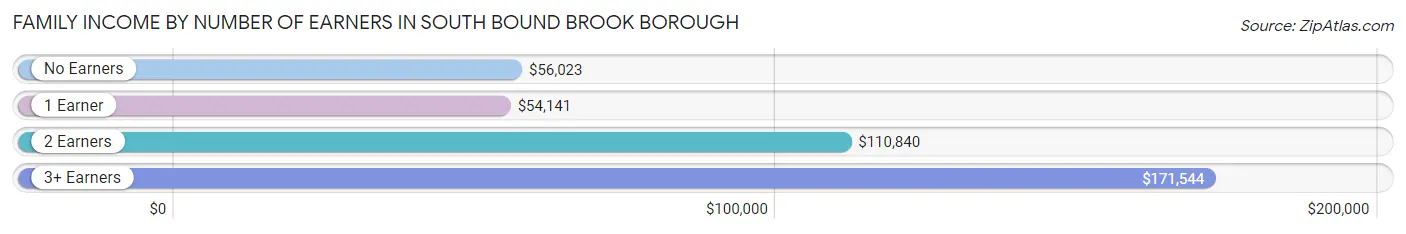
| Number of Earners | # Families | Median Income |
| No Earners | 76 (5.8%) | $56,023 |
| 1 Earner | 363 (27.9%) | $54,141 |
| 2 Earners | 697 (53.6%) | $110,840 |
| 3+ Earners | 165 (12.7%) | $171,544 |
| Total | 1,301 (100.0%) | $106,122 |
Household Income in South Bound Brook borough
Household Income Brackets in South Bound Brook borough
With 548 households falling in the category, the $100,000 to $149,999 income range is the most frequent in South Bound Brook borough, accounting for 28.1% of all households.
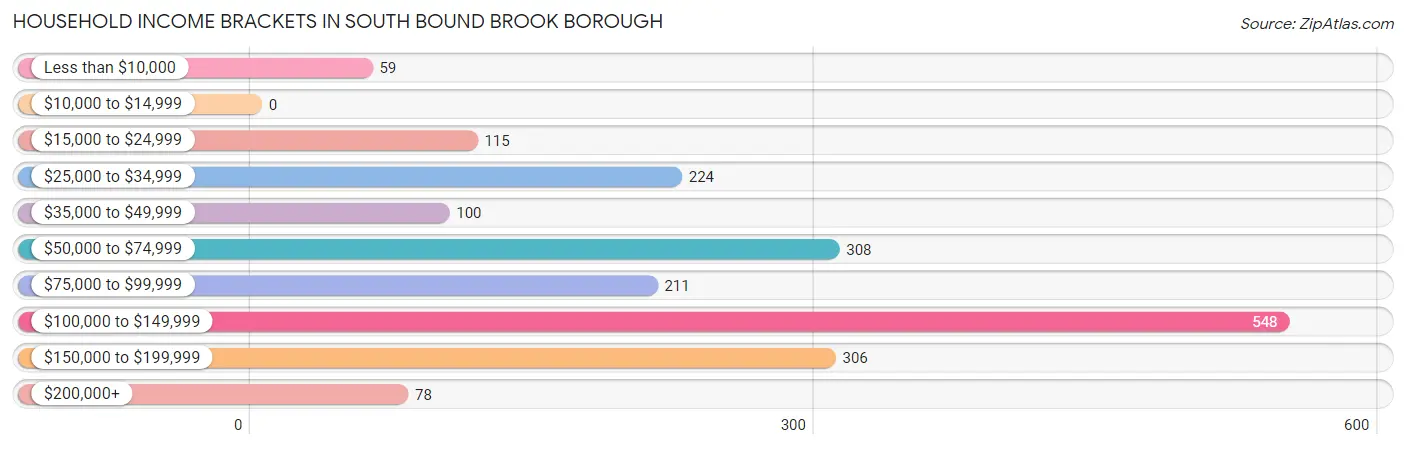
| Income Bracket | # Households | % Households |
| Less than $10,000 | 59 | 3.0% |
| $10,000 to $14,999 | 0 | 0.0% |
| $15,000 to $24,999 | 115 | 5.9% |
| $25,000 to $34,999 | 224 | 11.5% |
| $35,000 to $49,999 | 100 | 5.1% |
| $50,000 to $74,999 | 308 | 15.8% |
| $75,000 to $99,999 | 211 | 10.8% |
| $100,000 to $149,999 | 548 | 28.1% |
| $150,000 to $199,999 | 306 | 15.7% |
| $200,000+ | 78 | 4.0% |
Household Income by Householder Age in South Bound Brook borough
The median household income in South Bound Brook borough is $92,625, with the highest median household income of $106,101 found in the 65+ years age bracket for the primary householder. A total of 409 households (21.0%) fall into this category.
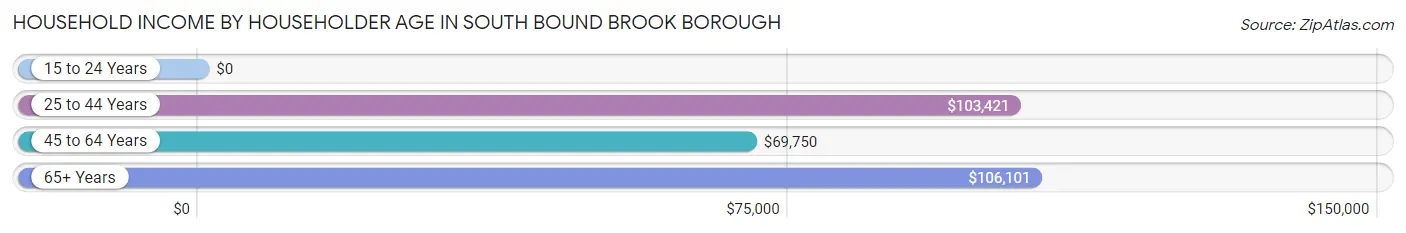
| Income Bracket | # Households | Median Income |
| 15 to 24 Years | 0 (0.0%) | $0 |
| 25 to 44 Years | 666 (34.1%) | $103,421 |
| 45 to 64 Years | 876 (44.9%) | $69,750 |
| 65+ Years | 409 (21.0%) | $106,101 |
| Total | 1,951 (100.0%) | $92,625 |
Poverty in South Bound Brook borough
Income Below Poverty by Sex and Age in South Bound Brook borough
With 4.3% poverty level for males and 11.6% for females among the residents of South Bound Brook borough, 15 year old males and 18 to 24 year old females are the most vulnerable to poverty, with 9 males (23.1%) and 80 females (60.2%) in their respective age groups living below the poverty level.
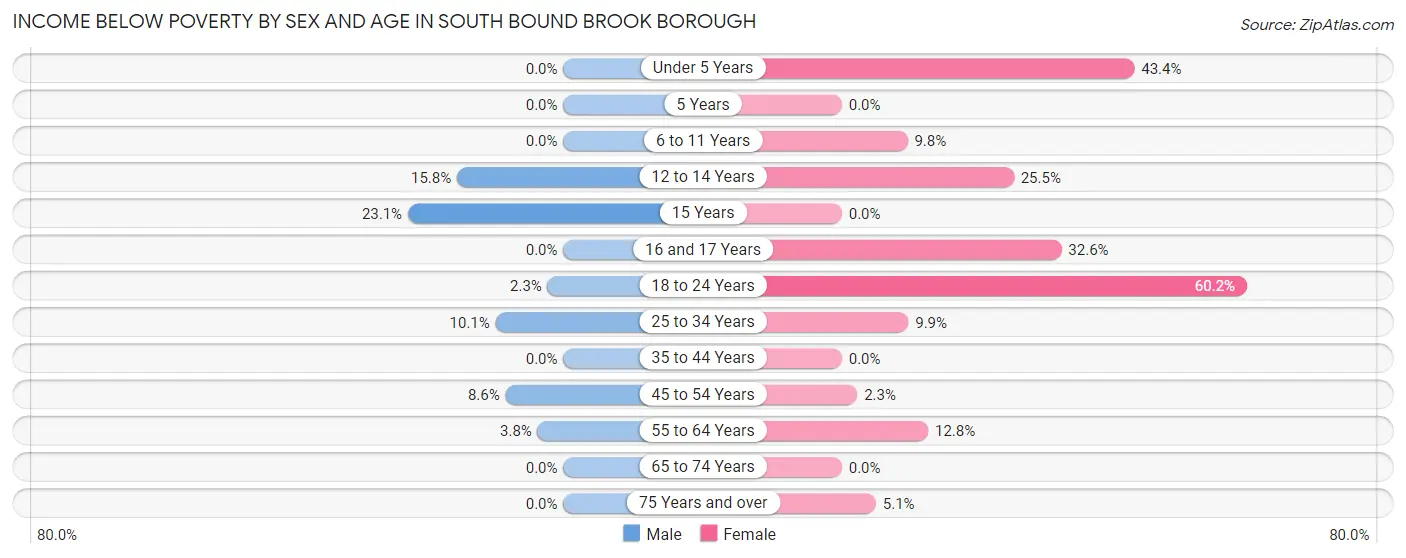
| Age Bracket | Male | Female |
| Under 5 Years | 0 (0.0%) | 43 (43.4%) |
| 5 Years | 0 (0.0%) | 0 (0.0%) |
| 6 to 11 Years | 0 (0.0%) | 23 (9.8%) |
| 12 to 14 Years | 15 (15.8%) | 24 (25.5%) |
| 15 Years | 9 (23.1%) | 0 (0.0%) |
| 16 and 17 Years | 0 (0.0%) | 15 (32.6%) |
| 18 to 24 Years | 7 (2.3%) | 80 (60.2%) |
| 25 to 34 Years | 35 (10.1%) | 39 (9.9%) |
| 35 to 44 Years | 0 (0.0%) | 0 (0.0%) |
| 45 to 54 Years | 26 (8.6%) | 10 (2.3%) |
| 55 to 64 Years | 12 (3.8%) | 36 (12.8%) |
| 65 to 74 Years | 0 (0.0%) | 0 (0.0%) |
| 75 Years and over | 0 (0.0%) | 8 (5.1%) |
| Total | 104 (4.3%) | 278 (11.6%) |
Income Above Poverty by Sex and Age in South Bound Brook borough
According to the poverty statistics in South Bound Brook borough, males aged under 5 years and females aged 5 years are the age groups that are most secure financially, with 100.0% of males and 100.0% of females in these age groups living above the poverty line.
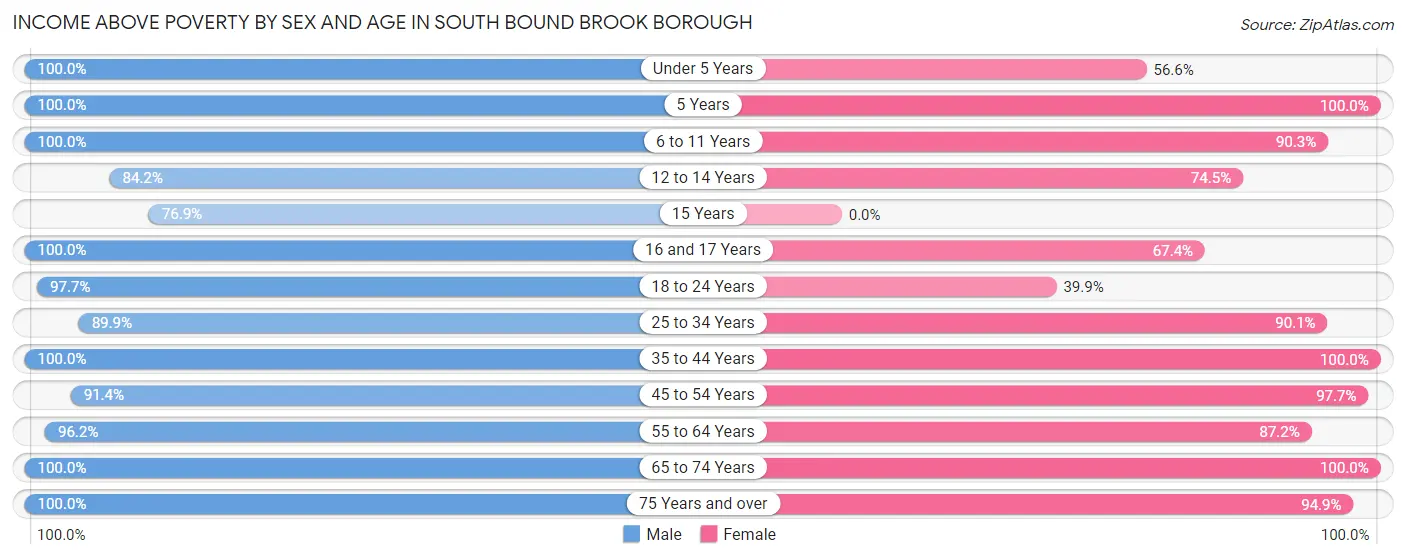
| Age Bracket | Male | Female |
| Under 5 Years | 113 (100.0%) | 56 (56.6%) |
| 5 Years | 21 (100.0%) | 12 (100.0%) |
| 6 to 11 Years | 163 (100.0%) | 213 (90.2%) |
| 12 to 14 Years | 80 (84.2%) | 70 (74.5%) |
| 15 Years | 30 (76.9%) | 0 (0.0%) |
| 16 and 17 Years | 61 (100.0%) | 31 (67.4%) |
| 18 to 24 Years | 293 (97.7%) | 53 (39.9%) |
| 25 to 34 Years | 313 (89.9%) | 356 (90.1%) |
| 35 to 44 Years | 429 (100.0%) | 351 (100.0%) |
| 45 to 54 Years | 277 (91.4%) | 427 (97.7%) |
| 55 to 64 Years | 303 (96.2%) | 245 (87.2%) |
| 65 to 74 Years | 138 (100.0%) | 151 (100.0%) |
| 75 Years and over | 120 (100.0%) | 150 (94.9%) |
| Total | 2,341 (95.8%) | 2,115 (88.4%) |
Income Below Poverty Among Married-Couple Families in South Bound Brook borough
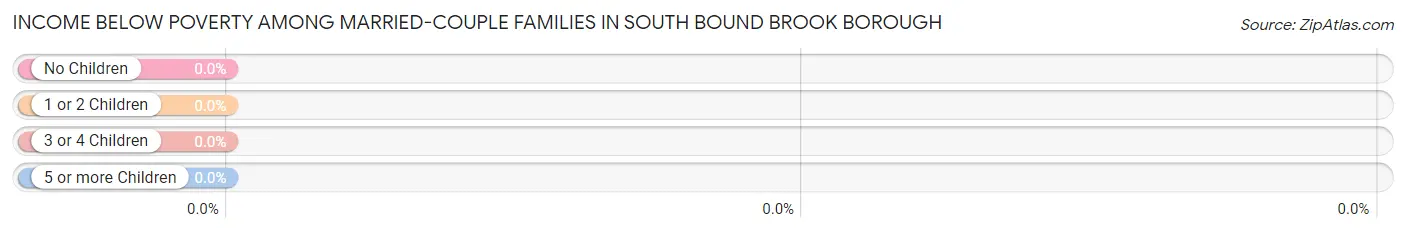
| Children | Above Poverty | Below Poverty |
| No Children | 492 (100.0%) | 0 (0.0%) |
| 1 or 2 Children | 283 (100.0%) | 0 (0.0%) |
| 3 or 4 Children | 55 (100.0%) | 0 (0.0%) |
| 5 or more Children | 0 (0.0%) | 0 (0.0%) |
| Total | 830 (100.0%) | 0 (0.0%) |
Income Below Poverty Among Single-Parent Households in South Bound Brook borough
According to the poverty data in South Bound Brook borough, 11.3% or 9 single-father households and 16.9% or 66 single-mother households are living below the poverty line. Among single-father households, those with 1 or 2 children have the highest poverty rate, with 9 households (23.7%) experiencing poverty. Likewise, among single-mother households, those with 3 or 4 children have the highest poverty rate, with 25 households (75.8%) falling below the poverty line.
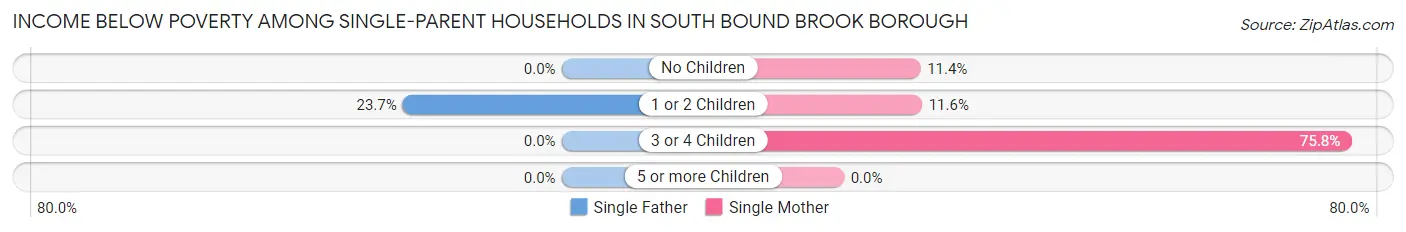
| Children | Single Father | Single Mother |
| No Children | 0 (0.0%) | 31 (11.4%) |
| 1 or 2 Children | 9 (23.7%) | 10 (11.6%) |
| 3 or 4 Children | 0 (0.0%) | 25 (75.8%) |
| 5 or more Children | 0 (0.0%) | 0 (0.0%) |
| Total | 9 (11.3%) | 66 (16.9%) |
Income Below Poverty Among Married-Couple vs Single-Parent Households in South Bound Brook borough
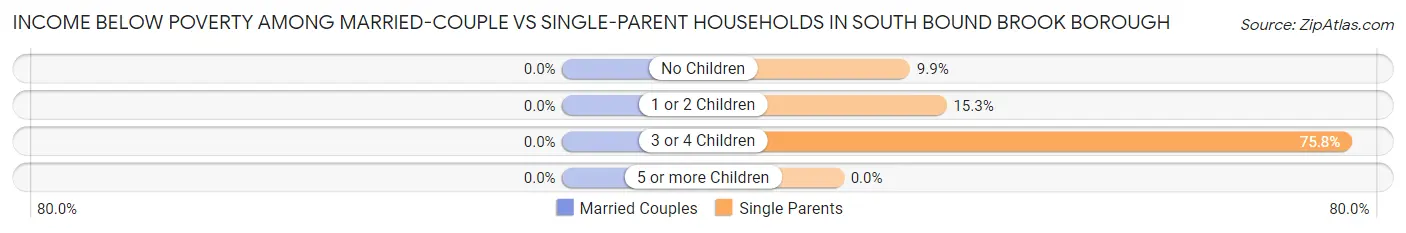
| Children | Married-Couple Families | Single-Parent Households |
| No Children | 0 (0.0%) | 31 (9.9%) |
| 1 or 2 Children | 0 (0.0%) | 19 (15.3%) |
| 3 or 4 Children | 0 (0.0%) | 25 (75.8%) |
| 5 or more Children | 0 (0.0%) | 0 (0.0%) |
| Total | 0 (0.0%) | 75 (15.9%) |
Race in South Bound Brook borough
The most populous races in South Bound Brook borough are White / Caucasian (2,384 | 49.3%), Hispanic or Latino (1,656 | 34.2%), and Two or more Races (834 | 17.2%).
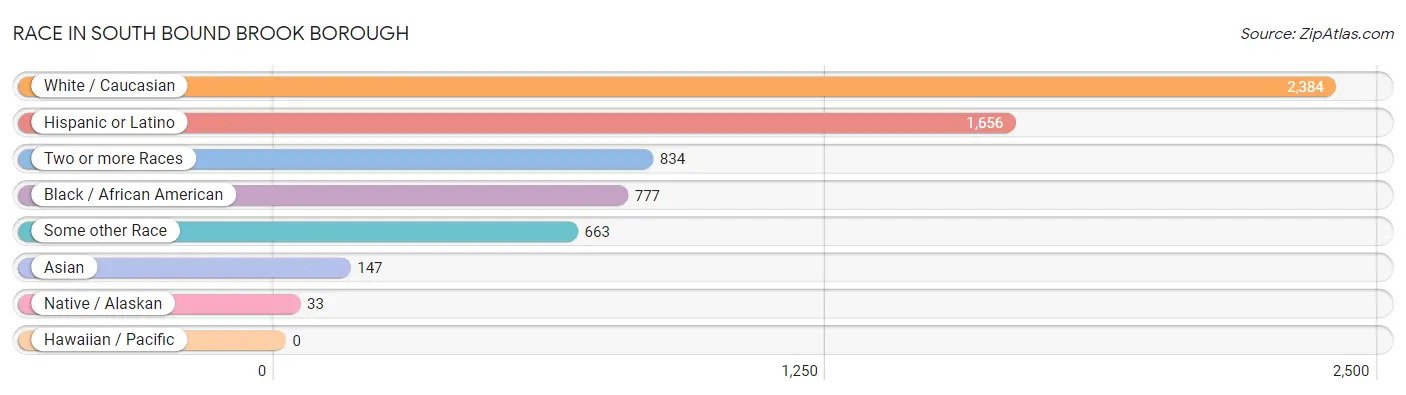
| Race | # Population | % Population |
| Asian | 147 | 3.0% |
| Black / African American | 777 | 16.1% |
| Hawaiian / Pacific | 0 | 0.0% |
| Hispanic or Latino | 1,656 | 34.2% |
| Native / Alaskan | 33 | 0.7% |
| White / Caucasian | 2,384 | 49.3% |
| Two or more Races | 834 | 17.2% |
| Some other Race | 663 | 13.7% |
| Total | 4,838 | 100.0% |
Ancestry in South Bound Brook borough
The most populous ancestries reported in South Bound Brook borough are Mexican (580 | 12.0%), Irish (478 | 9.9%), Central American (427 | 8.8%), Italian (359 | 7.4%), and Costa Rican (320 | 6.6%), together accounting for 44.7% of all South Bound Brook borough residents.
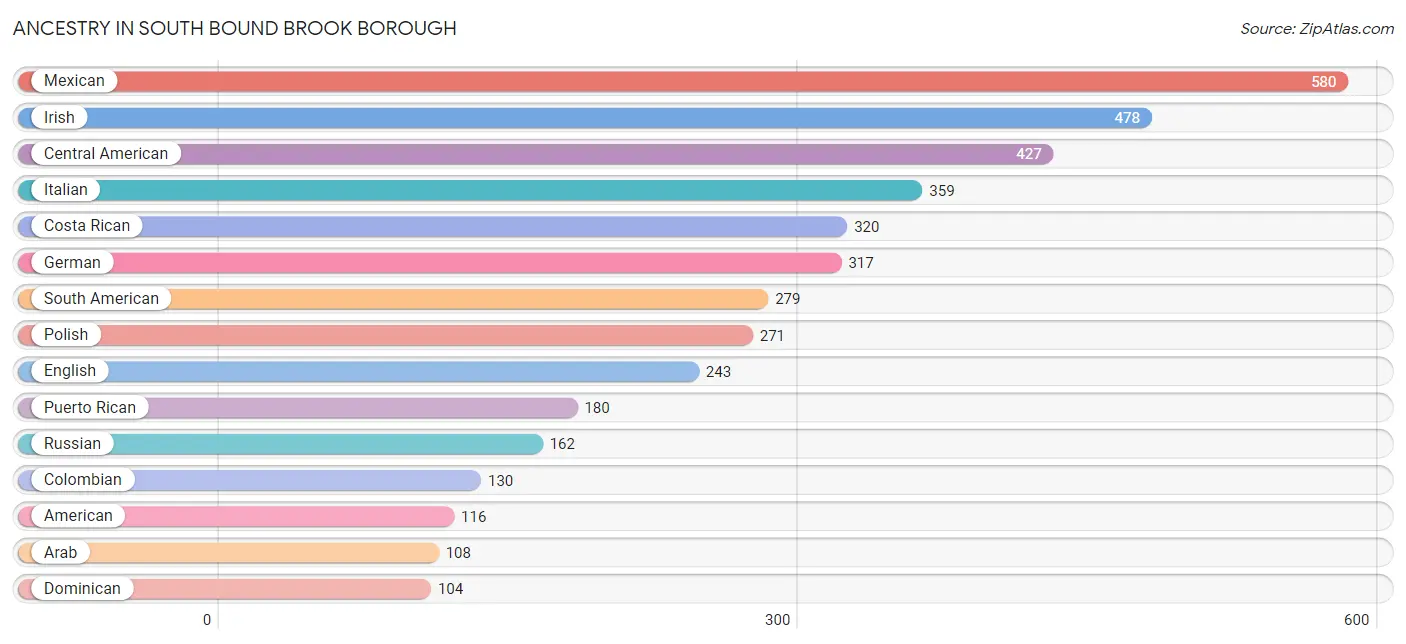
| Ancestry | # Population | % Population |
| African | 52 | 1.1% |
| Albanian | 10 | 0.2% |
| American | 116 | 2.4% |
| Arab | 108 | 2.2% |
| British | 36 | 0.7% |
| Burmese | 19 | 0.4% |
| Central American | 427 | 8.8% |
| Chilean | 10 | 0.2% |
| Colombian | 130 | 2.7% |
| Costa Rican | 320 | 6.6% |
| Cuban | 80 | 1.7% |
| Czech | 13 | 0.3% |
| Czechoslovakian | 11 | 0.2% |
| Danish | 12 | 0.3% |
| Dominican | 104 | 2.1% |
| Dutch | 53 | 1.1% |
| Eastern European | 21 | 0.4% |
| Ecuadorian | 88 | 1.8% |
| Egyptian | 27 | 0.6% |
| English | 243 | 5.0% |
| European | 58 | 1.2% |
| French | 56 | 1.2% |
| French Canadian | 24 | 0.5% |
| German | 317 | 6.6% |
| Greek | 33 | 0.7% |
| Guatemalan | 68 | 1.4% |
| Guyanese | 82 | 1.7% |
| Hungarian | 61 | 1.3% |
| Indian (Asian) | 51 | 1.1% |
| Irish | 478 | 9.9% |
| Italian | 359 | 7.4% |
| Jamaican | 52 | 1.1% |
| Korean | 12 | 0.3% |
| Lithuanian | 20 | 0.4% |
| Mexican | 580 | 12.0% |
| Northern European | 9 | 0.2% |
| Norwegian | 12 | 0.3% |
| Palestinian | 39 | 0.8% |
| Paraguayan | 27 | 0.6% |
| Peruvian | 24 | 0.5% |
| Polish | 271 | 5.6% |
| Portuguese | 34 | 0.7% |
| Puerto Rican | 180 | 3.7% |
| Russian | 162 | 3.4% |
| Salvadoran | 39 | 0.8% |
| Scandinavian | 43 | 0.9% |
| Scottish | 12 | 0.3% |
| Slovak | 17 | 0.4% |
| South American | 279 | 5.8% |
| South American Indian | 60 | 1.2% |
| Sri Lankan | 57 | 1.2% |
| Subsaharan African | 90 | 1.9% |
| Swedish | 10 | 0.2% |
| Syrian | 42 | 0.9% |
| Thai | 60 | 1.2% |
| Turkish | 20 | 0.4% |
| Ukrainian | 26 | 0.5% |
| Vietnamese | 18 | 0.4% |
| Welsh | 47 | 1.0% | View All 59 Rows |
Immigrants in South Bound Brook borough
The most numerous immigrant groups reported in South Bound Brook borough came from Latin America (853 | 17.6%), Central America (433 | 8.9%), South America (301 | 6.2%), Mexico (213 | 4.4%), and Asia (130 | 2.7%), together accounting for 39.9% of all South Bound Brook borough residents.
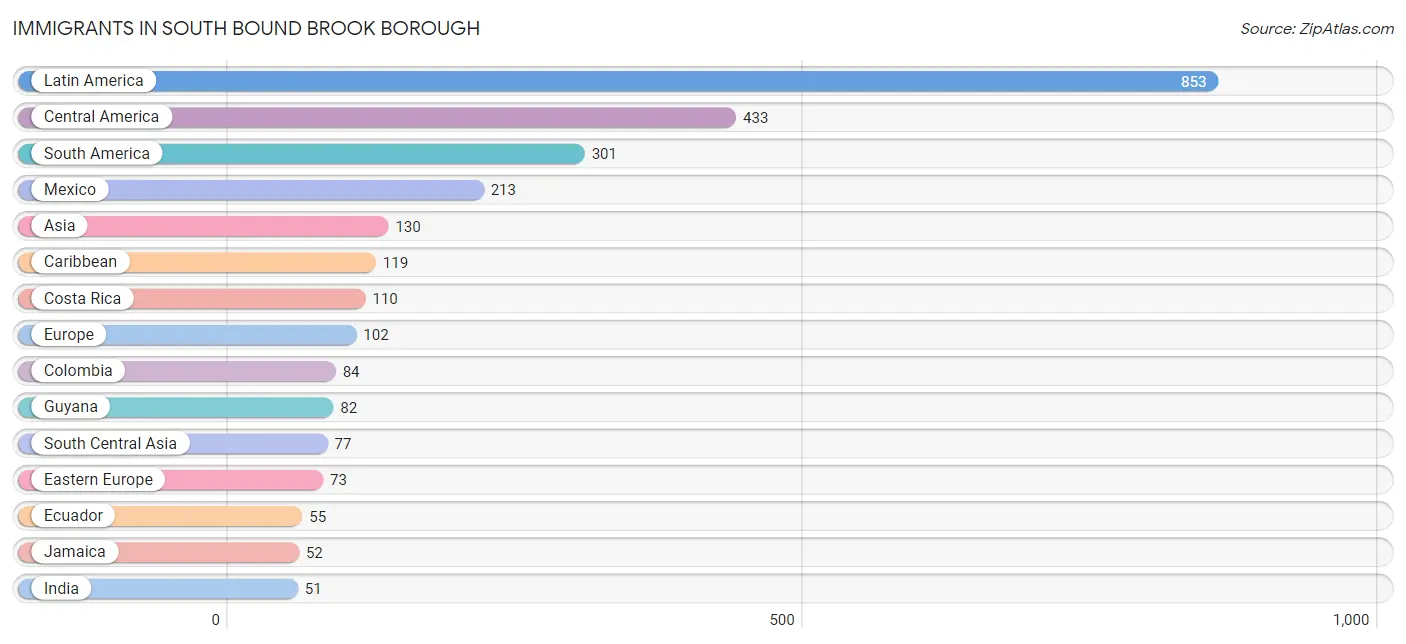
| Immigration Origin | # Population | % Population |
| Africa | 28 | 0.6% |
| Argentina | 10 | 0.2% |
| Asia | 130 | 2.7% |
| Bangladesh | 12 | 0.3% |
| Belarus | 12 | 0.3% |
| Cameroon | 13 | 0.3% |
| Caribbean | 119 | 2.5% |
| Central America | 433 | 8.9% |
| Chile | 50 | 1.0% |
| China | 6 | 0.1% |
| Colombia | 84 | 1.7% |
| Costa Rica | 110 | 2.3% |
| Cuba | 16 | 0.3% |
| Dominican Republic | 40 | 0.8% |
| Eastern Asia | 6 | 0.1% |
| Eastern Europe | 73 | 1.5% |
| Ecuador | 55 | 1.1% |
| Egypt | 15 | 0.3% |
| El Salvador | 45 | 0.9% |
| England | 11 | 0.2% |
| Europe | 102 | 2.1% |
| Guatemala | 23 | 0.5% |
| Guyana | 82 | 1.7% |
| Hong Kong | 4 | 0.1% |
| India | 51 | 1.1% |
| Italy | 11 | 0.2% |
| Jamaica | 52 | 1.1% |
| Latin America | 853 | 17.6% |
| Mexico | 213 | 4.4% |
| Middle Africa | 13 | 0.3% |
| Nicaragua | 42 | 0.9% |
| Northern Africa | 15 | 0.3% |
| Northern Europe | 11 | 0.2% |
| Pakistan | 14 | 0.3% |
| Peru | 7 | 0.1% |
| Philippines | 12 | 0.3% |
| Poland | 42 | 0.9% |
| Portugal | 7 | 0.1% |
| South America | 301 | 6.2% |
| South Central Asia | 77 | 1.6% |
| South Eastern Asia | 27 | 0.6% |
| Southern Europe | 18 | 0.4% |
| Turkey | 20 | 0.4% |
| Ukraine | 19 | 0.4% |
| Vietnam | 15 | 0.3% |
| Western Asia | 20 | 0.4% | View All 46 Rows |
Sex and Age in South Bound Brook borough
Sex and Age in South Bound Brook borough
The most populous age groups in South Bound Brook borough are 55 to 59 Years (258 | 10.5%) for men and 45 to 49 Years (236 | 9.9%) for women.
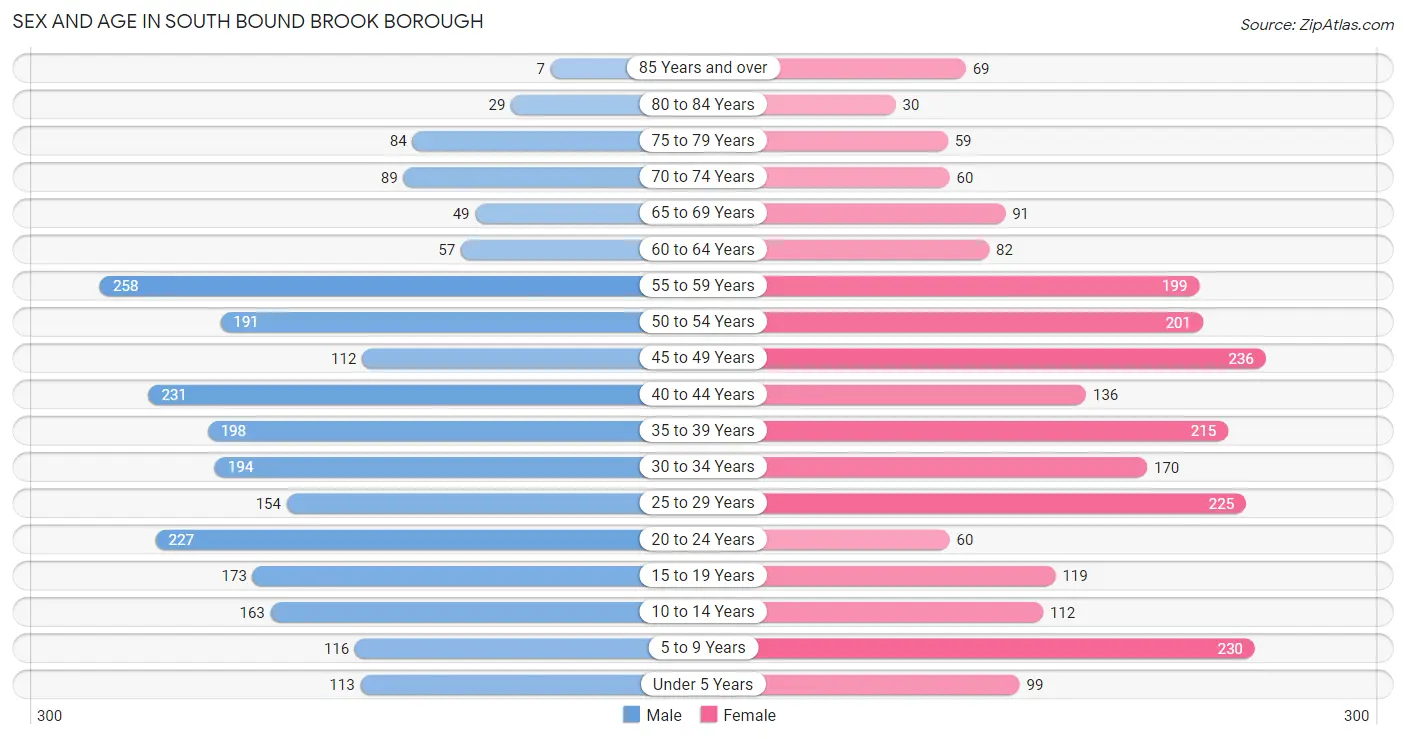
| Age Bracket | Male | Female |
| Under 5 Years | 113 (4.6%) | 99 (4.1%) |
| 5 to 9 Years | 116 (4.7%) | 230 (9.6%) |
| 10 to 14 Years | 163 (6.7%) | 112 (4.7%) |
| 15 to 19 Years | 173 (7.1%) | 119 (5.0%) |
| 20 to 24 Years | 227 (9.3%) | 60 (2.5%) |
| 25 to 29 Years | 154 (6.3%) | 225 (9.4%) |
| 30 to 34 Years | 194 (7.9%) | 170 (7.1%) |
| 35 to 39 Years | 198 (8.1%) | 215 (9.0%) |
| 40 to 44 Years | 231 (9.5%) | 136 (5.7%) |
| 45 to 49 Years | 112 (4.6%) | 236 (9.9%) |
| 50 to 54 Years | 191 (7.8%) | 201 (8.4%) |
| 55 to 59 Years | 258 (10.5%) | 199 (8.3%) |
| 60 to 64 Years | 57 (2.3%) | 82 (3.4%) |
| 65 to 69 Years | 49 (2.0%) | 91 (3.8%) |
| 70 to 74 Years | 89 (3.6%) | 60 (2.5%) |
| 75 to 79 Years | 84 (3.4%) | 59 (2.5%) |
| 80 to 84 Years | 29 (1.2%) | 30 (1.3%) |
| 85 Years and over | 7 (0.3%) | 69 (2.9%) |
| Total | 2,445 (100.0%) | 2,393 (100.0%) |
Families and Households in South Bound Brook borough
Median Family Size in South Bound Brook borough
The median family size in South Bound Brook borough is 3.09 persons per family, with married-couple families (830 | 63.8%) accounting for the largest median family size of 3.27 persons per family. On the other hand, single female/mother families (391 | 30.0%) represent the smallest median family size with 2.71 persons per family.
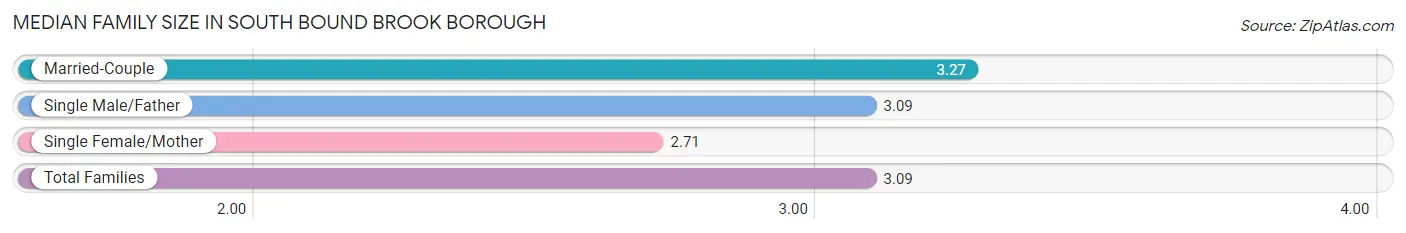
| Family Type | # Families | Family Size |
| Married-Couple | 830 (63.8%) | 3.27 |
| Single Male/Father | 80 (6.1%) | 3.09 |
| Single Female/Mother | 391 (30.0%) | 2.71 |
| Total Families | 1,301 (100.0%) | 3.09 |
Median Household Size in South Bound Brook borough
The median household size in South Bound Brook borough is 2.47 persons per household, with single male/father households (80 | 4.1%) accounting for the largest median household size of 3.38 persons per household. non-family households (650 | 33.3%) represent the smallest median household size with 1.14 persons per household.
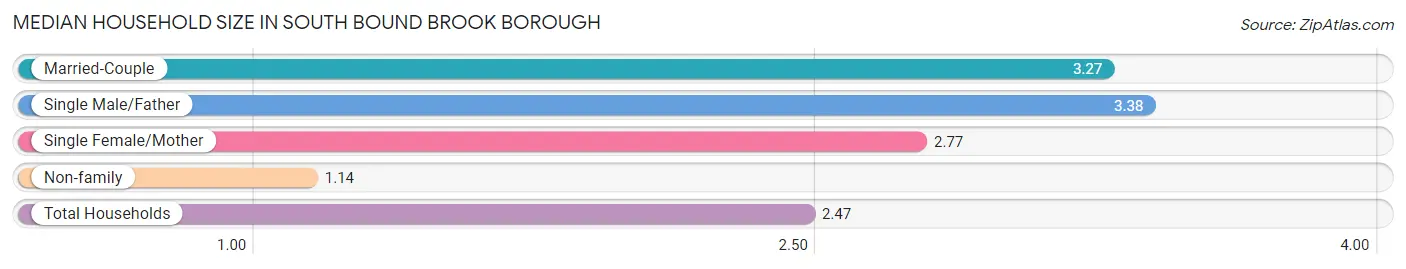
| Household Type | # Households | Household Size |
| Married-Couple | 830 (42.5%) | 3.27 |
| Single Male/Father | 80 (4.1%) | 3.38 |
| Single Female/Mother | 391 (20.0%) | 2.77 |
| Non-family | 650 (33.3%) | 1.14 |
| Total Households | 1,951 (100.0%) | 2.47 |
Household Size by Marriage Status in South Bound Brook borough
Out of a total of 1,951 households in South Bound Brook borough, 1,301 (66.7%) are family households, while 650 (33.3%) are nonfamily households. The most numerous type of family households are 2-person households, comprising 557, and the most common type of nonfamily households are 1-person households, comprising 564.
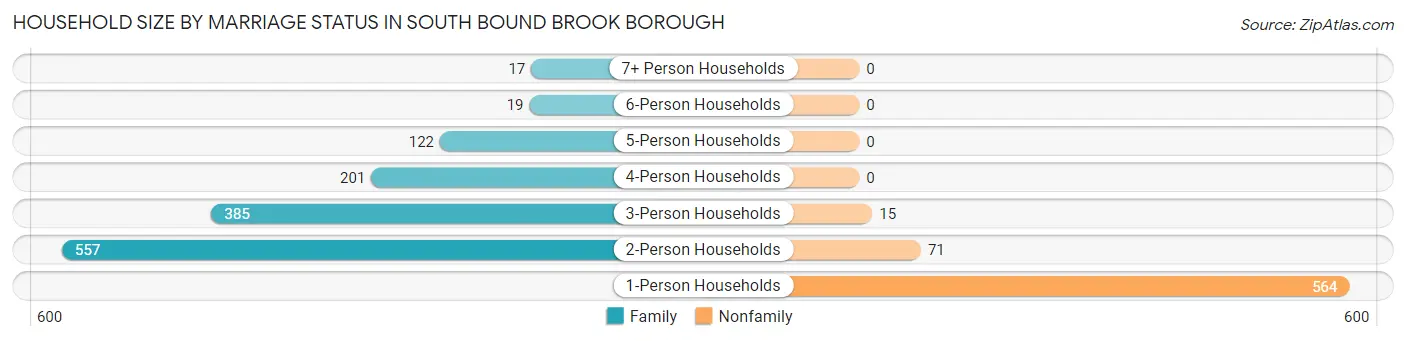
| Household Size | Family Households | Nonfamily Households |
| 1-Person Households | - | 564 (28.9%) |
| 2-Person Households | 557 (28.5%) | 71 (3.6%) |
| 3-Person Households | 385 (19.7%) | 15 (0.8%) |
| 4-Person Households | 201 (10.3%) | 0 (0.0%) |
| 5-Person Households | 122 (6.2%) | 0 (0.0%) |
| 6-Person Households | 19 (1.0%) | 0 (0.0%) |
| 7+ Person Households | 17 (0.9%) | 0 (0.0%) |
| Total | 1,301 (66.7%) | 650 (33.3%) |
Female Fertility in South Bound Brook borough
Fertility by Age in South Bound Brook borough
Average fertility rate in South Bound Brook borough is 80.0 births per 1,000 women. Women in the age bracket of 20 to 34 years have the highest fertility rate with 136.0 births per 1,000 women. Women in the age bracket of 20 to 34 years acount for 66.7% of all women with births.
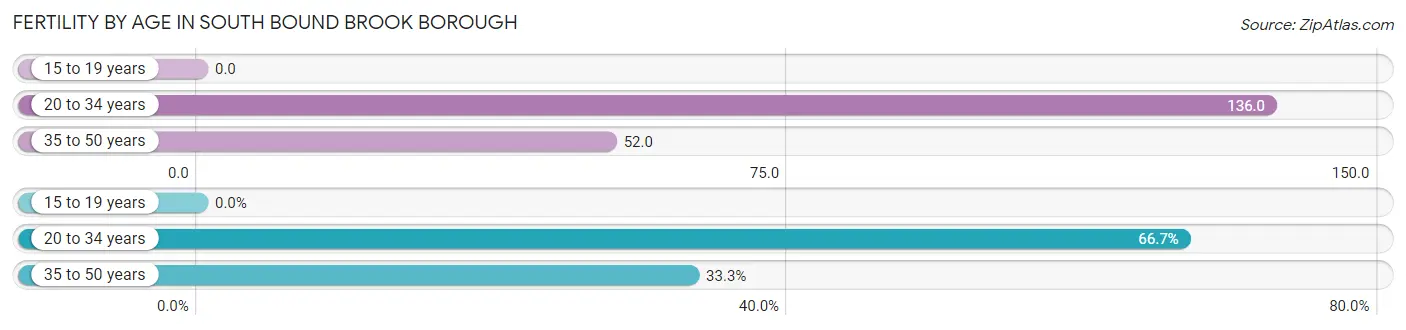
| Age Bracket | Women with Births | Births / 1,000 Women |
| 15 to 19 years | 0 (0.0%) | 0.0 |
| 20 to 34 years | 62 (66.7%) | 136.0 |
| 35 to 50 years | 31 (33.3%) | 52.0 |
| Total | 93 (100.0%) | 80.0 |
Fertility by Age by Marriage Status in South Bound Brook borough
73.1% of women with births (93) in South Bound Brook borough are married. The highest percentage of unmarried women with births falls into 20 to 34 years age bracket with 40.3% of them unmarried at the time of birth, while the lowest percentage of unmarried women with births belong to 35 to 50 years age bracket with 0.0% of them unmarried.
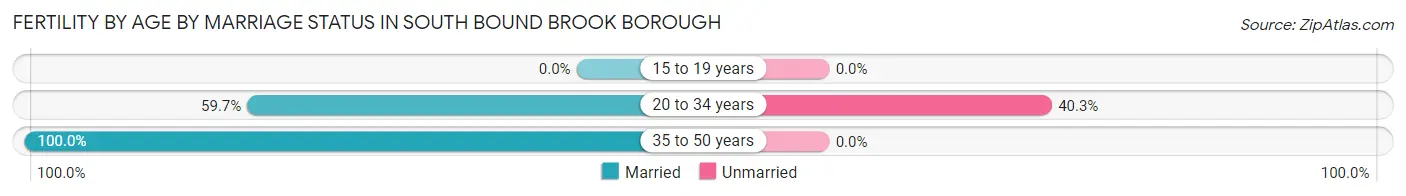
| Age Bracket | Married | Unmarried |
| 15 to 19 years | 0 (0.0%) | 0 (0.0%) |
| 20 to 34 years | 37 (59.7%) | 25 (40.3%) |
| 35 to 50 years | 31 (100.0%) | 0 (0.0%) |
| Total | 68 (73.1%) | 25 (26.9%) |
Fertility by Education in South Bound Brook borough
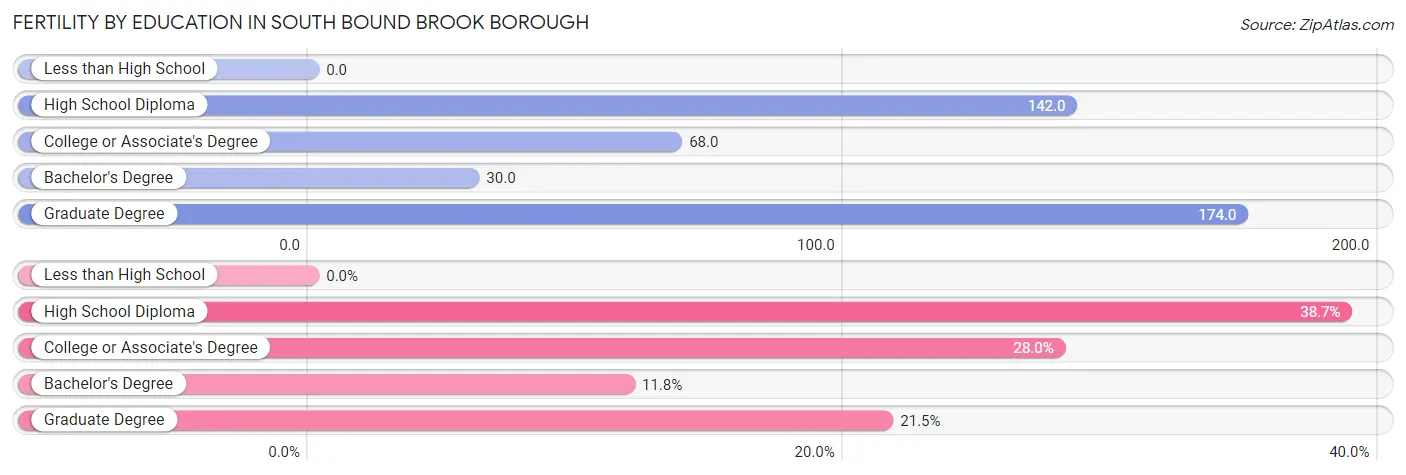
| Educational Attainment | Women with Births | Births / 1,000 Women |
| Less than High School | 0 (0.0%) | 0.0 |
| High School Diploma | 36 (38.7%) | 142.0 |
| College or Associate's Degree | 26 (28.0%) | 68.0 |
| Bachelor's Degree | 11 (11.8%) | 30.0 |
| Graduate Degree | 20 (21.5%) | 174.0 |
| Total | 93 (100.0%) | 80.0 |
Fertility by Education by Marriage Status in South Bound Brook borough
26.9% of women with births in South Bound Brook borough are unmarried. Women with the educational attainment of college or associate's degree are most likely to be married with 100.0% of them married at childbirth, while women with the educational attainment of high school diploma are least likely to be married with 69.4% of them unmarried at childbirth.
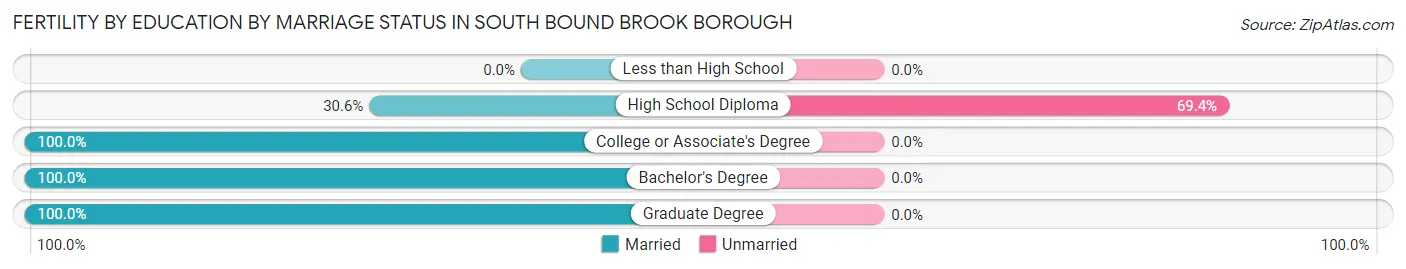
| Educational Attainment | Married | Unmarried |
| Less than High School | 0 (0.0%) | 0 (0.0%) |
| High School Diploma | 11 (30.6%) | 25 (69.4%) |
| College or Associate's Degree | 26 (100.0%) | 0 (0.0%) |
| Bachelor's Degree | 11 (100.0%) | 0 (0.0%) |
| Graduate Degree | 20 (100.0%) | 0 (0.0%) |
| Total | 68 (73.1%) | 25 (26.9%) |
Employment Characteristics in South Bound Brook borough
Employment by Class of Employer in South Bound Brook borough
Among the 2,735 employed individuals in South Bound Brook borough, private company employees (2,208 | 80.7%), local government employees (145 | 5.3%), and not-for-profit organizations (126 | 4.6%) make up the most common classes of employment.
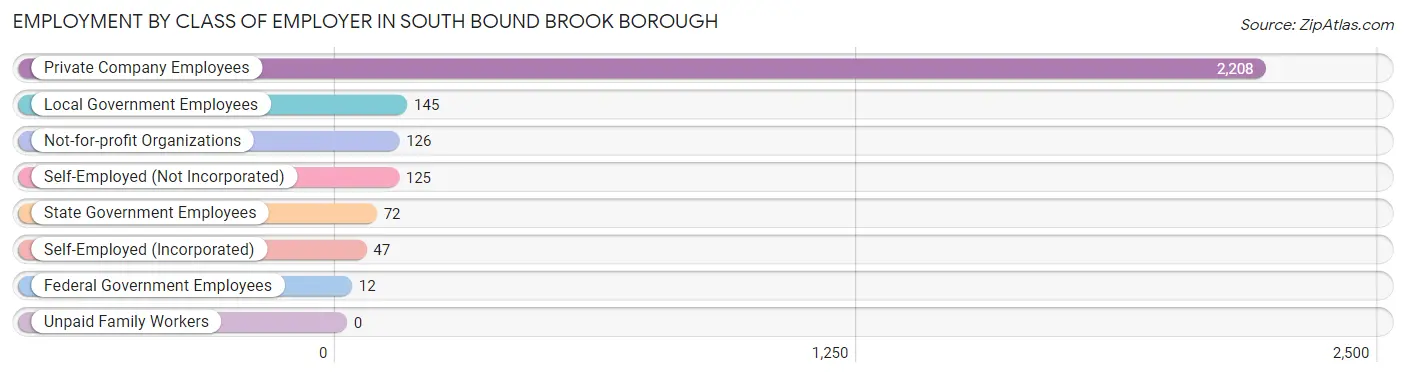
| Employer Class | # Employees | % Employees |
| Private Company Employees | 2,208 | 80.7% |
| Self-Employed (Incorporated) | 47 | 1.7% |
| Self-Employed (Not Incorporated) | 125 | 4.6% |
| Not-for-profit Organizations | 126 | 4.6% |
| Local Government Employees | 145 | 5.3% |
| State Government Employees | 72 | 2.6% |
| Federal Government Employees | 12 | 0.4% |
| Unpaid Family Workers | 0 | 0.0% |
| Total | 2,735 | 100.0% |
Employment Status by Age in South Bound Brook borough
According to the labor force statistics for South Bound Brook borough, out of the total population over 16 years of age (3,966), 76.1% or 3,018 individuals are in the labor force, with 7.3% or 220 of them unemployed. The age group with the highest labor force participation rate is 25 to 29 years, with 95.5% or 362 individuals in the labor force. Within the labor force, the 16 to 19 years age range has the highest percentage of unemployed individuals, with 49.4% or 39 of them being unemployed.
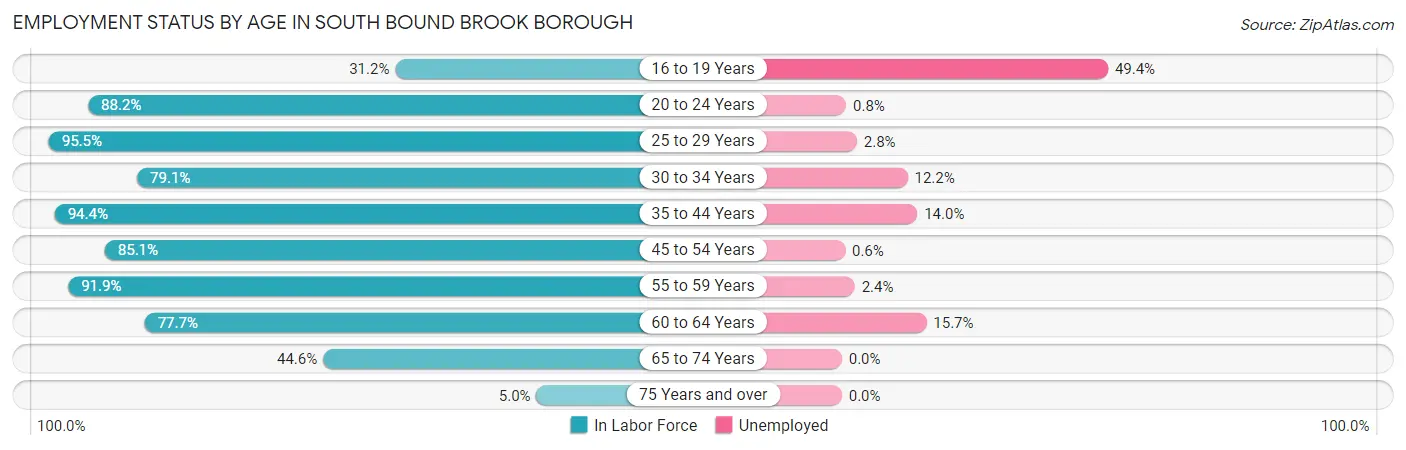
| Age Bracket | In Labor Force | Unemployed |
| 16 to 19 Years | 79 (31.2%) | 39 (49.4%) |
| 20 to 24 Years | 253 (88.2%) | 2 (0.8%) |
| 25 to 29 Years | 362 (95.5%) | 10 (2.8%) |
| 30 to 34 Years | 288 (79.1%) | 35 (12.2%) |
| 35 to 44 Years | 736 (94.4%) | 103 (14.0%) |
| 45 to 54 Years | 630 (85.1%) | 4 (0.6%) |
| 55 to 59 Years | 420 (91.9%) | 10 (2.4%) |
| 60 to 64 Years | 108 (77.7%) | 17 (15.7%) |
| 65 to 74 Years | 129 (44.6%) | 0 (0.0%) |
| 75 Years and over | 14 (5.0%) | 0 (0.0%) |
| Total | 3,018 (76.1%) | 220 (7.3%) |
Employment Status by Educational Attainment in South Bound Brook borough
According to labor force statistics for South Bound Brook borough, 89.0% of individuals (2,545) out of the total population between 25 and 64 years of age (2,859) are in the labor force, with 7.0% or 178 of them being unemployed. The group with the highest labor force participation rate are those with the educational attainment of college / associate degree, with 92.0% or 1,006 individuals in the labor force. Within the labor force, individuals with high school diploma education have the highest percentage of unemployment, with 11.8% or 66 of them being unemployed.
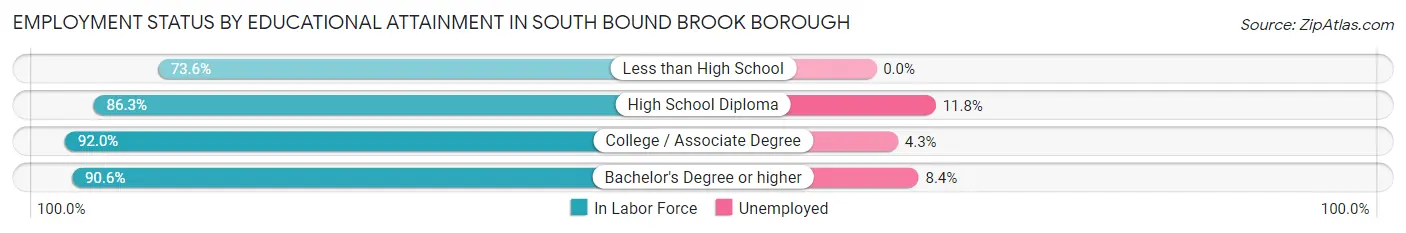
| Educational Attainment | In Labor Force | Unemployed |
| Less than High School | 142 (73.6%) | 0 (0.0%) |
| High School Diploma | 559 (86.3%) | 76 (11.8%) |
| College / Associate Degree | 1,006 (92.0%) | 47 (4.3%) |
| Bachelor's Degree or higher | 837 (90.6%) | 78 (8.4%) |
| Total | 2,545 (89.0%) | 200 (7.0%) |
Employment Occupations by Sex in South Bound Brook borough
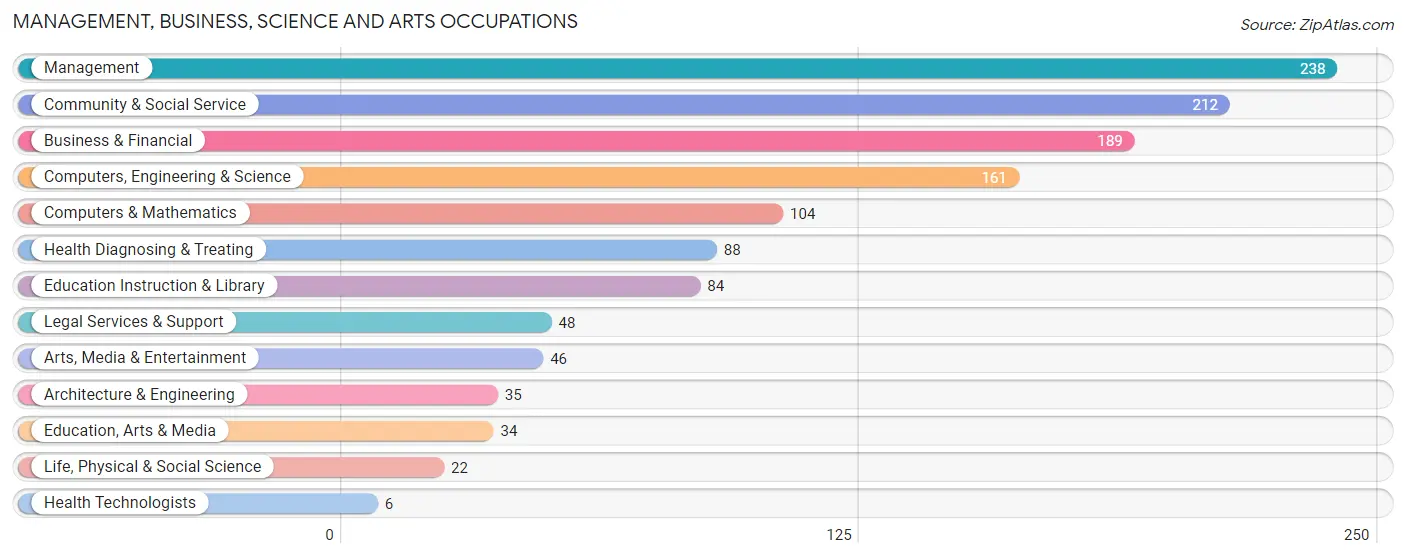
Management, Business, Science and Arts Occupations
The most common Management, Business, Science and Arts occupations in South Bound Brook borough are Management (238 | 8.5%), Community & Social Service (212 | 7.6%), Business & Financial (189 | 6.8%), Computers, Engineering & Science (161 | 5.8%), and Computers & Mathematics (104 | 3.7%).
Management, Business, Science and Arts Occupations by Sex
Within the Management, Business, Science and Arts occupations in South Bound Brook borough, the most male-oriented occupations are Health Technologists (100.0%), Computers & Mathematics (88.5%), and Architecture & Engineering (74.3%), while the most female-oriented occupations are Life, Physical & Social Science (100.0%), Legal Services & Support (100.0%), and Education Instruction & Library (100.0%).
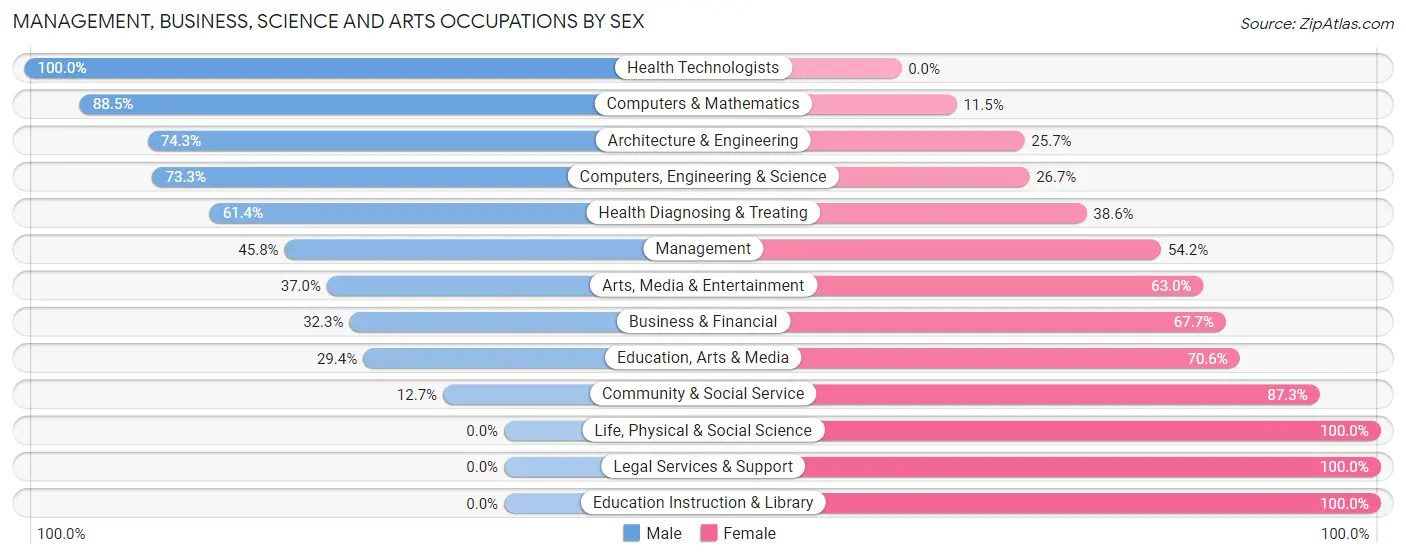
| Occupation | Male | Female |
| Management | 109 (45.8%) | 129 (54.2%) |
| Business & Financial | 61 (32.3%) | 128 (67.7%) |
| Computers, Engineering & Science | 118 (73.3%) | 43 (26.7%) |
| Computers & Mathematics | 92 (88.5%) | 12 (11.5%) |
| Architecture & Engineering | 26 (74.3%) | 9 (25.7%) |
| Life, Physical & Social Science | 0 (0.0%) | 22 (100.0%) |
| Community & Social Service | 27 (12.7%) | 185 (87.3%) |
| Education, Arts & Media | 10 (29.4%) | 24 (70.6%) |
| Legal Services & Support | 0 (0.0%) | 48 (100.0%) |
| Education Instruction & Library | 0 (0.0%) | 84 (100.0%) |
| Arts, Media & Entertainment | 17 (37.0%) | 29 (63.0%) |
| Health Diagnosing & Treating | 54 (61.4%) | 34 (38.6%) |
| Health Technologists | 6 (100.0%) | 0 (0.0%) |
| Total (Category) | 369 (41.5%) | 519 (58.5%) |
| Total (Overall) | 1,578 (56.4%) | 1,221 (43.6%) |
Services Occupations
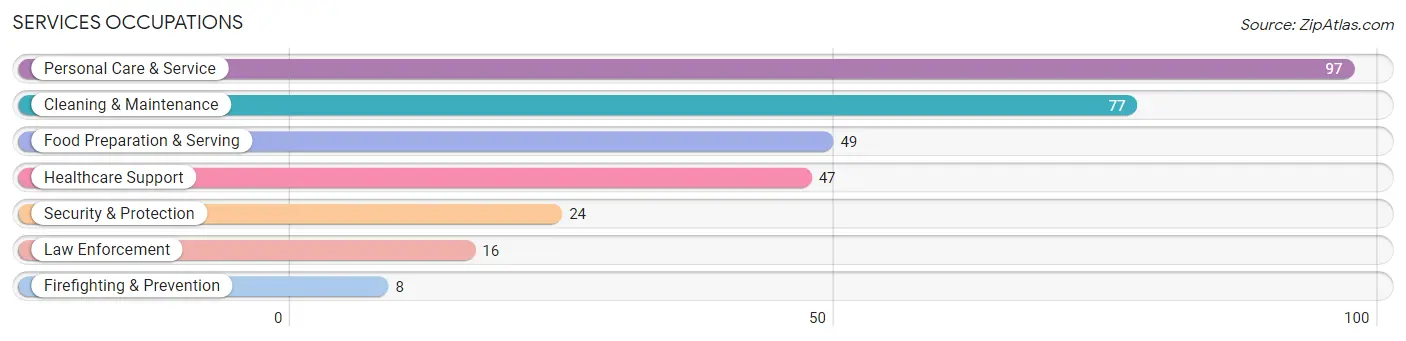
The most common Services occupations in South Bound Brook borough are Personal Care & Service (97 | 3.5%), Cleaning & Maintenance (77 | 2.8%), Food Preparation & Serving (49 | 1.8%), Healthcare Support (47 | 1.7%), and Security & Protection (24 | 0.9%).
Services Occupations by Sex
Within the Services occupations in South Bound Brook borough, the most male-oriented occupations are Security & Protection (100.0%), Firefighting & Prevention (100.0%), and Law Enforcement (100.0%), while the most female-oriented occupations are Healthcare Support (100.0%), Personal Care & Service (94.9%), and Food Preparation & Serving (28.6%).
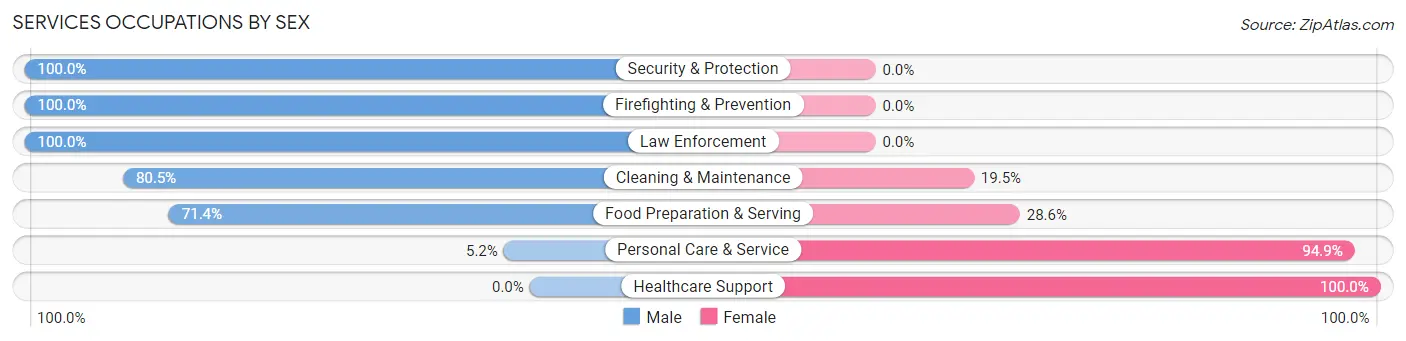
| Occupation | Male | Female |
| Healthcare Support | 0 (0.0%) | 47 (100.0%) |
| Security & Protection | 24 (100.0%) | 0 (0.0%) |
| Firefighting & Prevention | 8 (100.0%) | 0 (0.0%) |
| Law Enforcement | 16 (100.0%) | 0 (0.0%) |
| Food Preparation & Serving | 35 (71.4%) | 14 (28.6%) |
| Cleaning & Maintenance | 62 (80.5%) | 15 (19.5%) |
| Personal Care & Service | 5 (5.1%) | 92 (94.9%) |
| Total (Category) | 126 (42.9%) | 168 (57.1%) |
| Total (Overall) | 1,578 (56.4%) | 1,221 (43.6%) |
Sales and Office Occupations
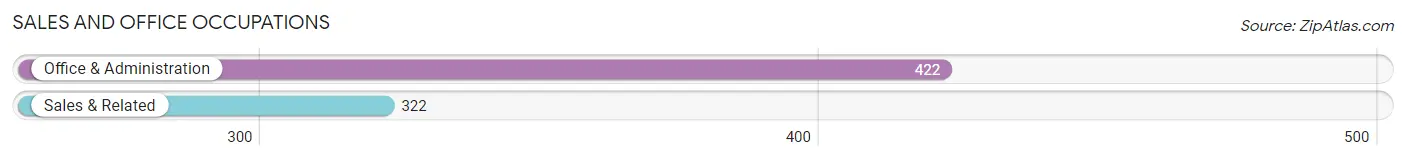
The most common Sales and Office occupations in South Bound Brook borough are Office & Administration (422 | 15.1%), and Sales & Related (322 | 11.5%).
Sales and Office Occupations by Sex
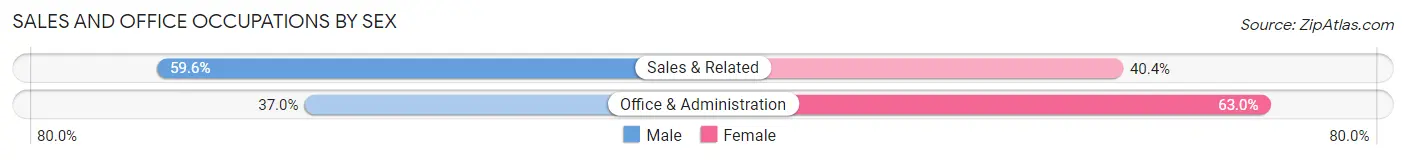
| Occupation | Male | Female |
| Sales & Related | 192 (59.6%) | 130 (40.4%) |
| Office & Administration | 156 (37.0%) | 266 (63.0%) |
| Total (Category) | 348 (46.8%) | 396 (53.2%) |
| Total (Overall) | 1,578 (56.4%) | 1,221 (43.6%) |
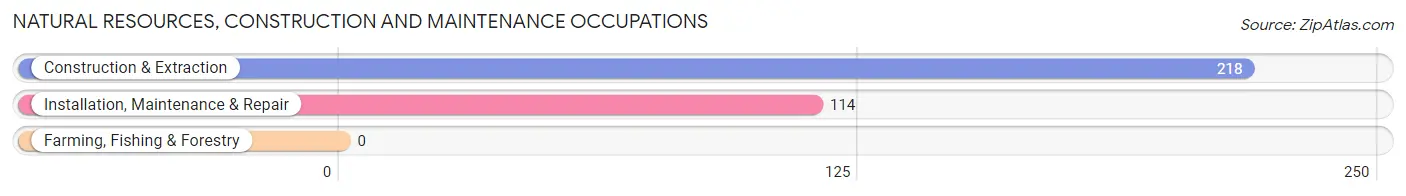
Natural Resources, Construction and Maintenance Occupations
The most common Natural Resources, Construction and Maintenance occupations in South Bound Brook borough are Construction & Extraction (218 | 7.8%), and Installation, Maintenance & Repair (114 | 4.1%).
Natural Resources, Construction and Maintenance Occupations by Sex
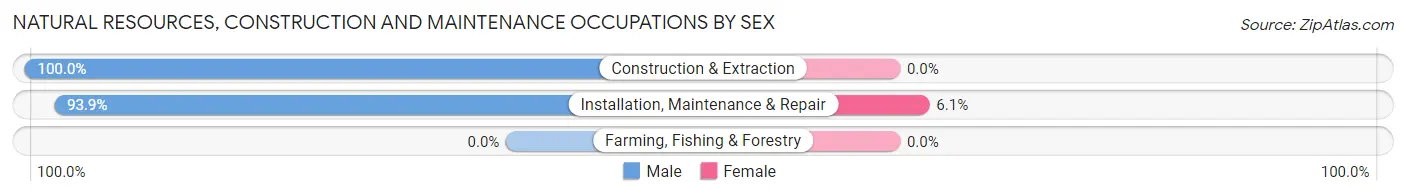
| Occupation | Male | Female |
| Farming, Fishing & Forestry | 0 (0.0%) | 0 (0.0%) |
| Construction & Extraction | 218 (100.0%) | 0 (0.0%) |
| Installation, Maintenance & Repair | 107 (93.9%) | 7 (6.1%) |
| Total (Category) | 325 (97.9%) | 7 (2.1%) |
| Total (Overall) | 1,578 (56.4%) | 1,221 (43.6%) |
Production, Transportation and Moving Occupations
The most common Production, Transportation and Moving occupations in South Bound Brook borough are Material Moving (220 | 7.9%), Transportation (204 | 7.3%), and Production (117 | 4.2%).
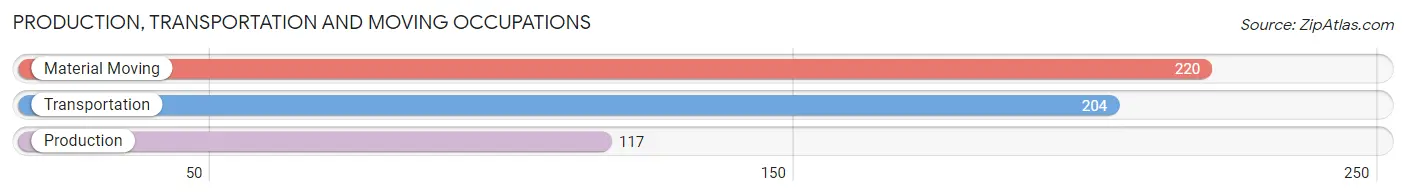
Production, Transportation and Moving Occupations by Sex
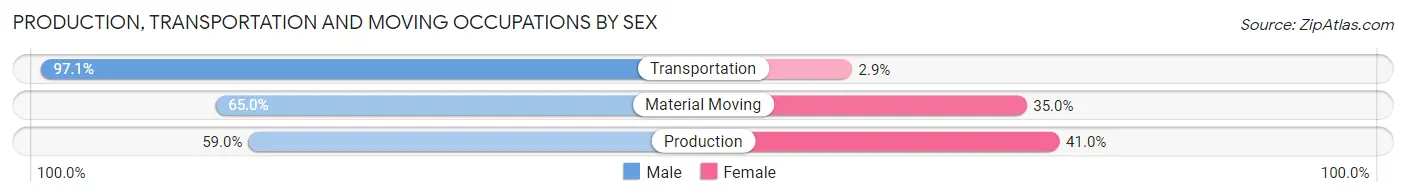
| Occupation | Male | Female |
| Production | 69 (59.0%) | 48 (41.0%) |
| Transportation | 198 (97.1%) | 6 (2.9%) |
| Material Moving | 143 (65.0%) | 77 (35.0%) |
| Total (Category) | 410 (75.8%) | 131 (24.2%) |
| Total (Overall) | 1,578 (56.4%) | 1,221 (43.6%) |
Employment Industries by Sex in South Bound Brook borough
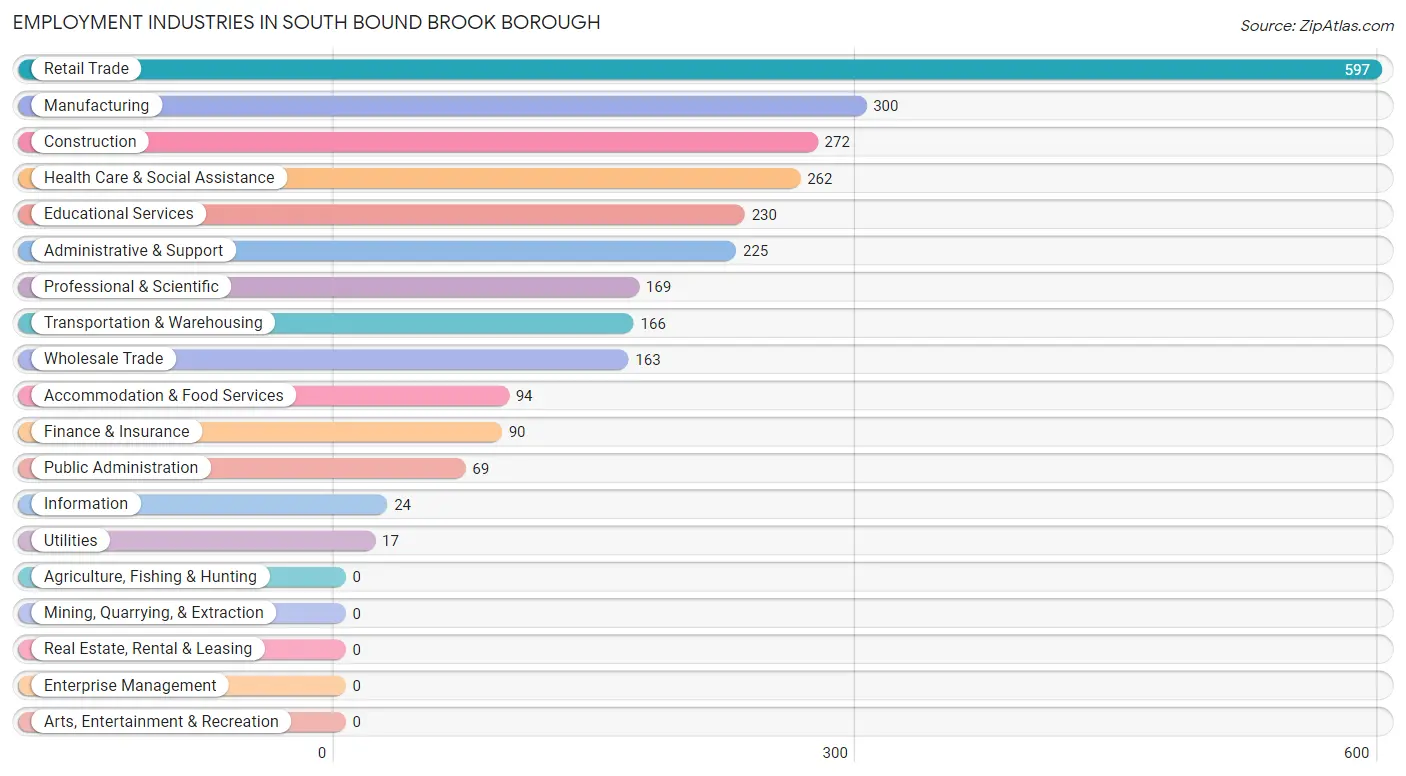
Employment Industries in South Bound Brook borough
The major employment industries in South Bound Brook borough include Retail Trade (597 | 21.3%), Manufacturing (300 | 10.7%), Construction (272 | 9.7%), Health Care & Social Assistance (262 | 9.4%), and Educational Services (230 | 8.2%).
Employment Industries by Sex in South Bound Brook borough
The South Bound Brook borough industries that see more men than women are Utilities (100.0%), Construction (90.8%), and Public Administration (78.3%), whereas the industries that tend to have a higher number of women are Finance & Insurance (86.7%), Information (70.8%), and Educational Services (68.3%).
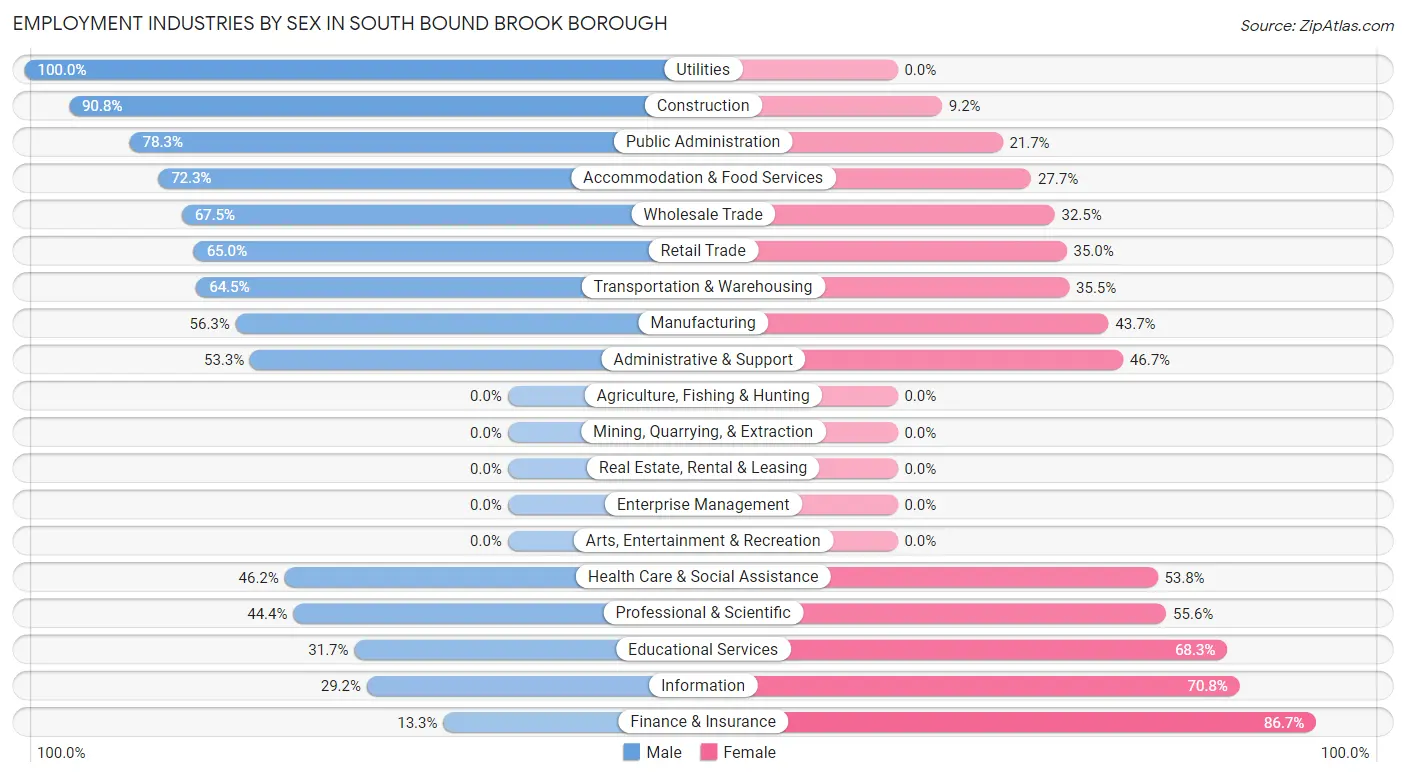
| Industry | Male | Female |
| Agriculture, Fishing & Hunting | 0 (0.0%) | 0 (0.0%) |
| Mining, Quarrying, & Extraction | 0 (0.0%) | 0 (0.0%) |
| Construction | 247 (90.8%) | 25 (9.2%) |
| Manufacturing | 169 (56.3%) | 131 (43.7%) |
| Wholesale Trade | 110 (67.5%) | 53 (32.5%) |
| Retail Trade | 388 (65.0%) | 209 (35.0%) |
| Transportation & Warehousing | 107 (64.5%) | 59 (35.5%) |
| Utilities | 17 (100.0%) | 0 (0.0%) |
| Information | 7 (29.2%) | 17 (70.8%) |
| Finance & Insurance | 12 (13.3%) | 78 (86.7%) |
| Real Estate, Rental & Leasing | 0 (0.0%) | 0 (0.0%) |
| Professional & Scientific | 75 (44.4%) | 94 (55.6%) |
| Enterprise Management | 0 (0.0%) | 0 (0.0%) |
| Administrative & Support | 120 (53.3%) | 105 (46.7%) |
| Educational Services | 73 (31.7%) | 157 (68.3%) |
| Health Care & Social Assistance | 121 (46.2%) | 141 (53.8%) |
| Arts, Entertainment & Recreation | 0 (0.0%) | 0 (0.0%) |
| Accommodation & Food Services | 68 (72.3%) | 26 (27.7%) |
| Public Administration | 54 (78.3%) | 15 (21.7%) |
| Total | 1,578 (56.4%) | 1,221 (43.6%) |
Education in South Bound Brook borough
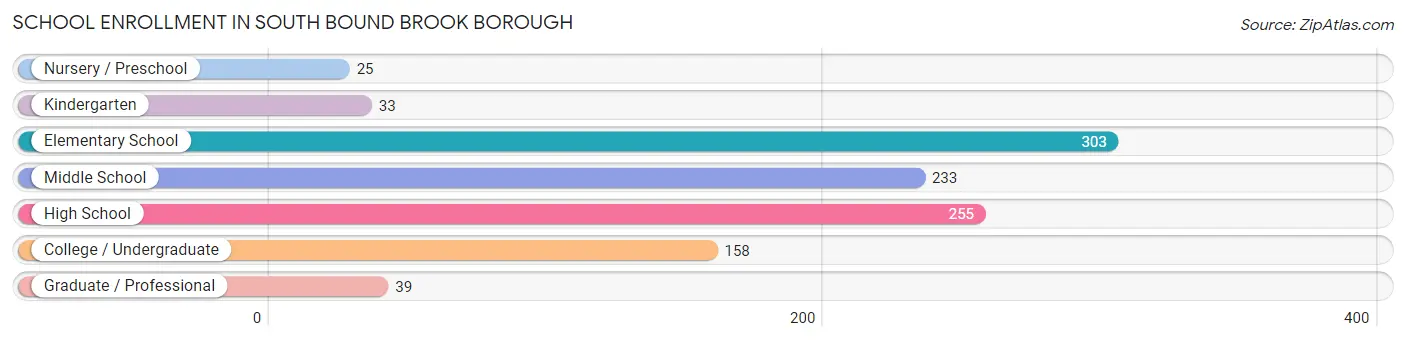
School Enrollment in South Bound Brook borough
The most common levels of schooling among the 1,046 students in South Bound Brook borough are elementary school (303 | 29.0%), high school (255 | 24.4%), and middle school (233 | 22.3%).
| School Level | # Students | % Students |
| Nursery / Preschool | 25 | 2.4% |
| Kindergarten | 33 | 3.2% |
| Elementary School | 303 | 29.0% |
| Middle School | 233 | 22.3% |
| High School | 255 | 24.4% |
| College / Undergraduate | 158 | 15.1% |
| Graduate / Professional | 39 | 3.7% |
| Total | 1,046 | 100.0% |
School Enrollment by Age by Funding Source in South Bound Brook borough
Out of a total of 1,046 students who are enrolled in schools in South Bound Brook borough, 156 (14.9%) attend a private institution, while the remaining 890 (85.1%) are enrolled in public schools. The age group of 3 to 4 year olds has the highest likelihood of being enrolled in private schools, with 2 (100.0% in the age bracket) enrolled. Conversely, the age group of 10 to 14 year olds has the lowest likelihood of being enrolled in a private school, with 270 (98.2% in the age bracket) attending a public institution.
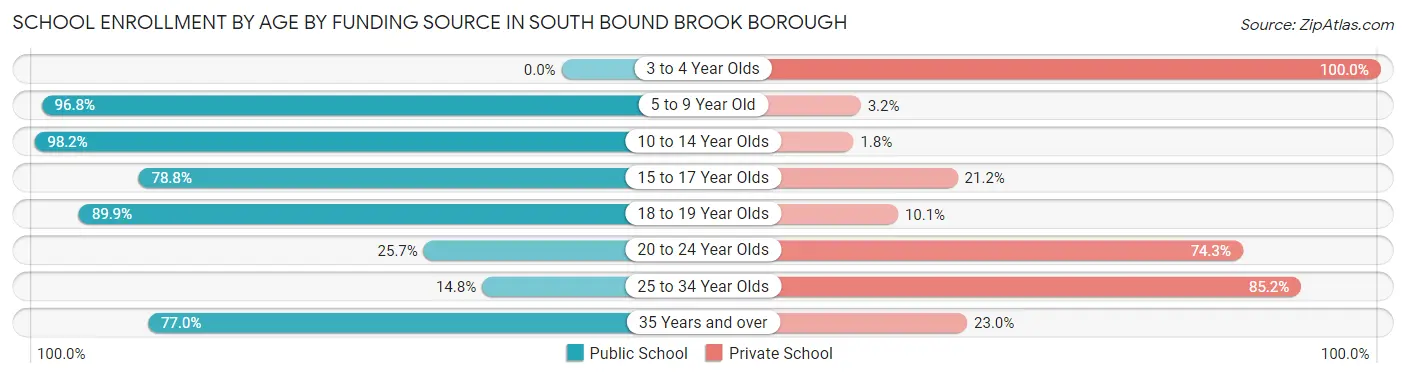
| Age Bracket | Public School | Private School |
| 3 to 4 Year Olds | 0 (0.0%) | 2 (100.0%) |
| 5 to 9 Year Old | 335 (96.8%) | 11 (3.2%) |
| 10 to 14 Year Olds | 270 (98.2%) | 5 (1.8%) |
| 15 to 17 Year Olds | 115 (78.8%) | 31 (21.2%) |
| 18 to 19 Year Olds | 80 (89.9%) | 9 (10.1%) |
| 20 to 24 Year Olds | 19 (25.7%) | 55 (74.3%) |
| 25 to 34 Year Olds | 4 (14.8%) | 23 (85.2%) |
| 35 Years and over | 67 (77.0%) | 20 (23.0%) |
| Total | 890 (85.1%) | 156 (14.9%) |
Educational Attainment by Field of Study in South Bound Brook borough
Business (169 | 17.7%), computers & mathematics (151 | 15.8%), education (83 | 8.7%), engineering (75 | 7.9%), and visual & performing arts (61 | 6.4%) are the most common fields of study among 956 individuals in South Bound Brook borough who have obtained a bachelor's degree or higher.
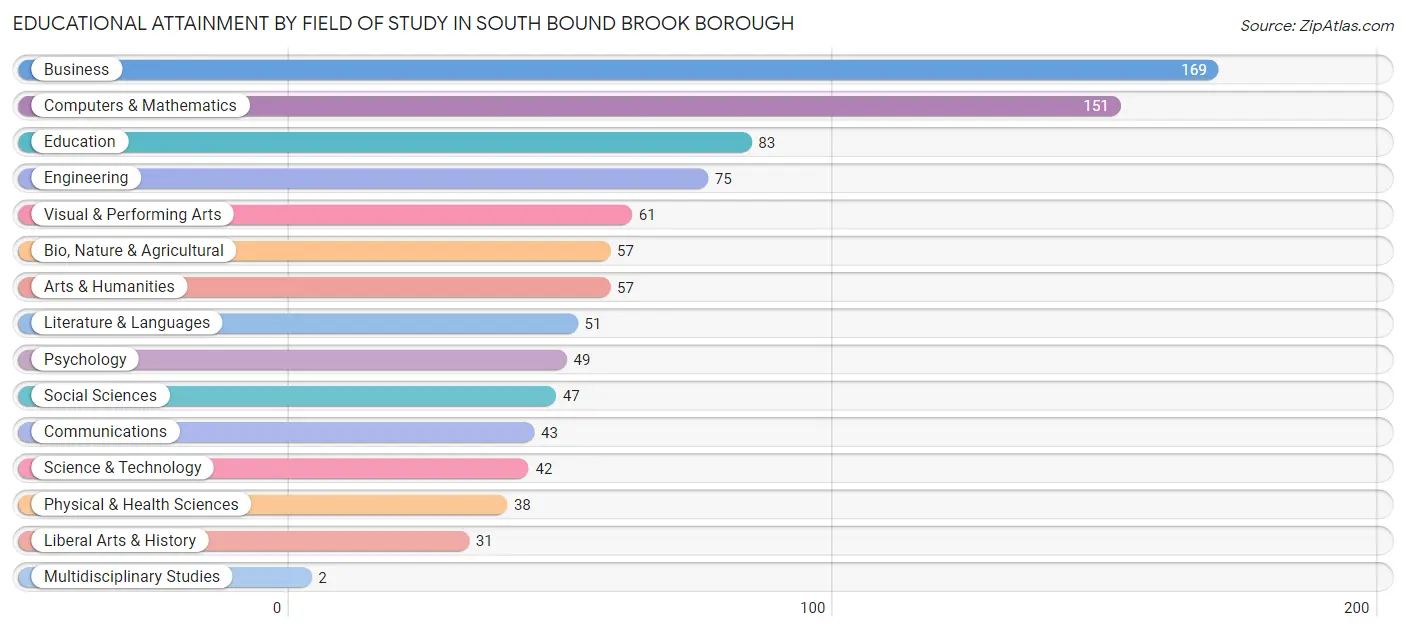
| Field of Study | # Graduates | % Graduates |
| Computers & Mathematics | 151 | 15.8% |
| Bio, Nature & Agricultural | 57 | 6.0% |
| Physical & Health Sciences | 38 | 4.0% |
| Psychology | 49 | 5.1% |
| Social Sciences | 47 | 4.9% |
| Engineering | 75 | 7.9% |
| Multidisciplinary Studies | 2 | 0.2% |
| Science & Technology | 42 | 4.4% |
| Business | 169 | 17.7% |
| Education | 83 | 8.7% |
| Literature & Languages | 51 | 5.3% |
| Liberal Arts & History | 31 | 3.2% |
| Visual & Performing Arts | 61 | 6.4% |
| Communications | 43 | 4.5% |
| Arts & Humanities | 57 | 6.0% |
| Total | 956 | 100.0% |
Transportation & Commute in South Bound Brook borough
Vehicle Availability by Sex in South Bound Brook borough
The most prevalent vehicle ownership categories in South Bound Brook borough are males with 2 vehicles (779, accounting for 50.9%) and females with 2 vehicles (503, making up 64.8%).
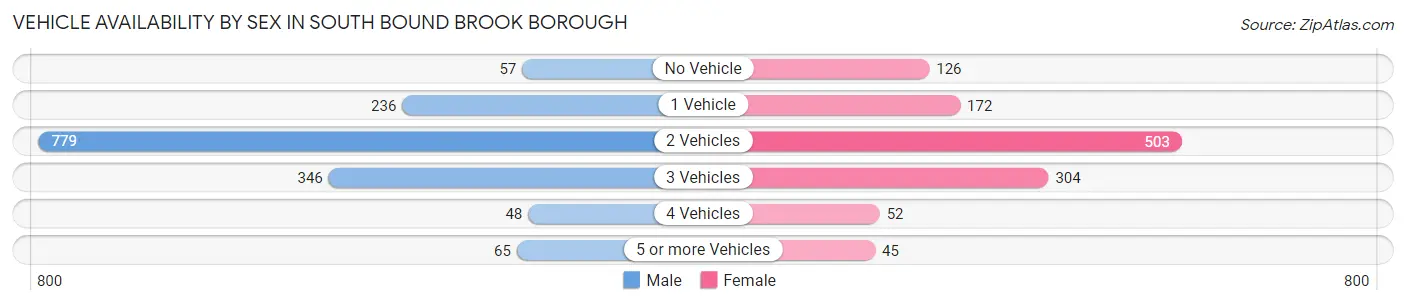
| Vehicles Available | Male | Female |
| No Vehicle | 57 (3.7%) | 126 (10.5%) |
| 1 Vehicle | 236 (15.4%) | 172 (14.3%) |
| 2 Vehicles | 779 (50.9%) | 503 (41.8%) |
| 3 Vehicles | 346 (22.6%) | 304 (25.3%) |
| 4 Vehicles | 48 (3.1%) | 52 (4.3%) |
| 5 or more Vehicles | 65 (4.3%) | 45 (3.7%) |
| Total | 1,531 (100.0%) | 1,202 (100.0%) |
Commute Time in South Bound Brook borough
The most frequently occuring commute durations in South Bound Brook borough are 15 to 19 minutes (497 commuters, 20.2%), 20 to 24 minutes (435 commuters, 17.7%), and 30 to 34 minutes (361 commuters, 14.7%).
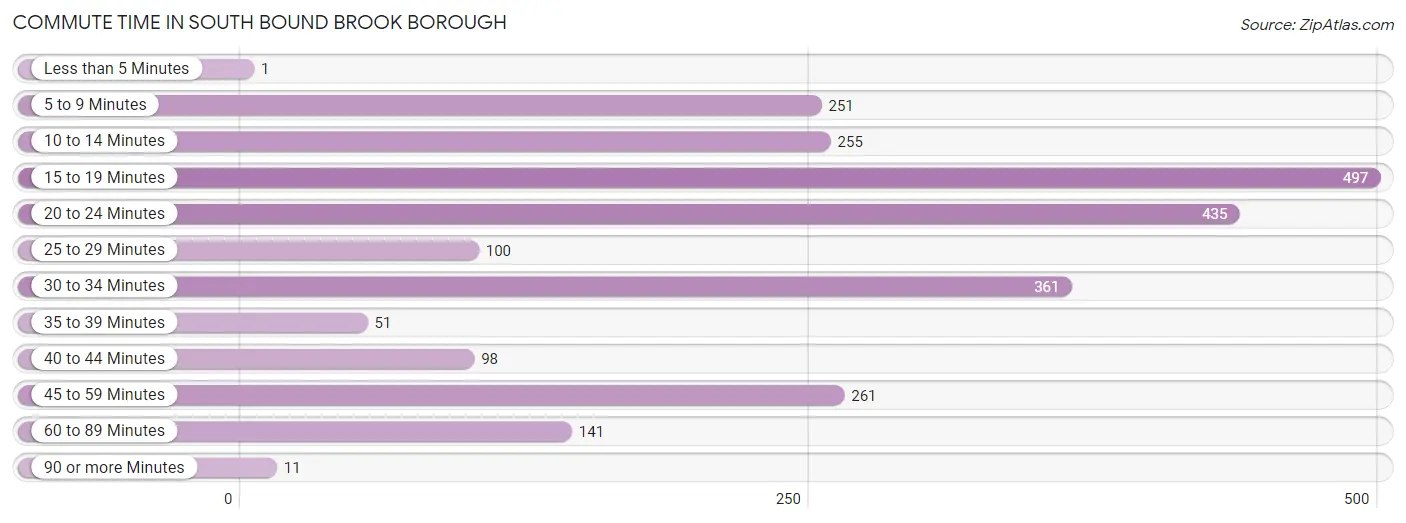
| Commute Time | # Commuters | % Commuters |
| Less than 5 Minutes | 1 | 0.0% |
| 5 to 9 Minutes | 251 | 10.2% |
| 10 to 14 Minutes | 255 | 10.4% |
| 15 to 19 Minutes | 497 | 20.2% |
| 20 to 24 Minutes | 435 | 17.7% |
| 25 to 29 Minutes | 100 | 4.1% |
| 30 to 34 Minutes | 361 | 14.7% |
| 35 to 39 Minutes | 51 | 2.1% |
| 40 to 44 Minutes | 98 | 4.0% |
| 45 to 59 Minutes | 261 | 10.6% |
| 60 to 89 Minutes | 141 | 5.7% |
| 90 or more Minutes | 11 | 0.4% |
Commute Time by Sex in South Bound Brook borough
The most common commute times in South Bound Brook borough are 20 to 24 minutes (300 commuters, 21.4%) for males and 15 to 19 minutes (267 commuters, 25.2%) for females.
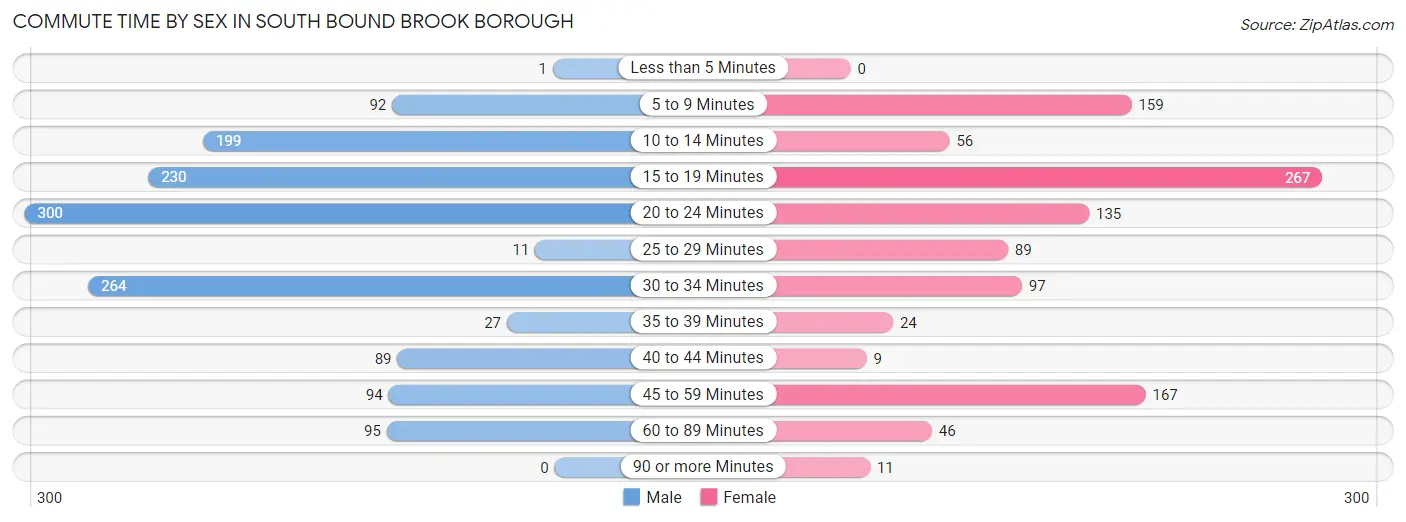
| Commute Time | Male | Female |
| Less than 5 Minutes | 1 (0.1%) | 0 (0.0%) |
| 5 to 9 Minutes | 92 (6.6%) | 159 (15.0%) |
| 10 to 14 Minutes | 199 (14.2%) | 56 (5.3%) |
| 15 to 19 Minutes | 230 (16.4%) | 267 (25.2%) |
| 20 to 24 Minutes | 300 (21.4%) | 135 (12.7%) |
| 25 to 29 Minutes | 11 (0.8%) | 89 (8.4%) |
| 30 to 34 Minutes | 264 (18.8%) | 97 (9.1%) |
| 35 to 39 Minutes | 27 (1.9%) | 24 (2.3%) |
| 40 to 44 Minutes | 89 (6.4%) | 9 (0.9%) |
| 45 to 59 Minutes | 94 (6.7%) | 167 (15.8%) |
| 60 to 89 Minutes | 95 (6.8%) | 46 (4.3%) |
| 90 or more Minutes | 0 (0.0%) | 11 (1.0%) |
Time of Departure to Work by Sex in South Bound Brook borough
The most frequent times of departure to work in South Bound Brook borough are 6:30 AM to 6:59 AM (234, 16.7%) for males and 8:00 AM to 8:29 AM (230, 21.7%) for females.
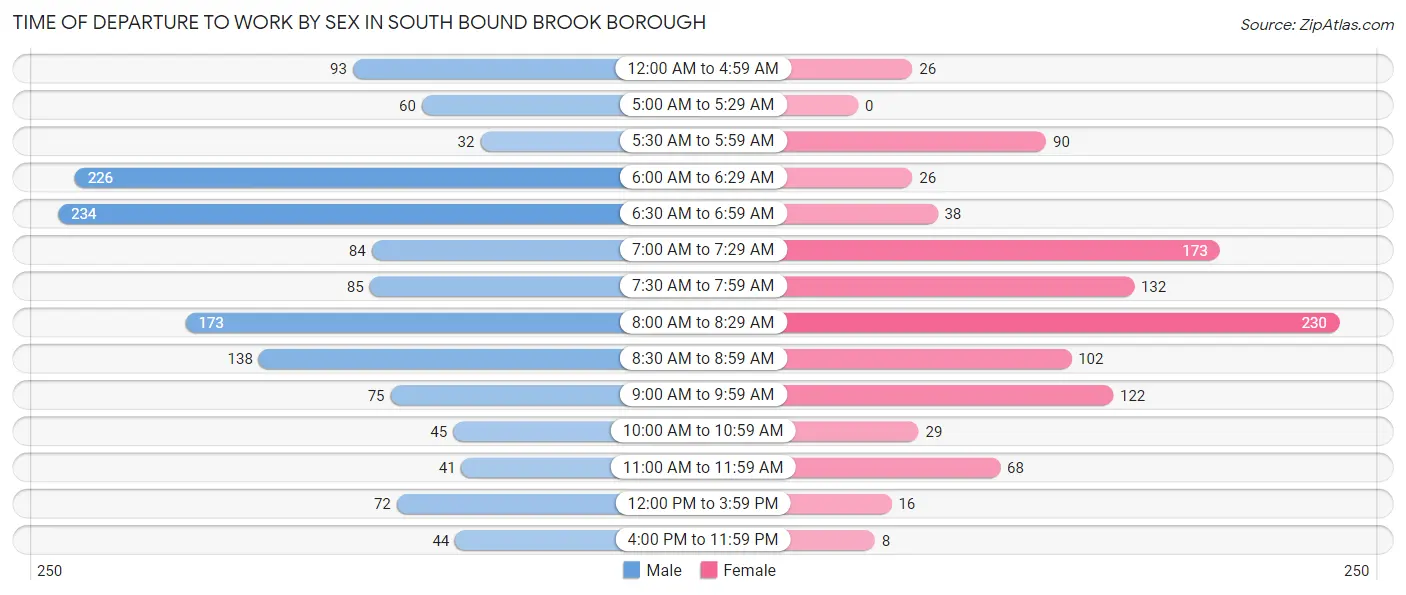
| Time of Departure | Male | Female |
| 12:00 AM to 4:59 AM | 93 (6.6%) | 26 (2.5%) |
| 5:00 AM to 5:29 AM | 60 (4.3%) | 0 (0.0%) |
| 5:30 AM to 5:59 AM | 32 (2.3%) | 90 (8.5%) |
| 6:00 AM to 6:29 AM | 226 (16.1%) | 26 (2.5%) |
| 6:30 AM to 6:59 AM | 234 (16.7%) | 38 (3.6%) |
| 7:00 AM to 7:29 AM | 84 (6.0%) | 173 (16.3%) |
| 7:30 AM to 7:59 AM | 85 (6.1%) | 132 (12.4%) |
| 8:00 AM to 8:29 AM | 173 (12.3%) | 230 (21.7%) |
| 8:30 AM to 8:59 AM | 138 (9.8%) | 102 (9.6%) |
| 9:00 AM to 9:59 AM | 75 (5.3%) | 122 (11.5%) |
| 10:00 AM to 10:59 AM | 45 (3.2%) | 29 (2.7%) |
| 11:00 AM to 11:59 AM | 41 (2.9%) | 68 (6.4%) |
| 12:00 PM to 3:59 PM | 72 (5.1%) | 16 (1.5%) |
| 4:00 PM to 11:59 PM | 44 (3.1%) | 8 (0.7%) |
| Total | 1,402 (100.0%) | 1,060 (100.0%) |
Housing Occupancy in South Bound Brook borough
Occupancy by Ownership in South Bound Brook borough
Of the total 1,951 dwellings in South Bound Brook borough, owner-occupied units account for 1,145 (58.7%), while renter-occupied units make up 806 (41.3%).
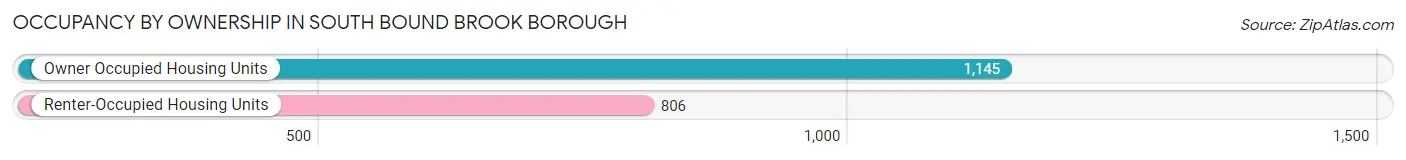
| Occupancy | # Housing Units | % Housing Units |
| Owner Occupied Housing Units | 1,145 | 58.7% |
| Renter-Occupied Housing Units | 806 | 41.3% |
| Total Occupied Housing Units | 1,951 | 100.0% |
Occupancy by Household Size in South Bound Brook borough
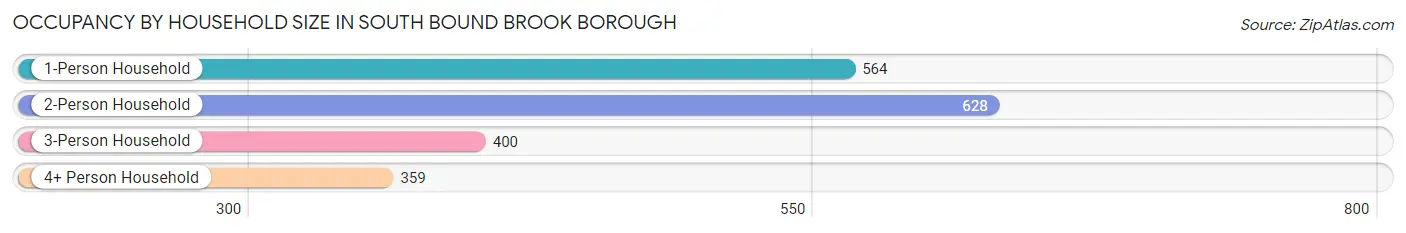
| Household Size | # Housing Units | % Housing Units |
| 1-Person Household | 564 | 28.9% |
| 2-Person Household | 628 | 32.2% |
| 3-Person Household | 400 | 20.5% |
| 4+ Person Household | 359 | 18.4% |
| Total Housing Units | 1,951 | 100.0% |
Occupancy by Ownership by Household Size in South Bound Brook borough
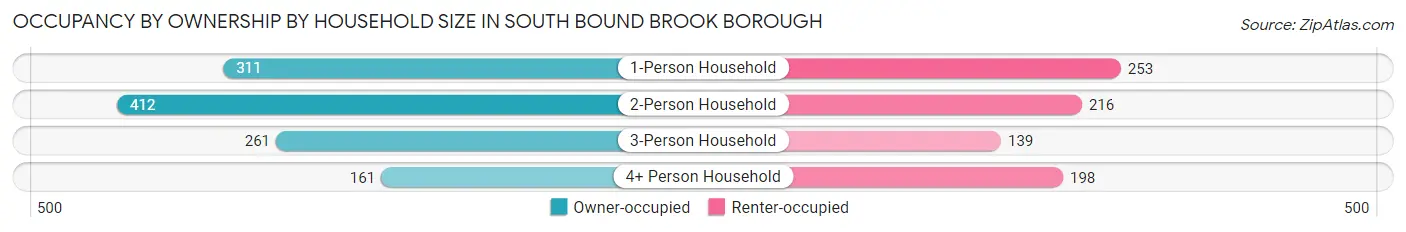
| Household Size | Owner-occupied | Renter-occupied |
| 1-Person Household | 311 (55.1%) | 253 (44.9%) |
| 2-Person Household | 412 (65.6%) | 216 (34.4%) |
| 3-Person Household | 261 (65.2%) | 139 (34.7%) |
| 4+ Person Household | 161 (44.9%) | 198 (55.1%) |
| Total Housing Units | 1,145 (58.7%) | 806 (41.3%) |
Occupancy by Educational Attainment in South Bound Brook borough
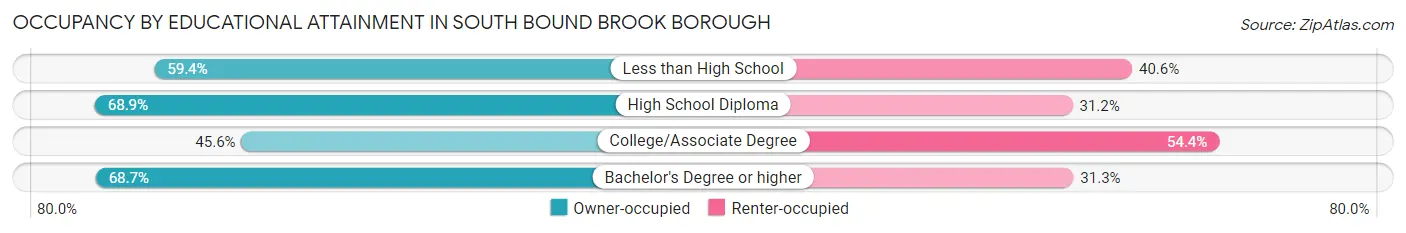
| Household Size | Owner-occupied | Renter-occupied |
| Less than High School | 60 (59.4%) | 41 (40.6%) |
| High School Diploma | 336 (68.9%) | 152 (31.1%) |
| College/Associate Degree | 369 (45.6%) | 440 (54.4%) |
| Bachelor's Degree or higher | 380 (68.7%) | 173 (31.3%) |
Occupancy by Age of Householder in South Bound Brook borough
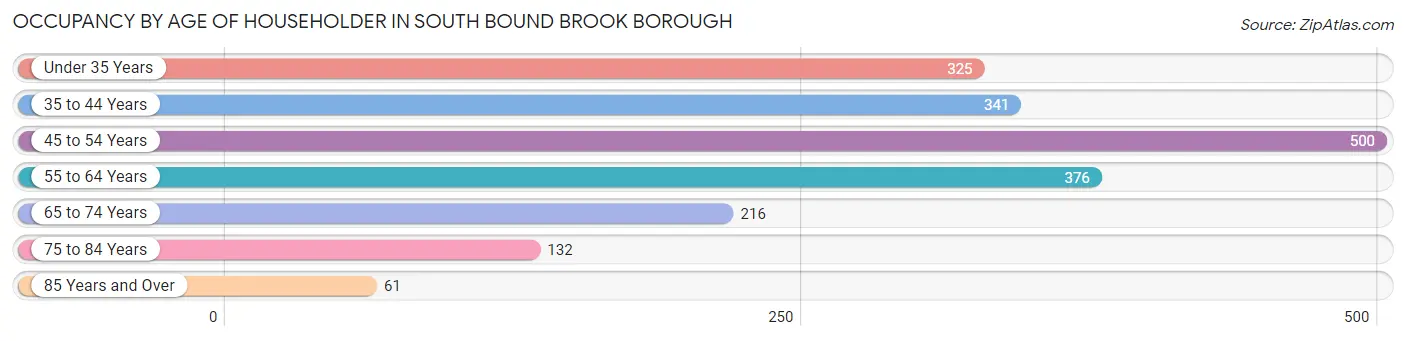
| Age Bracket | # Households | % Households |
| Under 35 Years | 325 | 16.7% |
| 35 to 44 Years | 341 | 17.5% |
| 45 to 54 Years | 500 | 25.6% |
| 55 to 64 Years | 376 | 19.3% |
| 65 to 74 Years | 216 | 11.1% |
| 75 to 84 Years | 132 | 6.8% |
| 85 Years and Over | 61 | 3.1% |
| Total | 1,951 | 100.0% |
Housing Finances in South Bound Brook borough
Median Income by Occupancy in South Bound Brook borough
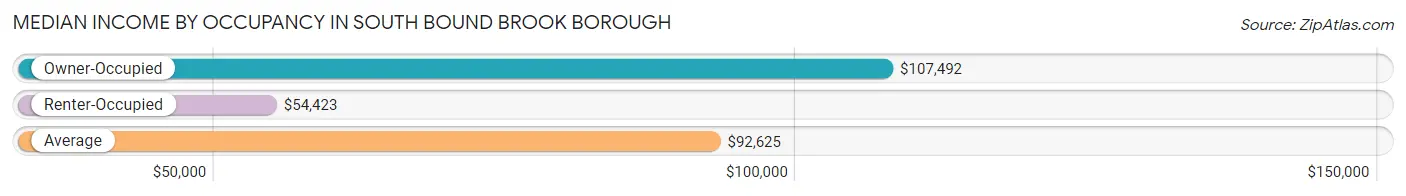
| Occupancy Type | # Households | Median Income |
| Owner-Occupied | 1,145 (58.7%) | $107,492 |
| Renter-Occupied | 806 (41.3%) | $54,423 |
| Average | 1,951 (100.0%) | $92,625 |
Occupancy by Householder Income Bracket in South Bound Brook borough
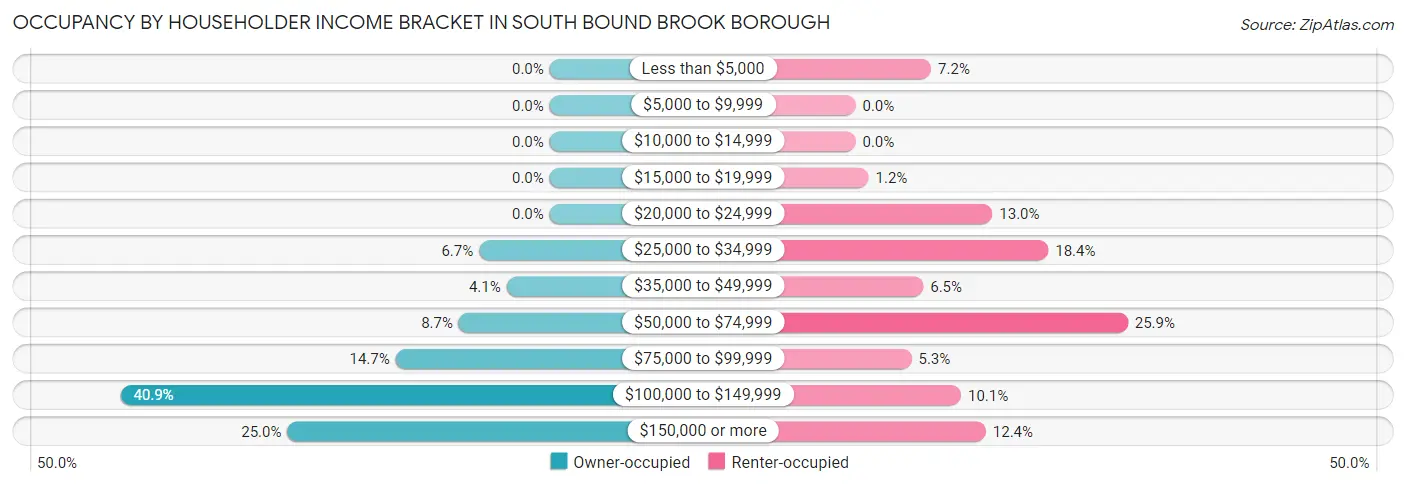
| Income Bracket | Owner-occupied | Renter-occupied |
| Less than $5,000 | 0 (0.0%) | 58 (7.2%) |
| $5,000 to $9,999 | 0 (0.0%) | 0 (0.0%) |
| $10,000 to $14,999 | 0 (0.0%) | 0 (0.0%) |
| $15,000 to $19,999 | 0 (0.0%) | 10 (1.2%) |
| $20,000 to $24,999 | 0 (0.0%) | 105 (13.0%) |
| $25,000 to $34,999 | 77 (6.7%) | 148 (18.4%) |
| $35,000 to $49,999 | 47 (4.1%) | 52 (6.5%) |
| $50,000 to $74,999 | 99 (8.6%) | 209 (25.9%) |
| $75,000 to $99,999 | 168 (14.7%) | 43 (5.3%) |
| $100,000 to $149,999 | 468 (40.9%) | 81 (10.1%) |
| $150,000 or more | 286 (25.0%) | 100 (12.4%) |
| Total | 1,145 (100.0%) | 806 (100.0%) |
Monthly Housing Cost Tiers in South Bound Brook borough
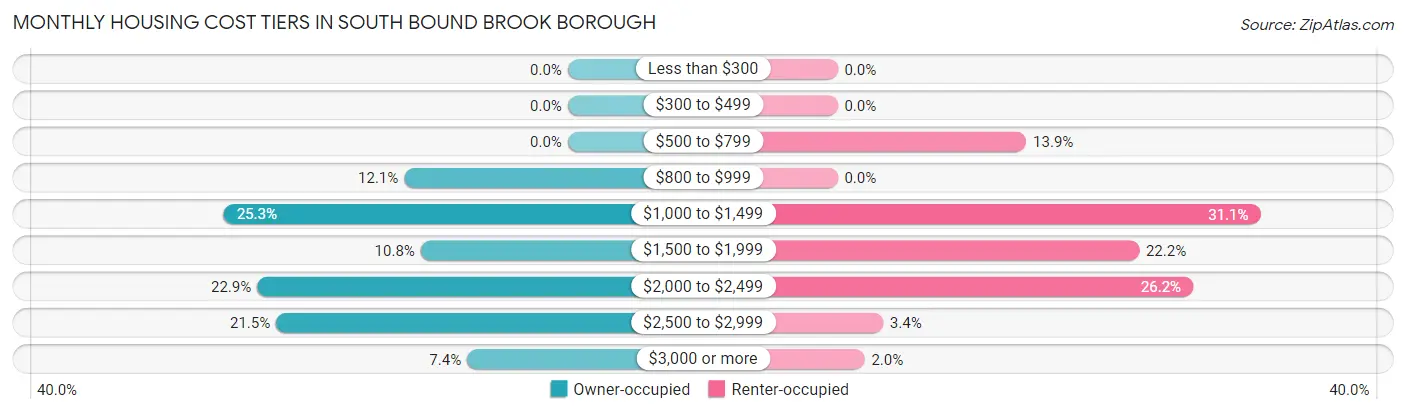
| Monthly Cost | Owner-occupied | Renter-occupied |
| Less than $300 | 0 (0.0%) | 0 (0.0%) |
| $300 to $499 | 0 (0.0%) | 0 (0.0%) |
| $500 to $799 | 0 (0.0%) | 112 (13.9%) |
| $800 to $999 | 138 (12.0%) | 0 (0.0%) |
| $1,000 to $1,499 | 290 (25.3%) | 251 (31.1%) |
| $1,500 to $1,999 | 124 (10.8%) | 179 (22.2%) |
| $2,000 to $2,499 | 262 (22.9%) | 211 (26.2%) |
| $2,500 to $2,999 | 246 (21.5%) | 27 (3.4%) |
| $3,000 or more | 85 (7.4%) | 16 (2.0%) |
| Total | 1,145 (100.0%) | 806 (100.0%) |
Physical Housing Characteristics in South Bound Brook borough
Housing Structures in South Bound Brook borough
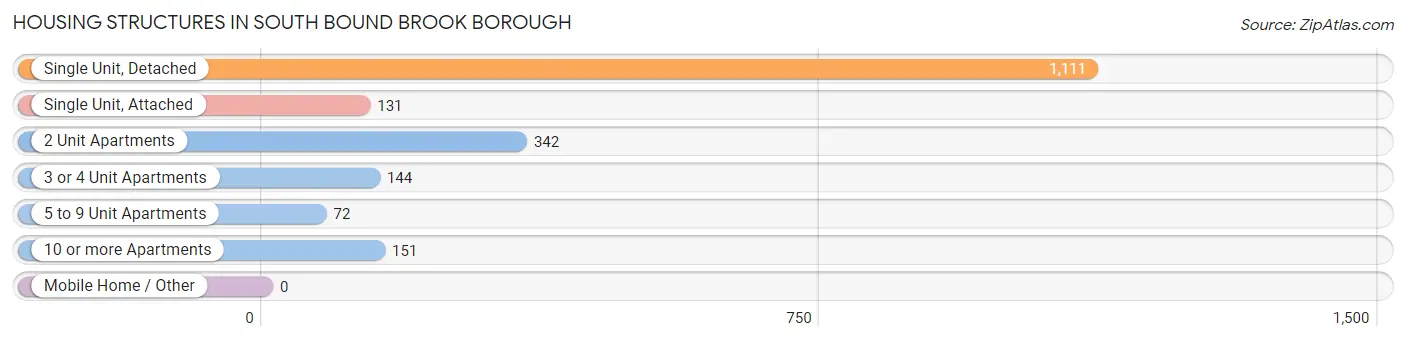
| Structure Type | # Housing Units | % Housing Units |
| Single Unit, Detached | 1,111 | 57.0% |
| Single Unit, Attached | 131 | 6.7% |
| 2 Unit Apartments | 342 | 17.5% |
| 3 or 4 Unit Apartments | 144 | 7.4% |
| 5 to 9 Unit Apartments | 72 | 3.7% |
| 10 or more Apartments | 151 | 7.7% |
| Mobile Home / Other | 0 | 0.0% |
| Total | 1,951 | 100.0% |
Housing Structures by Occupancy in South Bound Brook borough
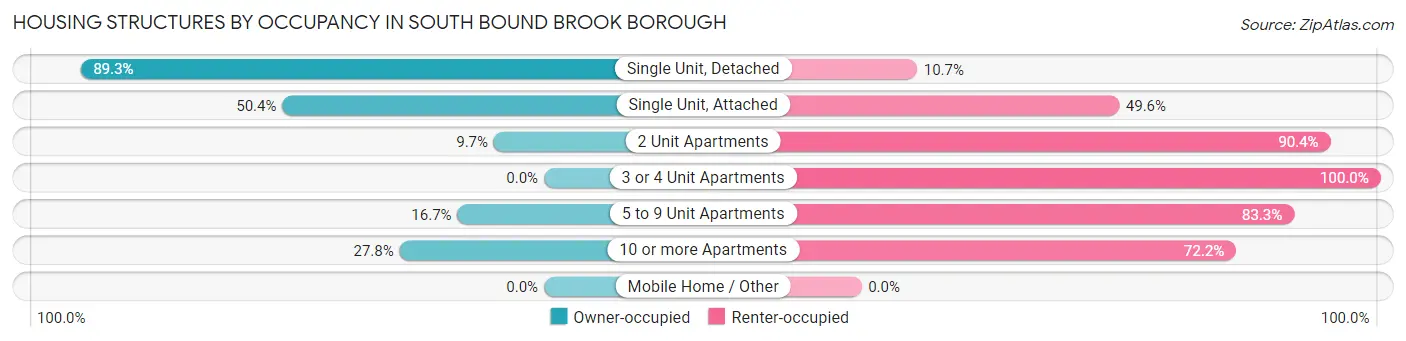
| Structure Type | Owner-occupied | Renter-occupied |
| Single Unit, Detached | 992 (89.3%) | 119 (10.7%) |
| Single Unit, Attached | 66 (50.4%) | 65 (49.6%) |
| 2 Unit Apartments | 33 (9.7%) | 309 (90.3%) |
| 3 or 4 Unit Apartments | 0 (0.0%) | 144 (100.0%) |
| 5 to 9 Unit Apartments | 12 (16.7%) | 60 (83.3%) |
| 10 or more Apartments | 42 (27.8%) | 109 (72.2%) |
| Mobile Home / Other | 0 (0.0%) | 0 (0.0%) |
| Total | 1,145 (58.7%) | 806 (41.3%) |
Housing Structures by Number of Rooms in South Bound Brook borough
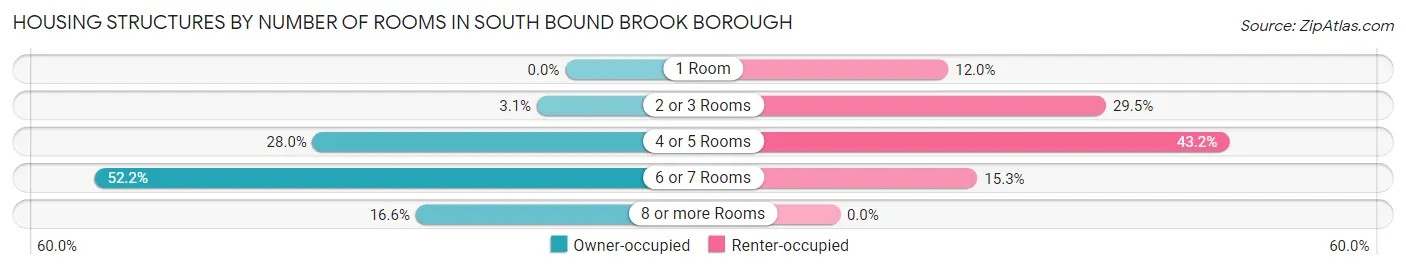
| Number of Rooms | Owner-occupied | Renter-occupied |
| 1 Room | 0 (0.0%) | 97 (12.0%) |
| 2 or 3 Rooms | 36 (3.1%) | 238 (29.5%) |
| 4 or 5 Rooms | 321 (28.0%) | 348 (43.2%) |
| 6 or 7 Rooms | 598 (52.2%) | 123 (15.3%) |
| 8 or more Rooms | 190 (16.6%) | 0 (0.0%) |
| Total | 1,145 (100.0%) | 806 (100.0%) |
Housing Structure by Heating Type in South Bound Brook borough
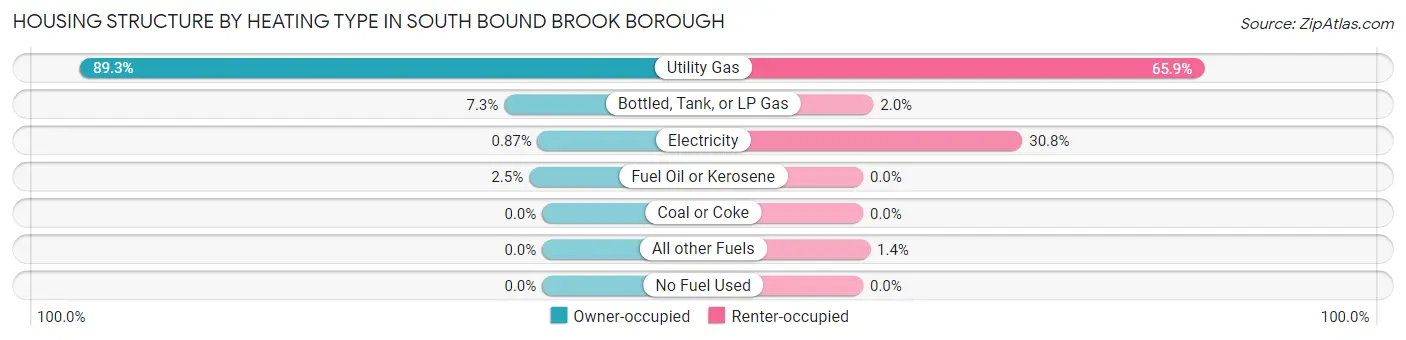
| Heating Type | Owner-occupied | Renter-occupied |
| Utility Gas | 1,022 (89.3%) | 531 (65.9%) |
| Bottled, Tank, or LP Gas | 84 (7.3%) | 16 (2.0%) |
| Electricity | 10 (0.9%) | 248 (30.8%) |
| Fuel Oil or Kerosene | 29 (2.5%) | 0 (0.0%) |
| Coal or Coke | 0 (0.0%) | 0 (0.0%) |
| All other Fuels | 0 (0.0%) | 11 (1.4%) |
| No Fuel Used | 0 (0.0%) | 0 (0.0%) |
| Total | 1,145 (100.0%) | 806 (100.0%) |
Household Vehicle Usage in South Bound Brook borough
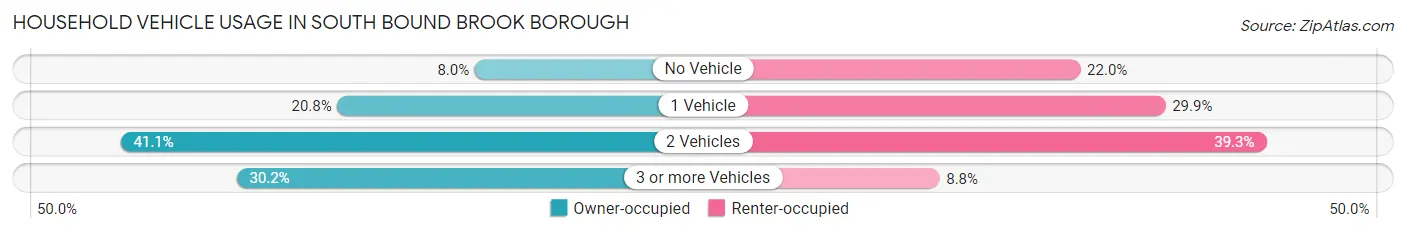
| Vehicles per Household | Owner-occupied | Renter-occupied |
| No Vehicle | 91 (8.0%) | 177 (22.0%) |
| 1 Vehicle | 238 (20.8%) | 241 (29.9%) |
| 2 Vehicles | 470 (41.0%) | 317 (39.3%) |
| 3 or more Vehicles | 346 (30.2%) | 71 (8.8%) |
| Total | 1,145 (100.0%) | 806 (100.0%) |
Real Estate & Mortgages in South Bound Brook borough
Real Estate and Mortgage Overview in South Bound Brook borough
| Characteristic | Without Mortgage | With Mortgage |
| Housing Units | 390 | 755 |
| Median Property Value | $317,000 | $316,400 |
| Median Household Income | $110,250 | $229 |
| Monthly Housing Costs | $1,053 | $85 |
| Real Estate Taxes | $8,734 | $0 |
Property Value by Mortgage Status in South Bound Brook borough
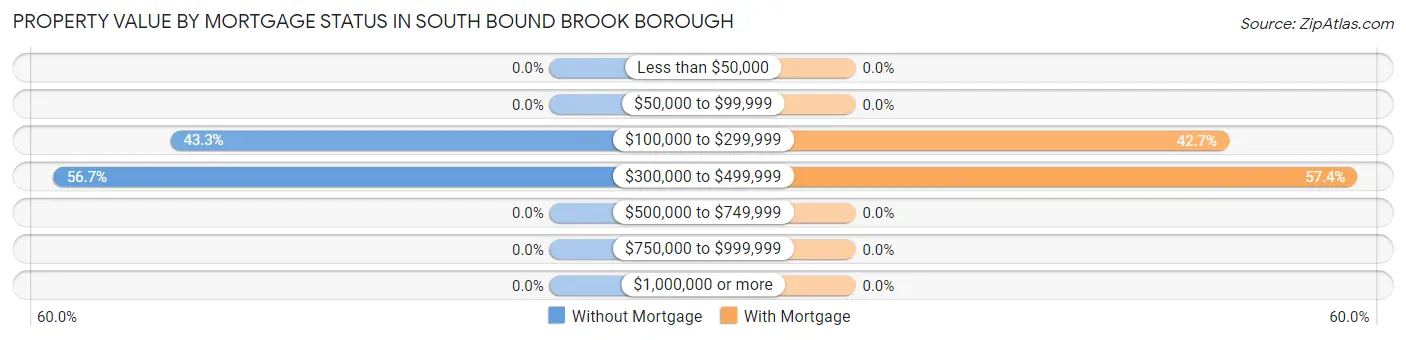
| Property Value | Without Mortgage | With Mortgage |
| Less than $50,000 | 0 (0.0%) | 0 (0.0%) |
| $50,000 to $99,999 | 0 (0.0%) | 0 (0.0%) |
| $100,000 to $299,999 | 169 (43.3%) | 322 (42.6%) |
| $300,000 to $499,999 | 221 (56.7%) | 433 (57.4%) |
| $500,000 to $749,999 | 0 (0.0%) | 0 (0.0%) |
| $750,000 to $999,999 | 0 (0.0%) | 0 (0.0%) |
| $1,000,000 or more | 0 (0.0%) | 0 (0.0%) |
| Total | 390 (100.0%) | 755 (100.0%) |
Household Income by Mortgage Status in South Bound Brook borough
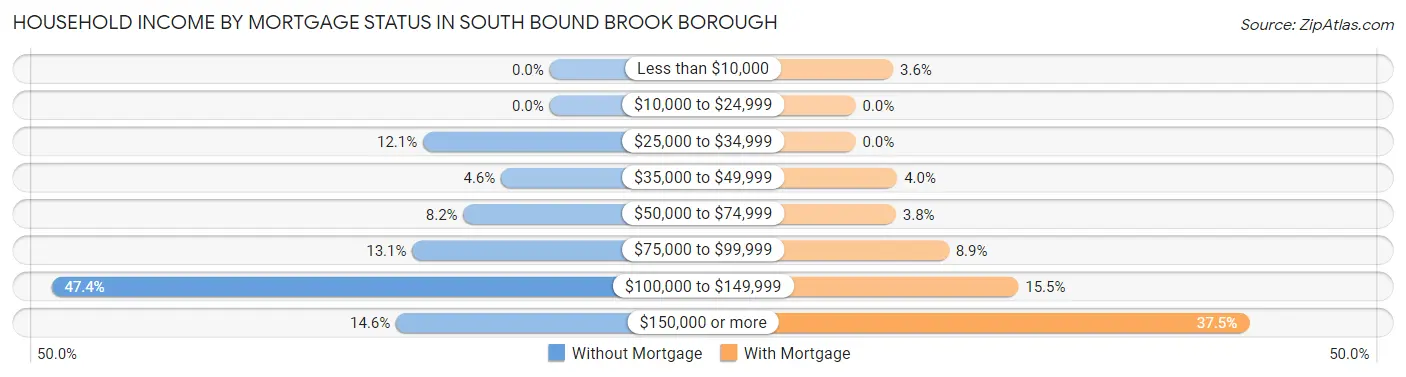
| Household Income | Without Mortgage | With Mortgage |
| Less than $10,000 | 0 (0.0%) | 27 (3.6%) |
| $10,000 to $24,999 | 0 (0.0%) | 0 (0.0%) |
| $25,000 to $34,999 | 47 (12.0%) | 0 (0.0%) |
| $35,000 to $49,999 | 18 (4.6%) | 30 (4.0%) |
| $50,000 to $74,999 | 32 (8.2%) | 29 (3.8%) |
| $75,000 to $99,999 | 51 (13.1%) | 67 (8.9%) |
| $100,000 to $149,999 | 185 (47.4%) | 117 (15.5%) |
| $150,000 or more | 57 (14.6%) | 283 (37.5%) |
| Total | 390 (100.0%) | 755 (100.0%) |
Property Value to Household Income Ratio in South Bound Brook borough
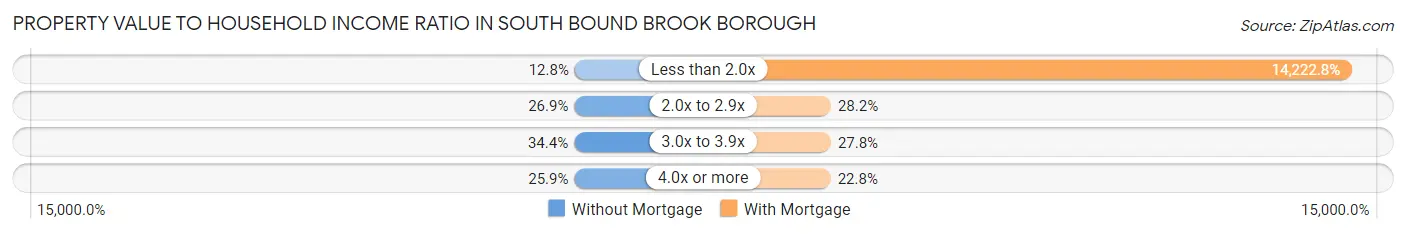
| Value-to-Income Ratio | Without Mortgage | With Mortgage |
| Less than 2.0x | 50 (12.8%) | 107,382 (14,222.8%) |
| 2.0x to 2.9x | 105 (26.9%) | 213 (28.2%) |
| 3.0x to 3.9x | 134 (34.4%) | 210 (27.8%) |
| 4.0x or more | 101 (25.9%) | 172 (22.8%) |
| Total | 390 (100.0%) | 755 (100.0%) |
Real Estate Taxes by Mortgage Status in South Bound Brook borough
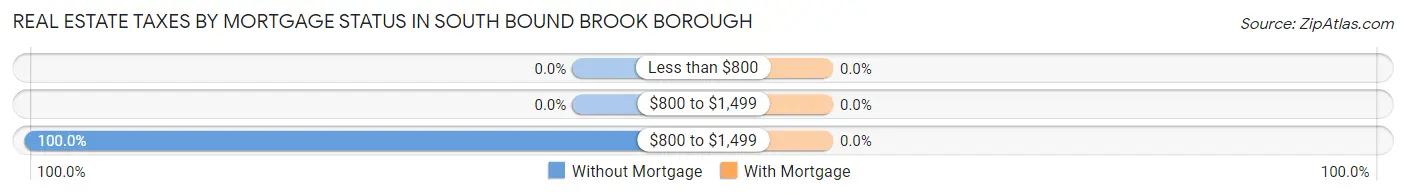
| Property Taxes | Without Mortgage | With Mortgage |
| Less than $800 | 0 (0.0%) | 0 (0.0%) |
| $800 to $1,499 | 0 (0.0%) | 0 (0.0%) |
| $800 to $1,499 | 390 (100.0%) | 0 (0.0%) |
| Total | 390 (100.0%) | 755 (100.0%) |
Health & Disability in South Bound Brook borough
Health Insurance Coverage by Age in South Bound Brook borough
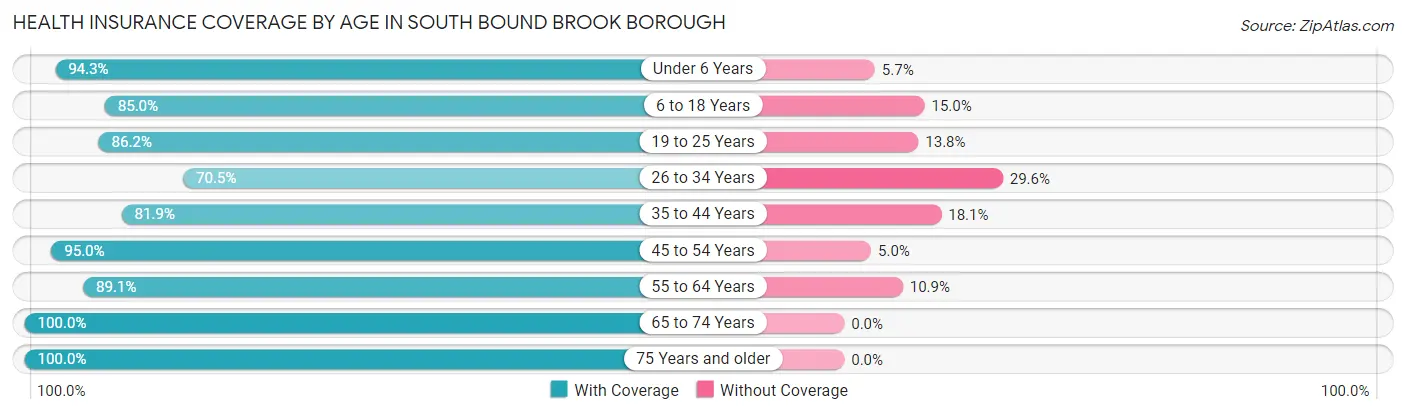
| Age Bracket | With Coverage | Without Coverage |
| Under 6 Years | 231 (94.3%) | 14 (5.7%) |
| 6 to 18 Years | 693 (85.0%) | 122 (15.0%) |
| 19 to 25 Years | 337 (86.2%) | 54 (13.8%) |
| 26 to 34 Years | 496 (70.5%) | 208 (29.5%) |
| 35 to 44 Years | 639 (81.9%) | 141 (18.1%) |
| 45 to 54 Years | 703 (95.0%) | 37 (5.0%) |
| 55 to 64 Years | 531 (89.1%) | 65 (10.9%) |
| 65 to 74 Years | 289 (100.0%) | 0 (0.0%) |
| 75 Years and older | 278 (100.0%) | 0 (0.0%) |
| Total | 4,197 (86.8%) | 641 (13.3%) |
Health Insurance Coverage by Citizenship Status in South Bound Brook borough
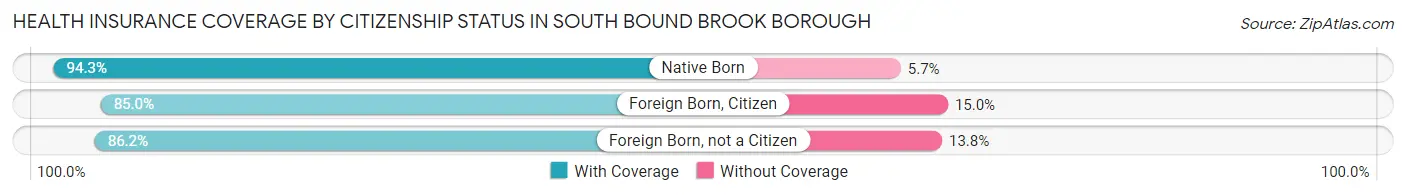
| Citizenship Status | With Coverage | Without Coverage |
| Native Born | 231 (94.3%) | 14 (5.7%) |
| Foreign Born, Citizen | 693 (85.0%) | 122 (15.0%) |
| Foreign Born, not a Citizen | 337 (86.2%) | 54 (13.8%) |
Health Insurance Coverage by Household Income in South Bound Brook borough
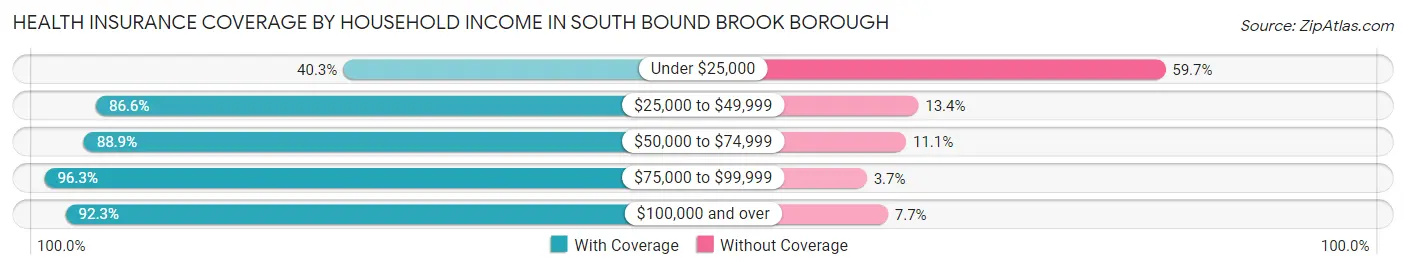
| Household Income | With Coverage | Without Coverage |
| Under $25,000 | 169 (40.3%) | 250 (59.7%) |
| $25,000 to $49,999 | 491 (86.6%) | 76 (13.4%) |
| $50,000 to $74,999 | 729 (88.9%) | 91 (11.1%) |
| $75,000 to $99,999 | 516 (96.3%) | 20 (3.7%) |
| $100,000 and over | 2,281 (92.3%) | 190 (7.7%) |
Public vs Private Health Insurance Coverage by Age in South Bound Brook borough
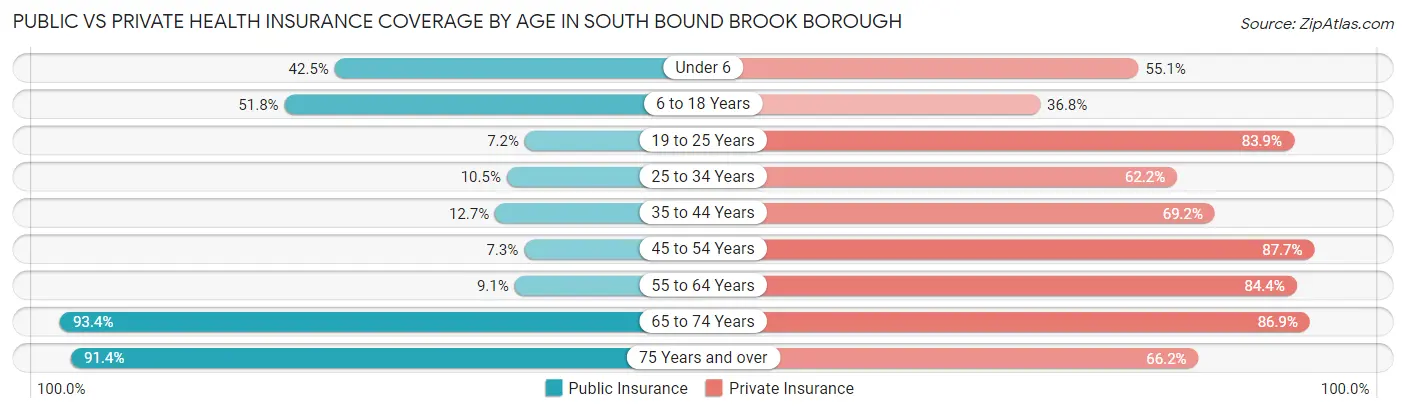
| Age Bracket | Public Insurance | Private Insurance |
| Under 6 | 104 (42.4%) | 135 (55.1%) |
| 6 to 18 Years | 422 (51.8%) | 300 (36.8%) |
| 19 to 25 Years | 28 (7.2%) | 328 (83.9%) |
| 25 to 34 Years | 74 (10.5%) | 438 (62.2%) |
| 35 to 44 Years | 99 (12.7%) | 540 (69.2%) |
| 45 to 54 Years | 54 (7.3%) | 649 (87.7%) |
| 55 to 64 Years | 54 (9.1%) | 503 (84.4%) |
| 65 to 74 Years | 270 (93.4%) | 251 (86.9%) |
| 75 Years and over | 254 (91.4%) | 184 (66.2%) |
| Total | 1,359 (28.1%) | 3,328 (68.8%) |
Disability Status by Sex by Age in South Bound Brook borough
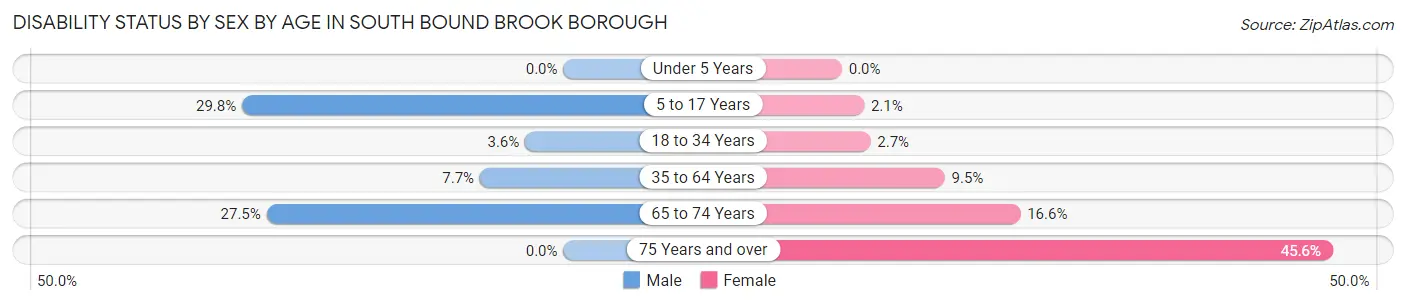
| Age Bracket | Male | Female |
| Under 5 Years | 0 (0.0%) | 0 (0.0%) |
| 5 to 17 Years | 113 (29.8%) | 8 (2.1%) |
| 18 to 34 Years | 23 (3.5%) | 14 (2.6%) |
| 35 to 64 Years | 81 (7.7%) | 102 (9.5%) |
| 65 to 74 Years | 38 (27.5%) | 25 (16.6%) |
| 75 Years and over | 0 (0.0%) | 72 (45.6%) |
Disability Class by Sex by Age in South Bound Brook borough
Disability Class: Hearing Difficulty
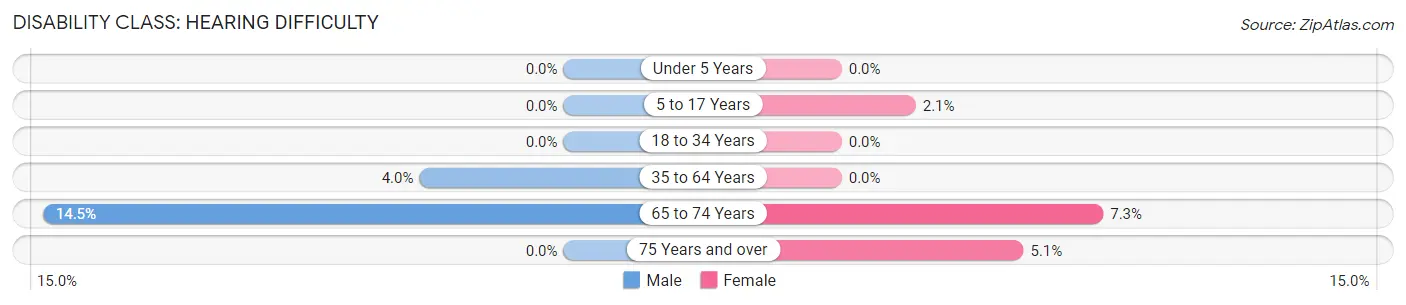
| Age Bracket | Male | Female |
| Under 5 Years | 0 (0.0%) | 0 (0.0%) |
| 5 to 17 Years | 0 (0.0%) | 8 (2.1%) |
| 18 to 34 Years | 0 (0.0%) | 0 (0.0%) |
| 35 to 64 Years | 42 (4.0%) | 0 (0.0%) |
| 65 to 74 Years | 20 (14.5%) | 11 (7.3%) |
| 75 Years and over | 0 (0.0%) | 8 (5.1%) |
Disability Class: Vision Difficulty
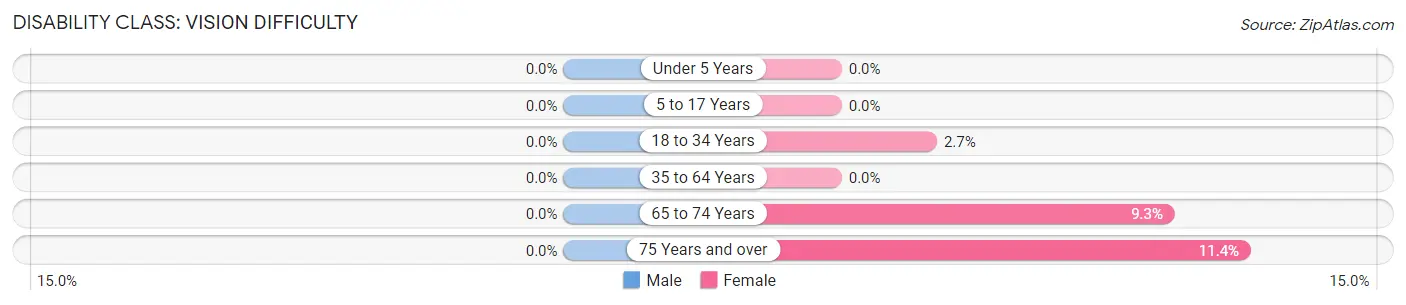
| Age Bracket | Male | Female |
| Under 5 Years | 0 (0.0%) | 0 (0.0%) |
| 5 to 17 Years | 0 (0.0%) | 0 (0.0%) |
| 18 to 34 Years | 0 (0.0%) | 14 (2.6%) |
| 35 to 64 Years | 0 (0.0%) | 0 (0.0%) |
| 65 to 74 Years | 0 (0.0%) | 14 (9.3%) |
| 75 Years and over | 0 (0.0%) | 18 (11.4%) |
Disability Class: Cognitive Difficulty
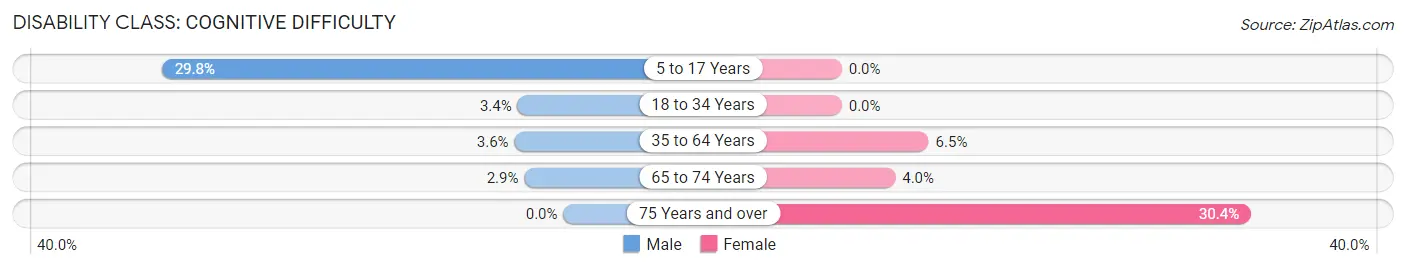
| Age Bracket | Male | Female |
| 5 to 17 Years | 113 (29.8%) | 0 (0.0%) |
| 18 to 34 Years | 22 (3.4%) | 0 (0.0%) |
| 35 to 64 Years | 38 (3.6%) | 69 (6.5%) |
| 65 to 74 Years | 4 (2.9%) | 6 (4.0%) |
| 75 Years and over | 0 (0.0%) | 48 (30.4%) |
Disability Class: Ambulatory Difficulty
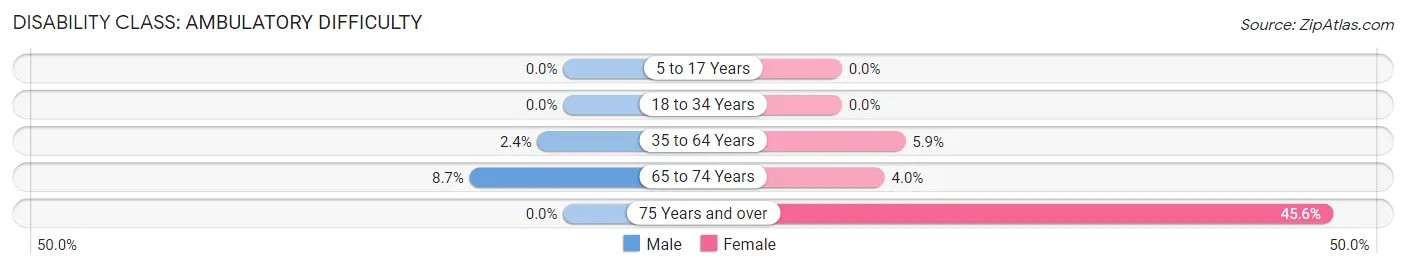
| Age Bracket | Male | Female |
| 5 to 17 Years | 0 (0.0%) | 0 (0.0%) |
| 18 to 34 Years | 0 (0.0%) | 0 (0.0%) |
| 35 to 64 Years | 25 (2.4%) | 63 (5.9%) |
| 65 to 74 Years | 12 (8.7%) | 6 (4.0%) |
| 75 Years and over | 0 (0.0%) | 72 (45.6%) |
Disability Class: Self-Care Difficulty
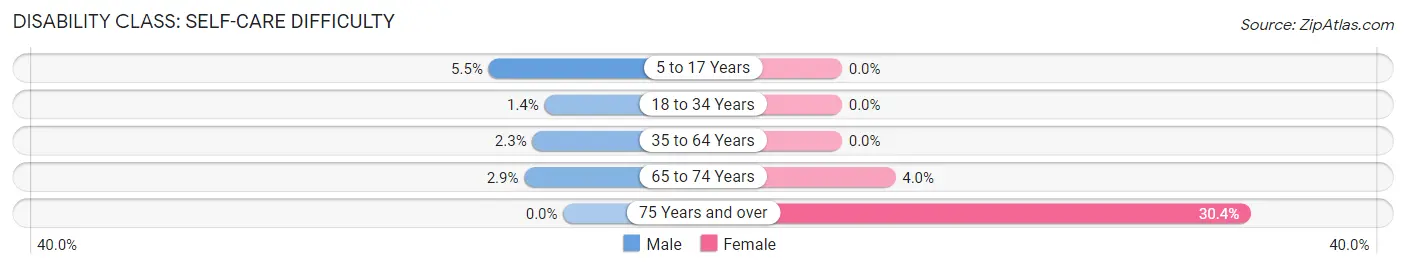
| Age Bracket | Male | Female |
| 5 to 17 Years | 21 (5.5%) | 0 (0.0%) |
| 18 to 34 Years | 9 (1.4%) | 0 (0.0%) |
| 35 to 64 Years | 24 (2.3%) | 0 (0.0%) |
| 65 to 74 Years | 4 (2.9%) | 6 (4.0%) |
| 75 Years and over | 0 (0.0%) | 48 (30.4%) |
Technology Access in South Bound Brook borough
Computing Device Access in South Bound Brook borough
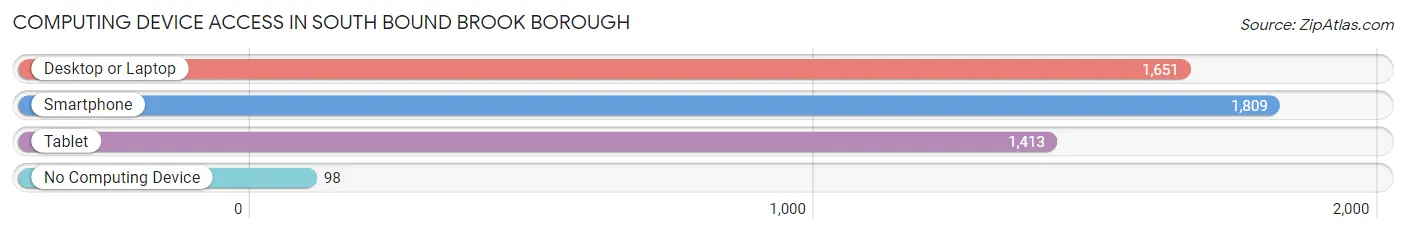
| Device Type | # Households | % Households |
| Desktop or Laptop | 1,651 | 84.6% |
| Smartphone | 1,809 | 92.7% |
| Tablet | 1,413 | 72.4% |
| No Computing Device | 98 | 5.0% |
| Total | 1,951 | 100.0% |
Internet Access in South Bound Brook borough
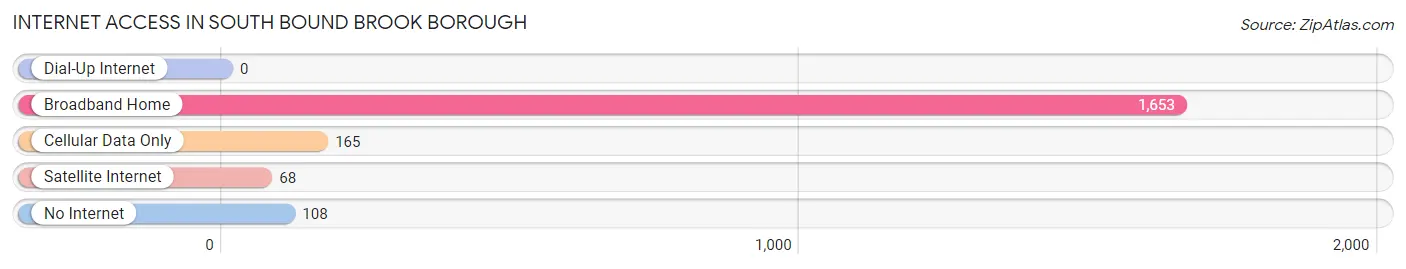
| Internet Type | # Households | % Households |
| Dial-Up Internet | 0 | 0.0% |
| Broadband Home | 1,653 | 84.7% |
| Cellular Data Only | 165 | 8.5% |
| Satellite Internet | 68 | 3.5% |
| No Internet | 108 | 5.5% |
| Total | 1,951 | 100.0% |
South Bound Brook borough Summary
South Bound Brook Borough is a small borough located in Somerset County, New Jersey. It is situated on the Raritan River, and is part of the larger metropolitan area of New York City. The borough has a population of 4,563 as of the 2010 census, and is home to a diverse population of people from all walks of life.
History
South Bound Brook was originally inhabited by the Lenape Native Americans, who called the area “Minkakwa”, meaning “place of the beaver”. The area was first settled by Europeans in the early 1700s, and was part of Franklin Township until it was incorporated as a borough in 1907. The borough was named after the South Branch of the Raritan River, which runs through the town.
The borough was an important transportation hub in the 19th century, as it was located at the intersection of the Morris Canal and the Central Railroad of New Jersey. The Morris Canal was an important transportation route for goods and passengers, and the Central Railroad of New Jersey provided passenger service to New York City.
The borough was also home to several important industries, including a paper mill, a brickyard, and a tannery. The paper mill was the largest employer in the borough, and the brickyard and tannery provided employment for many of the borough’s residents.
Geography
South Bound Brook is located at 40°32'17" North, 74°31'17" West (40.538, -74.521). It is situated on the Raritan River, and is bordered by Bridgewater Township to the north, Franklin Township to the east, and Manville to the south. The borough has a total area of 1.2 square miles, all of which is land.
The borough is located in the Raritan Valley, a region of the state that is known for its rolling hills and lush farmland. The borough is also home to several parks, including the South Bound Brook Park, which features a playground, picnic area, and walking trails.
Economy
The economy of South Bound Brook is largely based on manufacturing and retail. The borough is home to several manufacturing companies, including a paper mill, a brickyard, and a tannery. The paper mill is the largest employer in the borough, and the brickyard and tannery provide employment for many of the borough’s residents.
The borough is also home to several retail stores, including a grocery store, a pharmacy, and a hardware store. The borough is also home to several restaurants, including a pizzeria, a Chinese restaurant, and a Mexican restaurant.
Demographics
As of the 2010 census, the population of South Bound Brook was 4,563. The racial makeup of the borough was 79.2% White, 11.2% African American, 0.3% Native American, 2.2% Asian, and 6.9% from other races. Hispanic or Latino of any race were 15.2% of the population.
The median household income in the borough was $50,945, and the median family income was $60,917. The per capita income in the borough was $25,945. About 8.2% of families and 10.2% of the population were below the poverty line, including 14.2% of those under age 18 and 8.2% of those age 65 or over.
Common Questions
What is Per Capita Income in South Bound Brook borough?
Per Capita income in South Bound Brook borough is $39,845.
What is the Median Family Income in South Bound Brook borough?
Median Family Income in South Bound Brook borough is $106,122.
What is the Median Household income in South Bound Brook borough?
Median Household Income in South Bound Brook borough is $92,625.
What is Income or Wage Gap in South Bound Brook borough?
Income or Wage Gap in South Bound Brook borough is 3.7%.
Women in South Bound Brook borough earn 96.3 cents for every dollar earned by a man.
What is Inequality or Gini Index in South Bound Brook borough?
Inequality or Gini Index in South Bound Brook borough is 0.37.
What is the Total Population of South Bound Brook borough?
Total Population of South Bound Brook borough is 4,838.
What is the Total Male Population of South Bound Brook borough?
Total Male Population of South Bound Brook borough is 2,445.
What is the Total Female Population of South Bound Brook borough?
Total Female Population of South Bound Brook borough is 2,393.
What is the Ratio of Males per 100 Females in South Bound Brook borough?
There are 102.17 Males per 100 Females in South Bound Brook borough.
What is the Ratio of Females per 100 Males in South Bound Brook borough?
There are 97.87 Females per 100 Males in South Bound Brook borough.
What is the Median Population Age in South Bound Brook borough?
Median Population Age in South Bound Brook borough is 37.7 Years.
What is the Average Family Size in South Bound Brook borough
Average Family Size in South Bound Brook borough is 3.1 People.
What is the Average Household Size in South Bound Brook borough
Average Household Size in South Bound Brook borough is 2.5 People.
How Large is the Labor Force in South Bound Brook borough?
There are 3,018 People in the Labor Forcein in South Bound Brook borough.
What is the Percentage of People in the Labor Force in South Bound Brook borough?
76.1% of People are in the Labor Force in South Bound Brook borough.
What is the Unemployment Rate in South Bound Brook borough?
Unemployment Rate in South Bound Brook borough is 7.3%.