Roosevelt borough, NJ Map & Demographics
Roosevelt borough Overview
$41,976
PER CAPITA INCOME
$108,750
AVG FAMILY INCOME
$101,339
AVG HOUSEHOLD INCOME
12.7%
WAGE / INCOME GAP [ % ]
87.3¢/ $1
WAGE / INCOME GAP [ $ ]
0.36
INEQUALITY / GINI INDEX
1,037
TOTAL POPULATION
463
MALE POPULATION
574
FEMALE POPULATION
80.66
MALES / 100 FEMALES
123.97
FEMALES / 100 MALES
38.3
MEDIAN AGE
3.5
AVG FAMILY SIZE
3.1
AVG HOUSEHOLD SIZE
476
LABOR FORCE [ PEOPLE ]
65.6%
PERCENT IN LABOR FORCE
3.6%
UNEMPLOYMENT RATE
Income in Roosevelt borough
Income Overview in Roosevelt borough
Per Capita Income in Roosevelt borough is $41,976, while median incomes of families and households are $108,750 and $101,339 respectively.
| Characteristic | Number | Measure |
| Per Capita Income | 1,037 | $41,976 |
| Median Family Income | 274 | $108,750 |
| Mean Family Income | 274 | $142,027 |
| Median Household Income | 335 | $101,339 |
| Mean Household Income | 335 | $129,638 |
| Income Deficit | 274 | $0 |
| Wage / Income Gap (%) | 1,037 | 12.66% |
| Wage / Income Gap ($) | 1,037 | 87.34¢ per $1 |
| Gini / Inequality Index | 1,037 | 0.36 |
Earnings by Sex in Roosevelt borough
Average Earnings in Roosevelt borough are $53,750, $58,750 for men and $51,310 for women, a difference of 12.7%.
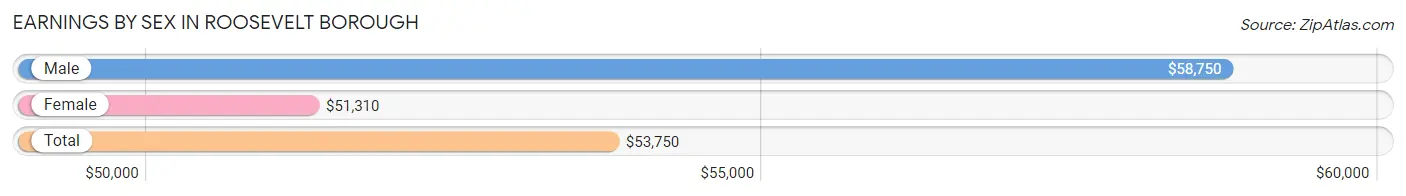
| Sex | Number | Average Earnings |
| Male | 276 (55.2%) | $58,750 |
| Female | 224 (44.8%) | $51,310 |
| Total | 500 (100.0%) | $53,750 |
Earnings by Sex by Income Bracket in Roosevelt borough
The most common earnings brackets in Roosevelt borough are $100,000+ for men (77 | 27.9%) and $75,000 to $99,999 for women (34 | 15.2%).
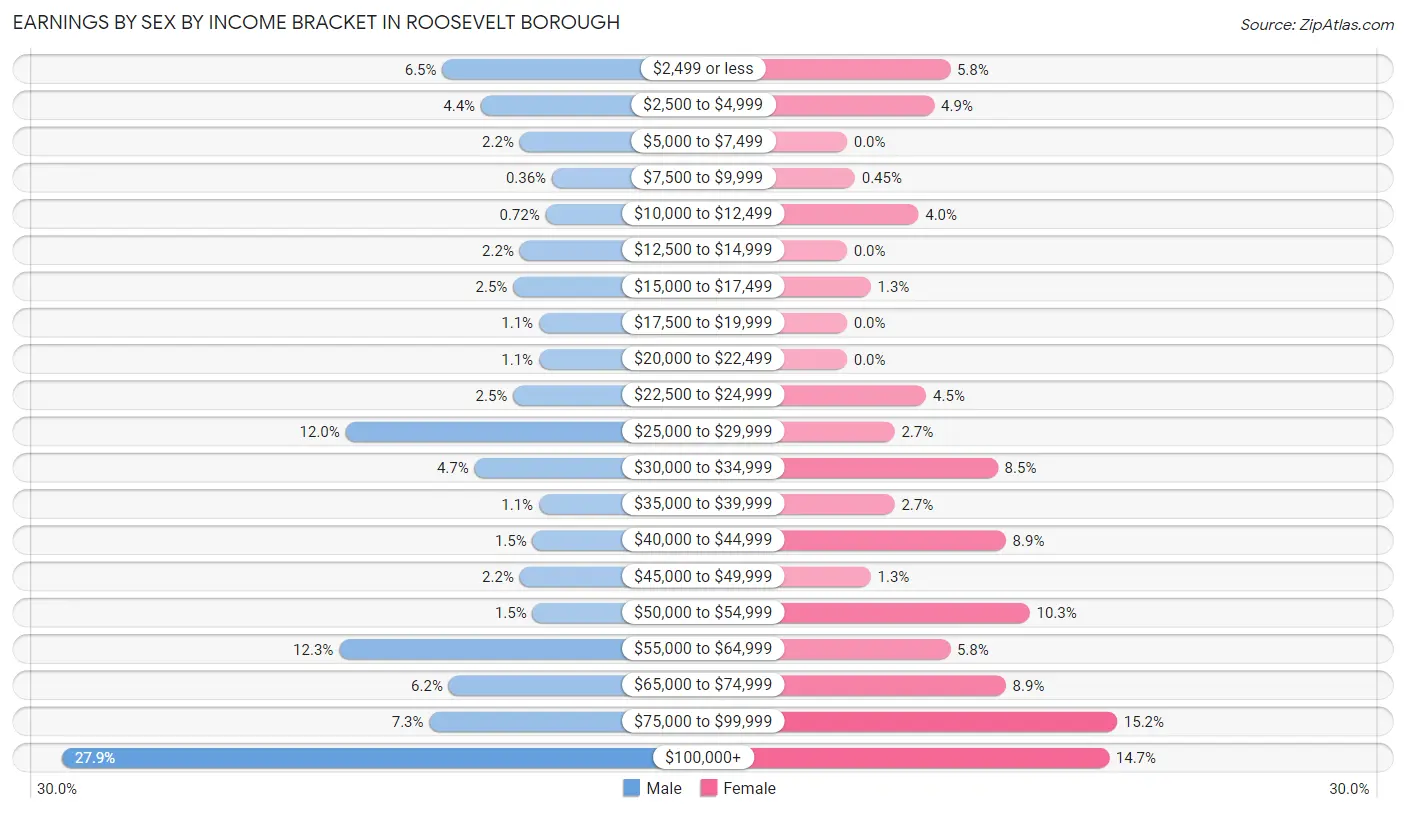
| Income | Male | Female |
| $2,499 or less | 18 (6.5%) | 13 (5.8%) |
| $2,500 to $4,999 | 12 (4.3%) | 11 (4.9%) |
| $5,000 to $7,499 | 6 (2.2%) | 0 (0.0%) |
| $7,500 to $9,999 | 1 (0.4%) | 1 (0.4%) |
| $10,000 to $12,499 | 2 (0.7%) | 9 (4.0%) |
| $12,500 to $14,999 | 6 (2.2%) | 0 (0.0%) |
| $15,000 to $17,499 | 7 (2.5%) | 3 (1.3%) |
| $17,500 to $19,999 | 3 (1.1%) | 0 (0.0%) |
| $20,000 to $22,499 | 3 (1.1%) | 0 (0.0%) |
| $22,500 to $24,999 | 7 (2.5%) | 10 (4.5%) |
| $25,000 to $29,999 | 33 (12.0%) | 6 (2.7%) |
| $30,000 to $34,999 | 13 (4.7%) | 19 (8.5%) |
| $35,000 to $39,999 | 3 (1.1%) | 6 (2.7%) |
| $40,000 to $44,999 | 4 (1.5%) | 20 (8.9%) |
| $45,000 to $49,999 | 6 (2.2%) | 3 (1.3%) |
| $50,000 to $54,999 | 4 (1.5%) | 23 (10.3%) |
| $55,000 to $64,999 | 34 (12.3%) | 13 (5.8%) |
| $65,000 to $74,999 | 17 (6.2%) | 20 (8.9%) |
| $75,000 to $99,999 | 20 (7.2%) | 34 (15.2%) |
| $100,000+ | 77 (27.9%) | 33 (14.7%) |
| Total | 276 (100.0%) | 224 (100.0%) |
Earnings by Sex by Educational Attainment in Roosevelt borough
Average earnings in Roosevelt borough are $64,000 for men and $56,000 for women, a difference of 12.5%. Men with an educational attainment of graduate degree enjoy the highest average annual earnings of $103,750, while those with college or associate's degree education earn the least with $27,419. Women with an educational attainment of graduate degree earn the most with the average annual earnings of $87,083, while those with high school diploma education have the smallest earnings of $32,386.
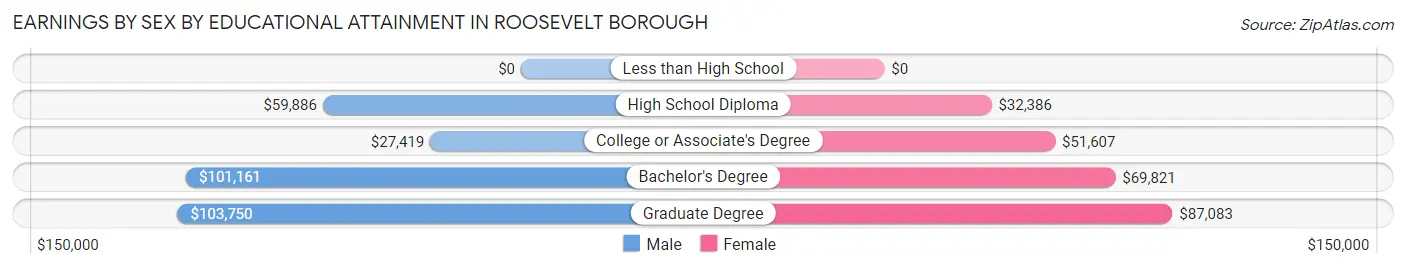
| Educational Attainment | Male Income | Female Income |
| Less than High School | - | - |
| High School Diploma | $59,886 | $32,386 |
| College or Associate's Degree | $27,419 | $51,607 |
| Bachelor's Degree | $101,161 | $69,821 |
| Graduate Degree | $103,750 | $87,083 |
| Total | $64,000 | $56,000 |
Family Income in Roosevelt borough
Family Income Brackets in Roosevelt borough
According to the Roosevelt borough family income data, there are 75 families falling into the $75,000 to $99,999 income range, which is the most common income bracket and makes up 27.4% of all families.
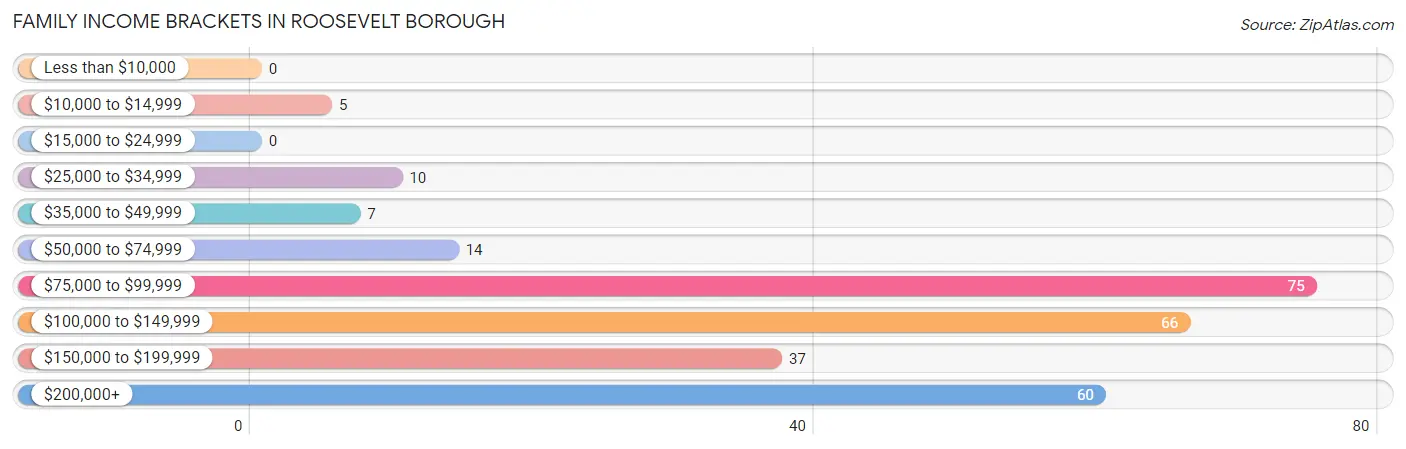
| Income Bracket | # Families | % Families |
| Less than $10,000 | 0 | 0.0% |
| $10,000 to $14,999 | 5 | 1.8% |
| $15,000 to $24,999 | 0 | 0.0% |
| $25,000 to $34,999 | 10 | 3.6% |
| $35,000 to $49,999 | 7 | 2.6% |
| $50,000 to $74,999 | 14 | 5.1% |
| $75,000 to $99,999 | 75 | 27.4% |
| $100,000 to $149,999 | 66 | 24.1% |
| $150,000 to $199,999 | 37 | 13.5% |
| $200,000+ | 60 | 21.9% |
Family Income by Famaliy Size in Roosevelt borough
6-person families (16 | 5.8%) account for the highest median family income in Roosevelt borough with $224,167 per family, while 2-person families (114 | 41.6%) have the highest median income of $65,536 per family member.
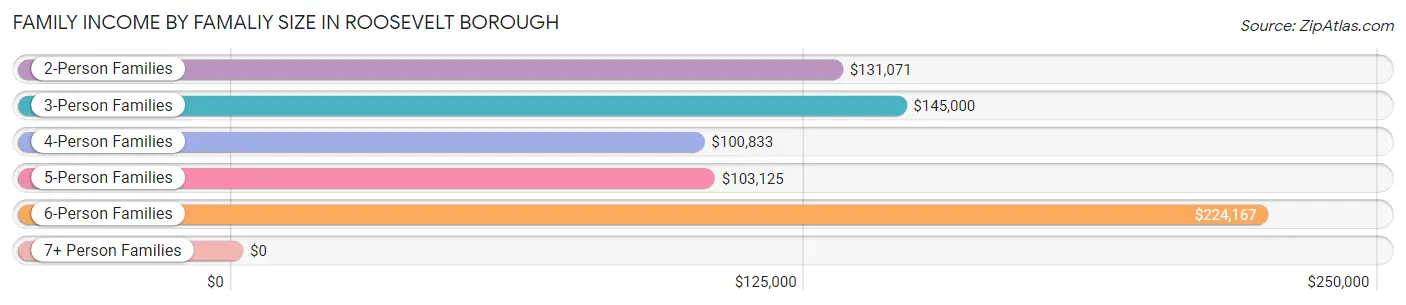
| Income Bracket | # Families | Median Income |
| 2-Person Families | 114 (41.6%) | $131,071 |
| 3-Person Families | 60 (21.9%) | $145,000 |
| 4-Person Families | 48 (17.5%) | $100,833 |
| 5-Person Families | 5 (1.8%) | $103,125 |
| 6-Person Families | 16 (5.8%) | $224,167 |
| 7+ Person Families | 31 (11.3%) | $0 |
| Total | 274 (100.0%) | $108,750 |
Family Income by Number of Earners in Roosevelt borough
The median family income in Roosevelt borough is $108,750, with families comprising 3+ earners (38) having the highest median family income of $145,000, while families with 1 earner (79) have the lowest median family income of $99,375, accounting for 13.9% and 28.8% of families, respectively.
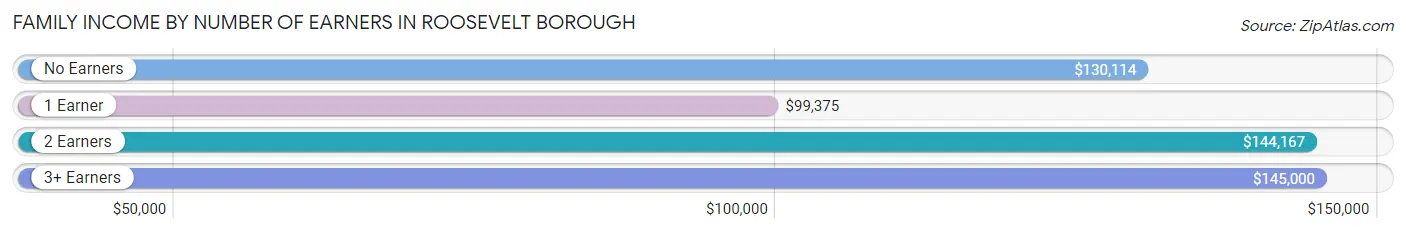
| Number of Earners | # Families | Median Income |
| No Earners | 31 (11.3%) | $130,114 |
| 1 Earner | 79 (28.8%) | $99,375 |
| 2 Earners | 126 (46.0%) | $144,167 |
| 3+ Earners | 38 (13.9%) | $145,000 |
| Total | 274 (100.0%) | $108,750 |
Household Income in Roosevelt borough
Household Income Brackets in Roosevelt borough
With 79 households falling in the category, the $75,000 to $99,999 income range is the most frequent in Roosevelt borough, accounting for 23.6% of all households. In contrast, only 1 households (0.3%) fall into the less than $10,000 income bracket, making it the least populous group.
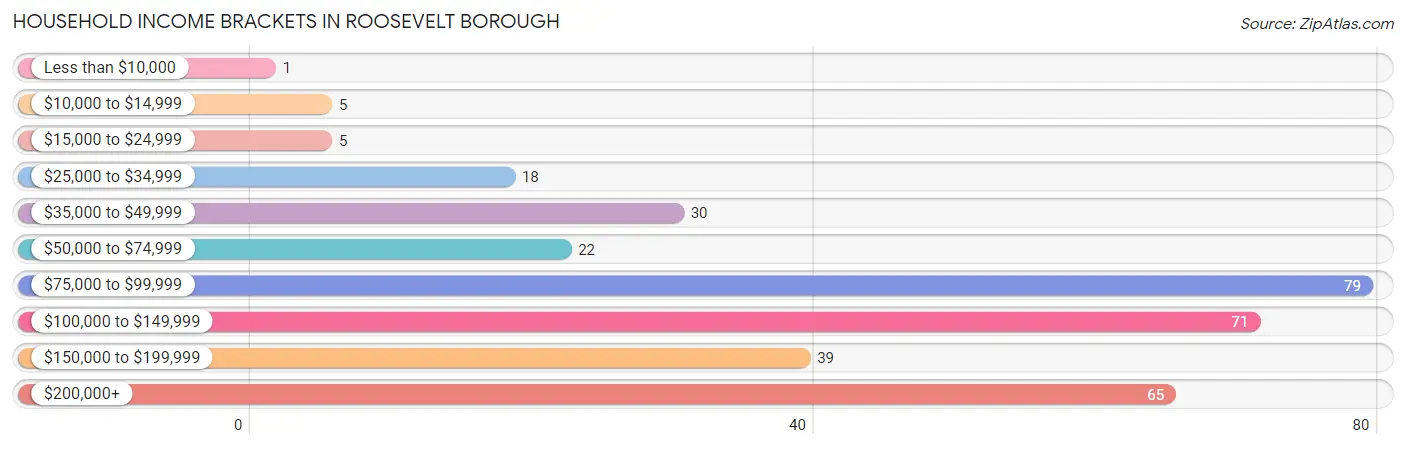
| Income Bracket | # Households | % Households |
| Less than $10,000 | 1 | 0.3% |
| $10,000 to $14,999 | 5 | 1.5% |
| $15,000 to $24,999 | 5 | 1.5% |
| $25,000 to $34,999 | 18 | 5.4% |
| $35,000 to $49,999 | 30 | 9.0% |
| $50,000 to $74,999 | 22 | 6.6% |
| $75,000 to $99,999 | 79 | 23.6% |
| $100,000 to $149,999 | 71 | 21.2% |
| $150,000 to $199,999 | 39 | 11.6% |
| $200,000+ | 65 | 19.4% |
Household Income by Householder Age in Roosevelt borough
The median household income in Roosevelt borough is $101,339, with the highest median household income of $131,136 found in the 65+ years age bracket for the primary householder. A total of 108 households (32.2%) fall into this category.
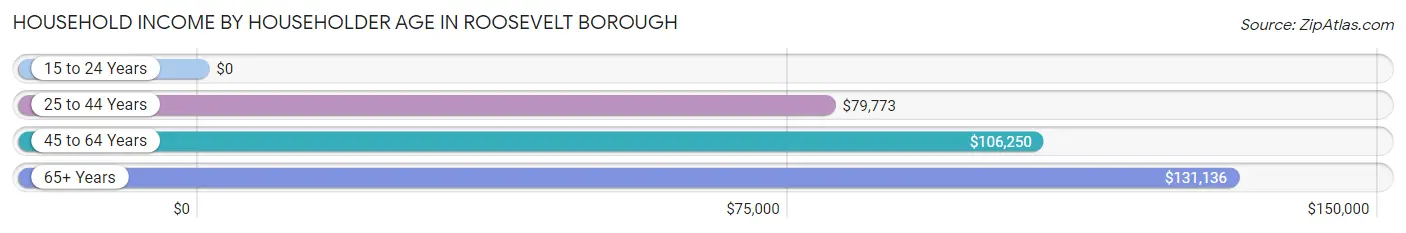
| Income Bracket | # Households | Median Income |
| 15 to 24 Years | 0 (0.0%) | $0 |
| 25 to 44 Years | 106 (31.6%) | $79,773 |
| 45 to 64 Years | 121 (36.1%) | $106,250 |
| 65+ Years | 108 (32.2%) | $131,136 |
| Total | 335 (100.0%) | $101,339 |
Poverty in Roosevelt borough
Income Below Poverty by Sex and Age in Roosevelt borough
With 1.9% poverty level for males and 2.1% for females among the residents of Roosevelt borough, 5 year old males and 45 to 54 year old females are the most vulnerable to poverty, with 2 males (33.3%) and 3 females (9.7%) in their respective age groups living below the poverty level.
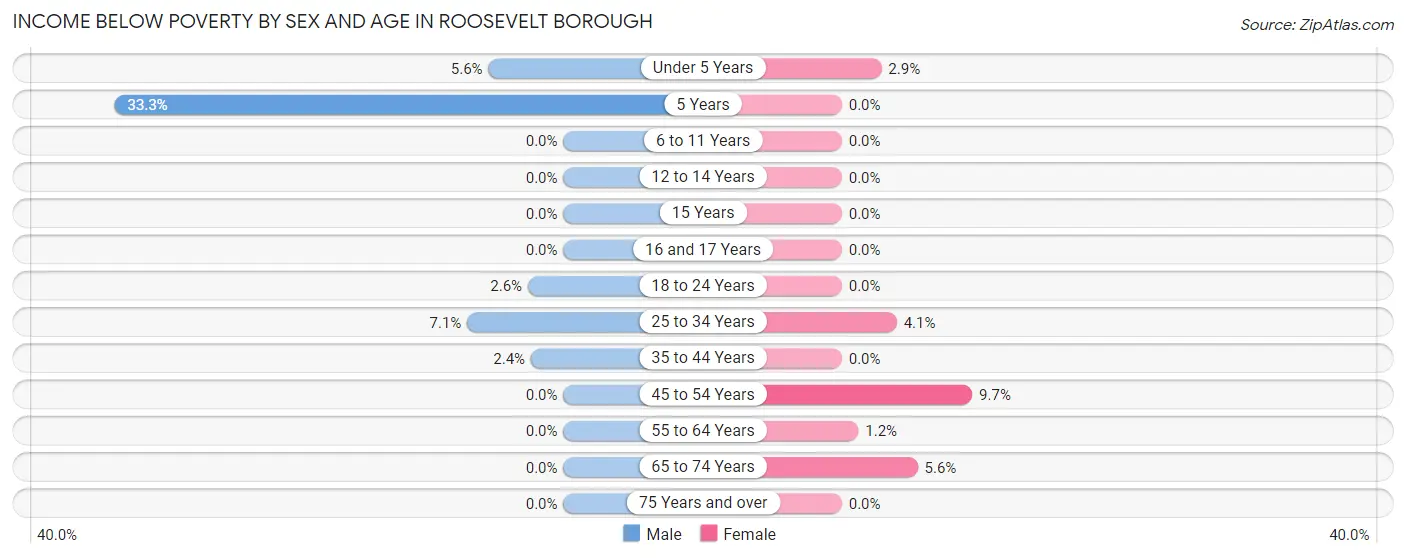
| Age Bracket | Male | Female |
| Under 5 Years | 2 (5.6%) | 2 (2.9%) |
| 5 Years | 2 (33.3%) | 0 (0.0%) |
| 6 to 11 Years | 0 (0.0%) | 0 (0.0%) |
| 12 to 14 Years | 0 (0.0%) | 0 (0.0%) |
| 15 Years | 0 (0.0%) | 0 (0.0%) |
| 16 and 17 Years | 0 (0.0%) | 0 (0.0%) |
| 18 to 24 Years | 1 (2.6%) | 0 (0.0%) |
| 25 to 34 Years | 2 (7.1%) | 2 (4.1%) |
| 35 to 44 Years | 2 (2.4%) | 0 (0.0%) |
| 45 to 54 Years | 0 (0.0%) | 3 (9.7%) |
| 55 to 64 Years | 0 (0.0%) | 1 (1.2%) |
| 65 to 74 Years | 0 (0.0%) | 4 (5.6%) |
| 75 Years and over | 0 (0.0%) | 0 (0.0%) |
| Total | 9 (1.9%) | 12 (2.1%) |
Income Above Poverty by Sex and Age in Roosevelt borough
According to the poverty statistics in Roosevelt borough, males aged 6 to 11 years and females aged 5 years are the age groups that are most secure financially, with 100.0% of males and 100.0% of females in these age groups living above the poverty line.
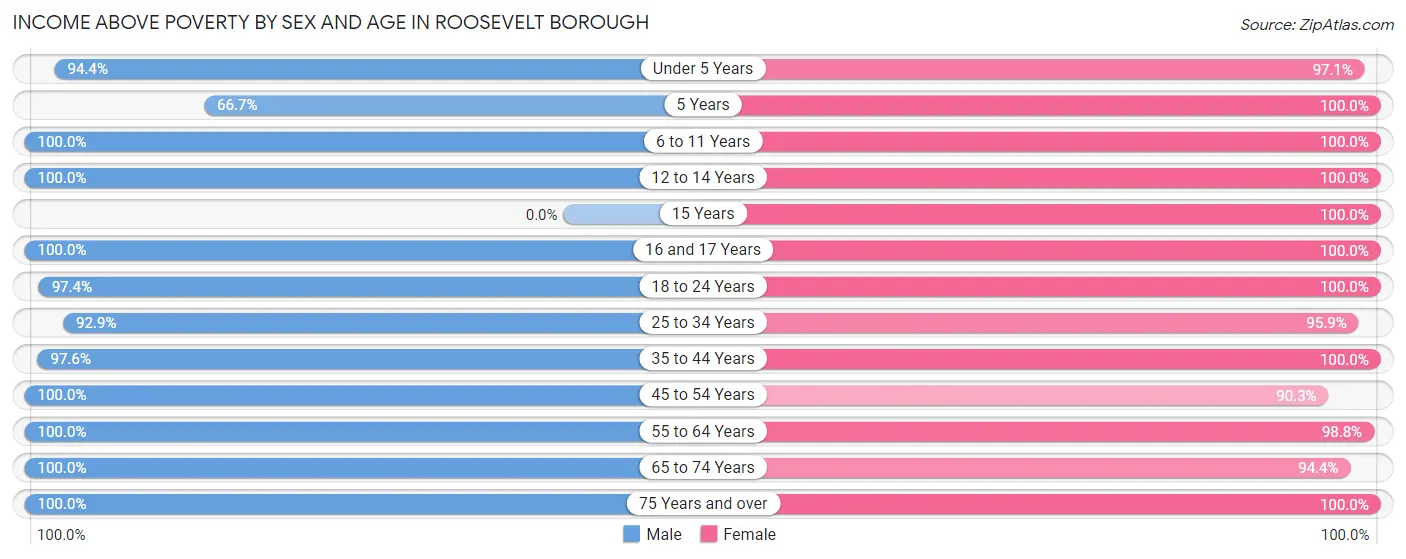
| Age Bracket | Male | Female |
| Under 5 Years | 34 (94.4%) | 66 (97.1%) |
| 5 Years | 4 (66.7%) | 4 (100.0%) |
| 6 to 11 Years | 63 (100.0%) | 99 (100.0%) |
| 12 to 14 Years | 13 (100.0%) | 10 (100.0%) |
| 15 Years | 0 (0.0%) | 12 (100.0%) |
| 16 and 17 Years | 2 (100.0%) | 10 (100.0%) |
| 18 to 24 Years | 37 (97.4%) | 45 (100.0%) |
| 25 to 34 Years | 26 (92.9%) | 47 (95.9%) |
| 35 to 44 Years | 81 (97.6%) | 64 (100.0%) |
| 45 to 54 Years | 27 (100.0%) | 28 (90.3%) |
| 55 to 64 Years | 87 (100.0%) | 80 (98.8%) |
| 65 to 74 Years | 50 (100.0%) | 67 (94.4%) |
| 75 Years and over | 30 (100.0%) | 30 (100.0%) |
| Total | 454 (98.1%) | 562 (97.9%) |
Income Below Poverty Among Married-Couple Families in Roosevelt borough
The poverty statistics for married-couple families in Roosevelt borough show that 0.8% or 2 of the total 247 families live below the poverty line. Families with 3 or 4 children have the highest poverty rate of 12.5%, comprising of 2 families. On the other hand, families with no children have the lowest poverty rate of 0.0%, which includes 0 families.
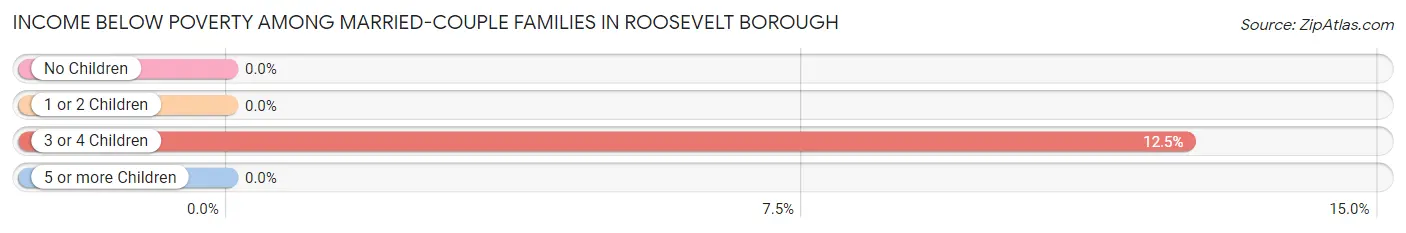
| Children | Above Poverty | Below Poverty |
| No Children | 145 (100.0%) | 0 (0.0%) |
| 1 or 2 Children | 55 (100.0%) | 0 (0.0%) |
| 3 or 4 Children | 14 (87.5%) | 2 (12.5%) |
| 5 or more Children | 31 (100.0%) | 0 (0.0%) |
| Total | 245 (99.2%) | 2 (0.8%) |
Income Below Poverty Among Single-Parent Households in Roosevelt borough
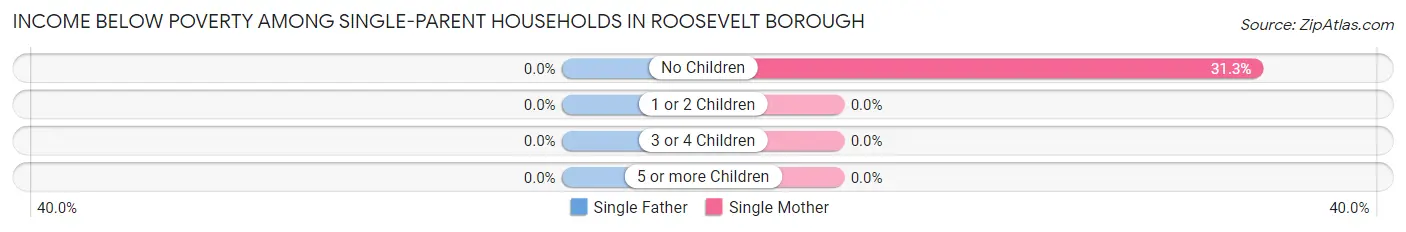
| Children | Single Father | Single Mother |
| No Children | 0 (0.0%) | 5 (31.2%) |
| 1 or 2 Children | 0 (0.0%) | 0 (0.0%) |
| 3 or 4 Children | 0 (0.0%) | 0 (0.0%) |
| 5 or more Children | 0 (0.0%) | 0 (0.0%) |
| Total | 0 (0.0%) | 5 (25.0%) |
Income Below Poverty Among Married-Couple vs Single-Parent Households in Roosevelt borough
The poverty data for Roosevelt borough shows that 2 of the married-couple family households (0.8%) and 5 of the single-parent households (18.5%) are living below the poverty level. Within the married-couple family households, those with 3 or 4 children have the highest poverty rate, with 2 households (12.5%) falling below the poverty line. Among the single-parent households, those with no children have the highest poverty rate, with 5 household (26.3%) living below poverty.
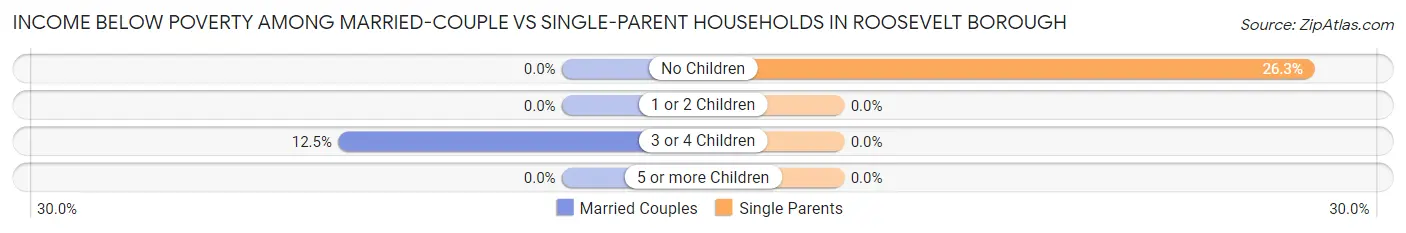
| Children | Married-Couple Families | Single-Parent Households |
| No Children | 0 (0.0%) | 5 (26.3%) |
| 1 or 2 Children | 0 (0.0%) | 0 (0.0%) |
| 3 or 4 Children | 2 (12.5%) | 0 (0.0%) |
| 5 or more Children | 0 (0.0%) | 0 (0.0%) |
| Total | 2 (0.8%) | 5 (18.5%) |
Race in Roosevelt borough
The most populous races in Roosevelt borough are White / Caucasian (885 | 85.3%), Hispanic or Latino (291 | 28.1%), and Two or more Races (127 | 12.2%).
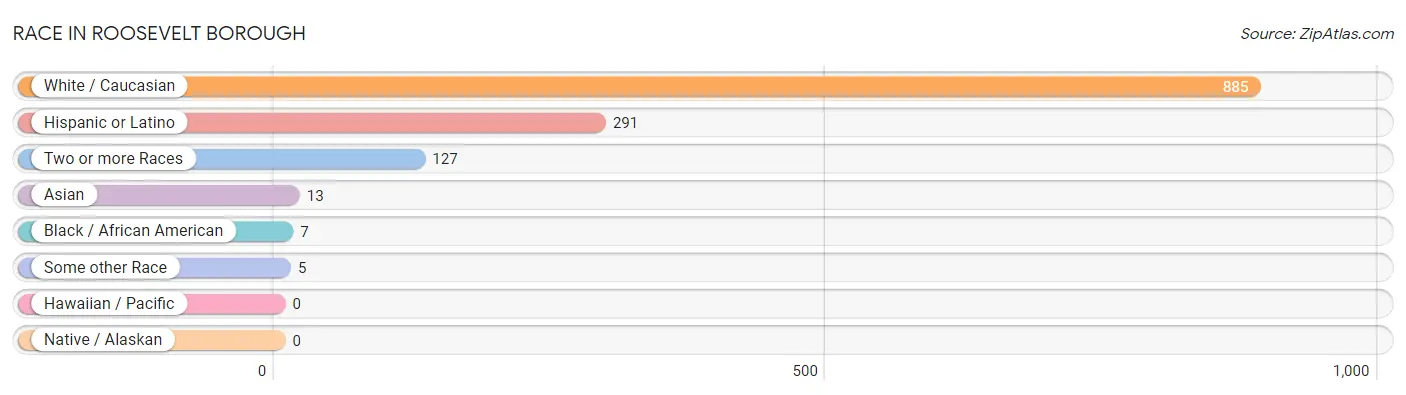
| Race | # Population | % Population |
| Asian | 13 | 1.3% |
| Black / African American | 7 | 0.7% |
| Hawaiian / Pacific | 0 | 0.0% |
| Hispanic or Latino | 291 | 28.1% |
| Native / Alaskan | 0 | 0.0% |
| White / Caucasian | 885 | 85.3% |
| Two or more Races | 127 | 12.2% |
| Some other Race | 5 | 0.5% |
| Total | 1,037 | 100.0% |
Ancestry in Roosevelt borough
The most populous ancestries reported in Roosevelt borough are German (179 | 17.3%), Irish (153 | 14.7%), Italian (114 | 11.0%), Central American (105 | 10.1%), and Guatemalan (95 | 9.2%), together accounting for 62.3% of all Roosevelt borough residents.
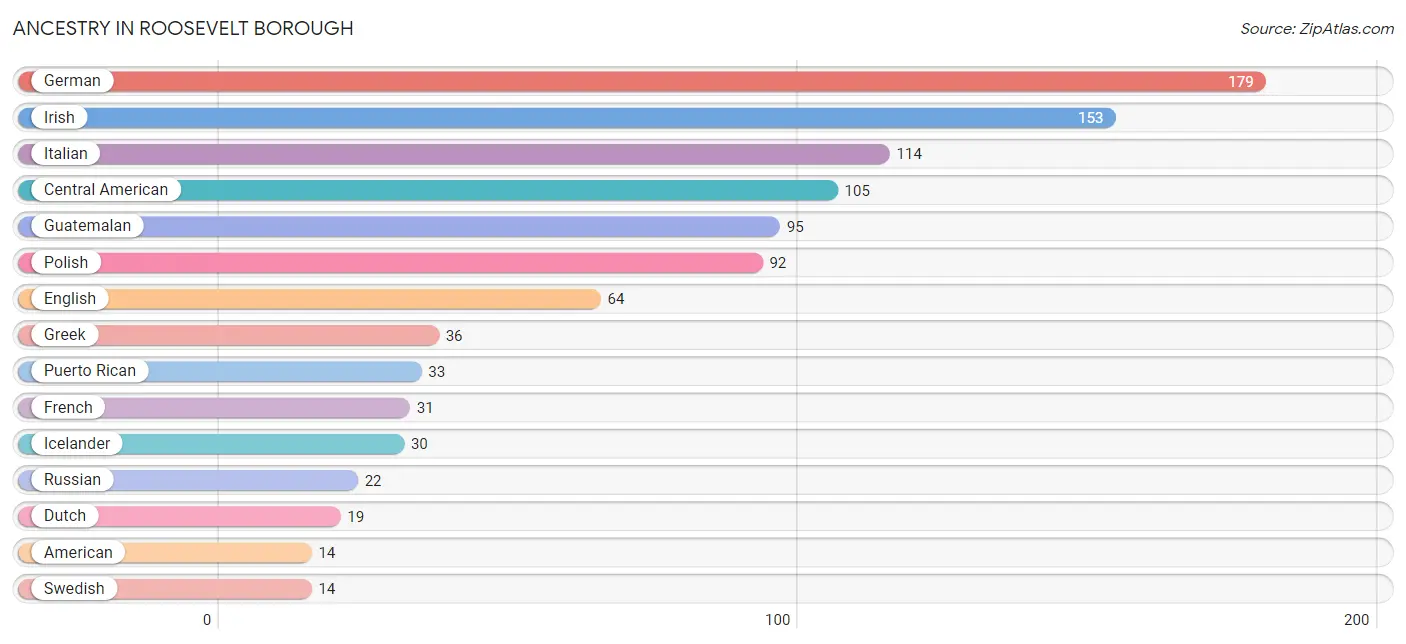
| Ancestry | # Population | % Population |
| American | 14 | 1.3% |
| Belgian | 2 | 0.2% |
| British | 11 | 1.1% |
| Burmese | 4 | 0.4% |
| Canadian | 2 | 0.2% |
| Central American | 105 | 10.1% |
| Central American Indian | 12 | 1.2% |
| Chilean | 2 | 0.2% |
| Czech | 5 | 0.5% |
| Czechoslovakian | 9 | 0.9% |
| Dominican | 1 | 0.1% |
| Dutch | 19 | 1.8% |
| Dutch West Indian | 1 | 0.1% |
| Eastern European | 6 | 0.6% |
| English | 64 | 6.2% |
| European | 10 | 1.0% |
| Finnish | 8 | 0.8% |
| French | 31 | 3.0% |
| German | 179 | 17.3% |
| Greek | 36 | 3.5% |
| Guatemalan | 95 | 9.2% |
| Honduran | 10 | 1.0% |
| Hungarian | 10 | 1.0% |
| Icelander | 30 | 2.9% |
| Indian (Asian) | 10 | 1.0% |
| Irish | 153 | 14.7% |
| Israeli | 6 | 0.6% |
| Italian | 114 | 11.0% |
| Korean | 2 | 0.2% |
| Latvian | 2 | 0.2% |
| Lithuanian | 2 | 0.2% |
| Polish | 92 | 8.9% |
| Puerto Rican | 33 | 3.2% |
| Russian | 22 | 2.1% |
| Scotch-Irish | 1 | 0.1% |
| Scottish | 12 | 1.2% |
| Serbian | 2 | 0.2% |
| Slavic | 4 | 0.4% |
| South American | 2 | 0.2% |
| Spanish | 3 | 0.3% |
| Swedish | 14 | 1.3% |
| Thai | 1 | 0.1% |
| Welsh | 4 | 0.4% | View All 43 Rows |
Immigrants in Roosevelt borough
The most numerous immigrant groups reported in Roosevelt borough came from Latin America (58 | 5.6%), Central America (57 | 5.5%), Guatemala (47 | 4.5%), Asia (26 | 2.5%), and Europe (26 | 2.5%), together accounting for 20.6% of all Roosevelt borough residents.
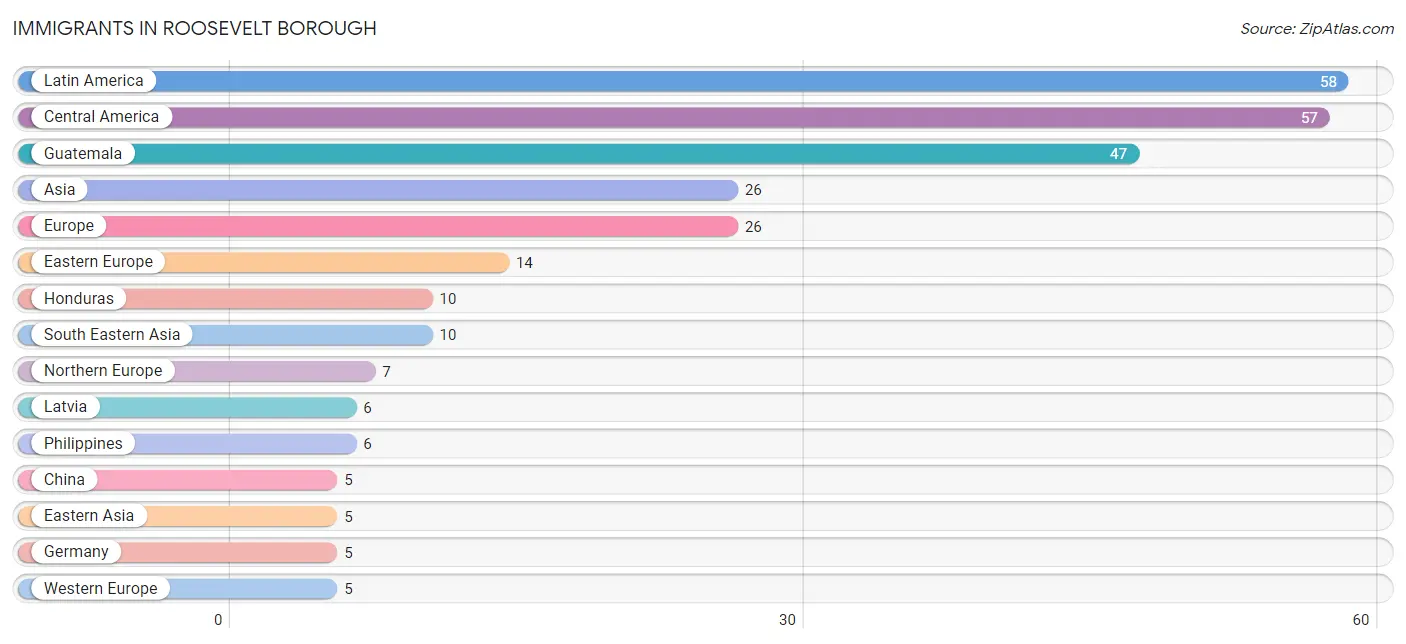
| Immigration Origin | # Population | % Population |
| Asia | 26 | 2.5% |
| Canada | 4 | 0.4% |
| Caribbean | 1 | 0.1% |
| Central America | 57 | 5.5% |
| China | 5 | 0.5% |
| Czechoslovakia | 4 | 0.4% |
| Dominican Republic | 1 | 0.1% |
| Eastern Asia | 5 | 0.5% |
| Eastern Europe | 14 | 1.3% |
| England | 3 | 0.3% |
| Europe | 26 | 2.5% |
| Germany | 5 | 0.5% |
| Guatemala | 47 | 4.5% |
| Honduras | 10 | 1.0% |
| India | 1 | 0.1% |
| Latin America | 58 | 5.6% |
| Latvia | 6 | 0.6% |
| Northern Europe | 7 | 0.7% |
| Philippines | 6 | 0.6% |
| Russia | 2 | 0.2% |
| South Central Asia | 1 | 0.1% |
| South Eastern Asia | 10 | 1.0% |
| Taiwan | 2 | 0.2% |
| Ukraine | 2 | 0.2% |
| Vietnam | 4 | 0.4% |
| Western Europe | 5 | 0.5% | View All 26 Rows |
Sex and Age in Roosevelt borough
Sex and Age in Roosevelt borough
The most populous age groups in Roosevelt borough are 10 to 14 Years (55 | 11.9%) for men and 5 to 9 Years (99 | 17.2%) for women.
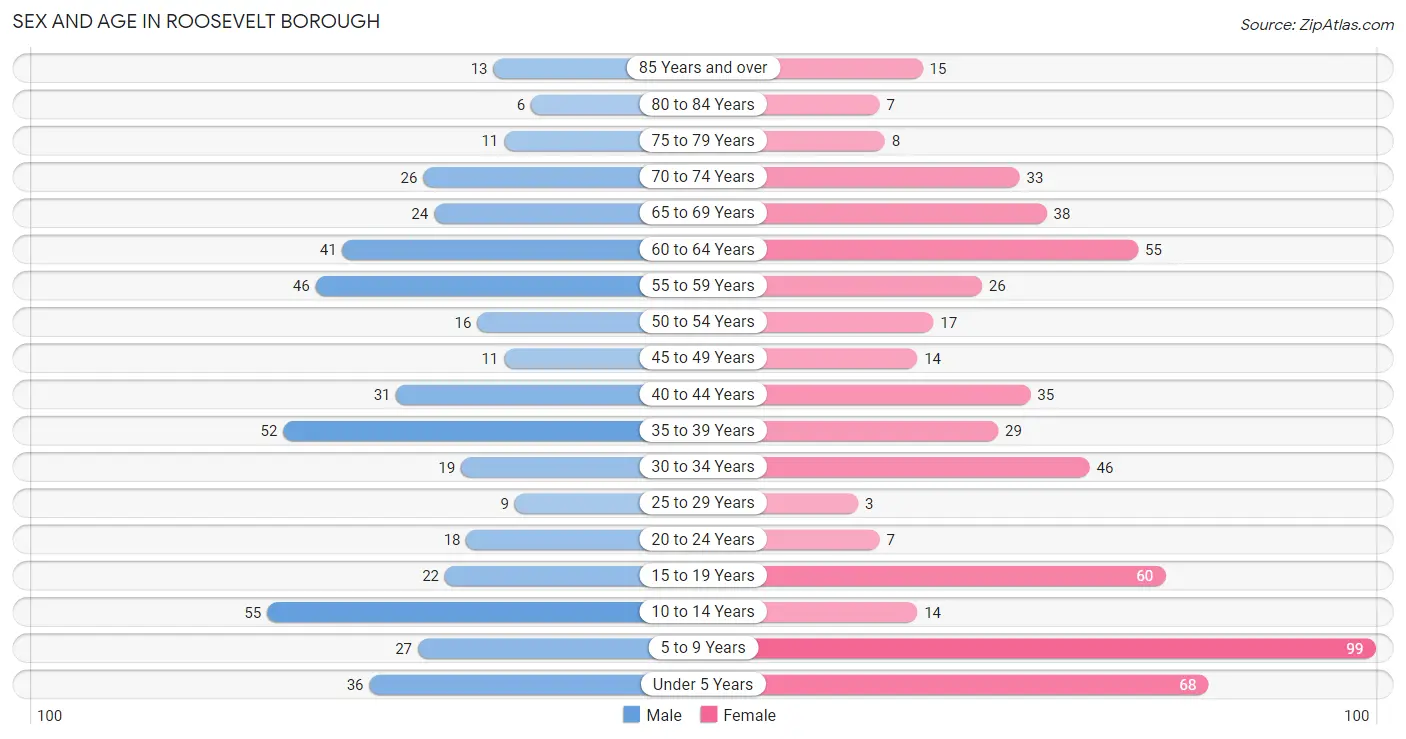
| Age Bracket | Male | Female |
| Under 5 Years | 36 (7.8%) | 68 (11.8%) |
| 5 to 9 Years | 27 (5.8%) | 99 (17.2%) |
| 10 to 14 Years | 55 (11.9%) | 14 (2.4%) |
| 15 to 19 Years | 22 (4.8%) | 60 (10.4%) |
| 20 to 24 Years | 18 (3.9%) | 7 (1.2%) |
| 25 to 29 Years | 9 (1.9%) | 3 (0.5%) |
| 30 to 34 Years | 19 (4.1%) | 46 (8.0%) |
| 35 to 39 Years | 52 (11.2%) | 29 (5.1%) |
| 40 to 44 Years | 31 (6.7%) | 35 (6.1%) |
| 45 to 49 Years | 11 (2.4%) | 14 (2.4%) |
| 50 to 54 Years | 16 (3.5%) | 17 (3.0%) |
| 55 to 59 Years | 46 (9.9%) | 26 (4.5%) |
| 60 to 64 Years | 41 (8.9%) | 55 (9.6%) |
| 65 to 69 Years | 24 (5.2%) | 38 (6.6%) |
| 70 to 74 Years | 26 (5.6%) | 33 (5.8%) |
| 75 to 79 Years | 11 (2.4%) | 8 (1.4%) |
| 80 to 84 Years | 6 (1.3%) | 7 (1.2%) |
| 85 Years and over | 13 (2.8%) | 15 (2.6%) |
| Total | 463 (100.0%) | 574 (100.0%) |
Families and Households in Roosevelt borough
Median Family Size in Roosevelt borough
The median family size in Roosevelt borough is 3.49 persons per family, with married-couple families (247 | 90.1%) accounting for the largest median family size of 3.6 persons per family. On the other hand, single female/mother families (20 | 7.3%) represent the smallest median family size with 2.40 persons per family.
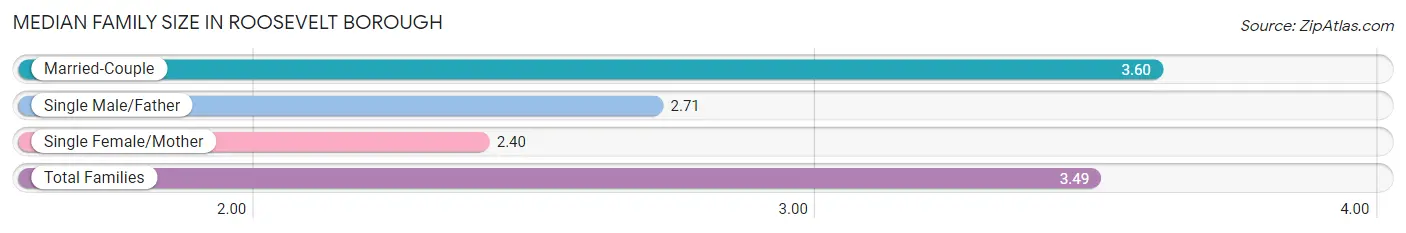
| Family Type | # Families | Family Size |
| Married-Couple | 247 (90.1%) | 3.60 |
| Single Male/Father | 7 (2.5%) | 2.71 |
| Single Female/Mother | 20 (7.3%) | 2.40 |
| Total Families | 274 (100.0%) | 3.49 |
Median Household Size in Roosevelt borough
The median household size in Roosevelt borough is 3.10 persons per household, with single male/father households (7 | 2.1%) accounting for the largest median household size of 4.43 persons per household. non-family households (61 | 18.2%) represent the smallest median household size with 1.08 persons per household.
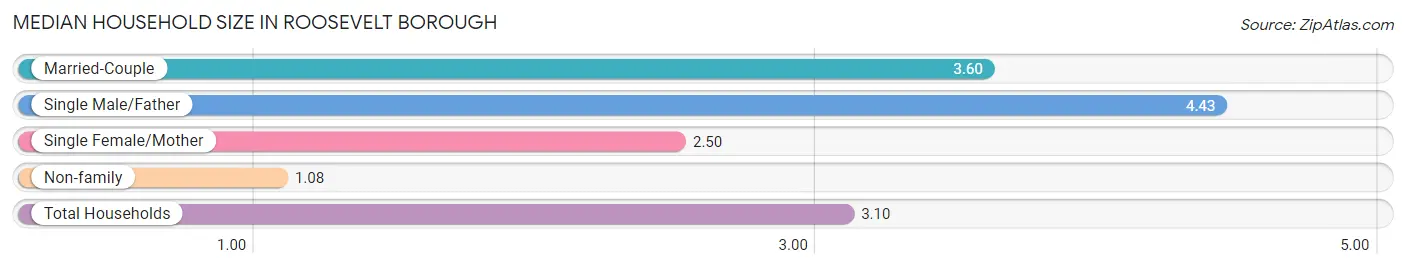
| Household Type | # Households | Household Size |
| Married-Couple | 247 (73.7%) | 3.60 |
| Single Male/Father | 7 (2.1%) | 4.43 |
| Single Female/Mother | 20 (6.0%) | 2.50 |
| Non-family | 61 (18.2%) | 1.08 |
| Total Households | 335 (100.0%) | 3.10 |
Household Size by Marriage Status in Roosevelt borough
Out of a total of 335 households in Roosevelt borough, 274 (81.8%) are family households, while 61 (18.2%) are nonfamily households. The most numerous type of family households are 2-person households, comprising 109, and the most common type of nonfamily households are 1-person households, comprising 56.
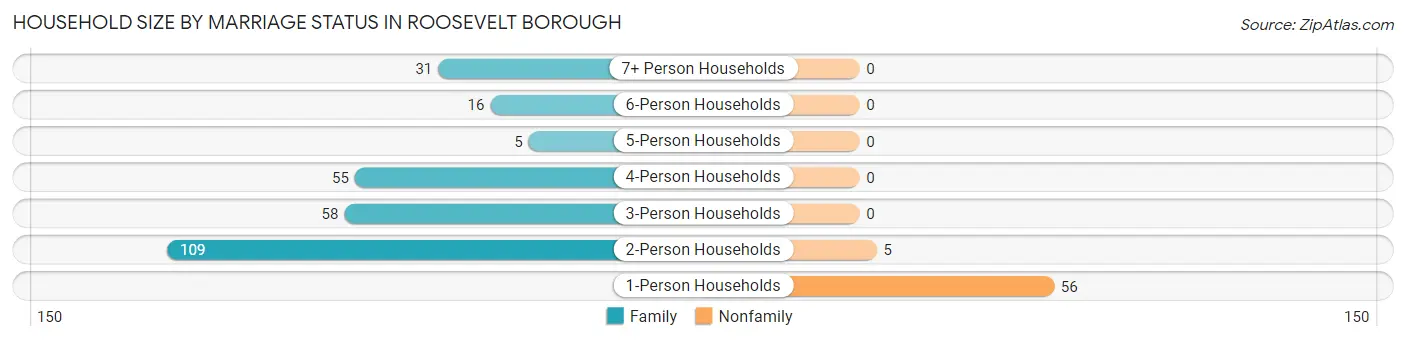
| Household Size | Family Households | Nonfamily Households |
| 1-Person Households | - | 56 (16.7%) |
| 2-Person Households | 109 (32.5%) | 5 (1.5%) |
| 3-Person Households | 58 (17.3%) | 0 (0.0%) |
| 4-Person Households | 55 (16.4%) | 0 (0.0%) |
| 5-Person Households | 5 (1.5%) | 0 (0.0%) |
| 6-Person Households | 16 (4.8%) | 0 (0.0%) |
| 7+ Person Households | 31 (9.2%) | 0 (0.0%) |
| Total | 274 (81.8%) | 61 (18.2%) |
Female Fertility in Roosevelt borough
Fertility by Age in Roosevelt borough
Average fertility rate in Roosevelt borough is 129.0 births per 1,000 women. Women in the age bracket of 15 to 19 years have the highest fertility rate with 183.0 births per 1,000 women. Women in the age bracket of 15 to 19 years acount for 44.0% of all women with births.
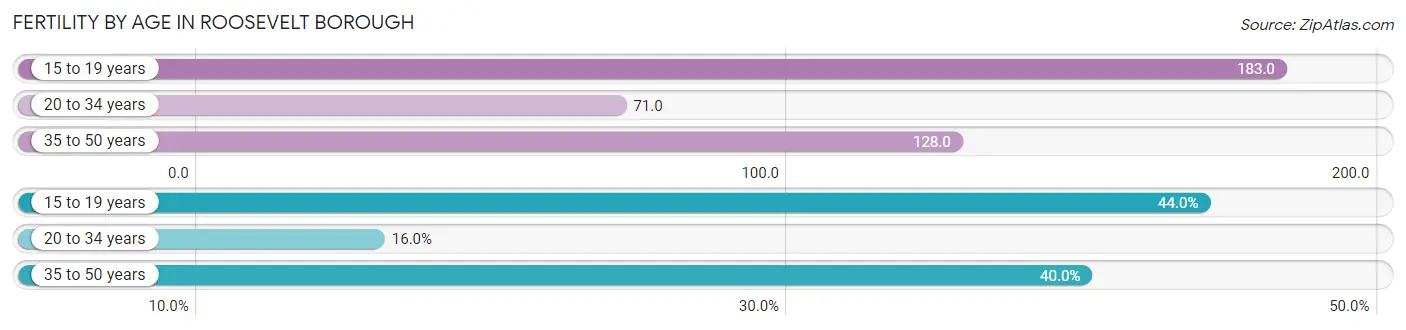
| Age Bracket | Women with Births | Births / 1,000 Women |
| 15 to 19 years | 11 (44.0%) | 183.0 |
| 20 to 34 years | 4 (16.0%) | 71.0 |
| 35 to 50 years | 10 (40.0%) | 128.0 |
| Total | 25 (100.0%) | 129.0 |
Fertility by Age by Marriage Status in Roosevelt borough
56.0% of women with births (25) in Roosevelt borough are married. The highest percentage of unmarried women with births falls into 15 to 19 years age bracket with 100.0% of them unmarried at the time of birth, while the lowest percentage of unmarried women with births belong to 20 to 34 years age bracket with 0.0% of them unmarried.
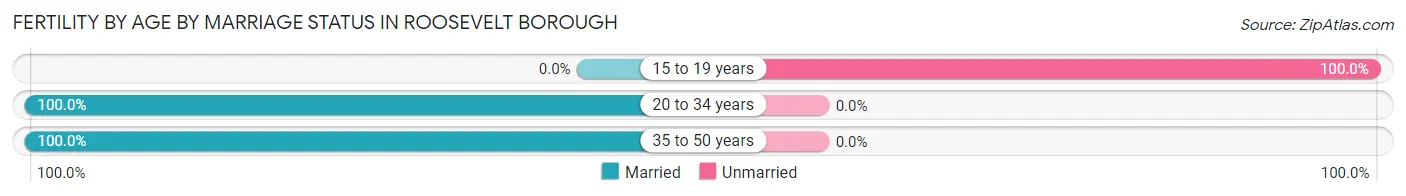
| Age Bracket | Married | Unmarried |
| 15 to 19 years | 0 (0.0%) | 11 (100.0%) |
| 20 to 34 years | 4 (100.0%) | 0 (0.0%) |
| 35 to 50 years | 10 (100.0%) | 0 (0.0%) |
| Total | 14 (56.0%) | 11 (44.0%) |
Fertility by Education in Roosevelt borough
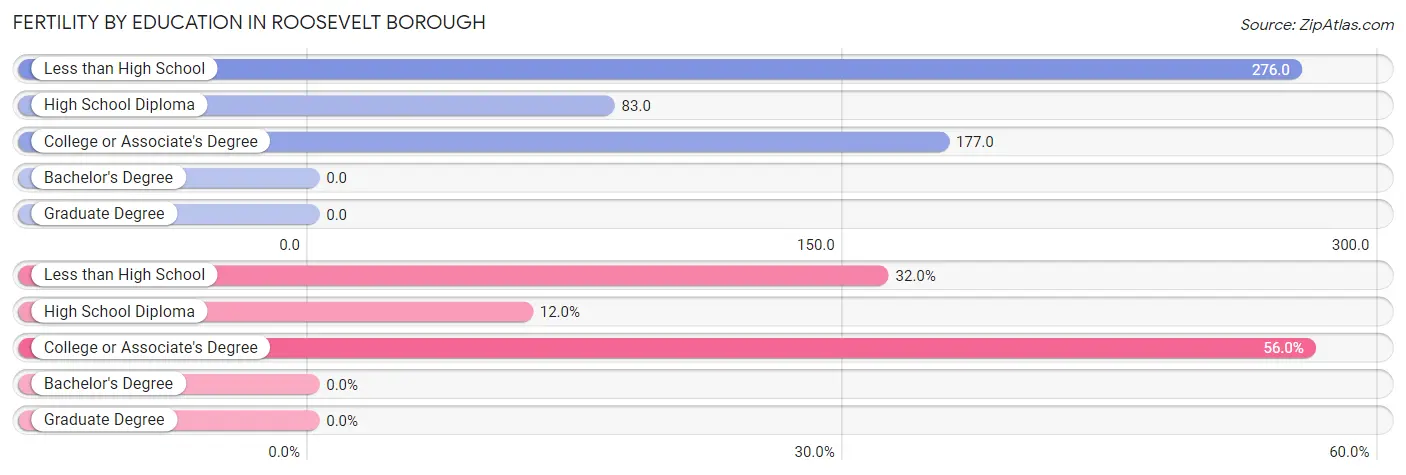
| Educational Attainment | Women with Births | Births / 1,000 Women |
| Less than High School | 8 (32.0%) | 276.0 |
| High School Diploma | 3 (12.0%) | 83.0 |
| College or Associate's Degree | 14 (56.0%) | 177.0 |
| Bachelor's Degree | 0 (0.0%) | 0.0 |
| Graduate Degree | 0 (0.0%) | 0.0 |
| Total | 25 (100.0%) | 129.0 |
Fertility by Education by Marriage Status in Roosevelt borough
44.0% of women with births in Roosevelt borough are unmarried. Women with the educational attainment of college or associate's degree are most likely to be married with 100.0% of them married at childbirth, while women with the educational attainment of less than high school are least likely to be married with 100.0% of them unmarried at childbirth.
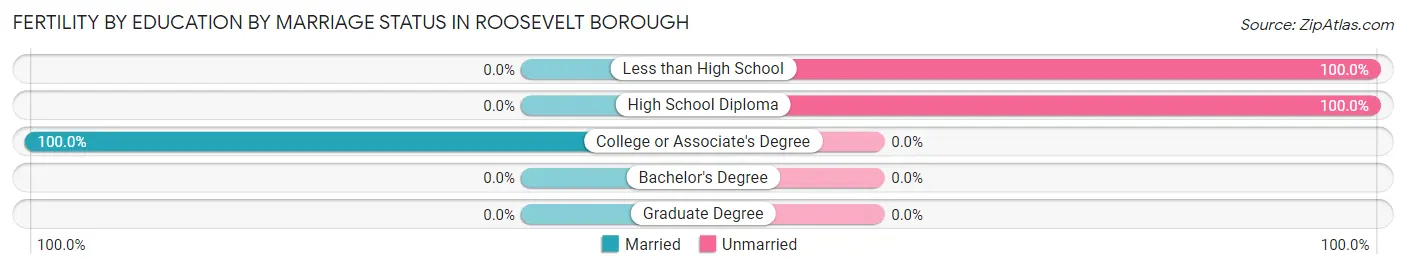
| Educational Attainment | Married | Unmarried |
| Less than High School | 0 (0.0%) | 8 (100.0%) |
| High School Diploma | 0 (0.0%) | 3 (100.0%) |
| College or Associate's Degree | 14 (100.0%) | 0 (0.0%) |
| Bachelor's Degree | 0 (0.0%) | 0 (0.0%) |
| Graduate Degree | 0 (0.0%) | 0 (0.0%) |
| Total | 14 (56.0%) | 11 (44.0%) |
Employment Characteristics in Roosevelt borough
Employment by Class of Employer in Roosevelt borough
Among the 451 employed individuals in Roosevelt borough, private company employees (318 | 70.5%), not-for-profit organizations (33 | 7.3%), and local government employees (32 | 7.1%) make up the most common classes of employment.
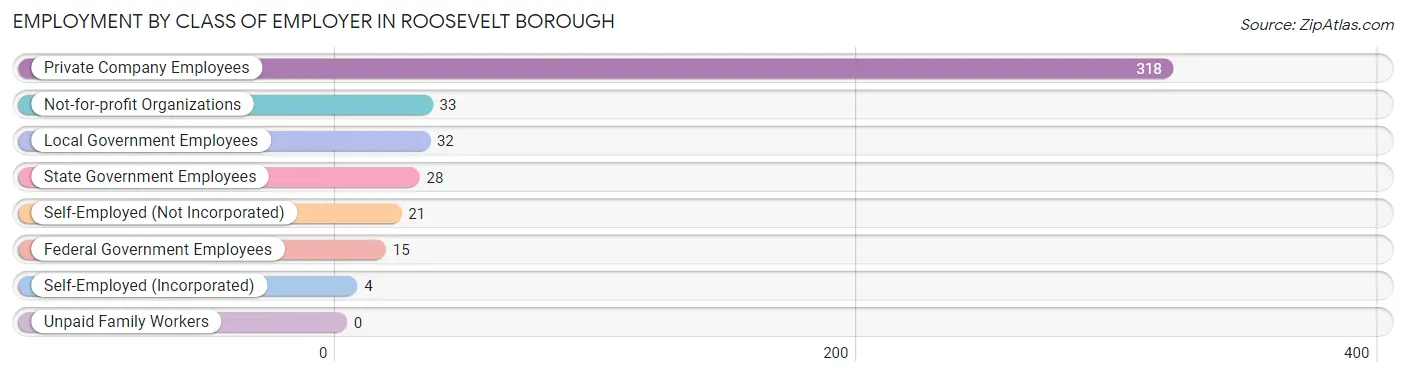
| Employer Class | # Employees | % Employees |
| Private Company Employees | 318 | 70.5% |
| Self-Employed (Incorporated) | 4 | 0.9% |
| Self-Employed (Not Incorporated) | 21 | 4.7% |
| Not-for-profit Organizations | 33 | 7.3% |
| Local Government Employees | 32 | 7.1% |
| State Government Employees | 28 | 6.2% |
| Federal Government Employees | 15 | 3.3% |
| Unpaid Family Workers | 0 | 0.0% |
| Total | 451 | 100.0% |
Employment Status by Age in Roosevelt borough
According to the labor force statistics for Roosevelt borough, out of the total population over 16 years of age (726), 65.6% or 476 individuals are in the labor force, with 3.6% or 17 of them unemployed. The age group with the highest labor force participation rate is 45 to 54 years, with 96.6% or 56 individuals in the labor force. Within the labor force, the 25 to 29 years age range has the highest percentage of unemployed individuals, with 27.3% or 3 of them being unemployed.
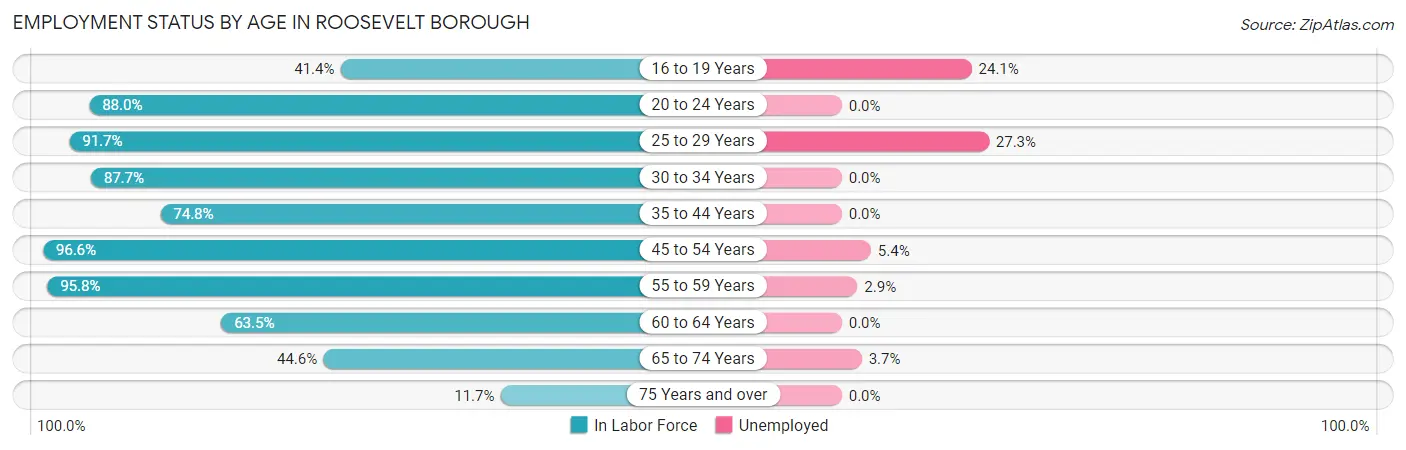
| Age Bracket | In Labor Force | Unemployed |
| 16 to 19 Years | 29 (41.4%) | 7 (24.1%) |
| 20 to 24 Years | 22 (88.0%) | 0 (0.0%) |
| 25 to 29 Years | 11 (91.7%) | 3 (27.3%) |
| 30 to 34 Years | 57 (87.7%) | 0 (0.0%) |
| 35 to 44 Years | 110 (74.8%) | 0 (0.0%) |
| 45 to 54 Years | 56 (96.6%) | 3 (5.4%) |
| 55 to 59 Years | 69 (95.8%) | 2 (2.9%) |
| 60 to 64 Years | 61 (63.5%) | 0 (0.0%) |
| 65 to 74 Years | 54 (44.6%) | 2 (3.7%) |
| 75 Years and over | 7 (11.7%) | 0 (0.0%) |
| Total | 476 (65.6%) | 17 (3.6%) |
Employment Status by Educational Attainment in Roosevelt borough
According to labor force statistics for Roosevelt borough, 80.9% of individuals (364) out of the total population between 25 and 64 years of age (450) are in the labor force, with 2.2% or 8 of them being unemployed. The group with the highest labor force participation rate are those with the educational attainment of college / associate degree, with 86.4% or 127 individuals in the labor force. Within the labor force, individuals with bachelor's degree or higher education have the highest percentage of unemployment, with 4.8% or 8 of them being unemployed.
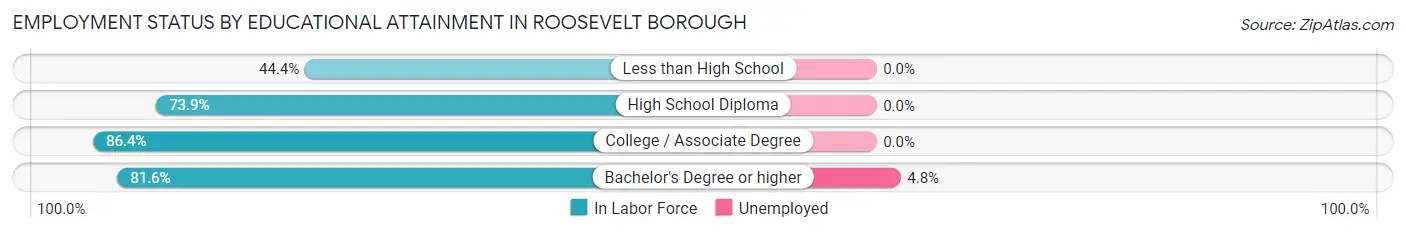
| Educational Attainment | In Labor Force | Unemployed |
| Less than High School | 4 (44.4%) | 0 (0.0%) |
| High School Diploma | 65 (73.9%) | 0 (0.0%) |
| College / Associate Degree | 127 (86.4%) | 0 (0.0%) |
| Bachelor's Degree or higher | 168 (81.6%) | 10 (4.8%) |
| Total | 364 (80.9%) | 10 (2.2%) |
Employment Occupations by Sex in Roosevelt borough
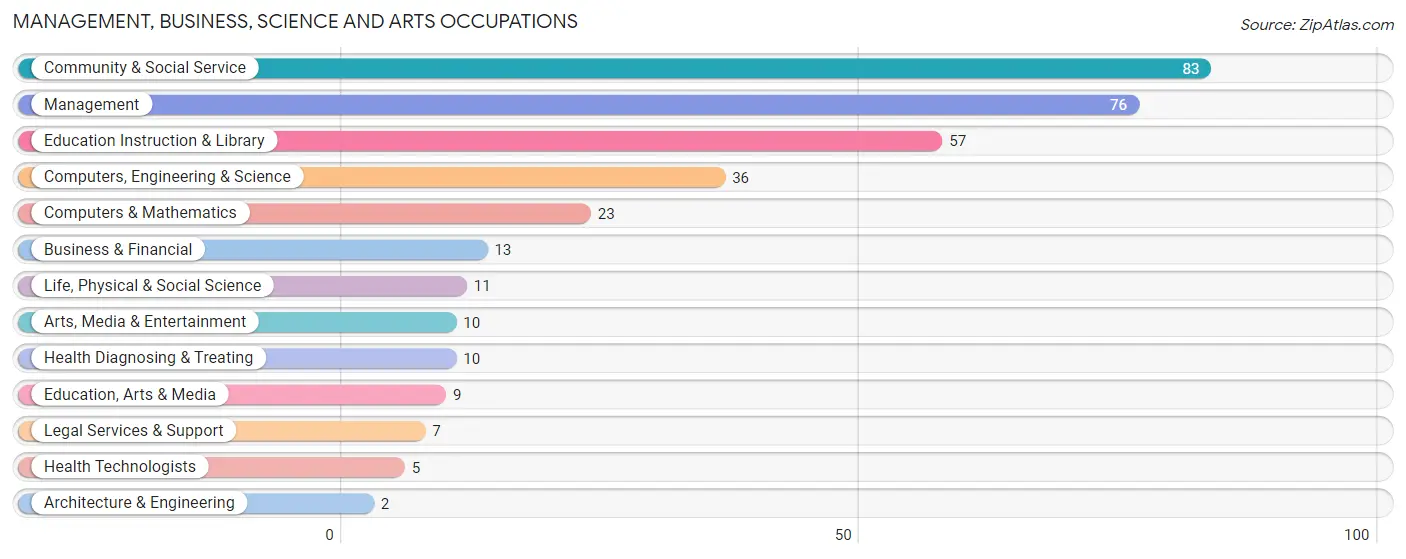
Management, Business, Science and Arts Occupations
The most common Management, Business, Science and Arts occupations in Roosevelt borough are Community & Social Service (83 | 18.1%), Management (76 | 16.6%), Education Instruction & Library (57 | 12.4%), Computers, Engineering & Science (36 | 7.8%), and Computers & Mathematics (23 | 5.0%).
Management, Business, Science and Arts Occupations by Sex
Within the Management, Business, Science and Arts occupations in Roosevelt borough, the most male-oriented occupations are Architecture & Engineering (100.0%), Life, Physical & Social Science (100.0%), and Computers, Engineering & Science (94.4%), while the most female-oriented occupations are Education, Arts & Media (100.0%), Health Diagnosing & Treating (100.0%), and Health Technologists (100.0%).
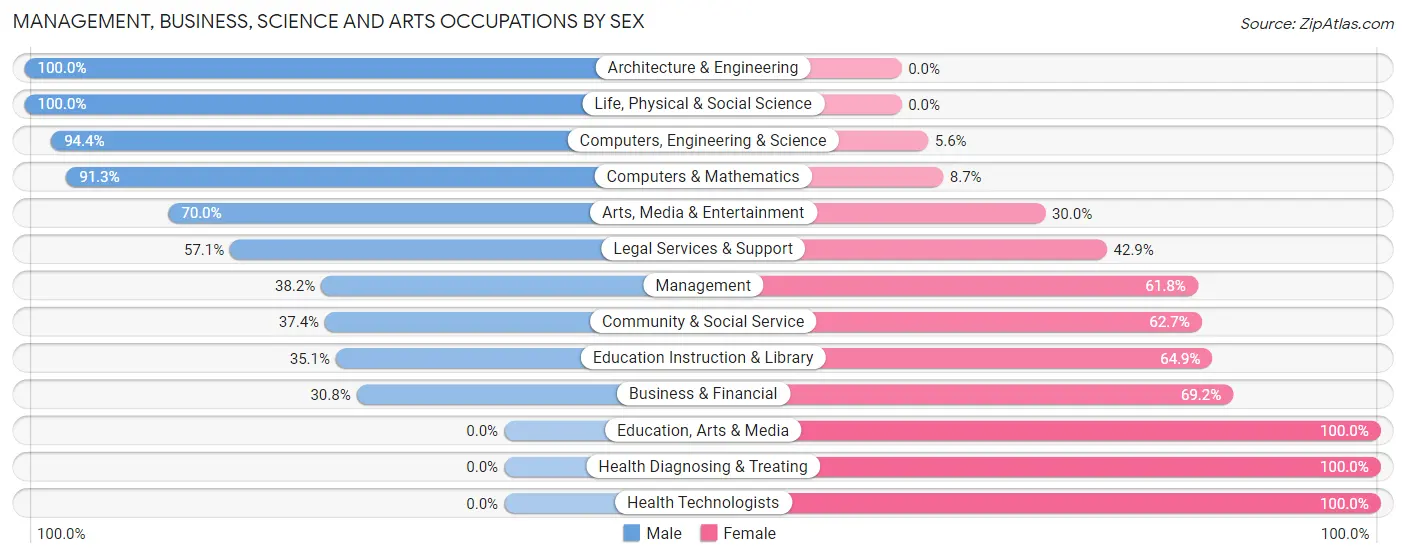
| Occupation | Male | Female |
| Management | 29 (38.2%) | 47 (61.8%) |
| Business & Financial | 4 (30.8%) | 9 (69.2%) |
| Computers, Engineering & Science | 34 (94.4%) | 2 (5.6%) |
| Computers & Mathematics | 21 (91.3%) | 2 (8.7%) |
| Architecture & Engineering | 2 (100.0%) | 0 (0.0%) |
| Life, Physical & Social Science | 11 (100.0%) | 0 (0.0%) |
| Community & Social Service | 31 (37.3%) | 52 (62.6%) |
| Education, Arts & Media | 0 (0.0%) | 9 (100.0%) |
| Legal Services & Support | 4 (57.1%) | 3 (42.9%) |
| Education Instruction & Library | 20 (35.1%) | 37 (64.9%) |
| Arts, Media & Entertainment | 7 (70.0%) | 3 (30.0%) |
| Health Diagnosing & Treating | 0 (0.0%) | 10 (100.0%) |
| Health Technologists | 0 (0.0%) | 5 (100.0%) |
| Total (Category) | 98 (45.0%) | 120 (55.0%) |
| Total (Overall) | 246 (53.6%) | 213 (46.4%) |
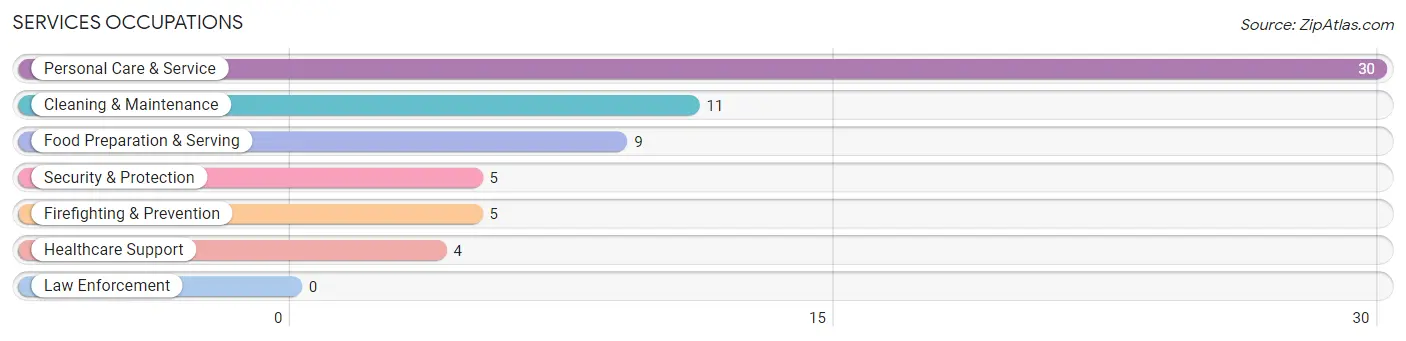
Services Occupations
The most common Services occupations in Roosevelt borough are Personal Care & Service (30 | 6.5%), Cleaning & Maintenance (11 | 2.4%), Food Preparation & Serving (9 | 2.0%), Security & Protection (5 | 1.1%), and Firefighting & Prevention (5 | 1.1%).
Services Occupations by Sex
Within the Services occupations in Roosevelt borough, the most male-oriented occupations are Security & Protection (100.0%), Firefighting & Prevention (100.0%), and Cleaning & Maintenance (100.0%), while the most female-oriented occupations are Healthcare Support (100.0%), Personal Care & Service (100.0%), and Food Preparation & Serving (55.6%).
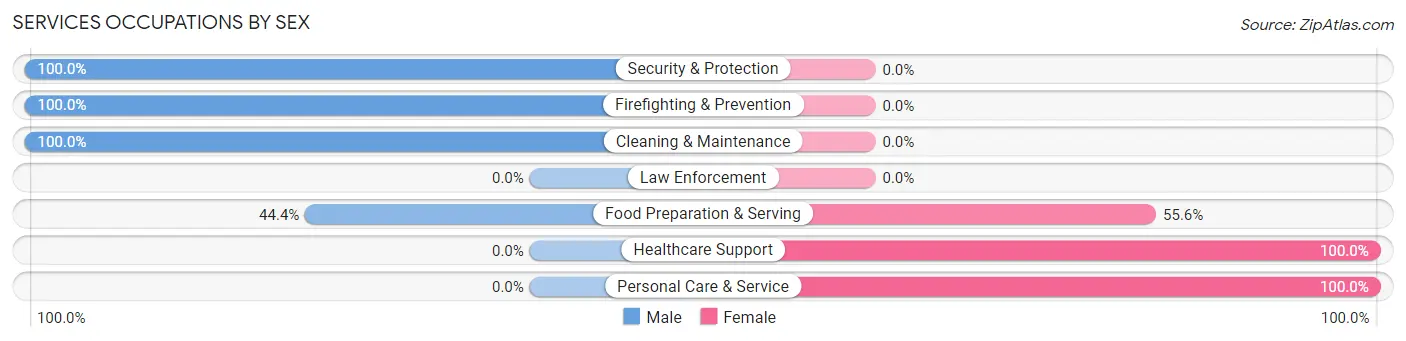
| Occupation | Male | Female |
| Healthcare Support | 0 (0.0%) | 4 (100.0%) |
| Security & Protection | 5 (100.0%) | 0 (0.0%) |
| Firefighting & Prevention | 5 (100.0%) | 0 (0.0%) |
| Law Enforcement | 0 (0.0%) | 0 (0.0%) |
| Food Preparation & Serving | 4 (44.4%) | 5 (55.6%) |
| Cleaning & Maintenance | 11 (100.0%) | 0 (0.0%) |
| Personal Care & Service | 0 (0.0%) | 30 (100.0%) |
| Total (Category) | 20 (33.9%) | 39 (66.1%) |
| Total (Overall) | 246 (53.6%) | 213 (46.4%) |
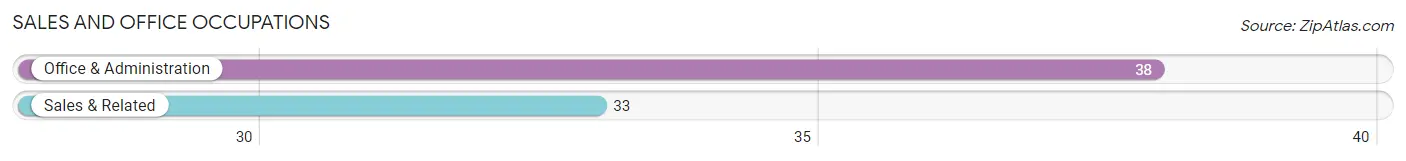
Sales and Office Occupations
The most common Sales and Office occupations in Roosevelt borough are Office & Administration (38 | 8.3%), and Sales & Related (33 | 7.2%).
Sales and Office Occupations by Sex
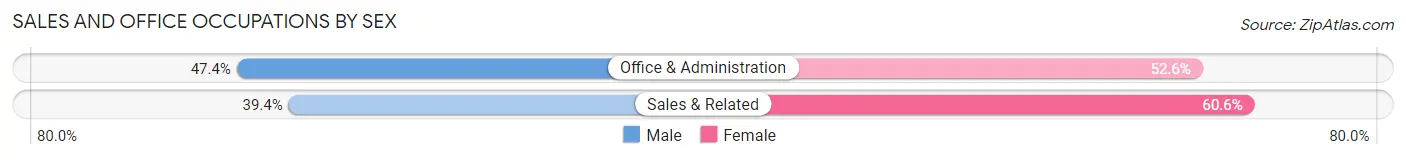
| Occupation | Male | Female |
| Sales & Related | 13 (39.4%) | 20 (60.6%) |
| Office & Administration | 18 (47.4%) | 20 (52.6%) |
| Total (Category) | 31 (43.7%) | 40 (56.3%) |
| Total (Overall) | 246 (53.6%) | 213 (46.4%) |
Natural Resources, Construction and Maintenance Occupations
The most common Natural Resources, Construction and Maintenance occupations in Roosevelt borough are Construction & Extraction (66 | 14.4%), and Installation, Maintenance & Repair (12 | 2.6%).
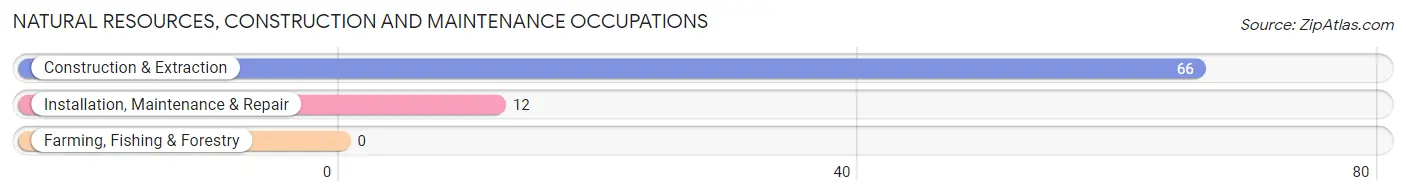
Natural Resources, Construction and Maintenance Occupations by Sex
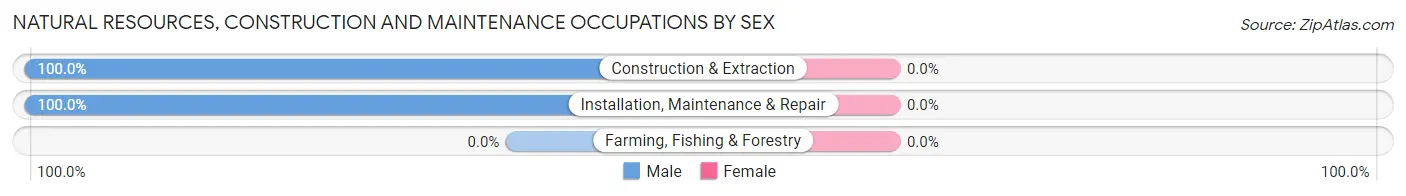
| Occupation | Male | Female |
| Farming, Fishing & Forestry | 0 (0.0%) | 0 (0.0%) |
| Construction & Extraction | 66 (100.0%) | 0 (0.0%) |
| Installation, Maintenance & Repair | 12 (100.0%) | 0 (0.0%) |
| Total (Category) | 78 (100.0%) | 0 (0.0%) |
| Total (Overall) | 246 (53.6%) | 213 (46.4%) |
Production, Transportation and Moving Occupations
The most common Production, Transportation and Moving occupations in Roosevelt borough are Material Moving (16 | 3.5%), Transportation (13 | 2.8%), and Production (4 | 0.9%).
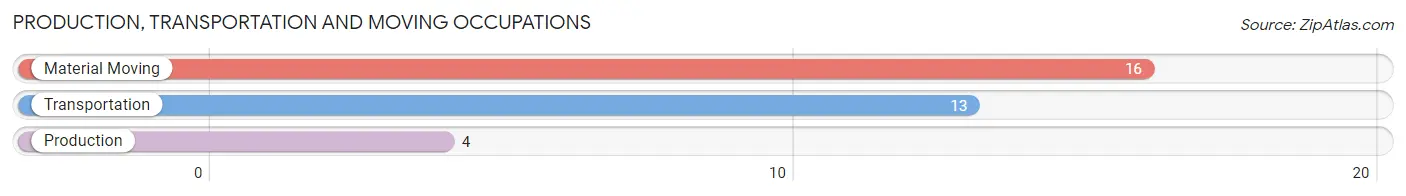
Production, Transportation and Moving Occupations by Sex
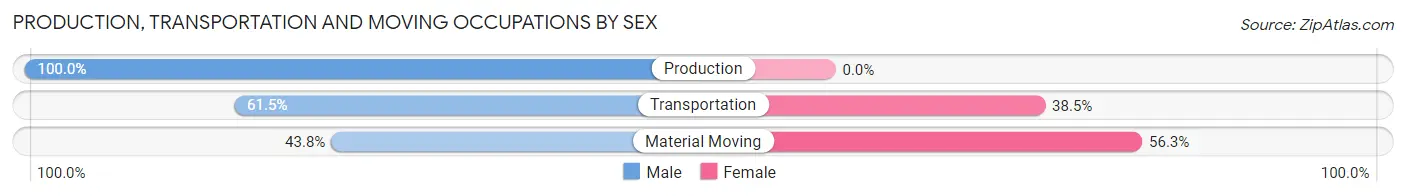
| Occupation | Male | Female |
| Production | 4 (100.0%) | 0 (0.0%) |
| Transportation | 8 (61.5%) | 5 (38.5%) |
| Material Moving | 7 (43.8%) | 9 (56.2%) |
| Total (Category) | 19 (57.6%) | 14 (42.4%) |
| Total (Overall) | 246 (53.6%) | 213 (46.4%) |
Employment Industries by Sex in Roosevelt borough
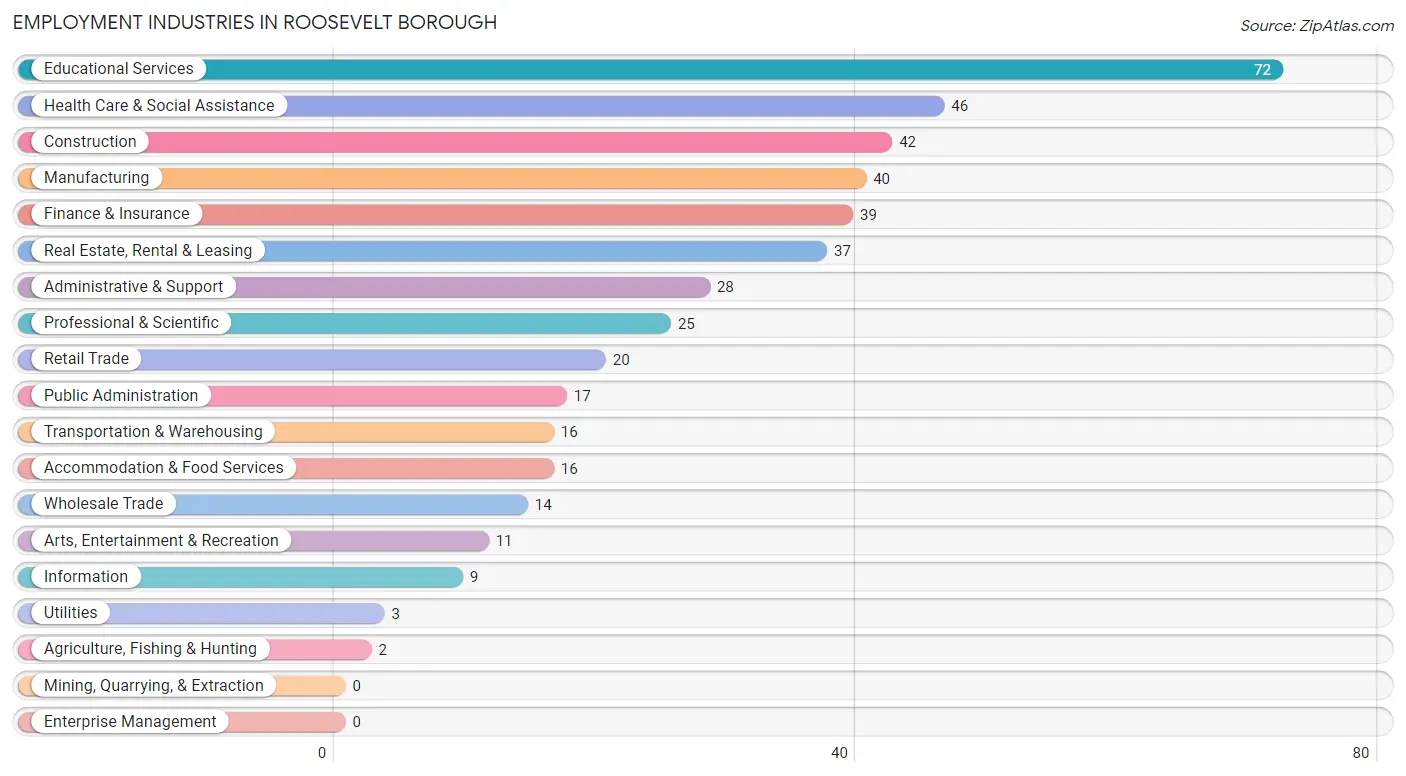
Employment Industries in Roosevelt borough
The major employment industries in Roosevelt borough include Educational Services (72 | 15.7%), Health Care & Social Assistance (46 | 10.0%), Construction (42 | 9.1%), Manufacturing (40 | 8.7%), and Finance & Insurance (39 | 8.5%).
Employment Industries by Sex in Roosevelt borough
The Roosevelt borough industries that see more men than women are Wholesale Trade (100.0%), Administrative & Support (92.9%), and Real Estate, Rental & Leasing (91.9%), whereas the industries that tend to have a higher number of women are Agriculture, Fishing & Hunting (100.0%), Utilities (100.0%), and Health Care & Social Assistance (95.7%).
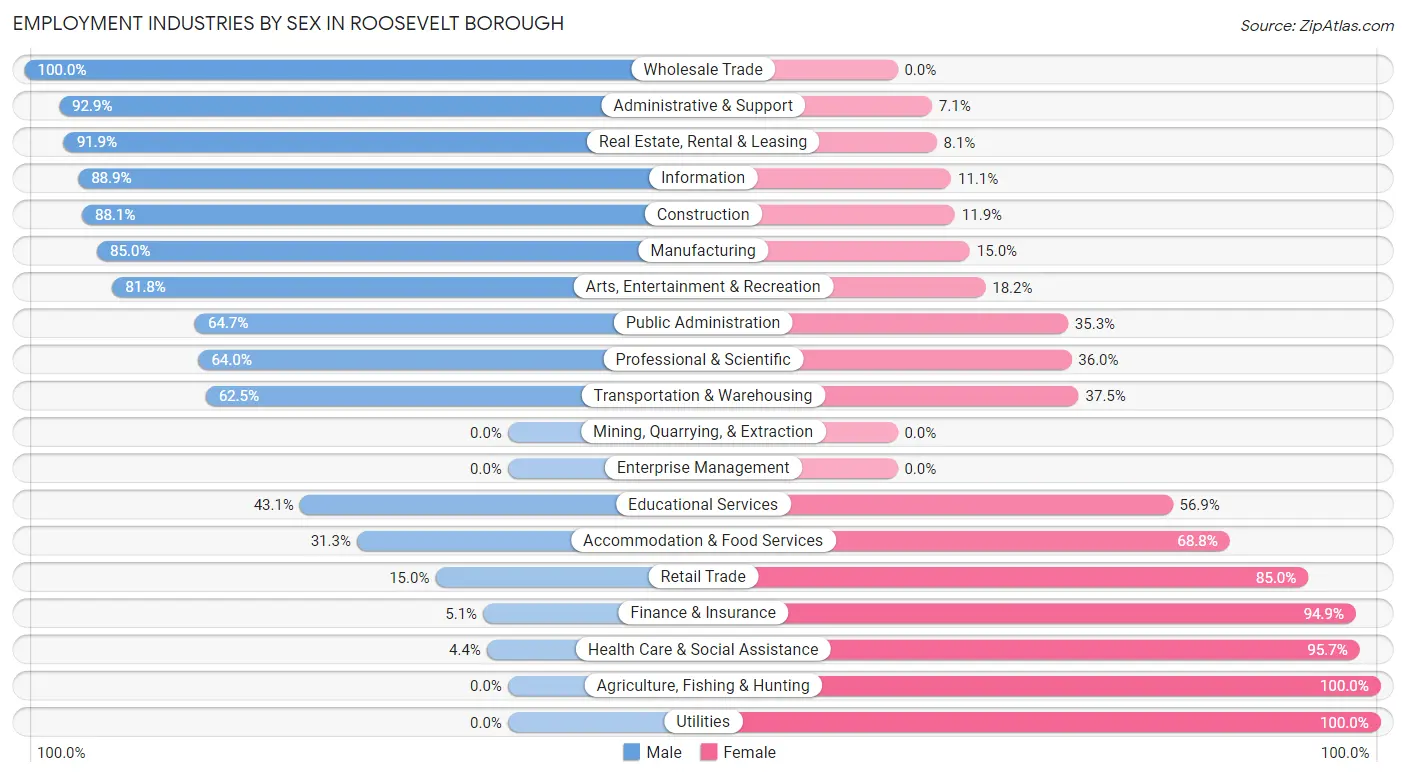
| Industry | Male | Female |
| Agriculture, Fishing & Hunting | 0 (0.0%) | 2 (100.0%) |
| Mining, Quarrying, & Extraction | 0 (0.0%) | 0 (0.0%) |
| Construction | 37 (88.1%) | 5 (11.9%) |
| Manufacturing | 34 (85.0%) | 6 (15.0%) |
| Wholesale Trade | 14 (100.0%) | 0 (0.0%) |
| Retail Trade | 3 (15.0%) | 17 (85.0%) |
| Transportation & Warehousing | 10 (62.5%) | 6 (37.5%) |
| Utilities | 0 (0.0%) | 3 (100.0%) |
| Information | 8 (88.9%) | 1 (11.1%) |
| Finance & Insurance | 2 (5.1%) | 37 (94.9%) |
| Real Estate, Rental & Leasing | 34 (91.9%) | 3 (8.1%) |
| Professional & Scientific | 16 (64.0%) | 9 (36.0%) |
| Enterprise Management | 0 (0.0%) | 0 (0.0%) |
| Administrative & Support | 26 (92.9%) | 2 (7.1%) |
| Educational Services | 31 (43.1%) | 41 (56.9%) |
| Health Care & Social Assistance | 2 (4.3%) | 44 (95.7%) |
| Arts, Entertainment & Recreation | 9 (81.8%) | 2 (18.2%) |
| Accommodation & Food Services | 5 (31.2%) | 11 (68.8%) |
| Public Administration | 11 (64.7%) | 6 (35.3%) |
| Total | 246 (53.6%) | 213 (46.4%) |
Education in Roosevelt borough
School Enrollment in Roosevelt borough
The most common levels of schooling among the 338 students in Roosevelt borough are elementary school (109 | 32.3%), middle school (69 | 20.4%), and high school (59 | 17.5%).
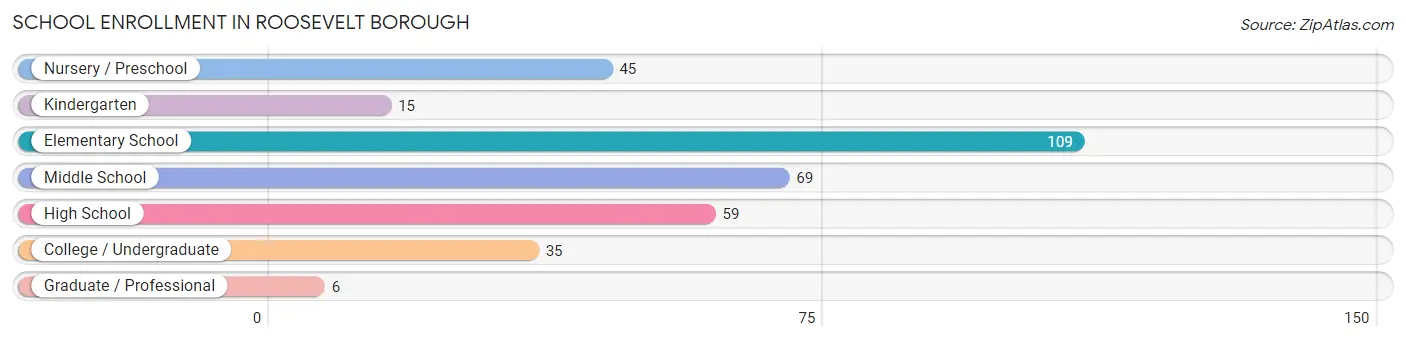
| School Level | # Students | % Students |
| Nursery / Preschool | 45 | 13.3% |
| Kindergarten | 15 | 4.4% |
| Elementary School | 109 | 32.3% |
| Middle School | 69 | 20.4% |
| High School | 59 | 17.5% |
| College / Undergraduate | 35 | 10.4% |
| Graduate / Professional | 6 | 1.8% |
| Total | 338 | 100.0% |
School Enrollment by Age by Funding Source in Roosevelt borough
Out of a total of 338 students who are enrolled in schools in Roosevelt borough, 49 (14.5%) attend a private institution, while the remaining 289 (85.5%) are enrolled in public schools. The age group of 35 years and over has the highest likelihood of being enrolled in private schools, with 4 (100.0% in the age bracket) enrolled. Conversely, the age group of 5 to 9 year old has the lowest likelihood of being enrolled in a private school, with 126 (100.0% in the age bracket) attending a public institution.
| Age Bracket | Public School | Private School |
| 3 to 4 Year Olds | 17 (39.5%) | 26 (60.5%) |
| 5 to 9 Year Old | 126 (100.0%) | 0 (0.0%) |
| 10 to 14 Year Olds | 69 (100.0%) | 0 (0.0%) |
| 15 to 17 Year Olds | 22 (91.7%) | 2 (8.3%) |
| 18 to 19 Year Olds | 40 (76.9%) | 12 (23.1%) |
| 20 to 24 Year Olds | 7 (58.3%) | 5 (41.7%) |
| 25 to 34 Year Olds | 8 (100.0%) | 0 (0.0%) |
| 35 Years and over | 0 (0.0%) | 4 (100.0%) |
| Total | 289 (85.5%) | 49 (14.5%) |
Educational Attainment by Field of Study in Roosevelt borough
Education (46 | 14.3%), bio, nature & agricultural (37 | 11.5%), engineering (35 | 10.9%), visual & performing arts (34 | 10.6%), and social sciences (30 | 9.3%) are the most common fields of study among 321 individuals in Roosevelt borough who have obtained a bachelor's degree or higher.
| Field of Study | # Graduates | % Graduates |
| Computers & Mathematics | 6 | 1.9% |
| Bio, Nature & Agricultural | 37 | 11.5% |
| Physical & Health Sciences | 6 | 1.9% |
| Psychology | 26 | 8.1% |
| Social Sciences | 30 | 9.3% |
| Engineering | 35 | 10.9% |
| Multidisciplinary Studies | 0 | 0.0% |
| Science & Technology | 5 | 1.6% |
| Business | 29 | 9.0% |
| Education | 46 | 14.3% |
| Literature & Languages | 12 | 3.7% |
| Liberal Arts & History | 17 | 5.3% |
| Visual & Performing Arts | 34 | 10.6% |
| Communications | 21 | 6.5% |
| Arts & Humanities | 17 | 5.3% |
| Total | 321 | 100.0% |
Transportation & Commute in Roosevelt borough
Vehicle Availability by Sex in Roosevelt borough
The most prevalent vehicle ownership categories in Roosevelt borough are males with 2 vehicles (125, accounting for 51.2%) and females with 2 vehicles (137, making up 60.4%).
| Vehicles Available | Male | Female |
| No Vehicle | 2 (0.8%) | 2 (1.0%) |
| 1 Vehicle | 32 (13.1%) | 6 (2.9%) |
| 2 Vehicles | 125 (51.2%) | 137 (66.2%) |
| 3 Vehicles | 39 (16.0%) | 18 (8.7%) |
| 4 Vehicles | 39 (16.0%) | 28 (13.5%) |
| 5 or more Vehicles | 7 (2.9%) | 16 (7.7%) |
| Total | 244 (100.0%) | 207 (100.0%) |
Commute Time in Roosevelt borough
The most frequently occuring commute durations in Roosevelt borough are 90 or more minutes (59 commuters, 15.5%), 10 to 14 minutes (54 commuters, 14.2%), and 30 to 34 minutes (47 commuters, 12.4%).
| Commute Time | # Commuters | % Commuters |
| Less than 5 Minutes | 15 | 4.0% |
| 5 to 9 Minutes | 3 | 0.8% |
| 10 to 14 Minutes | 54 | 14.2% |
| 15 to 19 Minutes | 34 | 8.9% |
| 20 to 24 Minutes | 22 | 5.8% |
| 25 to 29 Minutes | 23 | 6.0% |
| 30 to 34 Minutes | 47 | 12.4% |
| 35 to 39 Minutes | 27 | 7.1% |
| 40 to 44 Minutes | 23 | 6.0% |
| 45 to 59 Minutes | 35 | 9.2% |
| 60 to 89 Minutes | 38 | 10.0% |
| 90 or more Minutes | 59 | 15.5% |
Commute Time by Sex in Roosevelt borough
The most common commute times in Roosevelt borough are 90 or more minutes (47 commuters, 22.3%) for males and 60 to 89 minutes (31 commuters, 18.3%) for females.
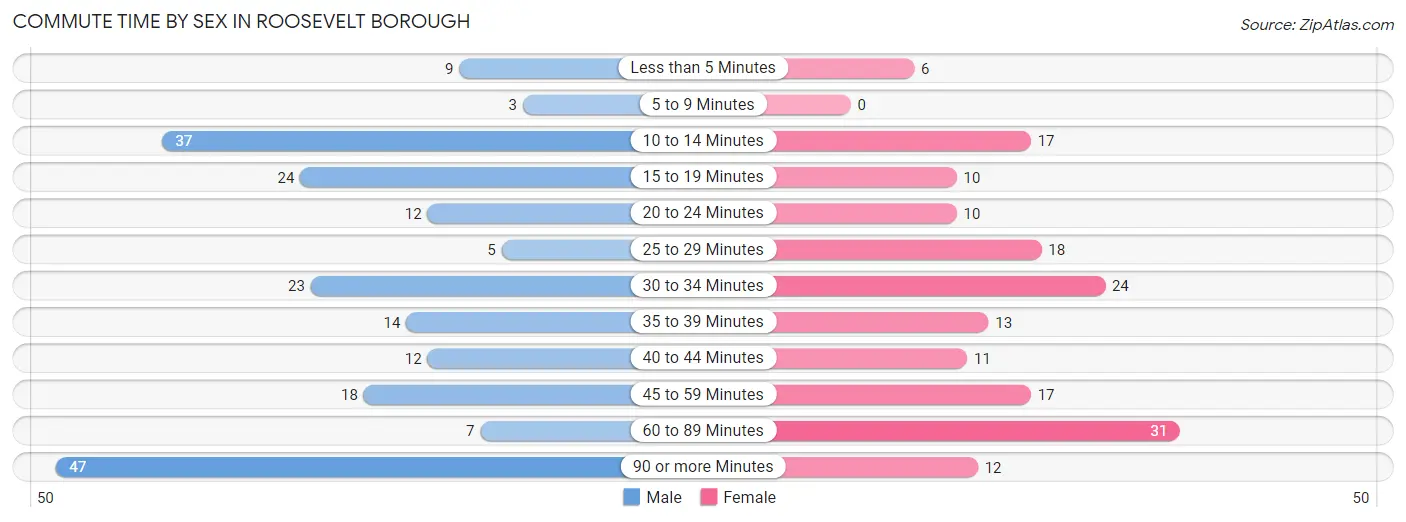
| Commute Time | Male | Female |
| Less than 5 Minutes | 9 (4.3%) | 6 (3.5%) |
| 5 to 9 Minutes | 3 (1.4%) | 0 (0.0%) |
| 10 to 14 Minutes | 37 (17.5%) | 17 (10.1%) |
| 15 to 19 Minutes | 24 (11.4%) | 10 (5.9%) |
| 20 to 24 Minutes | 12 (5.7%) | 10 (5.9%) |
| 25 to 29 Minutes | 5 (2.4%) | 18 (10.6%) |
| 30 to 34 Minutes | 23 (10.9%) | 24 (14.2%) |
| 35 to 39 Minutes | 14 (6.6%) | 13 (7.7%) |
| 40 to 44 Minutes | 12 (5.7%) | 11 (6.5%) |
| 45 to 59 Minutes | 18 (8.5%) | 17 (10.1%) |
| 60 to 89 Minutes | 7 (3.3%) | 31 (18.3%) |
| 90 or more Minutes | 47 (22.3%) | 12 (7.1%) |
Time of Departure to Work by Sex in Roosevelt borough
The most frequent times of departure to work in Roosevelt borough are 7:00 AM to 7:29 AM (69, 32.7%) for males and 7:00 AM to 7:29 AM (49, 29.0%) for females.
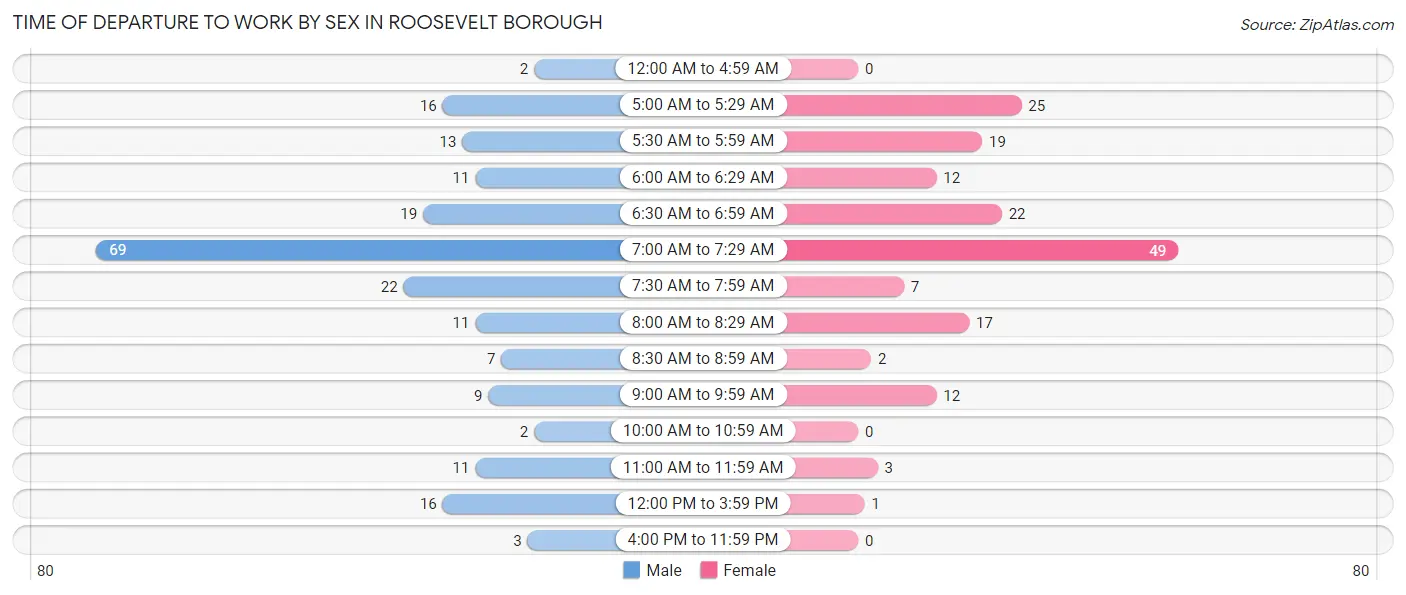
| Time of Departure | Male | Female |
| 12:00 AM to 4:59 AM | 2 (0.9%) | 0 (0.0%) |
| 5:00 AM to 5:29 AM | 16 (7.6%) | 25 (14.8%) |
| 5:30 AM to 5:59 AM | 13 (6.2%) | 19 (11.2%) |
| 6:00 AM to 6:29 AM | 11 (5.2%) | 12 (7.1%) |
| 6:30 AM to 6:59 AM | 19 (9.0%) | 22 (13.0%) |
| 7:00 AM to 7:29 AM | 69 (32.7%) | 49 (29.0%) |
| 7:30 AM to 7:59 AM | 22 (10.4%) | 7 (4.1%) |
| 8:00 AM to 8:29 AM | 11 (5.2%) | 17 (10.1%) |
| 8:30 AM to 8:59 AM | 7 (3.3%) | 2 (1.2%) |
| 9:00 AM to 9:59 AM | 9 (4.3%) | 12 (7.1%) |
| 10:00 AM to 10:59 AM | 2 (0.9%) | 0 (0.0%) |
| 11:00 AM to 11:59 AM | 11 (5.2%) | 3 (1.8%) |
| 12:00 PM to 3:59 PM | 16 (7.6%) | 1 (0.6%) |
| 4:00 PM to 11:59 PM | 3 (1.4%) | 0 (0.0%) |
| Total | 211 (100.0%) | 169 (100.0%) |
Housing Occupancy in Roosevelt borough
Occupancy by Ownership in Roosevelt borough
Of the total 335 dwellings in Roosevelt borough, owner-occupied units account for 274 (81.8%), while renter-occupied units make up 61 (18.2%).
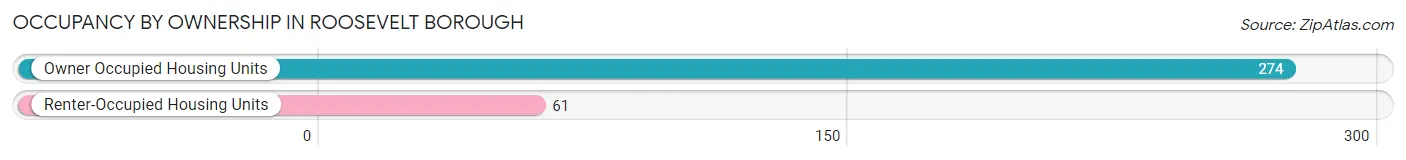
| Occupancy | # Housing Units | % Housing Units |
| Owner Occupied Housing Units | 274 | 81.8% |
| Renter-Occupied Housing Units | 61 | 18.2% |
| Total Occupied Housing Units | 335 | 100.0% |
Occupancy by Household Size in Roosevelt borough
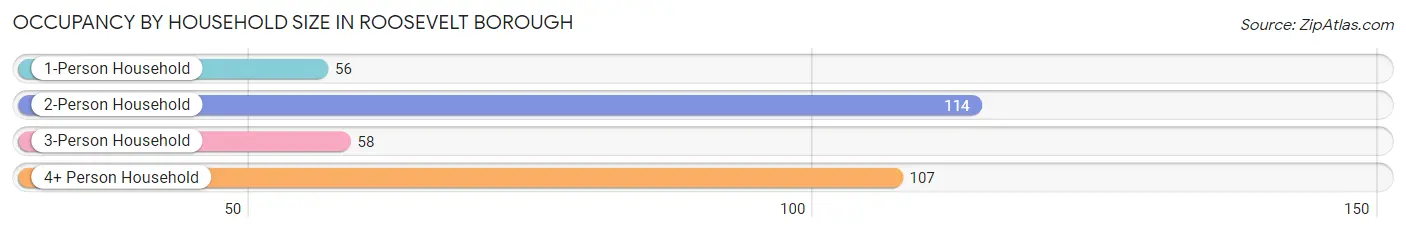
| Household Size | # Housing Units | % Housing Units |
| 1-Person Household | 56 | 16.7% |
| 2-Person Household | 114 | 34.0% |
| 3-Person Household | 58 | 17.3% |
| 4+ Person Household | 107 | 31.9% |
| Total Housing Units | 335 | 100.0% |
Occupancy by Ownership by Household Size in Roosevelt borough
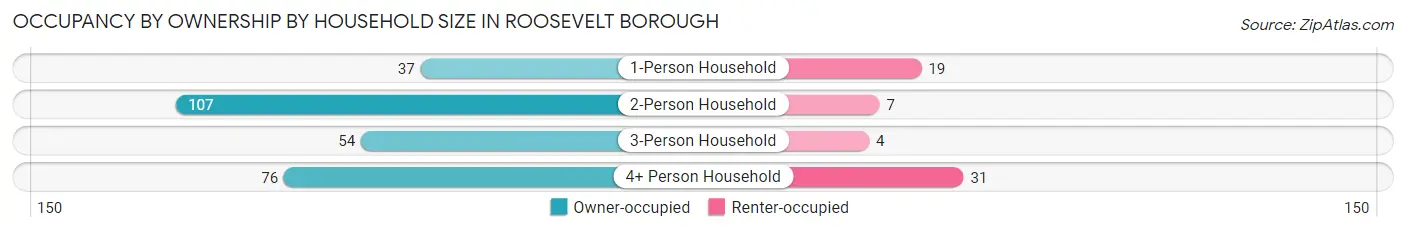
| Household Size | Owner-occupied | Renter-occupied |
| 1-Person Household | 37 (66.1%) | 19 (33.9%) |
| 2-Person Household | 107 (93.9%) | 7 (6.1%) |
| 3-Person Household | 54 (93.1%) | 4 (6.9%) |
| 4+ Person Household | 76 (71.0%) | 31 (29.0%) |
| Total Housing Units | 274 (81.8%) | 61 (18.2%) |
Occupancy by Educational Attainment in Roosevelt borough
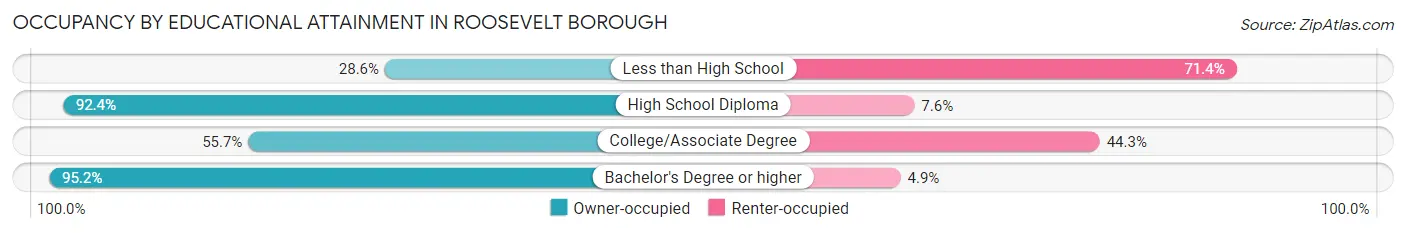
| Household Size | Owner-occupied | Renter-occupied |
| Less than High School | 2 (28.6%) | 5 (71.4%) |
| High School Diploma | 61 (92.4%) | 5 (7.6%) |
| College/Associate Degree | 54 (55.7%) | 43 (44.3%) |
| Bachelor's Degree or higher | 157 (95.2%) | 8 (4.9%) |
Occupancy by Age of Householder in Roosevelt borough
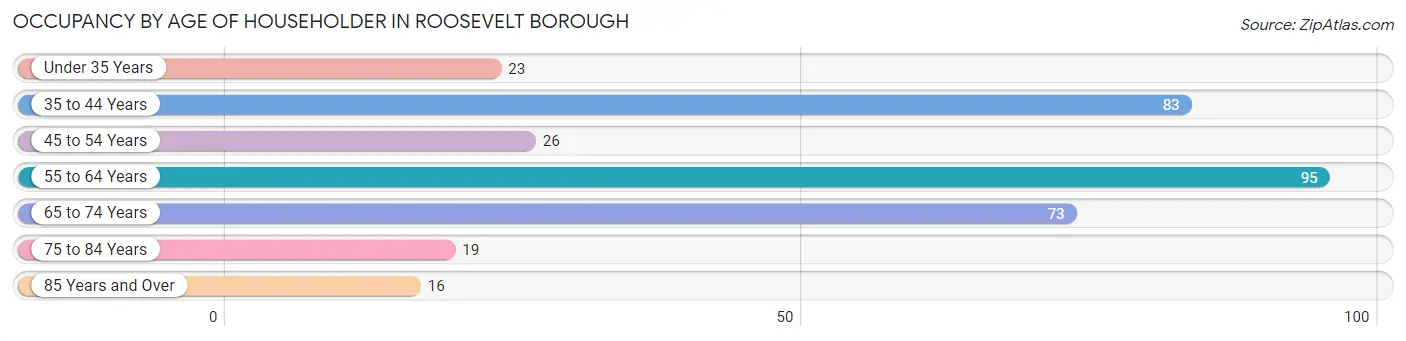
| Age Bracket | # Households | % Households |
| Under 35 Years | 23 | 6.9% |
| 35 to 44 Years | 83 | 24.8% |
| 45 to 54 Years | 26 | 7.8% |
| 55 to 64 Years | 95 | 28.4% |
| 65 to 74 Years | 73 | 21.8% |
| 75 to 84 Years | 19 | 5.7% |
| 85 Years and Over | 16 | 4.8% |
| Total | 335 | 100.0% |
Housing Finances in Roosevelt borough
Median Income by Occupancy in Roosevelt borough
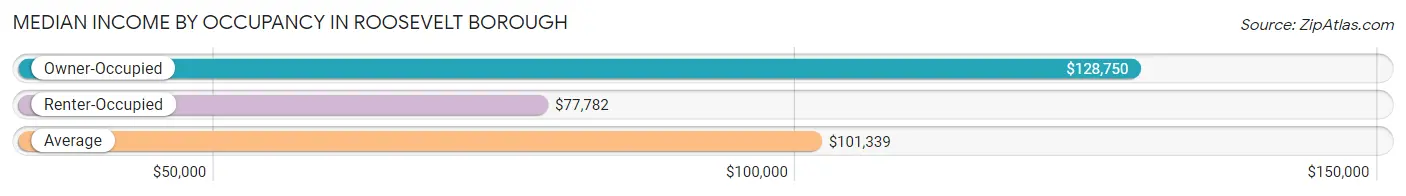
| Occupancy Type | # Households | Median Income |
| Owner-Occupied | 274 (81.8%) | $128,750 |
| Renter-Occupied | 61 (18.2%) | $77,782 |
| Average | 335 (100.0%) | $101,339 |
Occupancy by Householder Income Bracket in Roosevelt borough
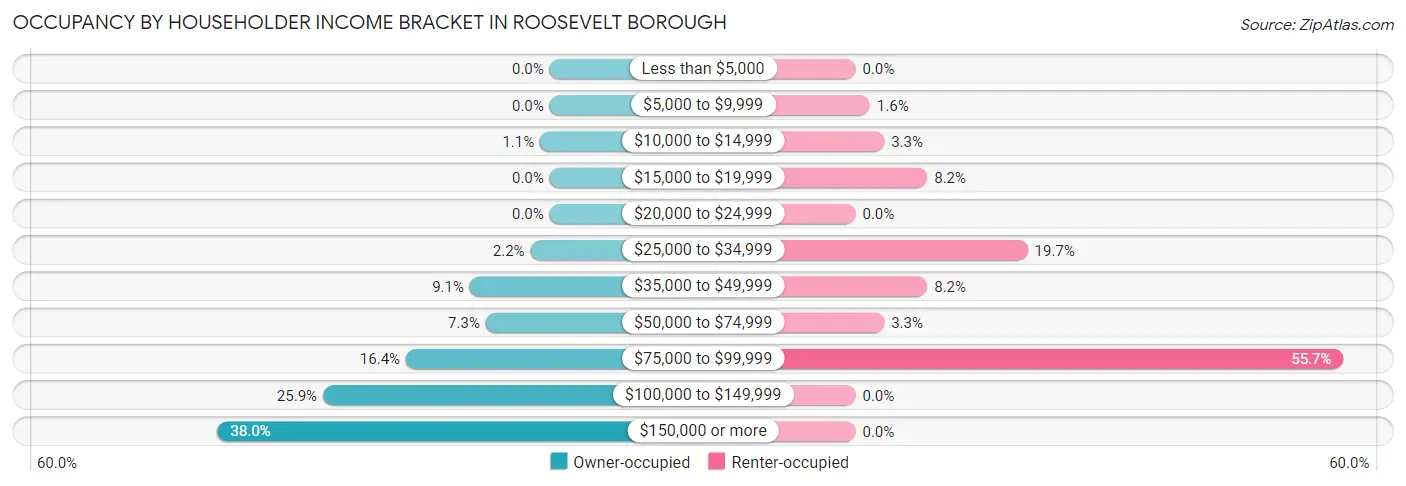
| Income Bracket | Owner-occupied | Renter-occupied |
| Less than $5,000 | 0 (0.0%) | 0 (0.0%) |
| $5,000 to $9,999 | 0 (0.0%) | 1 (1.6%) |
| $10,000 to $14,999 | 3 (1.1%) | 2 (3.3%) |
| $15,000 to $19,999 | 0 (0.0%) | 5 (8.2%) |
| $20,000 to $24,999 | 0 (0.0%) | 0 (0.0%) |
| $25,000 to $34,999 | 6 (2.2%) | 12 (19.7%) |
| $35,000 to $49,999 | 25 (9.1%) | 5 (8.2%) |
| $50,000 to $74,999 | 20 (7.3%) | 2 (3.3%) |
| $75,000 to $99,999 | 45 (16.4%) | 34 (55.7%) |
| $100,000 to $149,999 | 71 (25.9%) | 0 (0.0%) |
| $150,000 or more | 104 (38.0%) | 0 (0.0%) |
| Total | 274 (100.0%) | 61 (100.0%) |
Monthly Housing Cost Tiers in Roosevelt borough
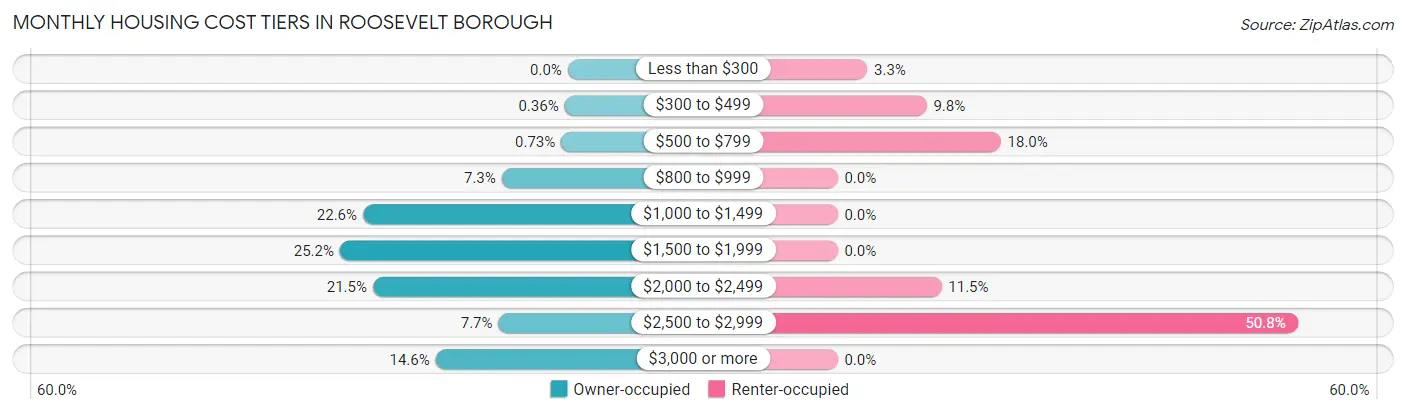
| Monthly Cost | Owner-occupied | Renter-occupied |
| Less than $300 | 0 (0.0%) | 2 (3.3%) |
| $300 to $499 | 1 (0.4%) | 6 (9.8%) |
| $500 to $799 | 2 (0.7%) | 11 (18.0%) |
| $800 to $999 | 20 (7.3%) | 0 (0.0%) |
| $1,000 to $1,499 | 62 (22.6%) | 0 (0.0%) |
| $1,500 to $1,999 | 69 (25.2%) | 0 (0.0%) |
| $2,000 to $2,499 | 59 (21.5%) | 7 (11.5%) |
| $2,500 to $2,999 | 21 (7.7%) | 31 (50.8%) |
| $3,000 or more | 40 (14.6%) | 0 (0.0%) |
| Total | 274 (100.0%) | 61 (100.0%) |
Physical Housing Characteristics in Roosevelt borough
Housing Structures in Roosevelt borough
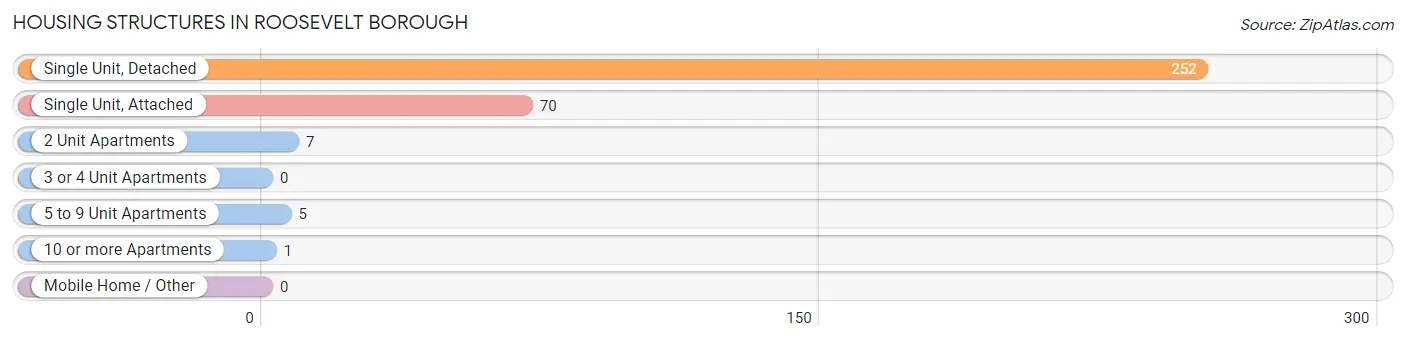
| Structure Type | # Housing Units | % Housing Units |
| Single Unit, Detached | 252 | 75.2% |
| Single Unit, Attached | 70 | 20.9% |
| 2 Unit Apartments | 7 | 2.1% |
| 3 or 4 Unit Apartments | 0 | 0.0% |
| 5 to 9 Unit Apartments | 5 | 1.5% |
| 10 or more Apartments | 1 | 0.3% |
| Mobile Home / Other | 0 | 0.0% |
| Total | 335 | 100.0% |
Housing Structures by Occupancy in Roosevelt borough
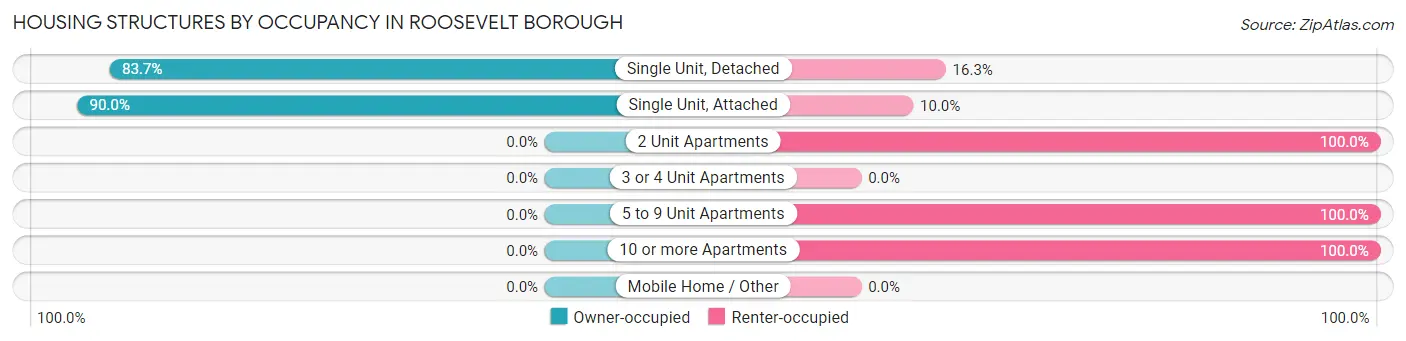
| Structure Type | Owner-occupied | Renter-occupied |
| Single Unit, Detached | 211 (83.7%) | 41 (16.3%) |
| Single Unit, Attached | 63 (90.0%) | 7 (10.0%) |
| 2 Unit Apartments | 0 (0.0%) | 7 (100.0%) |
| 3 or 4 Unit Apartments | 0 (0.0%) | 0 (0.0%) |
| 5 to 9 Unit Apartments | 0 (0.0%) | 5 (100.0%) |
| 10 or more Apartments | 0 (0.0%) | 1 (100.0%) |
| Mobile Home / Other | 0 (0.0%) | 0 (0.0%) |
| Total | 274 (81.8%) | 61 (18.2%) |
Housing Structures by Number of Rooms in Roosevelt borough
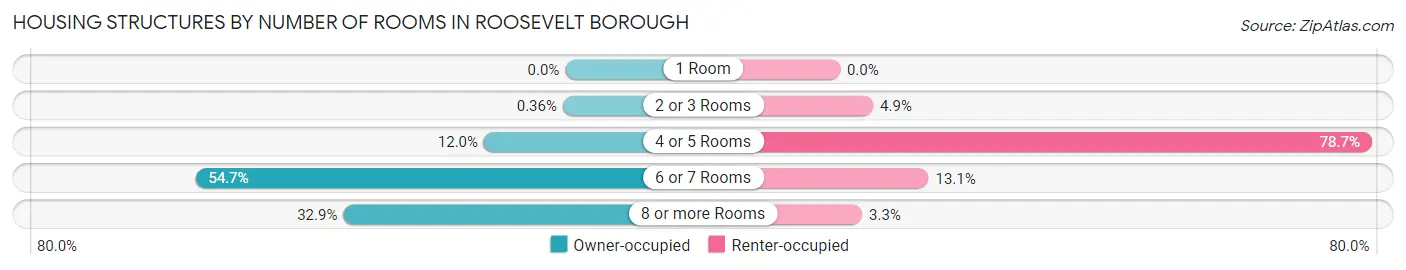
| Number of Rooms | Owner-occupied | Renter-occupied |
| 1 Room | 0 (0.0%) | 0 (0.0%) |
| 2 or 3 Rooms | 1 (0.4%) | 3 (4.9%) |
| 4 or 5 Rooms | 33 (12.0%) | 48 (78.7%) |
| 6 or 7 Rooms | 150 (54.7%) | 8 (13.1%) |
| 8 or more Rooms | 90 (32.9%) | 2 (3.3%) |
| Total | 274 (100.0%) | 61 (100.0%) |
Housing Structure by Heating Type in Roosevelt borough
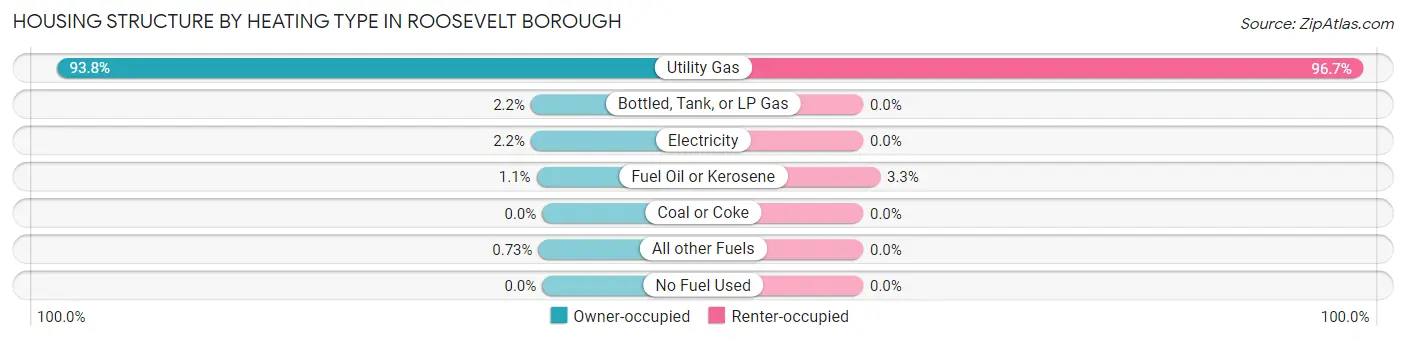
| Heating Type | Owner-occupied | Renter-occupied |
| Utility Gas | 257 (93.8%) | 59 (96.7%) |
| Bottled, Tank, or LP Gas | 6 (2.2%) | 0 (0.0%) |
| Electricity | 6 (2.2%) | 0 (0.0%) |
| Fuel Oil or Kerosene | 3 (1.1%) | 2 (3.3%) |
| Coal or Coke | 0 (0.0%) | 0 (0.0%) |
| All other Fuels | 2 (0.7%) | 0 (0.0%) |
| No Fuel Used | 0 (0.0%) | 0 (0.0%) |
| Total | 274 (100.0%) | 61 (100.0%) |
Household Vehicle Usage in Roosevelt borough
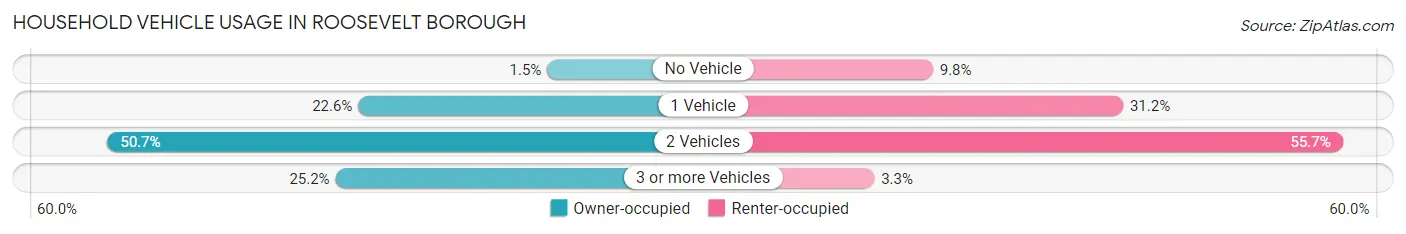
| Vehicles per Household | Owner-occupied | Renter-occupied |
| No Vehicle | 4 (1.5%) | 6 (9.8%) |
| 1 Vehicle | 62 (22.6%) | 19 (31.1%) |
| 2 Vehicles | 139 (50.7%) | 34 (55.7%) |
| 3 or more Vehicles | 69 (25.2%) | 2 (3.3%) |
| Total | 274 (100.0%) | 61 (100.0%) |
Real Estate & Mortgages in Roosevelt borough
Real Estate and Mortgage Overview in Roosevelt borough
| Characteristic | Without Mortgage | With Mortgage |
| Housing Units | 104 | 170 |
| Median Property Value | $326,100 | $352,600 |
| Median Household Income | $144,167 | $57 |
| Monthly Housing Costs | $1,188 | $40 |
| Real Estate Taxes | $8,397 | $0 |
Property Value by Mortgage Status in Roosevelt borough
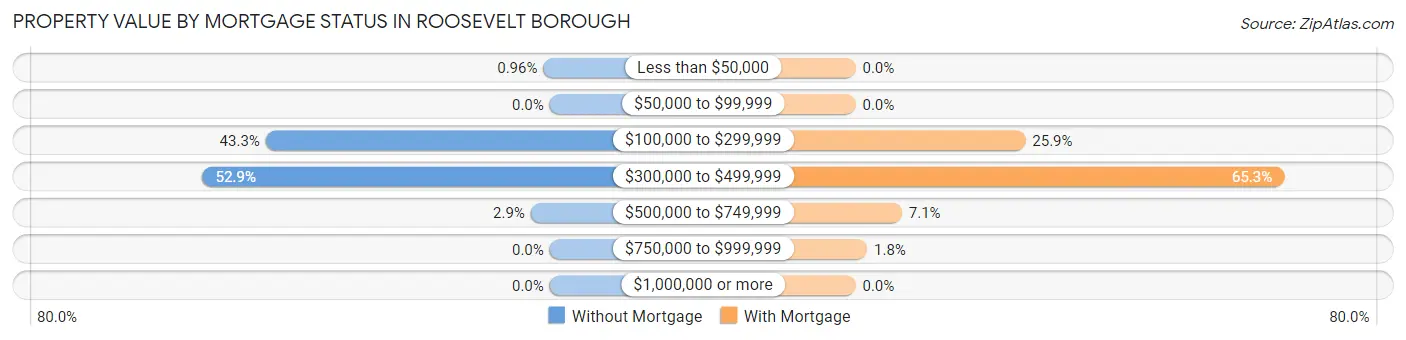
| Property Value | Without Mortgage | With Mortgage |
| Less than $50,000 | 1 (1.0%) | 0 (0.0%) |
| $50,000 to $99,999 | 0 (0.0%) | 0 (0.0%) |
| $100,000 to $299,999 | 45 (43.3%) | 44 (25.9%) |
| $300,000 to $499,999 | 55 (52.9%) | 111 (65.3%) |
| $500,000 to $749,999 | 3 (2.9%) | 12 (7.1%) |
| $750,000 to $999,999 | 0 (0.0%) | 3 (1.8%) |
| $1,000,000 or more | 0 (0.0%) | 0 (0.0%) |
| Total | 104 (100.0%) | 170 (100.0%) |
Household Income by Mortgage Status in Roosevelt borough
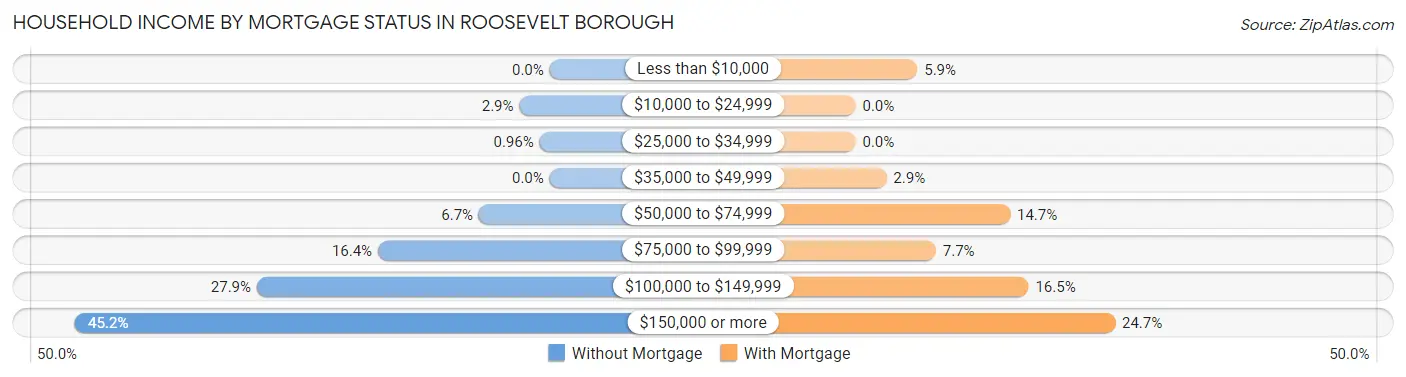
| Household Income | Without Mortgage | With Mortgage |
| Less than $10,000 | 0 (0.0%) | 10 (5.9%) |
| $10,000 to $24,999 | 3 (2.9%) | 0 (0.0%) |
| $25,000 to $34,999 | 1 (1.0%) | 0 (0.0%) |
| $35,000 to $49,999 | 0 (0.0%) | 5 (2.9%) |
| $50,000 to $74,999 | 7 (6.7%) | 25 (14.7%) |
| $75,000 to $99,999 | 17 (16.4%) | 13 (7.6%) |
| $100,000 to $149,999 | 29 (27.9%) | 28 (16.5%) |
| $150,000 or more | 47 (45.2%) | 42 (24.7%) |
| Total | 104 (100.0%) | 170 (100.0%) |
Property Value to Household Income Ratio in Roosevelt borough
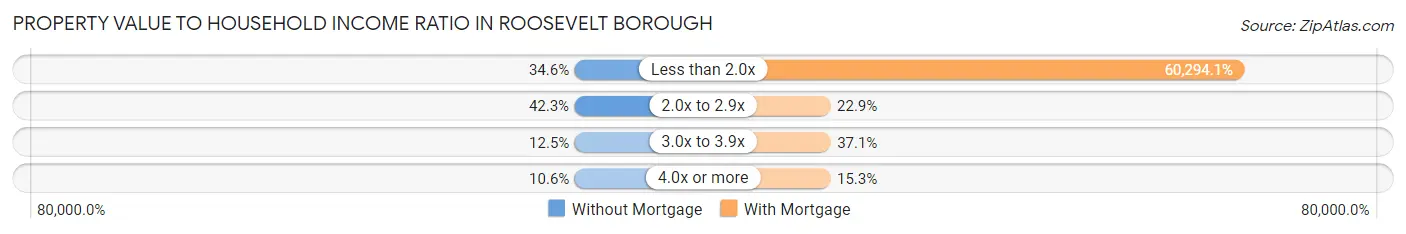
| Value-to-Income Ratio | Without Mortgage | With Mortgage |
| Less than 2.0x | 36 (34.6%) | 102,500 (60,294.1%) |
| 2.0x to 2.9x | 44 (42.3%) | 39 (22.9%) |
| 3.0x to 3.9x | 13 (12.5%) | 63 (37.1%) |
| 4.0x or more | 11 (10.6%) | 26 (15.3%) |
| Total | 104 (100.0%) | 170 (100.0%) |
Real Estate Taxes by Mortgage Status in Roosevelt borough
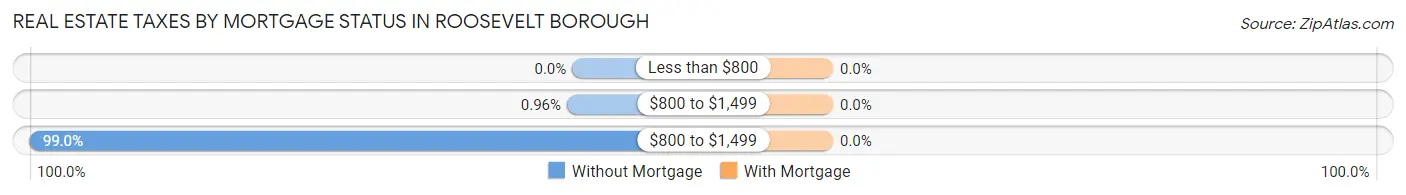
| Property Taxes | Without Mortgage | With Mortgage |
| Less than $800 | 0 (0.0%) | 0 (0.0%) |
| $800 to $1,499 | 1 (1.0%) | 0 (0.0%) |
| $800 to $1,499 | 103 (99.0%) | 0 (0.0%) |
| Total | 104 (100.0%) | 170 (100.0%) |
Health & Disability in Roosevelt borough
Health Insurance Coverage by Age in Roosevelt borough
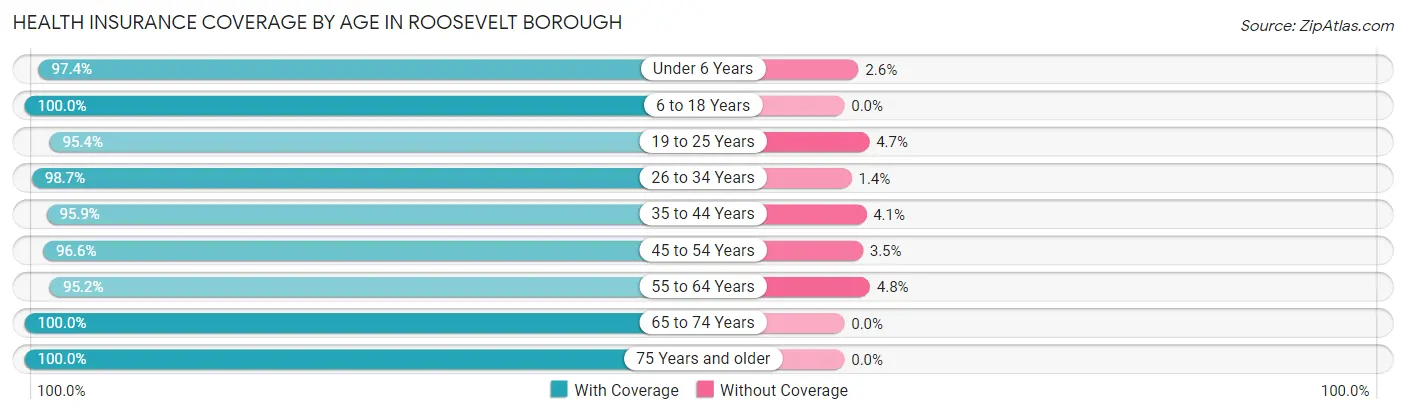
| Age Bracket | With Coverage | Without Coverage |
| Under 6 Years | 111 (97.4%) | 3 (2.6%) |
| 6 to 18 Years | 252 (100.0%) | 0 (0.0%) |
| 19 to 25 Years | 41 (95.4%) | 2 (4.6%) |
| 26 to 34 Years | 73 (98.7%) | 1 (1.3%) |
| 35 to 44 Years | 141 (95.9%) | 6 (4.1%) |
| 45 to 54 Years | 56 (96.6%) | 2 (3.5%) |
| 55 to 64 Years | 160 (95.2%) | 8 (4.8%) |
| 65 to 74 Years | 121 (100.0%) | 0 (0.0%) |
| 75 Years and older | 60 (100.0%) | 0 (0.0%) |
| Total | 1,015 (97.9%) | 22 (2.1%) |
Health Insurance Coverage by Citizenship Status in Roosevelt borough
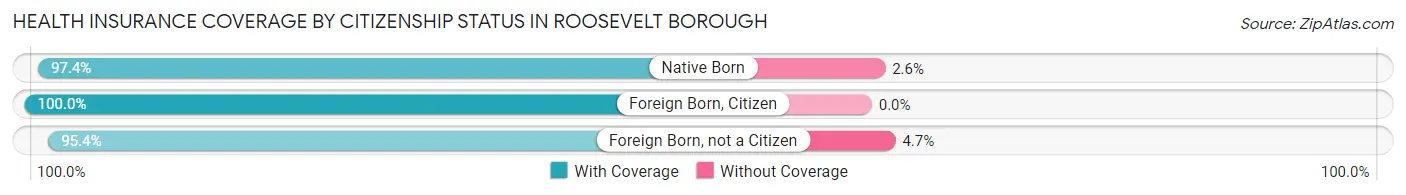
| Citizenship Status | With Coverage | Without Coverage |
| Native Born | 111 (97.4%) | 3 (2.6%) |
| Foreign Born, Citizen | 252 (100.0%) | 0 (0.0%) |
| Foreign Born, not a Citizen | 41 (95.4%) | 2 (4.6%) |
Health Insurance Coverage by Household Income in Roosevelt borough
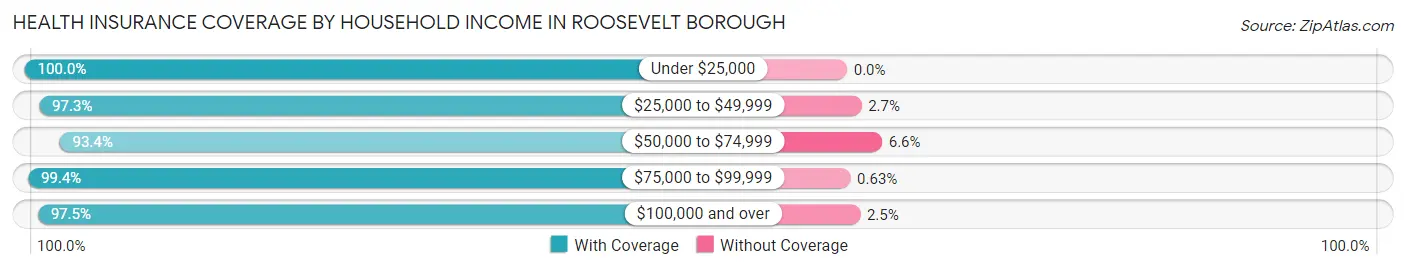
| Household Income | With Coverage | Without Coverage |
| Under $25,000 | 14 (100.0%) | 0 (0.0%) |
| $25,000 to $49,999 | 72 (97.3%) | 2 (2.7%) |
| $50,000 to $74,999 | 57 (93.4%) | 4 (6.6%) |
| $75,000 to $99,999 | 317 (99.4%) | 2 (0.6%) |
| $100,000 and over | 555 (97.5%) | 14 (2.5%) |
Public vs Private Health Insurance Coverage by Age in Roosevelt borough
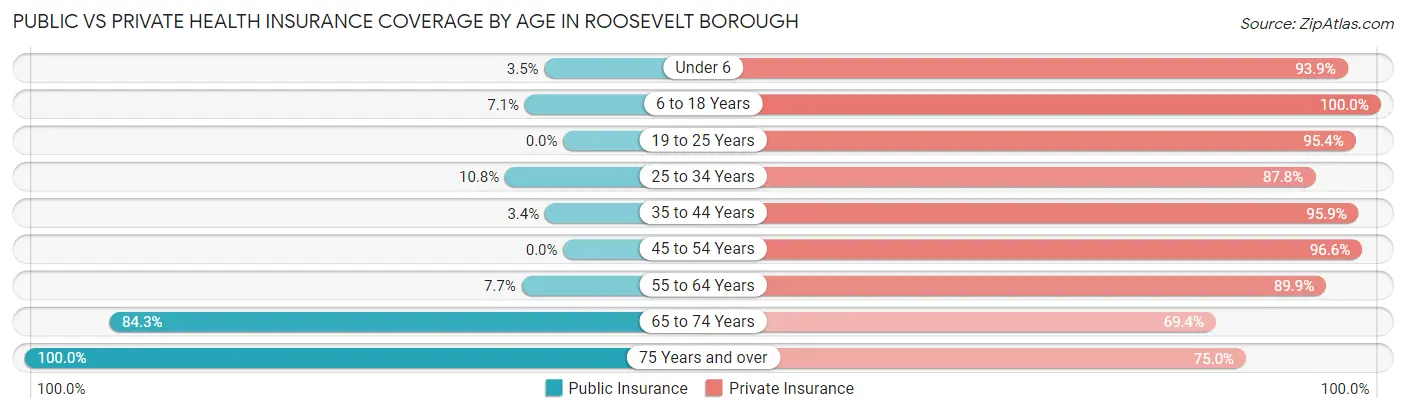
| Age Bracket | Public Insurance | Private Insurance |
| Under 6 | 4 (3.5%) | 107 (93.9%) |
| 6 to 18 Years | 18 (7.1%) | 252 (100.0%) |
| 19 to 25 Years | 0 (0.0%) | 41 (95.4%) |
| 25 to 34 Years | 8 (10.8%) | 65 (87.8%) |
| 35 to 44 Years | 5 (3.4%) | 141 (95.9%) |
| 45 to 54 Years | 0 (0.0%) | 56 (96.6%) |
| 55 to 64 Years | 13 (7.7%) | 151 (89.9%) |
| 65 to 74 Years | 102 (84.3%) | 84 (69.4%) |
| 75 Years and over | 60 (100.0%) | 45 (75.0%) |
| Total | 210 (20.3%) | 942 (90.8%) |
Disability Status by Sex by Age in Roosevelt borough
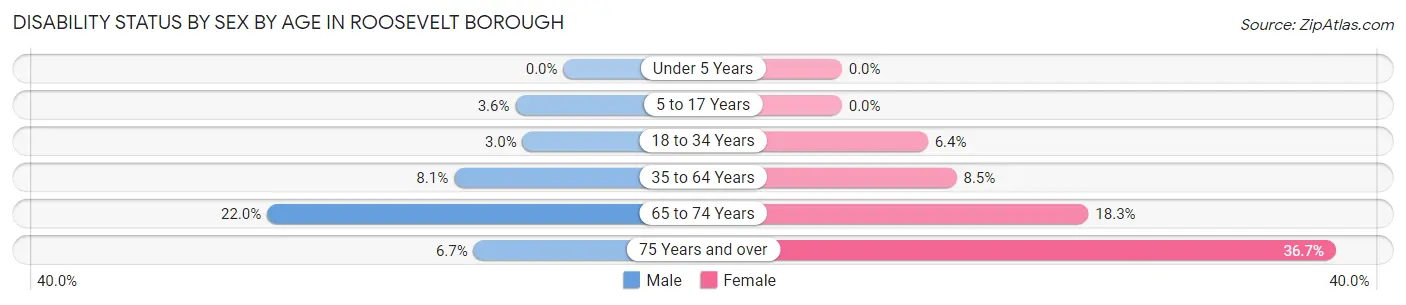
| Age Bracket | Male | Female |
| Under 5 Years | 0 (0.0%) | 0 (0.0%) |
| 5 to 17 Years | 3 (3.6%) | 0 (0.0%) |
| 18 to 34 Years | 2 (3.0%) | 6 (6.4%) |
| 35 to 64 Years | 16 (8.1%) | 15 (8.5%) |
| 65 to 74 Years | 11 (22.0%) | 13 (18.3%) |
| 75 Years and over | 2 (6.7%) | 11 (36.7%) |
Disability Class by Sex by Age in Roosevelt borough
Disability Class: Hearing Difficulty
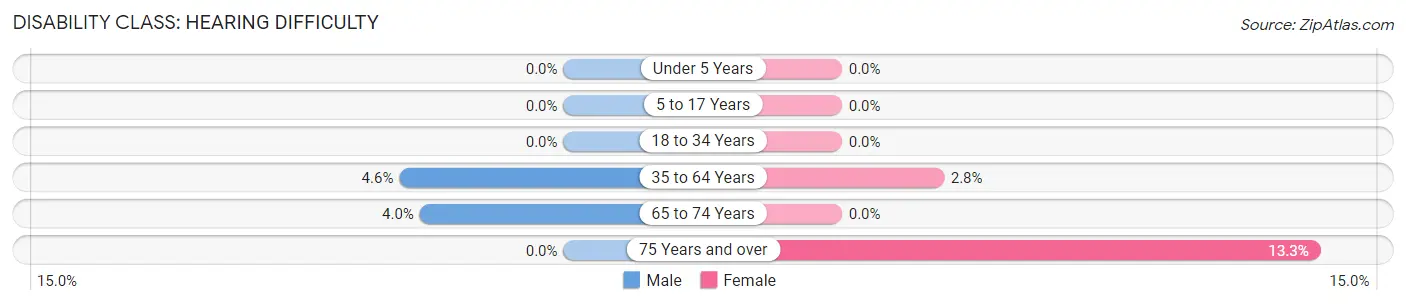
| Age Bracket | Male | Female |
| Under 5 Years | 0 (0.0%) | 0 (0.0%) |
| 5 to 17 Years | 0 (0.0%) | 0 (0.0%) |
| 18 to 34 Years | 0 (0.0%) | 0 (0.0%) |
| 35 to 64 Years | 9 (4.6%) | 5 (2.8%) |
| 65 to 74 Years | 2 (4.0%) | 0 (0.0%) |
| 75 Years and over | 0 (0.0%) | 4 (13.3%) |
Disability Class: Vision Difficulty
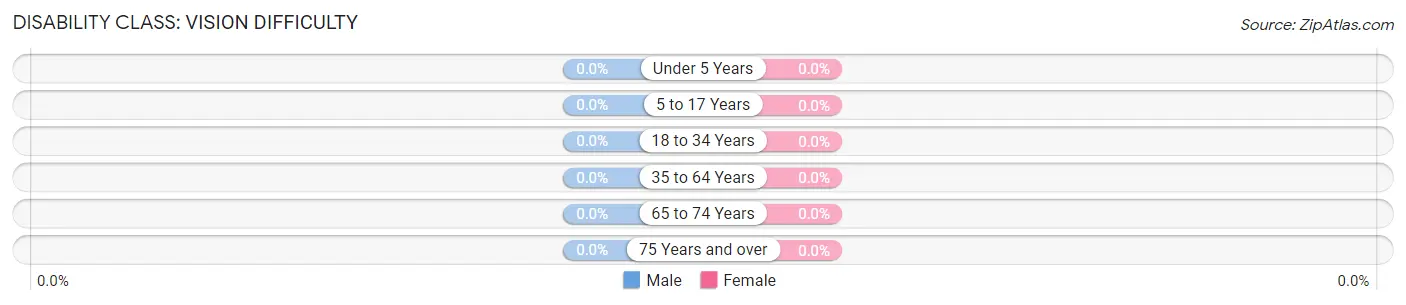
| Age Bracket | Male | Female |
| Under 5 Years | 0 (0.0%) | 0 (0.0%) |
| 5 to 17 Years | 0 (0.0%) | 0 (0.0%) |
| 18 to 34 Years | 0 (0.0%) | 0 (0.0%) |
| 35 to 64 Years | 0 (0.0%) | 0 (0.0%) |
| 65 to 74 Years | 0 (0.0%) | 0 (0.0%) |
| 75 Years and over | 0 (0.0%) | 0 (0.0%) |
Disability Class: Cognitive Difficulty
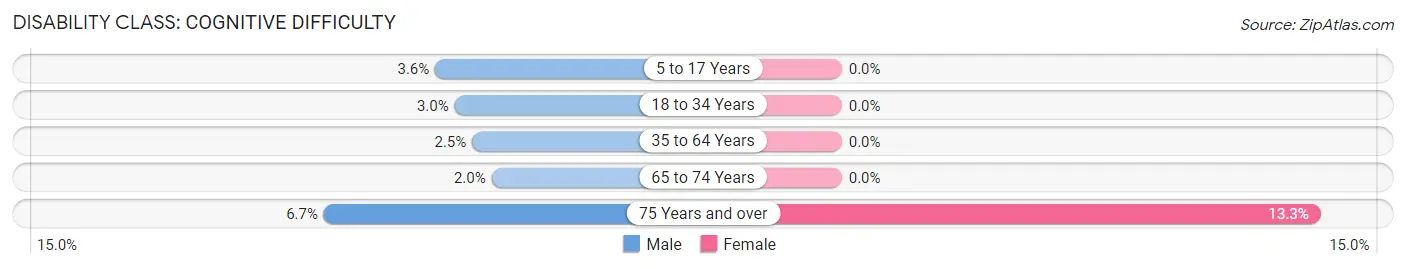
| Age Bracket | Male | Female |
| 5 to 17 Years | 3 (3.6%) | 0 (0.0%) |
| 18 to 34 Years | 2 (3.0%) | 0 (0.0%) |
| 35 to 64 Years | 5 (2.5%) | 0 (0.0%) |
| 65 to 74 Years | 1 (2.0%) | 0 (0.0%) |
| 75 Years and over | 2 (6.7%) | 4 (13.3%) |
Disability Class: Ambulatory Difficulty
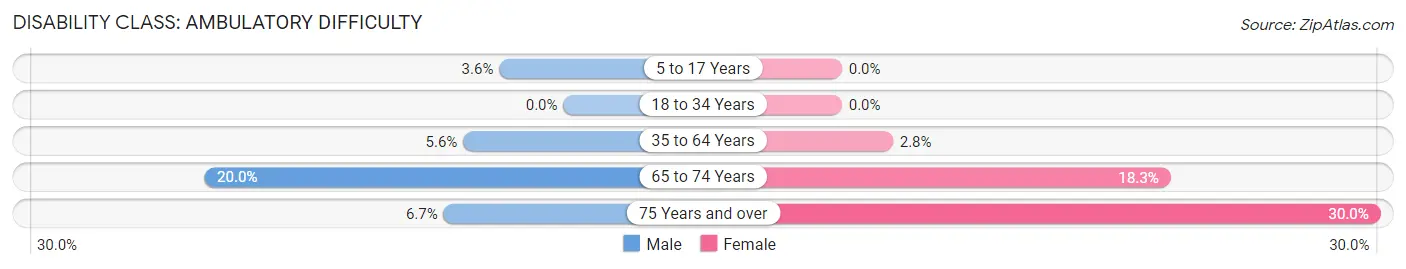
| Age Bracket | Male | Female |
| 5 to 17 Years | 3 (3.6%) | 0 (0.0%) |
| 18 to 34 Years | 0 (0.0%) | 0 (0.0%) |
| 35 to 64 Years | 11 (5.6%) | 5 (2.8%) |
| 65 to 74 Years | 10 (20.0%) | 13 (18.3%) |
| 75 Years and over | 2 (6.7%) | 9 (30.0%) |
Disability Class: Self-Care Difficulty
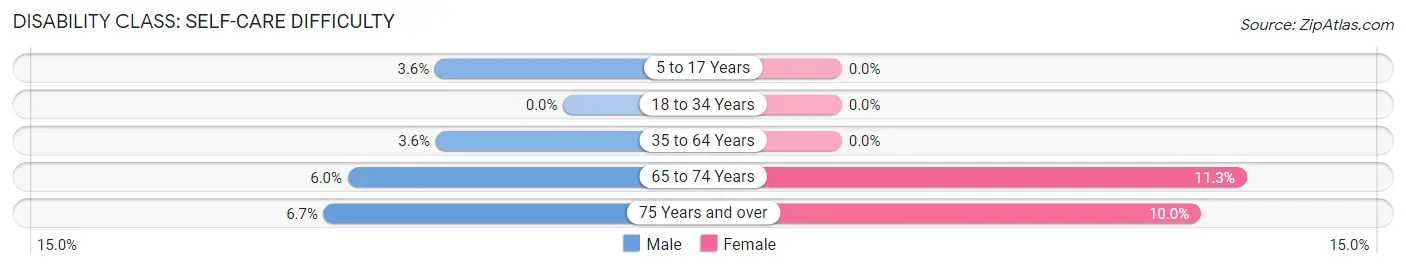
| Age Bracket | Male | Female |
| 5 to 17 Years | 3 (3.6%) | 0 (0.0%) |
| 18 to 34 Years | 0 (0.0%) | 0 (0.0%) |
| 35 to 64 Years | 7 (3.5%) | 0 (0.0%) |
| 65 to 74 Years | 3 (6.0%) | 8 (11.3%) |
| 75 Years and over | 2 (6.7%) | 3 (10.0%) |
Technology Access in Roosevelt borough
Computing Device Access in Roosevelt borough
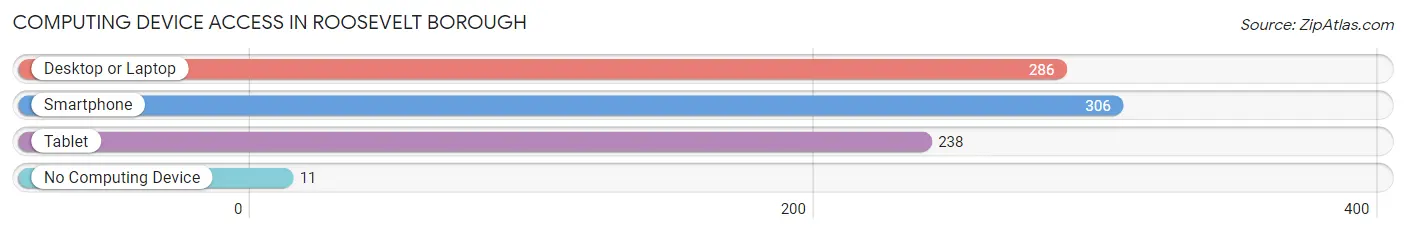
| Device Type | # Households | % Households |
| Desktop or Laptop | 286 | 85.4% |
| Smartphone | 306 | 91.3% |
| Tablet | 238 | 71.0% |
| No Computing Device | 11 | 3.3% |
| Total | 335 | 100.0% |
Internet Access in Roosevelt borough
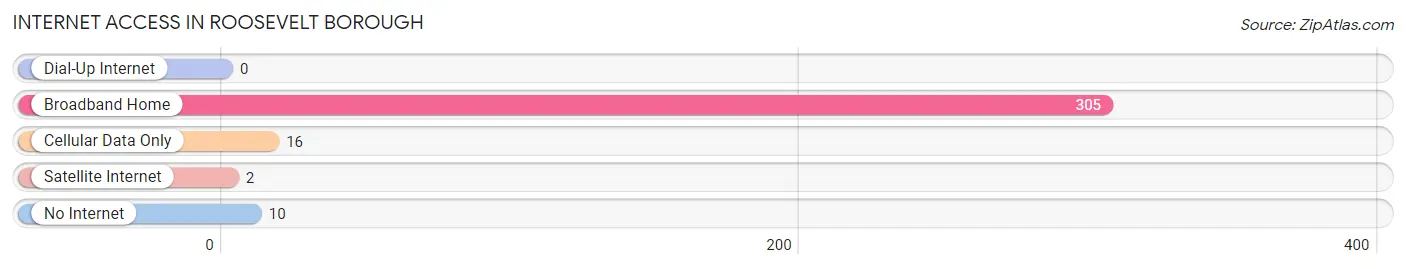
| Internet Type | # Households | % Households |
| Dial-Up Internet | 0 | 0.0% |
| Broadband Home | 305 | 91.0% |
| Cellular Data Only | 16 | 4.8% |
| Satellite Internet | 2 | 0.6% |
| No Internet | 10 | 3.0% |
| Total | 335 | 100.0% |
Roosevelt borough Summary
Roosevelt Borough is a small borough located in Monmouth County, New Jersey. It is situated in the northern part of the county, just south of Freehold Township. The borough was incorporated in 1925 and is home to approximately 2,500 people.
History
The area that is now Roosevelt Borough was originally inhabited by the Lenape Native Americans. The first European settlers arrived in the area in the late 17th century. The area was known as “Roosevelt” after the Roosevelt family, who were among the first settlers. The family owned a large tract of land in the area and operated a mill.
In the early 19th century, the area began to develop as a farming community. The first post office was established in 1851 and the first school was built in 1854. The area was officially incorporated as a borough in 1925.
Geography
Roosevelt Borough is located in northern Monmouth County, just south of Freehold Township. It is bordered to the north by Millstone Township, to the east by Freehold Township, to the south by Manalapan Township, and to the west by Marlboro Township. The borough covers an area of 1.3 square miles and is home to approximately 2,500 people.
The borough is located in the Raritan Valley region of New Jersey. The terrain is mostly flat, with some rolling hills in the northern part of the borough. The borough is located in the Pine Barrens, an area of dense pine forests.
Economy
The economy of Roosevelt Borough is largely based on agriculture and light industry. The borough is home to several small businesses, including a few restaurants, a grocery store, and a few retail stores. The borough also has a few small manufacturing plants.
The borough is home to several farms, which produce a variety of crops, including corn, soybeans, and hay. The borough also has a few wineries and breweries.
Demographics
As of the 2010 census, the population of Roosevelt Borough was 2,521. The racial makeup of the borough was 87.3% White, 5.2% African American, 0.3% Native American, 2.2% Asian, and 4.0% from other races. Hispanic or Latino of any race were 8.2% of the population.
The median household income in the borough was $68,958, and the median family income was $76,944. The per capita income was $30,945. About 4.3% of families and 5.7% of the population were below the poverty line.
Roosevelt Borough is a small borough with a rich history and a diverse population. The borough is home to a variety of businesses and industries, and is a popular destination for tourists and outdoor enthusiasts. The borough is a great place to live, work, and play.
Common Questions
What is Per Capita Income in Roosevelt borough?
Per Capita income in Roosevelt borough is $41,976.
What is the Median Family Income in Roosevelt borough?
Median Family Income in Roosevelt borough is $108,750.
What is the Median Household income in Roosevelt borough?
Median Household Income in Roosevelt borough is $101,339.
What is Income or Wage Gap in Roosevelt borough?
Income or Wage Gap in Roosevelt borough is 12.7%.
Women in Roosevelt borough earn 87.3 cents for every dollar earned by a man.
What is Inequality or Gini Index in Roosevelt borough?
Inequality or Gini Index in Roosevelt borough is 0.36.
What is the Total Population of Roosevelt borough?
Total Population of Roosevelt borough is 1,037.
What is the Total Male Population of Roosevelt borough?
Total Male Population of Roosevelt borough is 463.
What is the Total Female Population of Roosevelt borough?
Total Female Population of Roosevelt borough is 574.
What is the Ratio of Males per 100 Females in Roosevelt borough?
There are 80.66 Males per 100 Females in Roosevelt borough.
What is the Ratio of Females per 100 Males in Roosevelt borough?
There are 123.97 Females per 100 Males in Roosevelt borough.
What is the Median Population Age in Roosevelt borough?
Median Population Age in Roosevelt borough is 38.3 Years.
What is the Average Family Size in Roosevelt borough
Average Family Size in Roosevelt borough is 3.5 People.
What is the Average Household Size in Roosevelt borough
Average Household Size in Roosevelt borough is 3.1 People.
How Large is the Labor Force in Roosevelt borough?
There are 476 People in the Labor Forcein in Roosevelt borough.
What is the Percentage of People in the Labor Force in Roosevelt borough?
65.6% of People are in the Labor Force in Roosevelt borough.
What is the Unemployment Rate in Roosevelt borough?
Unemployment Rate in Roosevelt borough is 3.6%.