Cities with the Highest Percentage of Hispanic or Latino Population in Connecticut
RELATED REPORTS & OPTIONS
Hispanic or Latino
Connecticut
Compare Cities
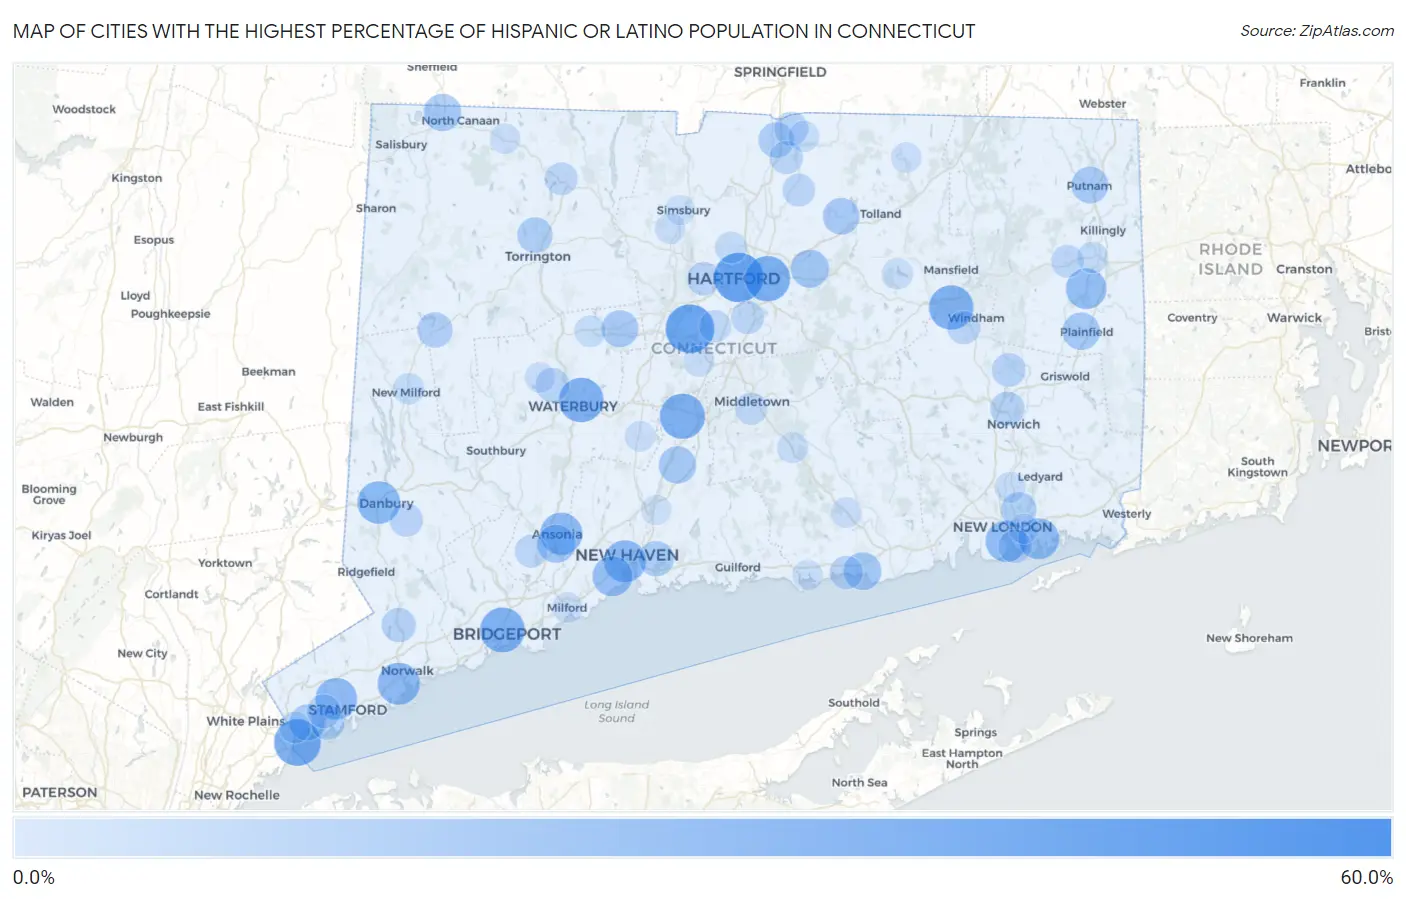
Map of Cities with the Highest Percentage of Hispanic or Latino Population in Connecticut
0.0%
60.0%
Cities with the Highest Percentage of Hispanic or Latino Population in Connecticut
| City | Hispanic or Latino | vs State | vs National | |
| 1. | Sail Harbor | 56.6% | 17.4%(+39.3)#1 | 18.7%(+38.0)#1,667 |
| 2. | Hartford | 46.1% | 17.4%(+28.7)#2 | 18.7%(+27.5)#2,157 |
| 3. | New Britain | 44.3% | 17.4%(+27.0)#3 | 18.7%(+25.7)#2,251 |
| 4. | Byram | 40.5% | 17.4%(+23.1)#4 | 18.7%(+21.8)#2,476 |
| 5. | East Hartford | 37.3% | 17.4%(+20.0)#5 | 18.7%(+18.7)#2,693 |
| 6. | Meriden | 37.1% | 17.4%(+19.7)#6 | 18.7%(+18.4)#2,708 |
| 7. | Bridgeport | 36.2% | 17.4%(+18.9)#7 | 18.7%(+17.6)#2,782 |
| 8. | Waterbury | 35.9% | 17.4%(+18.5)#8 | 18.7%(+17.2)#2,814 |
| 9. | Willimantic | 35.8% | 17.4%(+18.5)#9 | 18.7%(+17.2)#2,815 |
| 10. | Danbury | 31.7% | 17.4%(+14.4)#10 | 18.7%(+13.1)#3,199 |
| 11. | Ansonia | 31.0% | 17.4%(+13.6)#11 | 18.7%(+12.3)#3,286 |
| 12. | Norwalk | 30.8% | 17.4%(+13.4)#12 | 18.7%(+12.1)#3,314 |
| 13. | New Haven | 30.7% | 17.4%(+13.3)#13 | 18.7%(+12.0)#3,322 |
| 14. | Stamford | 29.8% | 17.4%(+12.5)#14 | 18.7%(+11.2)#3,417 |
| 15. | New London | 29.4% | 17.4%(+12.0)#15 | 18.7%(+10.7)#3,464 |
| 16. | Danielson Borough | 28.7% | 17.4%(+11.4)#16 | 18.7%(+10.1)#3,536 |
| 17. | Poquonock Bridge | 28.5% | 17.4%(+11.1)#17 | 18.7%(+9.84)#3,564 |
| 18. | Wauregan | 28.0% | 17.4%(+10.6)#18 | 18.7%(+9.36)#3,631 |
| 19. | West Haven | 26.7% | 17.4%(+9.37)#19 | 18.7%(+8.10)#3,801 |
| 20. | Route 7 Gateway | 26.3% | 17.4%(+8.89)#20 | 18.7%(+7.61)#3,865 |
| 21. | Cornwall | 24.1% | 17.4%(+6.72)#21 | 18.7%(+5.44)#4,166 |
| 22. | Greens Farms | 23.2% | 17.4%(+5.81)#22 | 18.7%(+4.53)#4,335 |
| 23. | Derby | 23.1% | 17.4%(+5.68)#23 | 18.7%(+4.40)#4,358 |
| 24. | Manchester | 22.5% | 17.4%(+5.17)#24 | 18.7%(+3.89)#4,440 |
| 25. | Saybrook Manor | 22.1% | 17.4%(+4.72)#25 | 18.7%(+3.44)#4,526 |
| 26. | Inglenook | 21.7% | 17.4%(+4.35)#26 | 18.7%(+3.07)#4,593 |
| 27. | Wallingford Center | 21.3% | 17.4%(+3.96)#27 | 18.7%(+2.68)#4,673 |
| 28. | Plainfield Village | 21.3% | 17.4%(+3.92)#28 | 18.7%(+2.65)#4,679 |
| 29. | Canaan | 21.3% | 17.4%(+3.91)#29 | 18.7%(+2.63)#4,681 |
| 30. | Bristol | 20.3% | 17.4%(+2.89)#30 | 18.7%(+1.61)#4,902 |
| 31. | Putnam | 19.9% | 17.4%(+2.57)#31 | 18.7%(+1.29)#4,976 |
| 32. | Rockville | 19.8% | 17.4%(+2.47)#32 | 18.7%(+1.19)#4,996 |
| 33. | Greenwich | 18.9% | 17.4%(+1.56)#33 | 18.7%(+0.279)#5,202 |
| 34. | Conning Towers Nautilus Park | 17.7% | 17.4%(+0.358)#34 | 18.7%(-0.921)#5,519 |
| 35. | Thompsonville | 17.6% | 17.4%(+0.213)#35 | 18.7%(-1.07)#5,559 |
| 36. | Torrington | 17.5% | 17.4%(+0.140)#36 | 18.7%(-1.14)#5,579 |
| 37. | East Haven | 17.4% | 17.4%(+0.050)#37 | 18.7%(-1.23)#5,602 |
| 38. | New Preston | 17.2% | 17.4%(-0.219)#38 | 18.7%(-1.50)#5,690 |
| 39. | Candlewood Orchards | 16.9% | 17.4%(-0.427)#39 | 18.7%(-1.71)#5,753 |
| 40. | Bantam Borough | 16.4% | 17.4%(-1.02)#40 | 18.7%(-2.30)#5,928 |
| 41. | Naugatuck Borough | 16.0% | 17.4%(-1.42)#41 | 18.7%(-2.70)#6,052 |
| 42. | Riverside | 15.6% | 17.4%(-1.72)#42 | 18.7%(-3.00)#6,158 |
| 43. | Botsford | 15.4% | 17.4%(-1.96)#43 | 18.7%(-3.24)#6,219 |
| 44. | Wilton Center | 15.0% | 17.4%(-2.33)#44 | 18.7%(-3.61)#6,344 |
| 45. | Norwich | 15.0% | 17.4%(-2.34)#45 | 18.7%(-3.62)#6,347 |
| 46. | Bridgewater | 14.8% | 17.4%(-2.58)#46 | 18.7%(-3.86)#6,444 |
| 47. | Oakville | 14.7% | 17.4%(-2.67)#47 | 18.7%(-3.95)#6,484 |
| 48. | Sherwood Manor | 14.7% | 17.4%(-2.70)#48 | 18.7%(-3.98)#6,491 |
| 49. | Lake Chaffee | 14.6% | 17.4%(-2.76)#49 | 18.7%(-4.03)#6,509 |
| 50. | Cos Cob | 14.3% | 17.4%(-3.04)#50 | 18.7%(-4.32)#6,608 |
| 51. | Baltic | 14.2% | 17.4%(-3.20)#51 | 18.7%(-4.48)#6,654 |
| 52. | Westbrook Center | 13.5% | 17.4%(-3.91)#52 | 18.7%(-5.19)#6,942 |
| 53. | Bethel | 13.4% | 17.4%(-3.94)#53 | 18.7%(-5.22)#6,955 |
| 54. | West Hartford | 13.4% | 17.4%(-3.96)#54 | 18.7%(-5.24)#6,962 |
| 55. | Groton | 13.3% | 17.4%(-4.12)#55 | 18.7%(-5.40)#7,021 |
| 56. | South Windham | 13.1% | 17.4%(-4.27)#56 | 18.7%(-5.55)#7,084 |
| 57. | Southwood Acres | 13.1% | 17.4%(-4.31)#57 | 18.7%(-5.58)#7,099 |
| 58. | Ball Pond | 12.7% | 17.4%(-4.69)#58 | 18.7%(-5.97)#7,281 |
| 59. | Wethersfield | 12.6% | 17.4%(-4.80)#59 | 18.7%(-6.07)#7,327 |
| 60. | Brooklyn | 12.2% | 17.4%(-5.18)#60 | 18.7%(-6.46)#7,497 |
| 61. | Shelton | 12.1% | 17.4%(-5.26)#61 | 18.7%(-6.54)#7,543 |
| 62. | Winsted | 12.1% | 17.4%(-5.29)#62 | 18.7%(-6.57)#7,562 |
| 63. | Broad Brook | 12.1% | 17.4%(-5.32)#63 | 18.7%(-6.59)#7,571 |
| 64. | Riverton | 11.4% | 17.4%(-5.93)#64 | 18.7%(-7.21)#7,887 |
| 65. | Middletown | 11.0% | 17.4%(-6.39)#65 | 18.7%(-7.67)#8,129 |
| 66. | Newington | 10.7% | 17.4%(-6.68)#66 | 18.7%(-7.96)#8,282 |
| 67. | Lakes East | 10.4% | 17.4%(-6.94)#67 | 18.7%(-8.22)#8,450 |
| 68. | Blue Hills | 10.3% | 17.4%(-7.12)#68 | 18.7%(-8.40)#8,556 |
| 69. | Poplar Plains | 10.1% | 17.4%(-7.24)#69 | 18.7%(-8.52)#8,629 |
| 70. | Pemberwick | 10.1% | 17.4%(-7.32)#70 | 18.7%(-8.60)#8,671 |
| 71. | Quinnipiac University | 9.9% | 17.4%(-7.51)#71 | 18.7%(-8.79)#8,802 |
| 72. | Tokeneke | 9.8% | 17.4%(-7.59)#72 | 18.7%(-8.87)#8,848 |
| 73. | Staples | 9.8% | 17.4%(-7.61)#73 | 18.7%(-8.89)#8,866 |
| 74. | New Milford | 9.6% | 17.4%(-7.76)#74 | 18.7%(-9.04)#8,973 |
| 75. | Terryville | 9.6% | 17.4%(-7.79)#75 | 18.7%(-9.07)#8,991 |
| 76. | Sacred Heart University | 9.5% | 17.4%(-7.84)#76 | 18.7%(-9.12)#9,024 |
| 77. | Saugatuck | 9.5% | 17.4%(-7.90)#77 | 18.7%(-9.18)#9,066 |
| 78. | Newtown Borough | 9.2% | 17.4%(-8.13)#78 | 18.7%(-9.41)#9,234 |
| 79. | East Brooklyn | 9.1% | 17.4%(-8.26)#79 | 18.7%(-9.53)#9,332 |
| 80. | Coventry Lake | 8.7% | 17.4%(-8.63)#80 | 18.7%(-9.91)#9,630 |
| 81. | Hazardville | 8.7% | 17.4%(-8.72)#81 | 18.7%(-10.00)#9,701 |
| 82. | Higganum | 8.6% | 17.4%(-8.75)#82 | 18.7%(-10.0)#9,729 |
| 83. | Gales Ferry | 8.4% | 17.4%(-9.02)#83 | 18.7%(-10.3)#9,940 |
| 84. | Taylor Corners | 8.3% | 17.4%(-9.07)#84 | 18.7%(-10.3)#9,990 |
| 85. | Kensington | 8.3% | 17.4%(-9.12)#85 | 18.7%(-10.4)#10,048 |
| 86. | Noroton Heights | 8.1% | 17.4%(-9.26)#86 | 18.7%(-10.5)#10,163 |
| 87. | Deep River Center | 8.0% | 17.4%(-9.41)#87 | 18.7%(-10.7)#10,319 |
| 88. | Cornwall Bridge | 7.9% | 17.4%(-9.51)#88 | 18.7%(-10.8)#10,405 |
| 89. | Noroton | 7.8% | 17.4%(-9.56)#89 | 18.7%(-10.8)#10,450 |
| 90. | Weatogue | 7.7% | 17.4%(-9.66)#90 | 18.7%(-10.9)#10,557 |
| 91. | Milford City Balance | 7.7% | 17.4%(-9.68)#91 | 18.7%(-11.0)#10,566 |
| 92. | Stafford Springs | 7.7% | 17.4%(-9.68)#92 | 18.7%(-11.0)#10,577 |
| 93. | Cheshire Village | 7.7% | 17.4%(-9.69)#93 | 18.7%(-11.0)#10,579 |
| 94. | Clinton | 7.6% | 17.4%(-9.76)#94 | 18.7%(-11.0)#10,663 |
| 95. | Watertown | 7.6% | 17.4%(-9.80)#95 | 18.7%(-11.1)#10,707 |
| 96. | Norfolk | 7.5% | 17.4%(-9.86)#96 | 18.7%(-11.1)#10,762 |
| 97. | North Haven | 7.1% | 17.4%(-10.3)#97 | 18.7%(-11.6)#11,160 |
| 98. | Candlewood Isle | 7.1% | 17.4%(-10.3)#98 | 18.7%(-11.6)#11,176 |
| 99. | Simsbury Center | 7.0% | 17.4%(-10.4)#99 | 18.7%(-11.7)#11,289 |
| 100. | Long Hill | 6.9% | 17.4%(-10.4)#100 | 18.7%(-11.7)#11,322 |
1
2Common Questions
What are the Top 10 Cities with the Highest Percentage of Hispanic or Latino Population in Connecticut?
Top 10 Cities with the Highest Percentage of Hispanic or Latino Population in Connecticut are:
#1
46.1%
#2
44.3%
#3
40.5%
#4
37.3%
#5
37.1%
#6
36.2%
#7
35.9%
#8
35.8%
#9
31.7%
#10
31.0%
What city has the Highest Percentage of Hispanic or Latino Population in Connecticut?
Hartford has the Highest Percentage of Hispanic or Latino Population in Connecticut with 46.1%.
What is the Percentage of Hispanic or Latino Population in the State of Connecticut?
Percentage of Hispanic or Latino Population in Connecticut is 17.4%.
What is the Percentage of Hispanic or Latino Population in the United States?
Percentage of Hispanic or Latino Population in the United States is 18.7%.