Millstone borough, NJ Map & Demographics
Millstone borough Overview
$45,353
PER CAPITA INCOME
$134,554
AVG FAMILY INCOME
$133,929
AVG HOUSEHOLD INCOME
0.28
INEQUALITY / GINI INDEX
584
TOTAL POPULATION
317
MALE POPULATION
267
FEMALE POPULATION
118.73
MALES / 100 FEMALES
84.23
FEMALES / 100 MALES
40.4
MEDIAN AGE
3.5
AVG FAMILY SIZE
3.1
AVG HOUSEHOLD SIZE
374
LABOR FORCE [ PEOPLE ]
76.3%
PERCENT IN LABOR FORCE
4.5%
UNEMPLOYMENT RATE
Income in Millstone borough
Income Overview in Millstone borough
Per Capita Income in Millstone borough is $45,353, while median incomes of families and households are $134,554 and $133,929 respectively.
| Characteristic | Number | Measure |
| Per Capita Income | 584 | $45,353 |
| Median Family Income | 145 | $134,554 |
| Mean Family Income | 145 | $158,651 |
| Median Household Income | 184 | $133,929 |
| Mean Household Income | 184 | $147,345 |
| Income Deficit | 145 | $0 |
| Wage / Income Gap (%) | 584 | 0.00% |
| Wage / Income Gap ($) | 584 | 100.00¢ per $1 |
| Gini / Inequality Index | 584 | 0.28 |
Earnings by Sex in Millstone borough
| Sex | Number | Average Earnings |
| Male | 218 (58.8%) | $0 |
| Female | 153 (41.2%) | $0 |
| Total | 371 (100.0%) | $0 |
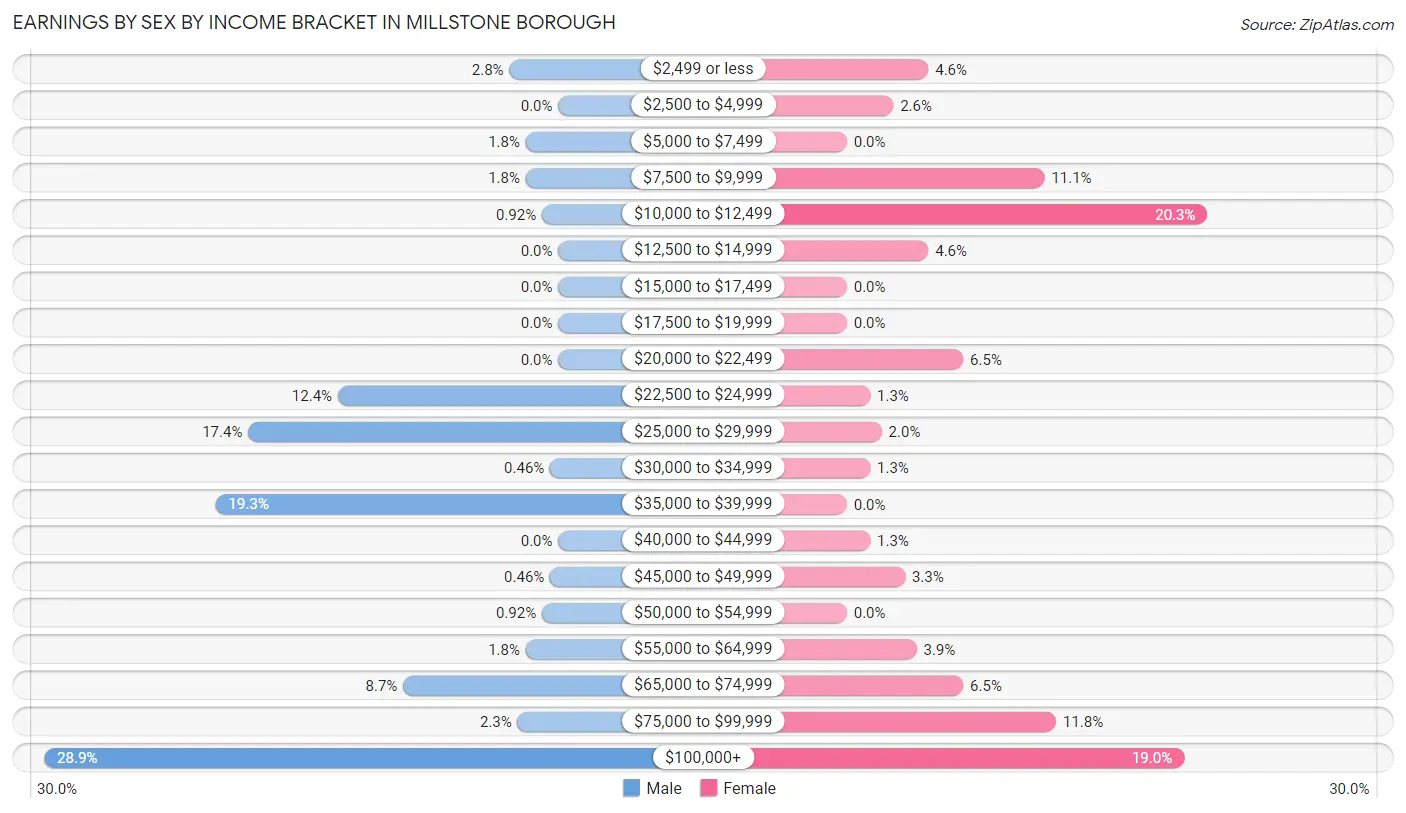
Earnings by Sex by Income Bracket in Millstone borough
The most common earnings brackets in Millstone borough are $100,000+ for men (63 | 28.9%) and $10,000 to $12,499 for women (31 | 20.3%).
| Income | Male | Female |
| $2,499 or less | 6 (2.8%) | 7 (4.6%) |
| $2,500 to $4,999 | 0 (0.0%) | 4 (2.6%) |
| $5,000 to $7,499 | 4 (1.8%) | 0 (0.0%) |
| $7,500 to $9,999 | 4 (1.8%) | 17 (11.1%) |
| $10,000 to $12,499 | 2 (0.9%) | 31 (20.3%) |
| $12,500 to $14,999 | 0 (0.0%) | 7 (4.6%) |
| $15,000 to $17,499 | 0 (0.0%) | 0 (0.0%) |
| $17,500 to $19,999 | 0 (0.0%) | 0 (0.0%) |
| $20,000 to $22,499 | 0 (0.0%) | 10 (6.5%) |
| $22,500 to $24,999 | 27 (12.4%) | 2 (1.3%) |
| $25,000 to $29,999 | 38 (17.4%) | 3 (2.0%) |
| $30,000 to $34,999 | 1 (0.5%) | 2 (1.3%) |
| $35,000 to $39,999 | 42 (19.3%) | 0 (0.0%) |
| $40,000 to $44,999 | 0 (0.0%) | 2 (1.3%) |
| $45,000 to $49,999 | 1 (0.5%) | 5 (3.3%) |
| $50,000 to $54,999 | 2 (0.9%) | 0 (0.0%) |
| $55,000 to $64,999 | 4 (1.8%) | 6 (3.9%) |
| $65,000 to $74,999 | 19 (8.7%) | 10 (6.5%) |
| $75,000 to $99,999 | 5 (2.3%) | 18 (11.8%) |
| $100,000+ | 63 (28.9%) | 29 (19.0%) |
| Total | 218 (100.0%) | 153 (100.0%) |
Earnings by Sex by Educational Attainment in Millstone borough
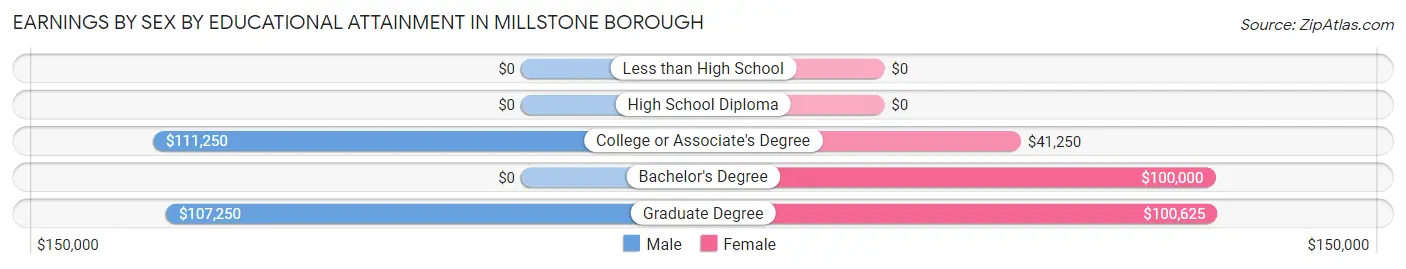
| Educational Attainment | Male Income | Female Income |
| Less than High School | - | - |
| High School Diploma | - | - |
| College or Associate's Degree | $111,250 | $41,250 |
| Bachelor's Degree | - | - |
| Graduate Degree | $107,250 | $100,625 |
| Total | $65,000 | $0 |
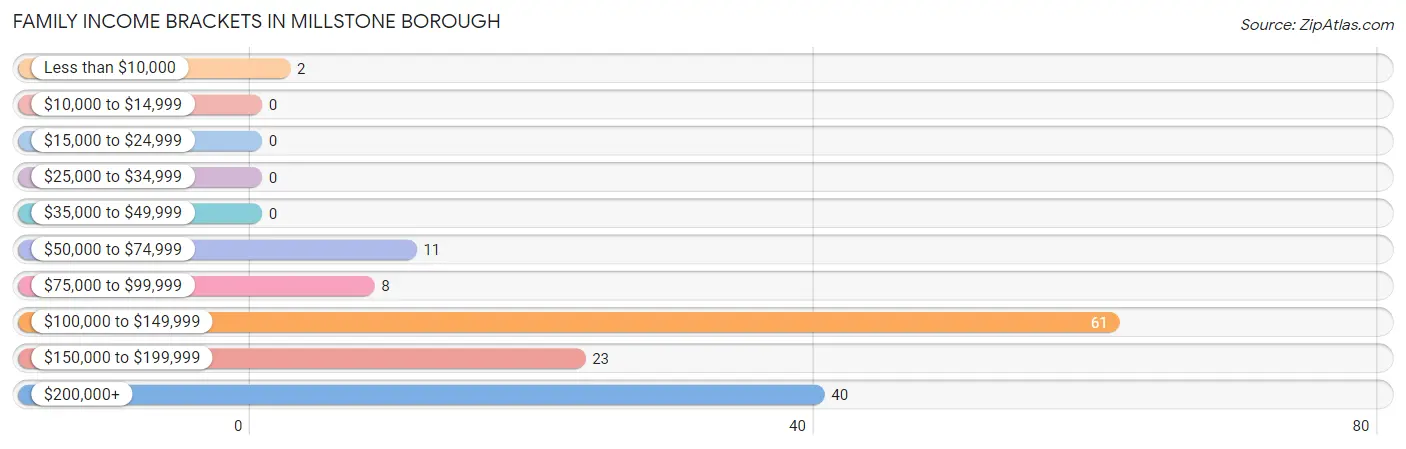
Family Income in Millstone borough
Family Income Brackets in Millstone borough
According to the Millstone borough family income data, there are 61 families falling into the $100,000 to $149,999 income range, which is the most common income bracket and makes up 42.1% of all families.
| Income Bracket | # Families | % Families |
| Less than $10,000 | 2 | 1.4% |
| $10,000 to $14,999 | 0 | 0.0% |
| $15,000 to $24,999 | 0 | 0.0% |
| $25,000 to $34,999 | 0 | 0.0% |
| $35,000 to $49,999 | 0 | 0.0% |
| $50,000 to $74,999 | 11 | 7.6% |
| $75,000 to $99,999 | 8 | 5.5% |
| $100,000 to $149,999 | 61 | 42.1% |
| $150,000 to $199,999 | 23 | 15.9% |
| $200,000+ | 40 | 27.6% |
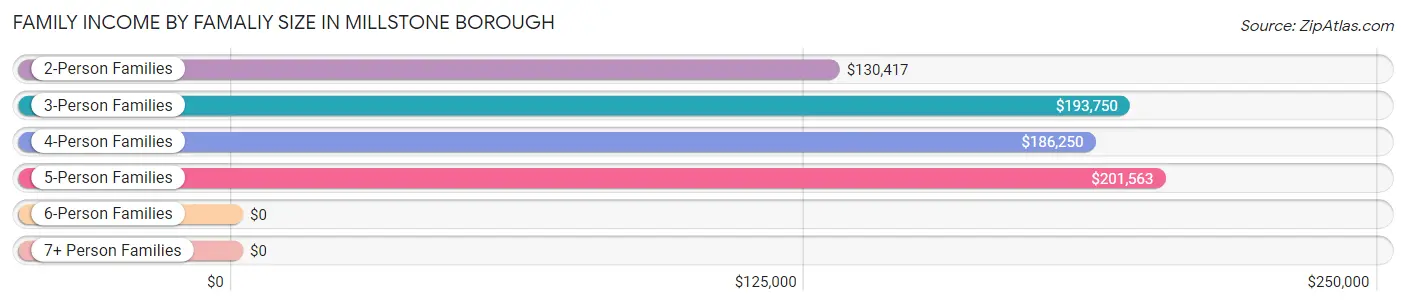
Family Income by Famaliy Size in Millstone borough
5-person families (11 | 7.6%) account for the highest median family income in Millstone borough with $201,563 per family, while 2-person families (35 | 24.1%) have the highest median income of $65,208 per family member.
| Income Bracket | # Families | Median Income |
| 2-Person Families | 35 (24.1%) | $130,417 |
| 3-Person Families | 30 (20.7%) | $193,750 |
| 4-Person Families | 29 (20.0%) | $186,250 |
| 5-Person Families | 11 (7.6%) | $201,563 |
| 6-Person Families | 40 (27.6%) | $0 |
| 7+ Person Families | 0 (0.0%) | $0 |
| Total | 145 (100.0%) | $134,554 |
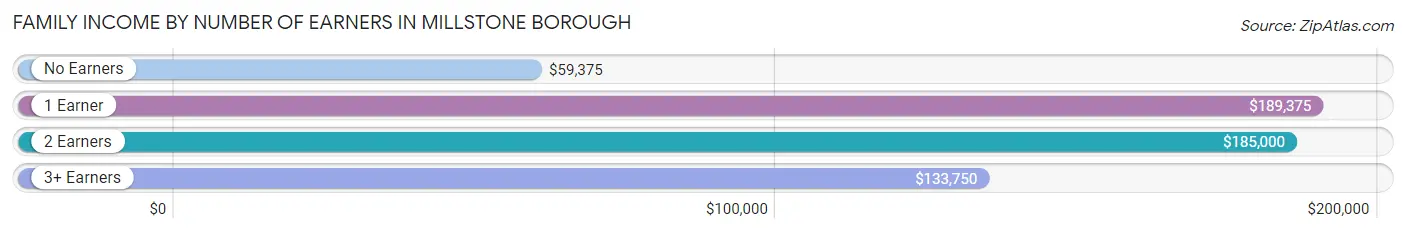
Family Income by Number of Earners in Millstone borough
The median family income in Millstone borough is $134,554, with families comprising 1 earner (27) having the highest median family income of $189,375, while families with no earners (14) have the lowest median family income of $59,375, accounting for 18.6% and 9.7% of families, respectively.
| Number of Earners | # Families | Median Income |
| No Earners | 14 (9.7%) | $59,375 |
| 1 Earner | 27 (18.6%) | $189,375 |
| 2 Earners | 56 (38.6%) | $185,000 |
| 3+ Earners | 48 (33.1%) | $133,750 |
| Total | 145 (100.0%) | $134,554 |
Household Income in Millstone borough
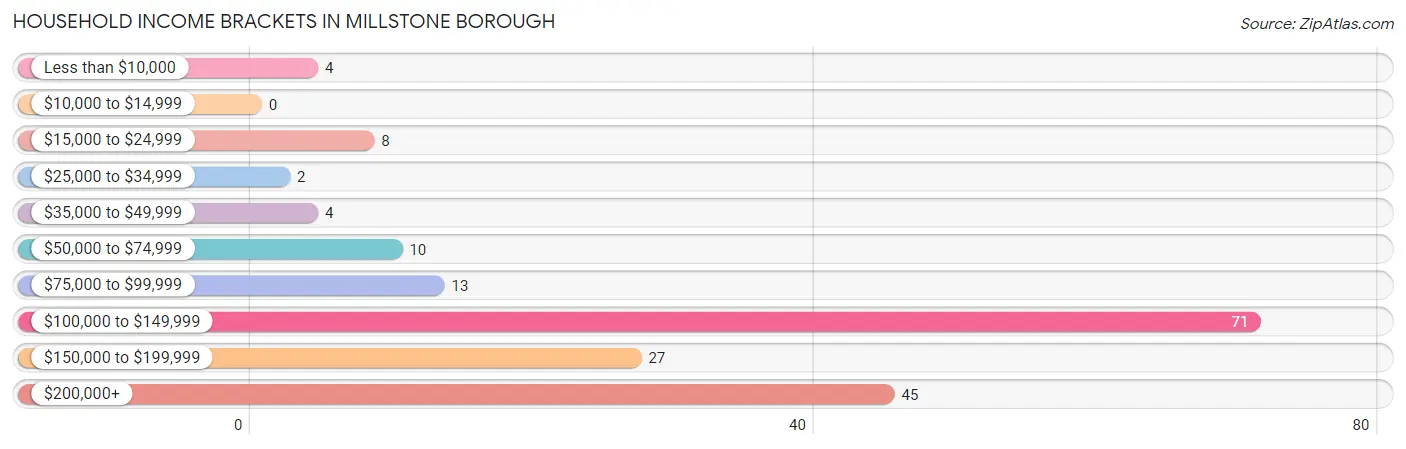
Household Income Brackets in Millstone borough
With 71 households falling in the category, the $100,000 to $149,999 income range is the most frequent in Millstone borough, accounting for 38.6% of all households.
| Income Bracket | # Households | % Households |
| Less than $10,000 | 4 | 2.2% |
| $10,000 to $14,999 | 0 | 0.0% |
| $15,000 to $24,999 | 8 | 4.3% |
| $25,000 to $34,999 | 2 | 1.1% |
| $35,000 to $49,999 | 4 | 2.2% |
| $50,000 to $74,999 | 10 | 5.4% |
| $75,000 to $99,999 | 13 | 7.1% |
| $100,000 to $149,999 | 71 | 38.6% |
| $150,000 to $199,999 | 27 | 14.7% |
| $200,000+ | 45 | 24.5% |
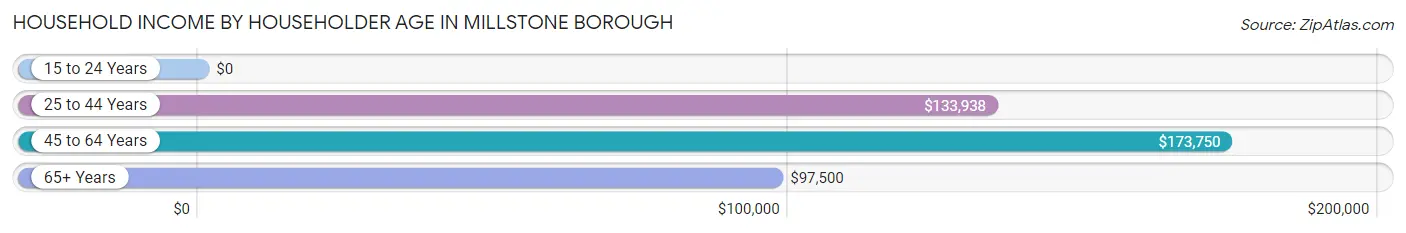
Household Income by Householder Age in Millstone borough
The median household income in Millstone borough is $133,929, with the highest median household income of $173,750 found in the 45 to 64 years age bracket for the primary householder. A total of 64 households (34.8%) fall into this category.
| Income Bracket | # Households | Median Income |
| 15 to 24 Years | 0 (0.0%) | $0 |
| 25 to 44 Years | 70 (38.0%) | $133,938 |
| 45 to 64 Years | 64 (34.8%) | $173,750 |
| 65+ Years | 50 (27.2%) | $97,500 |
| Total | 184 (100.0%) | $133,929 |
Poverty in Millstone borough
Income Below Poverty by Sex and Age in Millstone borough
With 3.2% poverty level for males and 3.8% for females among the residents of Millstone borough, 16 and 17 year old males and 35 to 44 year old females are the most vulnerable to poverty, with 1 males (20.0%) and 5 females (15.1%) in their respective age groups living below the poverty level.
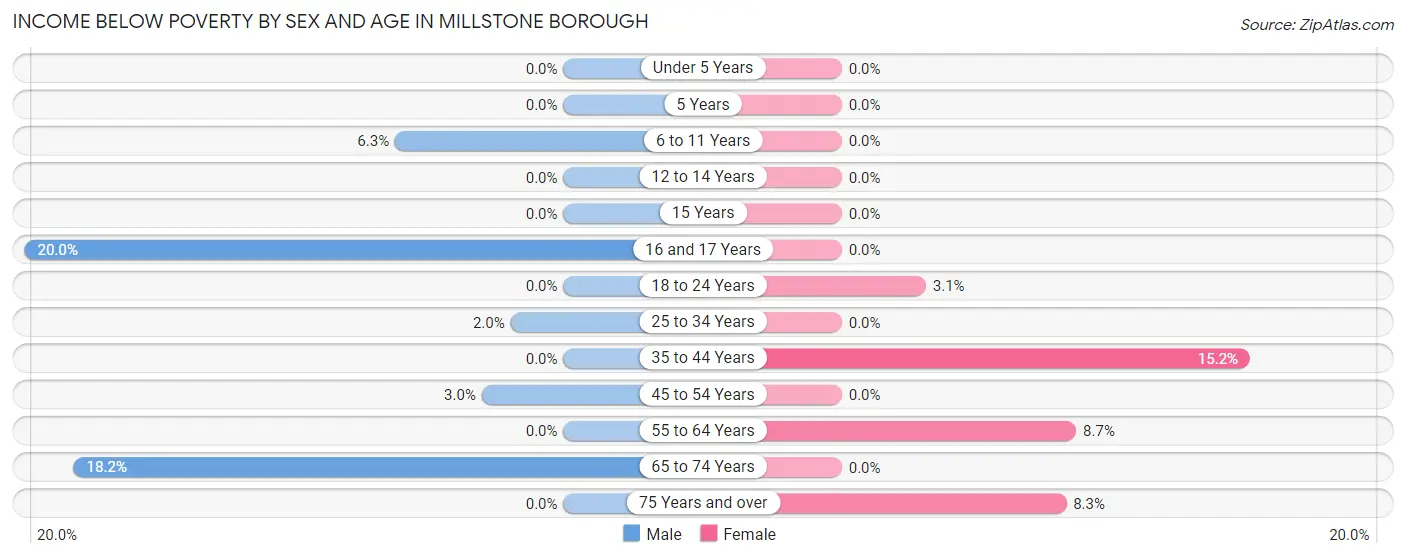
| Age Bracket | Male | Female |
| Under 5 Years | 0 (0.0%) | 0 (0.0%) |
| 5 Years | 0 (0.0%) | 0 (0.0%) |
| 6 to 11 Years | 2 (6.2%) | 0 (0.0%) |
| 12 to 14 Years | 0 (0.0%) | 0 (0.0%) |
| 15 Years | 0 (0.0%) | 0 (0.0%) |
| 16 and 17 Years | 1 (20.0%) | 0 (0.0%) |
| 18 to 24 Years | 0 (0.0%) | 1 (3.1%) |
| 25 to 34 Years | 1 (2.0%) | 0 (0.0%) |
| 35 to 44 Years | 0 (0.0%) | 5 (15.1%) |
| 45 to 54 Years | 2 (3.0%) | 0 (0.0%) |
| 55 to 64 Years | 0 (0.0%) | 2 (8.7%) |
| 65 to 74 Years | 4 (18.2%) | 0 (0.0%) |
| 75 Years and over | 0 (0.0%) | 2 (8.3%) |
| Total | 10 (3.2%) | 10 (3.8%) |
Income Above Poverty by Sex and Age in Millstone borough
According to the poverty statistics in Millstone borough, males aged under 5 years and females aged under 5 years are the age groups that are most secure financially, with 100.0% of males and 100.0% of females in these age groups living above the poverty line.
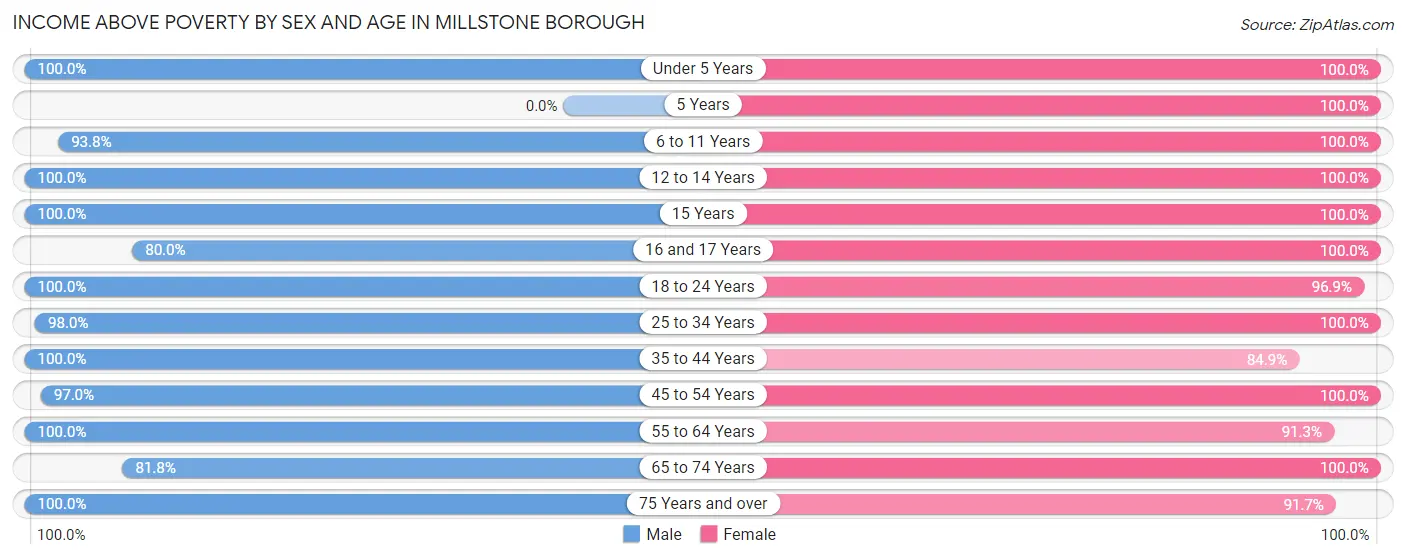
| Age Bracket | Male | Female |
| Under 5 Years | 7 (100.0%) | 6 (100.0%) |
| 5 Years | 0 (0.0%) | 1 (100.0%) |
| 6 to 11 Years | 30 (93.8%) | 16 (100.0%) |
| 12 to 14 Years | 12 (100.0%) | 9 (100.0%) |
| 15 Years | 4 (100.0%) | 5 (100.0%) |
| 16 and 17 Years | 4 (80.0%) | 12 (100.0%) |
| 18 to 24 Years | 48 (100.0%) | 31 (96.9%) |
| 25 to 34 Years | 50 (98.0%) | 22 (100.0%) |
| 35 to 44 Years | 26 (100.0%) | 28 (84.9%) |
| 45 to 54 Years | 64 (97.0%) | 65 (100.0%) |
| 55 to 64 Years | 29 (100.0%) | 21 (91.3%) |
| 65 to 74 Years | 18 (81.8%) | 18 (100.0%) |
| 75 Years and over | 14 (100.0%) | 22 (91.7%) |
| Total | 306 (96.8%) | 256 (96.2%) |
Income Below Poverty Among Married-Couple Families in Millstone borough
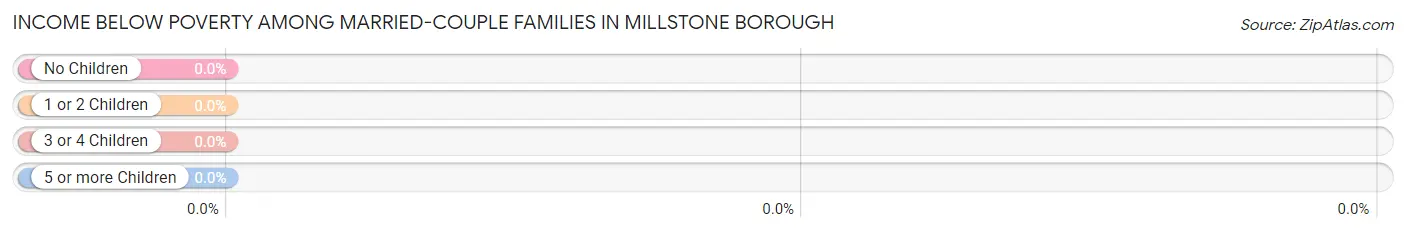
| Children | Above Poverty | Below Poverty |
| No Children | 42 (100.0%) | 0 (0.0%) |
| 1 or 2 Children | 32 (100.0%) | 0 (0.0%) |
| 3 or 4 Children | 10 (100.0%) | 0 (0.0%) |
| 5 or more Children | 0 (0.0%) | 0 (0.0%) |
| Total | 84 (100.0%) | 0 (0.0%) |
Income Below Poverty Among Single-Parent Households in Millstone borough
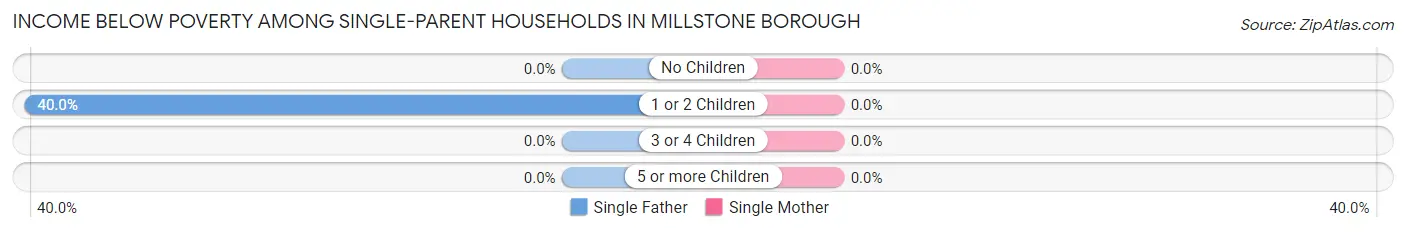
| Children | Single Father | Single Mother |
| No Children | 0 (0.0%) | 0 (0.0%) |
| 1 or 2 Children | 2 (40.0%) | 0 (0.0%) |
| 3 or 4 Children | 0 (0.0%) | 0 (0.0%) |
| 5 or more Children | 0 (0.0%) | 0 (0.0%) |
| Total | 2 (4.3%) | 0 (0.0%) |
Income Below Poverty Among Married-Couple vs Single-Parent Households in Millstone borough
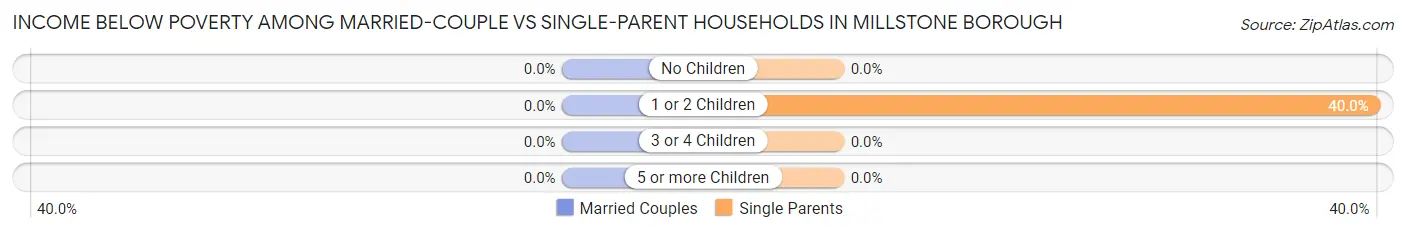
| Children | Married-Couple Families | Single-Parent Households |
| No Children | 0 (0.0%) | 0 (0.0%) |
| 1 or 2 Children | 0 (0.0%) | 2 (40.0%) |
| 3 or 4 Children | 0 (0.0%) | 0 (0.0%) |
| 5 or more Children | 0 (0.0%) | 0 (0.0%) |
| Total | 0 (0.0%) | 2 (3.3%) |
Race in Millstone borough
The most populous races in Millstone borough are White / Caucasian (373 | 63.9%), Two or more Races (183 | 31.3%), and Hispanic or Latino (159 | 27.2%).
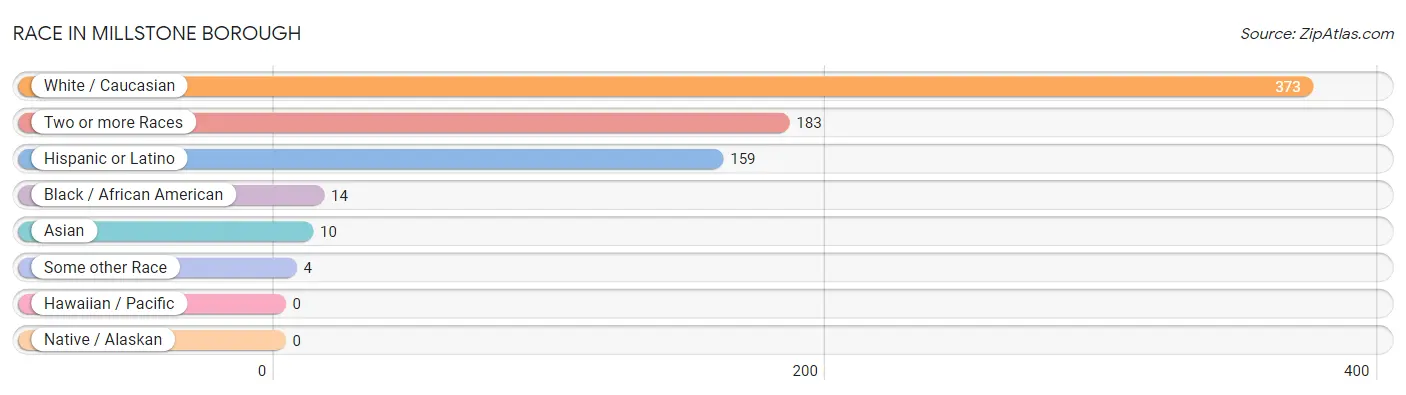
| Race | # Population | % Population |
| Asian | 10 | 1.7% |
| Black / African American | 14 | 2.4% |
| Hawaiian / Pacific | 0 | 0.0% |
| Hispanic or Latino | 159 | 27.2% |
| Native / Alaskan | 0 | 0.0% |
| White / Caucasian | 373 | 63.9% |
| Two or more Races | 183 | 31.3% |
| Some other Race | 4 | 0.7% |
| Total | 584 | 100.0% |
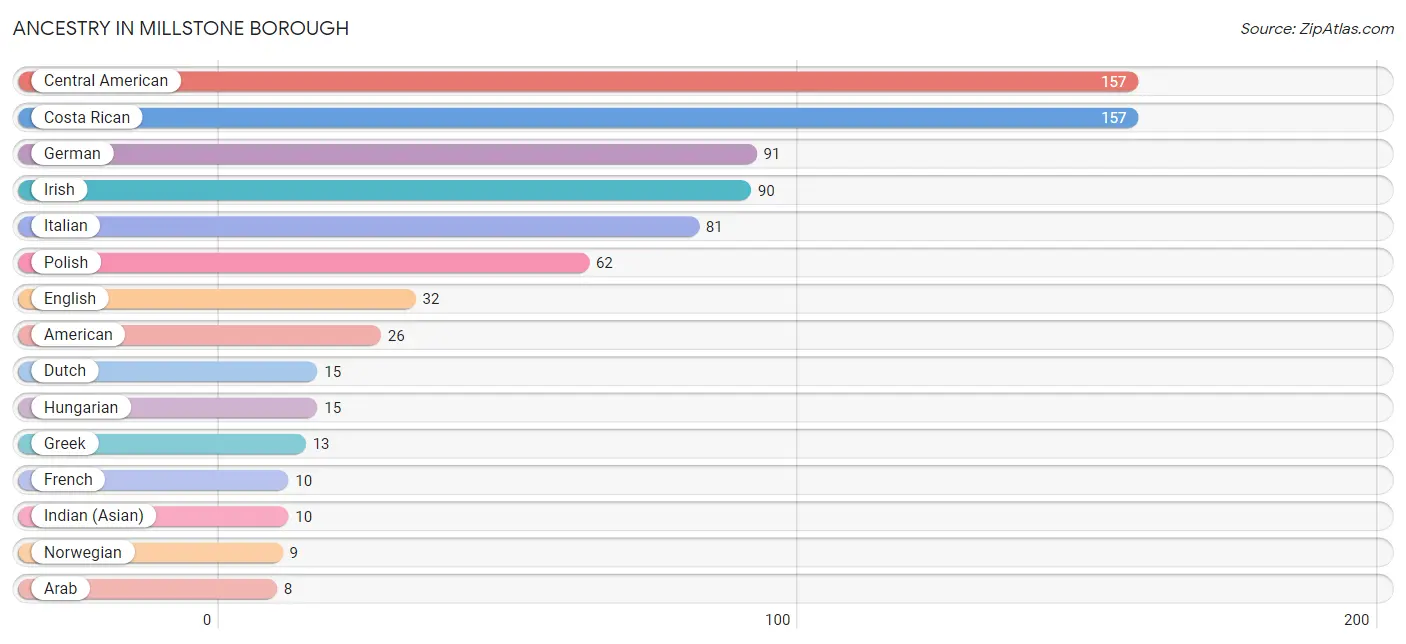
Ancestry in Millstone borough
The most populous ancestries reported in Millstone borough are Central American (157 | 26.9%), Costa Rican (157 | 26.9%), German (91 | 15.6%), Irish (90 | 15.4%), and Italian (81 | 13.9%), together accounting for 98.6% of all Millstone borough residents.
| Ancestry | # Population | % Population |
| American | 26 | 4.4% |
| Arab | 8 | 1.4% |
| Bhutanese | 2 | 0.3% |
| Central American | 157 | 26.9% |
| Costa Rican | 157 | 26.9% |
| Croatian | 4 | 0.7% |
| Czechoslovakian | 8 | 1.4% |
| Danish | 4 | 0.7% |
| Dutch | 15 | 2.6% |
| Eastern European | 3 | 0.5% |
| English | 32 | 5.5% |
| French | 10 | 1.7% |
| French Canadian | 2 | 0.3% |
| German | 91 | 15.6% |
| Greek | 13 | 2.2% |
| Hungarian | 15 | 2.6% |
| Indian (Asian) | 10 | 1.7% |
| Iranian | 2 | 0.3% |
| Irish | 90 | 15.4% |
| Italian | 81 | 13.9% |
| Lithuanian | 4 | 0.7% |
| Norwegian | 9 | 1.5% |
| Pakistani | 1 | 0.2% |
| Polish | 62 | 10.6% |
| Russian | 4 | 0.7% |
| Scotch-Irish | 2 | 0.3% |
| Slovak | 4 | 0.7% |
| Swedish | 2 | 0.3% |
| Swiss | 2 | 0.3% |
| Syrian | 8 | 1.4% |
| Thai | 3 | 0.5% |
| Turkish | 2 | 0.3% |
| Ukrainian | 5 | 0.9% | View All 33 Rows |
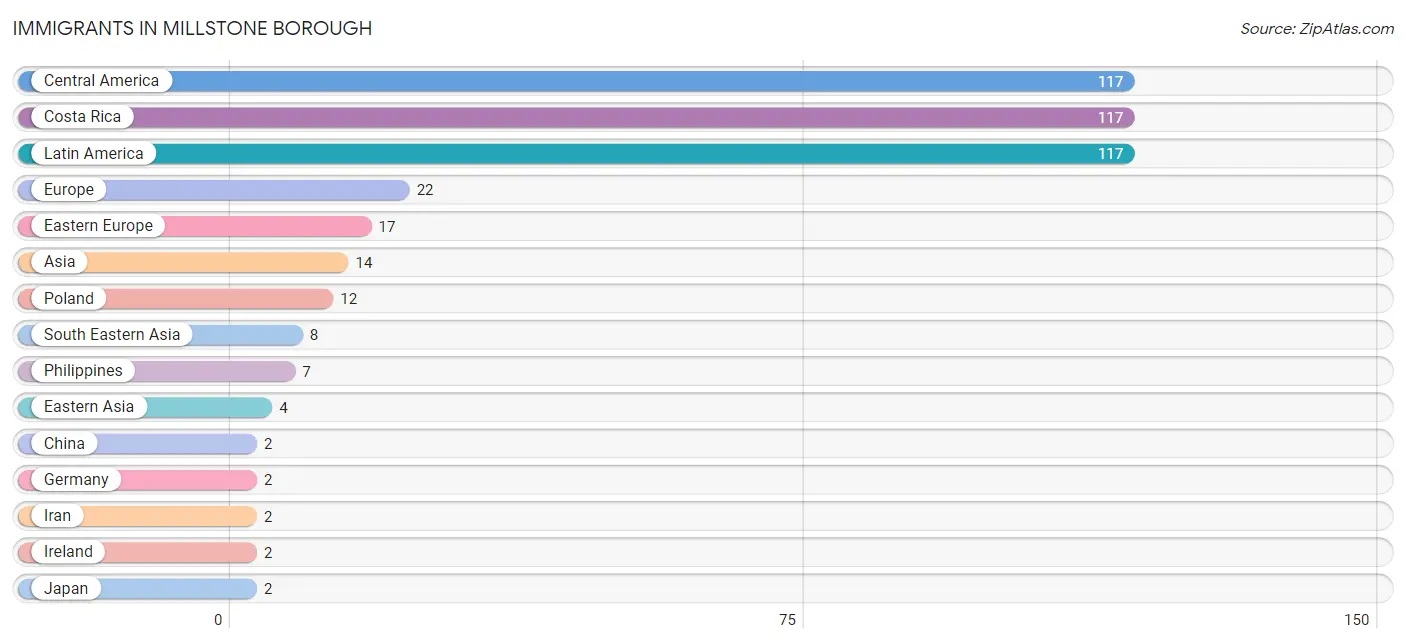
Immigrants in Millstone borough
The most numerous immigrant groups reported in Millstone borough came from Central America (117 | 20.0%), Costa Rica (117 | 20.0%), Latin America (117 | 20.0%), Europe (22 | 3.8%), and Eastern Europe (17 | 2.9%), together accounting for 66.8% of all Millstone borough residents.
| Immigration Origin | # Population | % Population |
| Asia | 14 | 2.4% |
| Central America | 117 | 20.0% |
| China | 2 | 0.3% |
| Costa Rica | 117 | 20.0% |
| Czechoslovakia | 1 | 0.2% |
| Eastern Asia | 4 | 0.7% |
| Eastern Europe | 17 | 2.9% |
| Europe | 22 | 3.8% |
| Germany | 2 | 0.3% |
| Iran | 2 | 0.3% |
| Ireland | 2 | 0.3% |
| Italy | 1 | 0.2% |
| Japan | 2 | 0.3% |
| Latin America | 117 | 20.0% |
| Northern Europe | 2 | 0.3% |
| Philippines | 7 | 1.2% |
| Poland | 12 | 2.1% |
| South Central Asia | 2 | 0.3% |
| South Eastern Asia | 8 | 1.4% |
| Southern Europe | 1 | 0.2% |
| Thailand | 1 | 0.2% |
| Ukraine | 2 | 0.3% |
| Western Europe | 2 | 0.3% | View All 23 Rows |
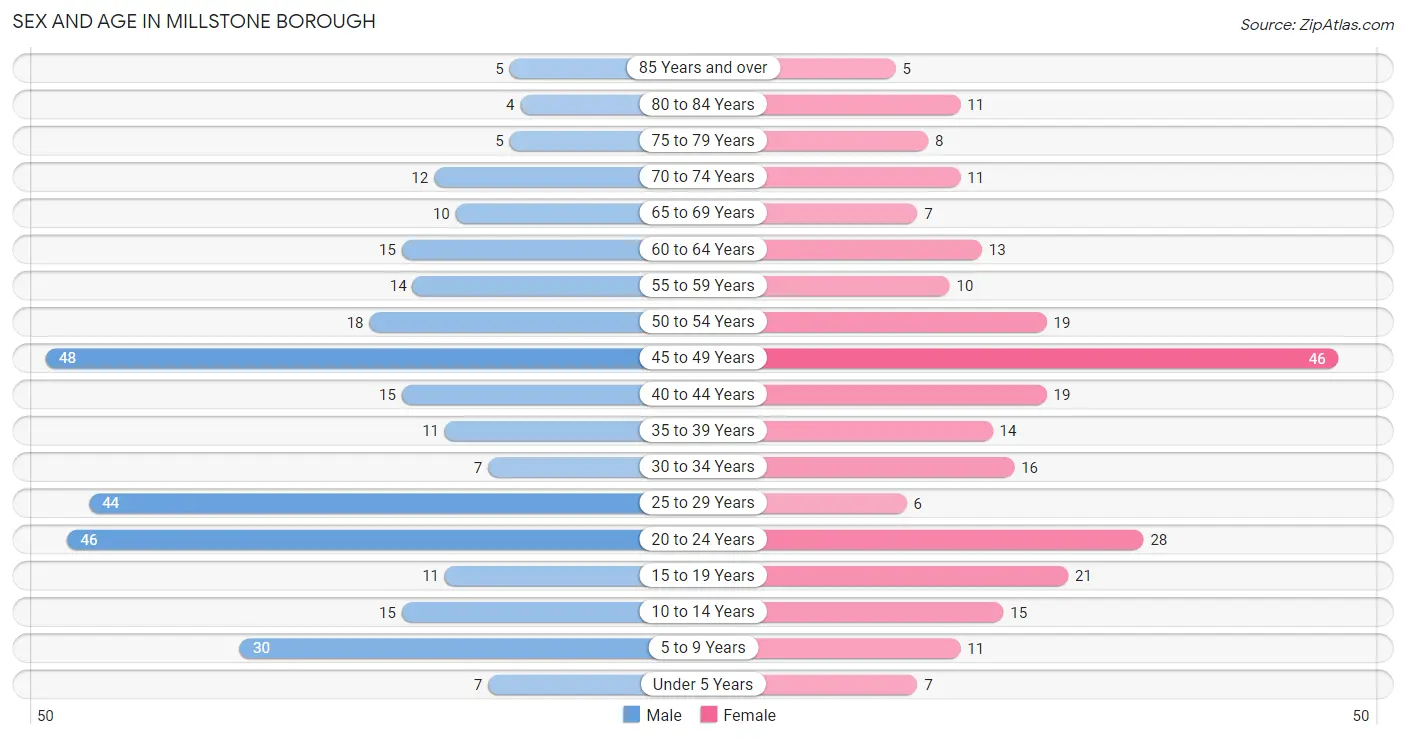
Sex and Age in Millstone borough
Sex and Age in Millstone borough
The most populous age groups in Millstone borough are 45 to 49 Years (48 | 15.1%) for men and 45 to 49 Years (46 | 17.2%) for women.
| Age Bracket | Male | Female |
| Under 5 Years | 7 (2.2%) | 7 (2.6%) |
| 5 to 9 Years | 30 (9.5%) | 11 (4.1%) |
| 10 to 14 Years | 15 (4.7%) | 15 (5.6%) |
| 15 to 19 Years | 11 (3.5%) | 21 (7.9%) |
| 20 to 24 Years | 46 (14.5%) | 28 (10.5%) |
| 25 to 29 Years | 44 (13.9%) | 6 (2.2%) |
| 30 to 34 Years | 7 (2.2%) | 16 (6.0%) |
| 35 to 39 Years | 11 (3.5%) | 14 (5.2%) |
| 40 to 44 Years | 15 (4.7%) | 19 (7.1%) |
| 45 to 49 Years | 48 (15.1%) | 46 (17.2%) |
| 50 to 54 Years | 18 (5.7%) | 19 (7.1%) |
| 55 to 59 Years | 14 (4.4%) | 10 (3.7%) |
| 60 to 64 Years | 15 (4.7%) | 13 (4.9%) |
| 65 to 69 Years | 10 (3.2%) | 7 (2.6%) |
| 70 to 74 Years | 12 (3.8%) | 11 (4.1%) |
| 75 to 79 Years | 5 (1.6%) | 8 (3.0%) |
| 80 to 84 Years | 4 (1.3%) | 11 (4.1%) |
| 85 Years and over | 5 (1.6%) | 5 (1.9%) |
| Total | 317 (100.0%) | 267 (100.0%) |
Families and Households in Millstone borough
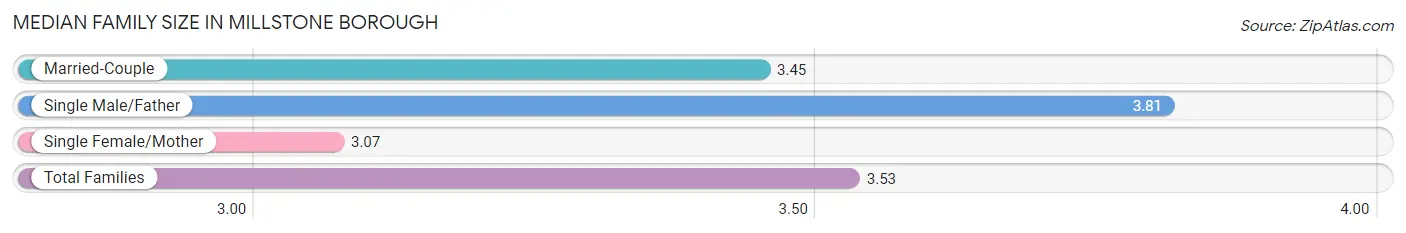
Median Family Size in Millstone borough
The median family size in Millstone borough is 3.53 persons per family, with single male/father families (47 | 32.4%) accounting for the largest median family size of 3.81 persons per family. On the other hand, single female/mother families (14 | 9.7%) represent the smallest median family size with 3.07 persons per family.
| Family Type | # Families | Family Size |
| Married-Couple | 84 (57.9%) | 3.45 |
| Single Male/Father | 47 (32.4%) | 3.81 |
| Single Female/Mother | 14 (9.7%) | 3.07 |
| Total Families | 145 (100.0%) | 3.53 |
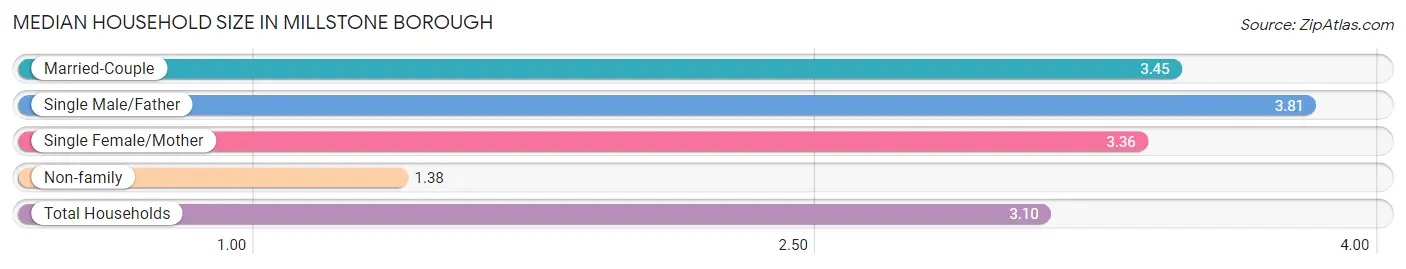
Median Household Size in Millstone borough
The median household size in Millstone borough is 3.10 persons per household, with single male/father households (47 | 25.5%) accounting for the largest median household size of 3.81 persons per household. non-family households (39 | 21.2%) represent the smallest median household size with 1.38 persons per household.
| Household Type | # Households | Household Size |
| Married-Couple | 84 (45.7%) | 3.45 |
| Single Male/Father | 47 (25.5%) | 3.81 |
| Single Female/Mother | 14 (7.6%) | 3.36 |
| Non-family | 39 (21.2%) | 1.38 |
| Total Households | 184 (100.0%) | 3.10 |
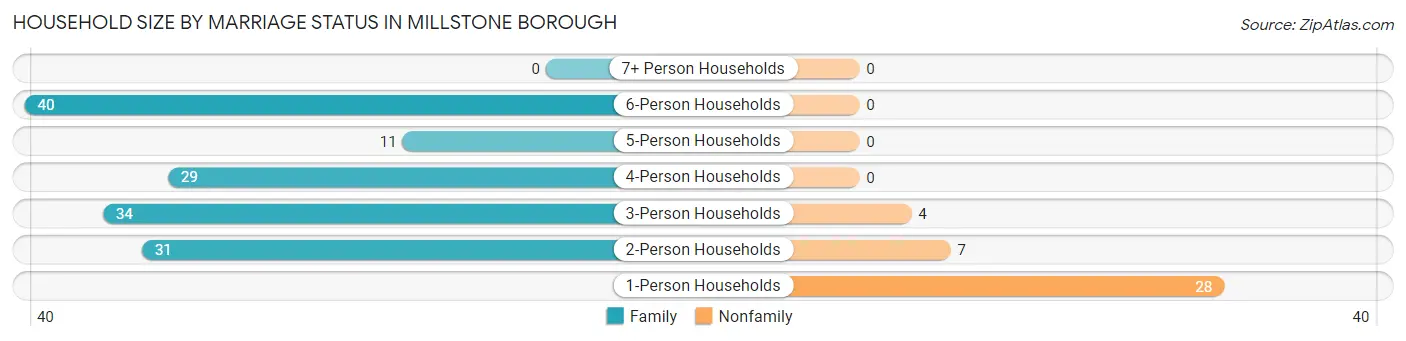
Household Size by Marriage Status in Millstone borough
Out of a total of 184 households in Millstone borough, 145 (78.8%) are family households, while 39 (21.2%) are nonfamily households. The most numerous type of family households are 6-person households, comprising 40, and the most common type of nonfamily households are 1-person households, comprising 28.
| Household Size | Family Households | Nonfamily Households |
| 1-Person Households | - | 28 (15.2%) |
| 2-Person Households | 31 (16.9%) | 7 (3.8%) |
| 3-Person Households | 34 (18.5%) | 4 (2.2%) |
| 4-Person Households | 29 (15.8%) | 0 (0.0%) |
| 5-Person Households | 11 (6.0%) | 0 (0.0%) |
| 6-Person Households | 40 (21.7%) | 0 (0.0%) |
| 7+ Person Households | 0 (0.0%) | 0 (0.0%) |
| Total | 145 (78.8%) | 39 (21.2%) |
Female Fertility in Millstone borough
Fertility by Age in Millstone borough
Average fertility rate in Millstone borough is 13.0 births per 1,000 women. Women in the age bracket of 20 to 34 years have the highest fertility rate with 40.0 births per 1,000 women. Women in the age bracket of 20 to 34 years acount for 100.0% of all women with births.
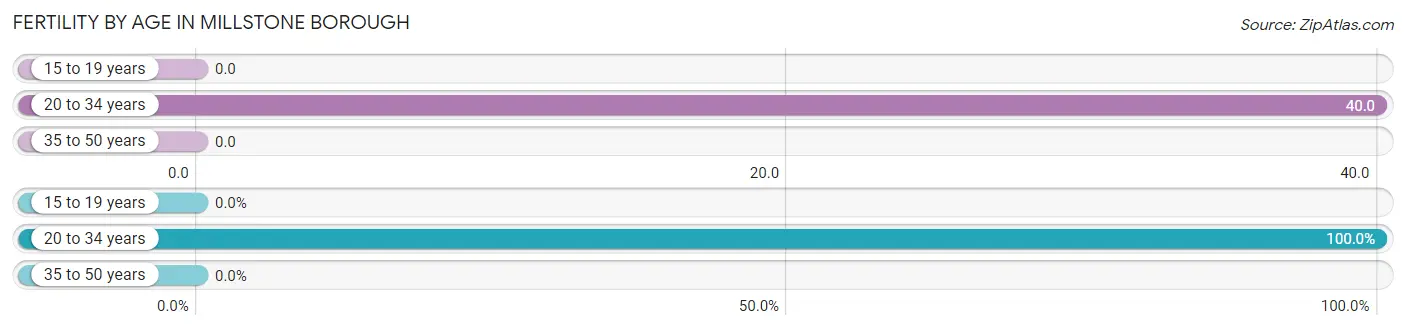
| Age Bracket | Women with Births | Births / 1,000 Women |
| 15 to 19 years | 0 (0.0%) | 0.0 |
| 20 to 34 years | 2 (100.0%) | 40.0 |
| 35 to 50 years | 0 (0.0%) | 0.0 |
| Total | 2 (100.0%) | 13.0 |
Fertility by Age by Marriage Status in Millstone borough
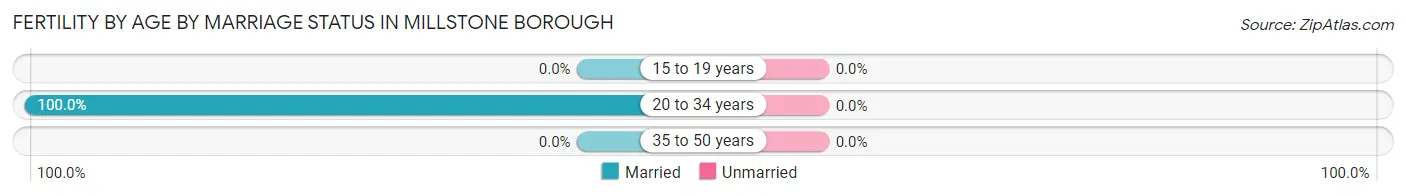
| Age Bracket | Married | Unmarried |
| 15 to 19 years | 0 (0.0%) | 0 (0.0%) |
| 20 to 34 years | 2 (100.0%) | 0 (0.0%) |
| 35 to 50 years | 0 (0.0%) | 0 (0.0%) |
| Total | 2 (100.0%) | 0 (0.0%) |
Fertility by Education in Millstone borough
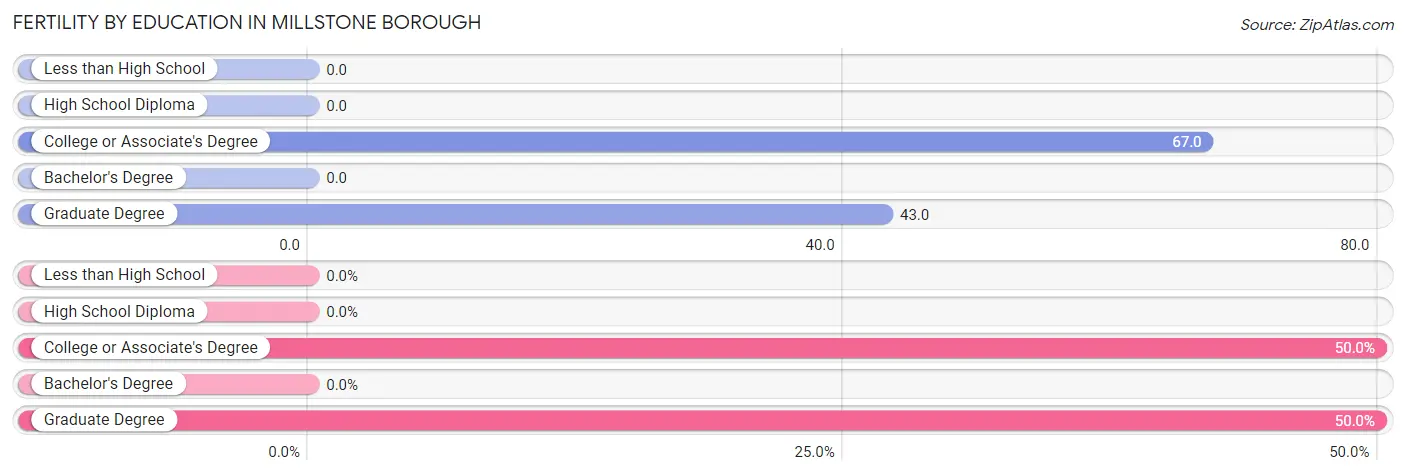
| Educational Attainment | Women with Births | Births / 1,000 Women |
| Less than High School | 0 (0.0%) | 0.0 |
| High School Diploma | 0 (0.0%) | 0.0 |
| College or Associate's Degree | 1 (50.0%) | 67.0 |
| Bachelor's Degree | 0 (0.0%) | 0.0 |
| Graduate Degree | 1 (50.0%) | 43.0 |
| Total | 2 (100.0%) | 13.0 |
Fertility by Education by Marriage Status in Millstone borough
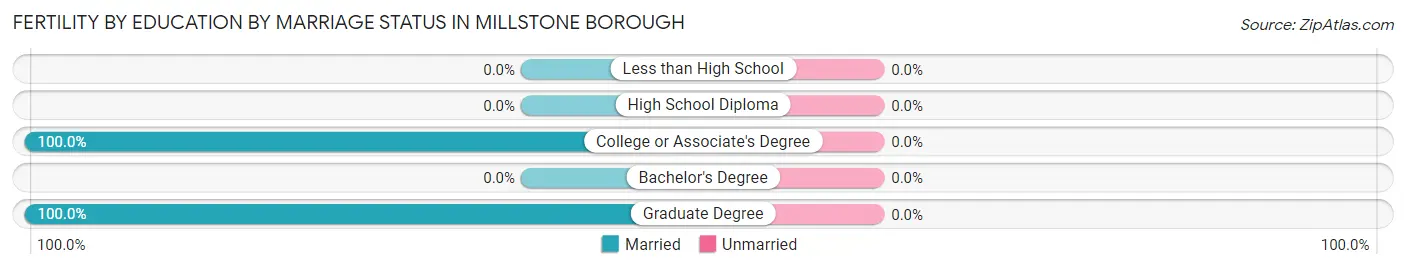
| Educational Attainment | Married | Unmarried |
| Less than High School | 0 (0.0%) | 0 (0.0%) |
| High School Diploma | 0 (0.0%) | 0 (0.0%) |
| College or Associate's Degree | 1 (100.0%) | 0 (0.0%) |
| Bachelor's Degree | 0 (0.0%) | 0 (0.0%) |
| Graduate Degree | 1 (100.0%) | 0 (0.0%) |
| Total | 2 (100.0%) | 0 (0.0%) |
Employment Characteristics in Millstone borough
Employment by Class of Employer in Millstone borough
Among the 352 employed individuals in Millstone borough, private company employees (230 | 65.3%), self-employed (not incorporated) (46 | 13.1%), and local government employees (29 | 8.2%) make up the most common classes of employment.
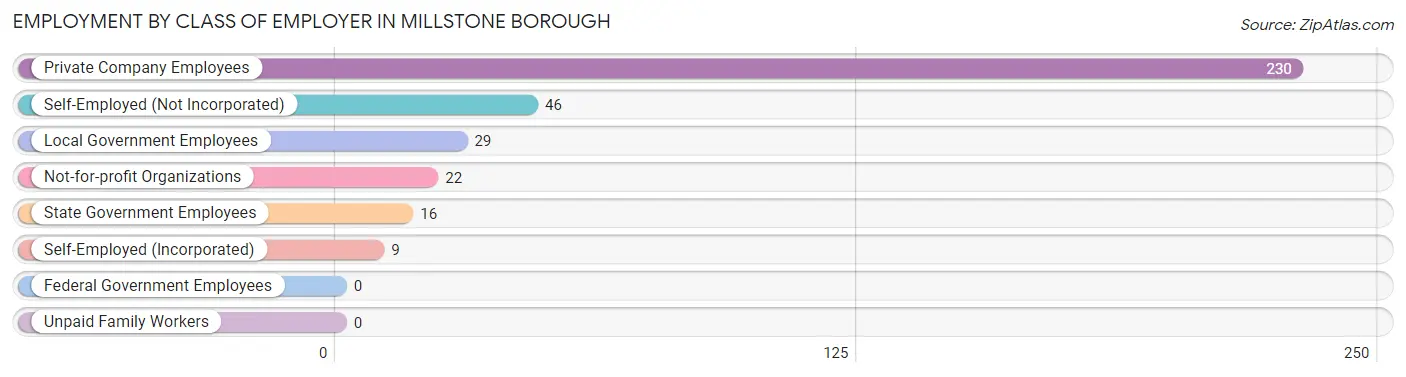
| Employer Class | # Employees | % Employees |
| Private Company Employees | 230 | 65.3% |
| Self-Employed (Incorporated) | 9 | 2.6% |
| Self-Employed (Not Incorporated) | 46 | 13.1% |
| Not-for-profit Organizations | 22 | 6.2% |
| Local Government Employees | 29 | 8.2% |
| State Government Employees | 16 | 4.5% |
| Federal Government Employees | 0 | 0.0% |
| Unpaid Family Workers | 0 | 0.0% |
| Total | 352 | 100.0% |
Employment Status by Age in Millstone borough
According to the labor force statistics for Millstone borough, out of the total population over 16 years of age (490), 76.3% or 374 individuals are in the labor force, with 4.5% or 17 of them unemployed. The age group with the highest labor force participation rate is 30 to 34 years, with 100.0% or 23 individuals in the labor force. Within the labor force, the 20 to 24 years age range has the highest percentage of unemployed individuals, with 13.0% or 9 of them being unemployed.
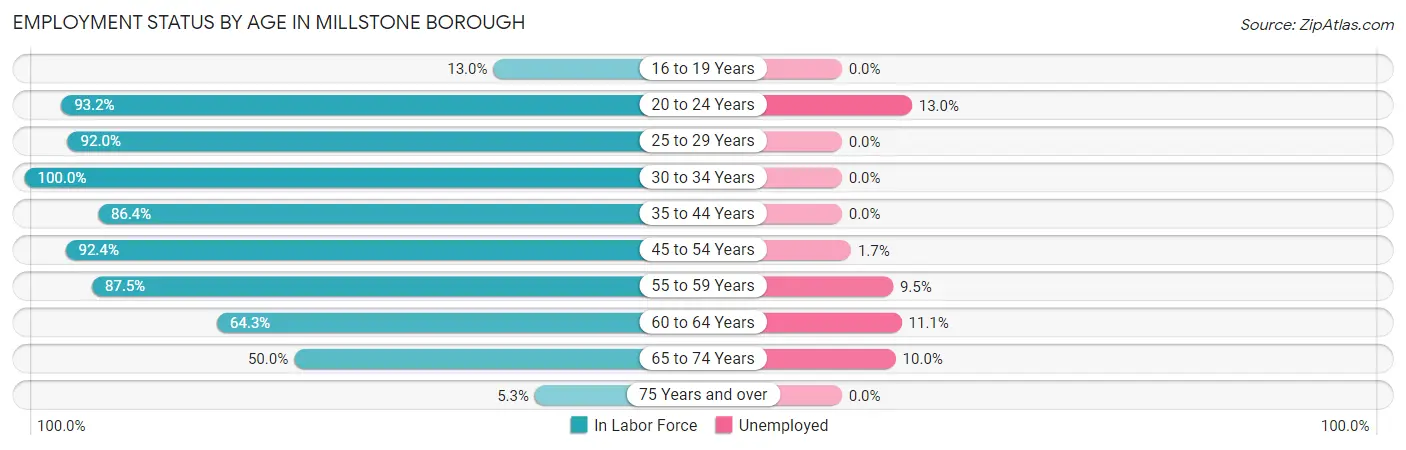
| Age Bracket | In Labor Force | Unemployed |
| 16 to 19 Years | 3 (13.0%) | 0 (0.0%) |
| 20 to 24 Years | 69 (93.2%) | 9 (13.0%) |
| 25 to 29 Years | 46 (92.0%) | 0 (0.0%) |
| 30 to 34 Years | 23 (100.0%) | 0 (0.0%) |
| 35 to 44 Years | 51 (86.4%) | 0 (0.0%) |
| 45 to 54 Years | 121 (92.4%) | 2 (1.7%) |
| 55 to 59 Years | 21 (87.5%) | 2 (9.5%) |
| 60 to 64 Years | 18 (64.3%) | 2 (11.1%) |
| 65 to 74 Years | 20 (50.0%) | 2 (10.0%) |
| 75 Years and over | 2 (5.3%) | 0 (0.0%) |
| Total | 374 (76.3%) | 17 (4.5%) |
Employment Status by Educational Attainment in Millstone borough
According to labor force statistics for Millstone borough, 88.9% of individuals (280) out of the total population between 25 and 64 years of age (315) are in the labor force, with 2.1% or 6 of them being unemployed. The group with the highest labor force participation rate are those with the educational attainment of college / associate degree, with 95.5% or 42 individuals in the labor force. Within the labor force, individuals with college / associate degree education have the highest percentage of unemployment, with 9.5% or 4 of them being unemployed.
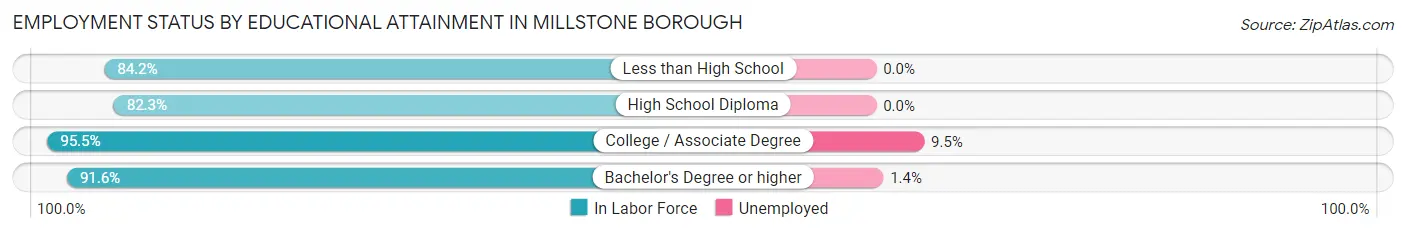
| Educational Attainment | In Labor Force | Unemployed |
| Less than High School | 32 (84.2%) | 0 (0.0%) |
| High School Diploma | 65 (82.3%) | 0 (0.0%) |
| College / Associate Degree | 42 (95.5%) | 4 (9.5%) |
| Bachelor's Degree or higher | 141 (91.6%) | 2 (1.4%) |
| Total | 280 (88.9%) | 7 (2.1%) |
Employment Occupations by Sex in Millstone borough
Management, Business, Science and Arts Occupations
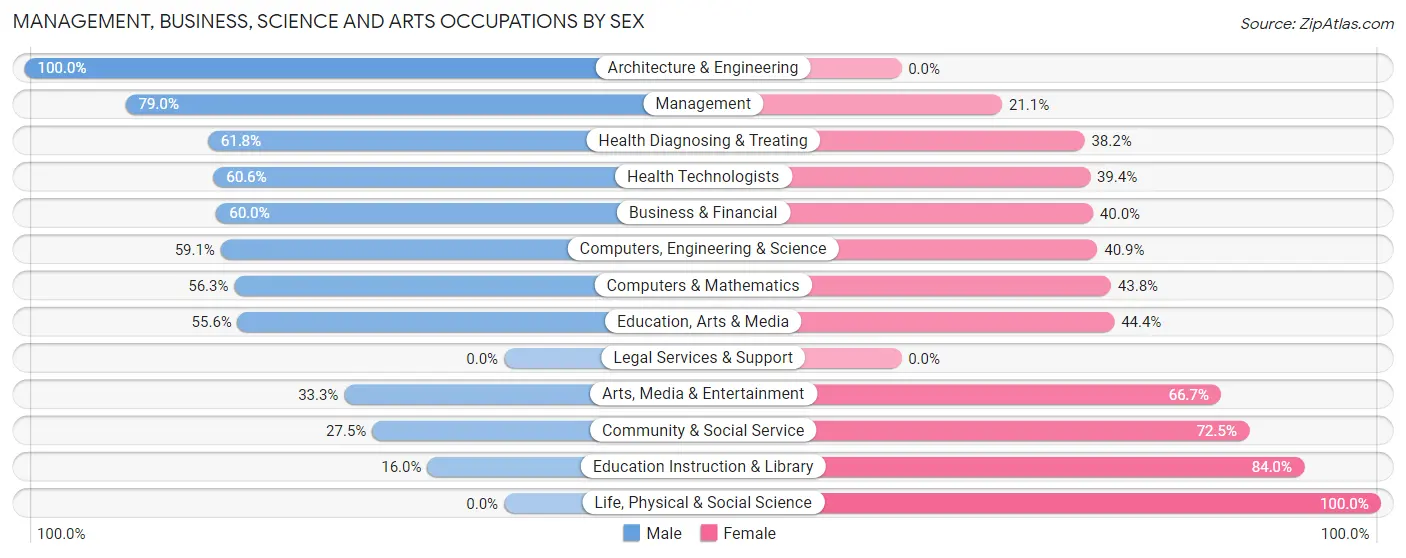
The most common Management, Business, Science and Arts occupations in Millstone borough are Health Diagnosing & Treating (68 | 19.1%), Health Technologists (66 | 18.5%), Community & Social Service (40 | 11.2%), Education Instruction & Library (25 | 7.0%), and Computers, Engineering & Science (22 | 6.2%).
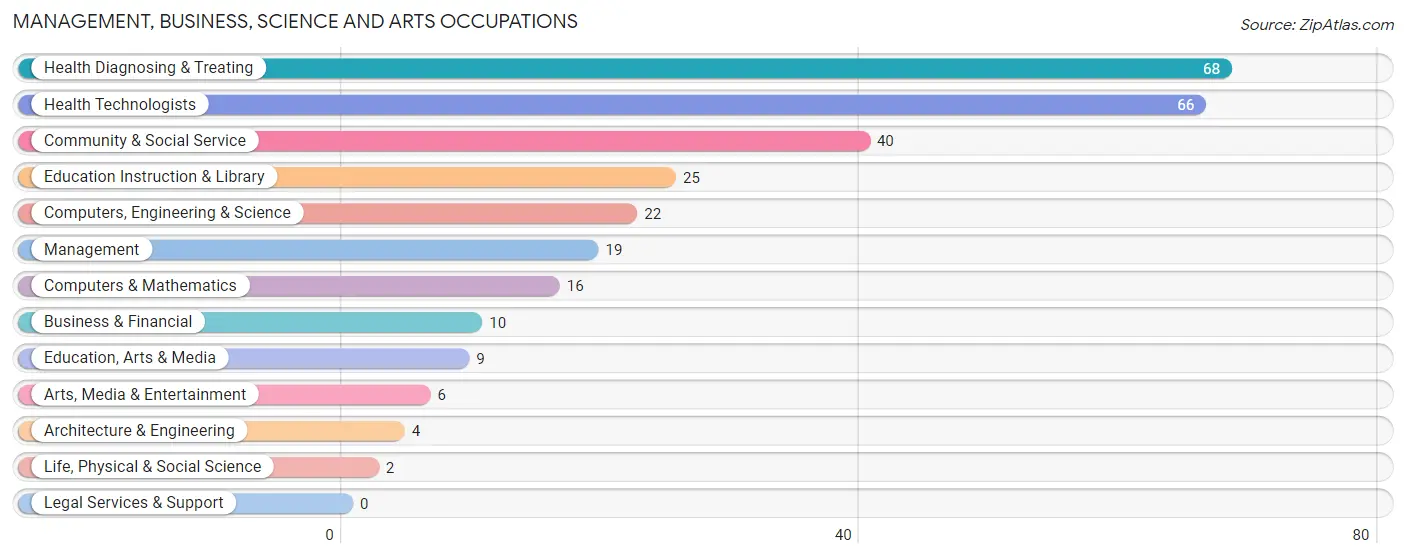
Management, Business, Science and Arts Occupations by Sex
Within the Management, Business, Science and Arts occupations in Millstone borough, the most male-oriented occupations are Architecture & Engineering (100.0%), Management (78.9%), and Health Diagnosing & Treating (61.8%), while the most female-oriented occupations are Life, Physical & Social Science (100.0%), Education Instruction & Library (84.0%), and Community & Social Service (72.5%).
| Occupation | Male | Female |
| Management | 15 (78.9%) | 4 (21.0%) |
| Business & Financial | 6 (60.0%) | 4 (40.0%) |
| Computers, Engineering & Science | 13 (59.1%) | 9 (40.9%) |
| Computers & Mathematics | 9 (56.2%) | 7 (43.8%) |
| Architecture & Engineering | 4 (100.0%) | 0 (0.0%) |
| Life, Physical & Social Science | 0 (0.0%) | 2 (100.0%) |
| Community & Social Service | 11 (27.5%) | 29 (72.5%) |
| Education, Arts & Media | 5 (55.6%) | 4 (44.4%) |
| Legal Services & Support | 0 (0.0%) | 0 (0.0%) |
| Education Instruction & Library | 4 (16.0%) | 21 (84.0%) |
| Arts, Media & Entertainment | 2 (33.3%) | 4 (66.7%) |
| Health Diagnosing & Treating | 42 (61.8%) | 26 (38.2%) |
| Health Technologists | 40 (60.6%) | 26 (39.4%) |
| Total (Category) | 87 (54.7%) | 72 (45.3%) |
| Total (Overall) | 211 (59.1%) | 146 (40.9%) |
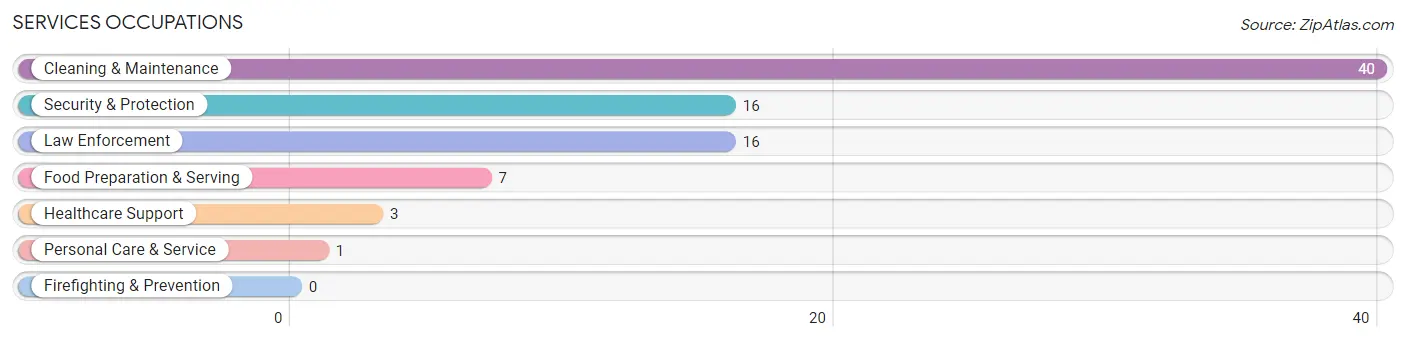
Services Occupations
The most common Services occupations in Millstone borough are Cleaning & Maintenance (40 | 11.2%), Security & Protection (16 | 4.5%), Law Enforcement (16 | 4.5%), Food Preparation & Serving (7 | 2.0%), and Healthcare Support (3 | 0.8%).
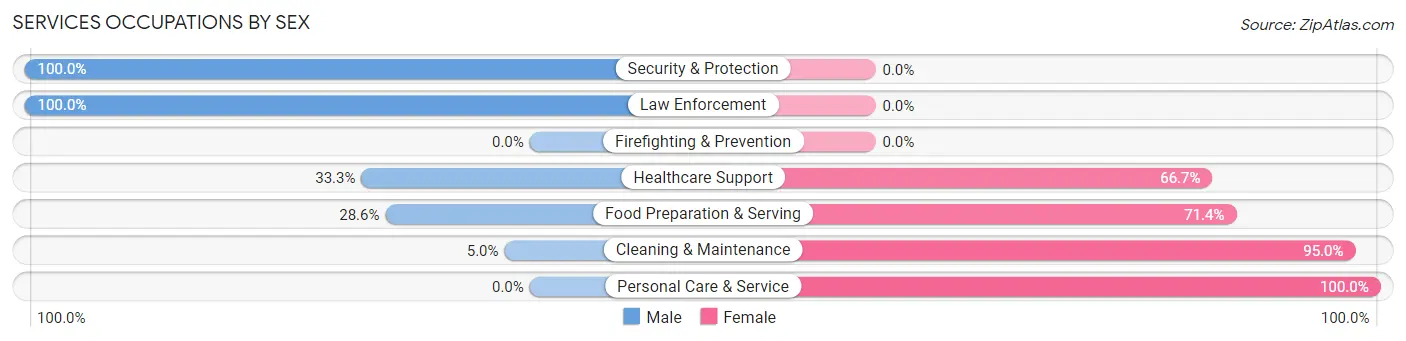
Services Occupations by Sex
Within the Services occupations in Millstone borough, the most male-oriented occupations are Security & Protection (100.0%), Law Enforcement (100.0%), and Healthcare Support (33.3%), while the most female-oriented occupations are Personal Care & Service (100.0%), Cleaning & Maintenance (95.0%), and Food Preparation & Serving (71.4%).
| Occupation | Male | Female |
| Healthcare Support | 1 (33.3%) | 2 (66.7%) |
| Security & Protection | 16 (100.0%) | 0 (0.0%) |
| Firefighting & Prevention | 0 (0.0%) | 0 (0.0%) |
| Law Enforcement | 16 (100.0%) | 0 (0.0%) |
| Food Preparation & Serving | 2 (28.6%) | 5 (71.4%) |
| Cleaning & Maintenance | 2 (5.0%) | 38 (95.0%) |
| Personal Care & Service | 0 (0.0%) | 1 (100.0%) |
| Total (Category) | 21 (31.3%) | 46 (68.7%) |
| Total (Overall) | 211 (59.1%) | 146 (40.9%) |
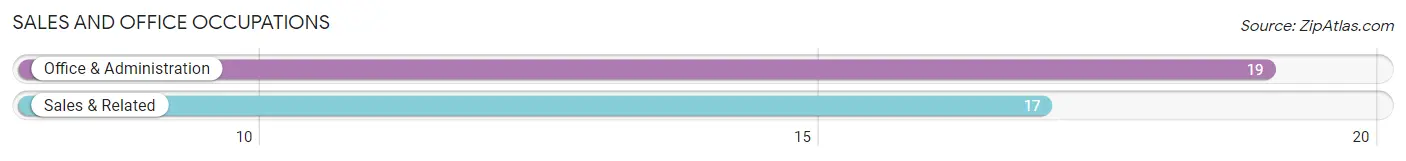
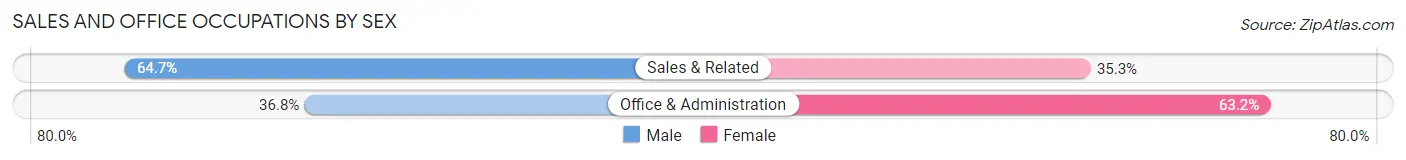
Sales and Office Occupations
The most common Sales and Office occupations in Millstone borough are Office & Administration (19 | 5.3%), and Sales & Related (17 | 4.8%).
Sales and Office Occupations by Sex
| Occupation | Male | Female |
| Sales & Related | 11 (64.7%) | 6 (35.3%) |
| Office & Administration | 7 (36.8%) | 12 (63.2%) |
| Total (Category) | 18 (50.0%) | 18 (50.0%) |
| Total (Overall) | 211 (59.1%) | 146 (40.9%) |
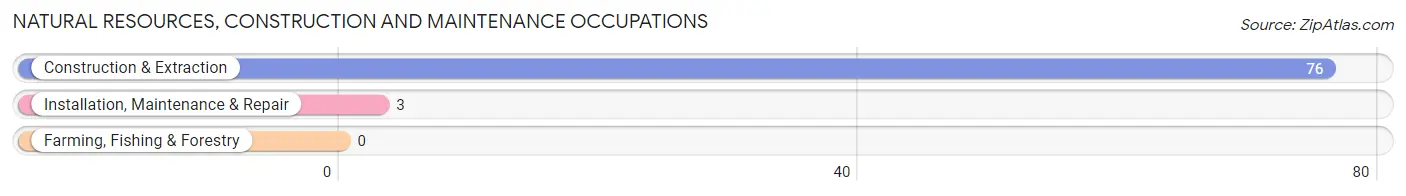
Natural Resources, Construction and Maintenance Occupations
The most common Natural Resources, Construction and Maintenance occupations in Millstone borough are Construction & Extraction (76 | 21.3%), and Installation, Maintenance & Repair (3 | 0.8%).
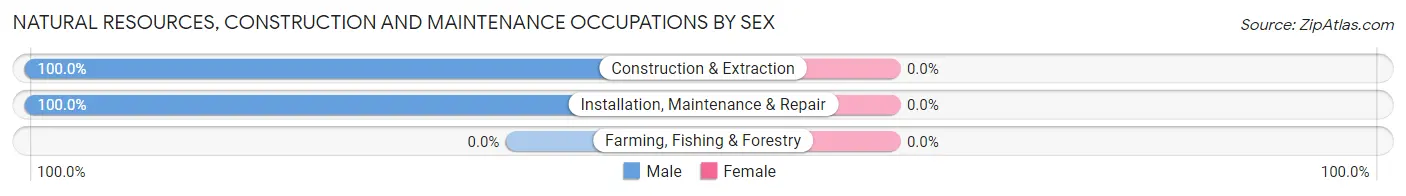
Natural Resources, Construction and Maintenance Occupations by Sex
| Occupation | Male | Female |
| Farming, Fishing & Forestry | 0 (0.0%) | 0 (0.0%) |
| Construction & Extraction | 76 (100.0%) | 0 (0.0%) |
| Installation, Maintenance & Repair | 3 (100.0%) | 0 (0.0%) |
| Total (Category) | 79 (100.0%) | 0 (0.0%) |
| Total (Overall) | 211 (59.1%) | 146 (40.9%) |
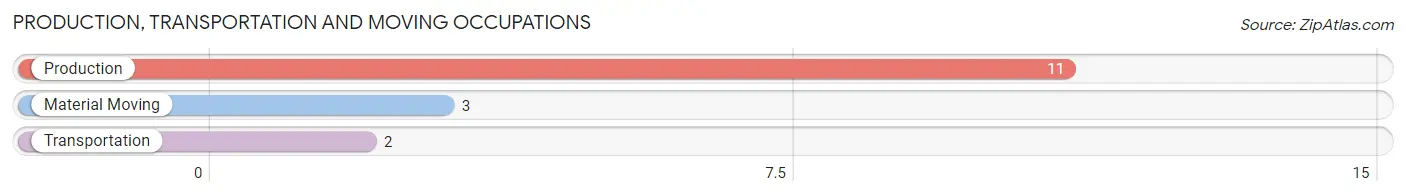
Production, Transportation and Moving Occupations
The most common Production, Transportation and Moving occupations in Millstone borough are Production (11 | 3.1%), Material Moving (3 | 0.8%), and Transportation (2 | 0.6%).
Production, Transportation and Moving Occupations by Sex
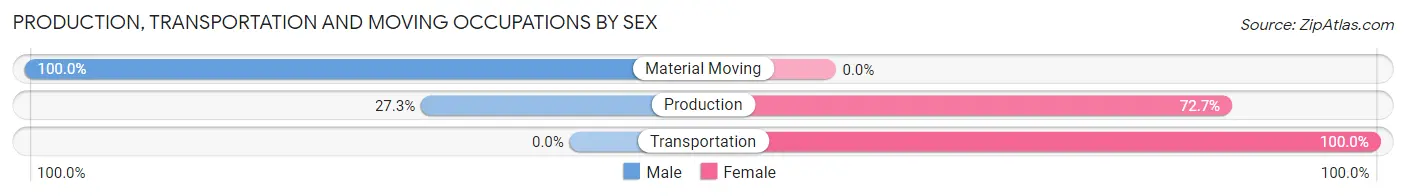
| Occupation | Male | Female |
| Production | 3 (27.3%) | 8 (72.7%) |
| Transportation | 0 (0.0%) | 2 (100.0%) |
| Material Moving | 3 (100.0%) | 0 (0.0%) |
| Total (Category) | 6 (37.5%) | 10 (62.5%) |
| Total (Overall) | 211 (59.1%) | 146 (40.9%) |
Employment Industries by Sex in Millstone borough
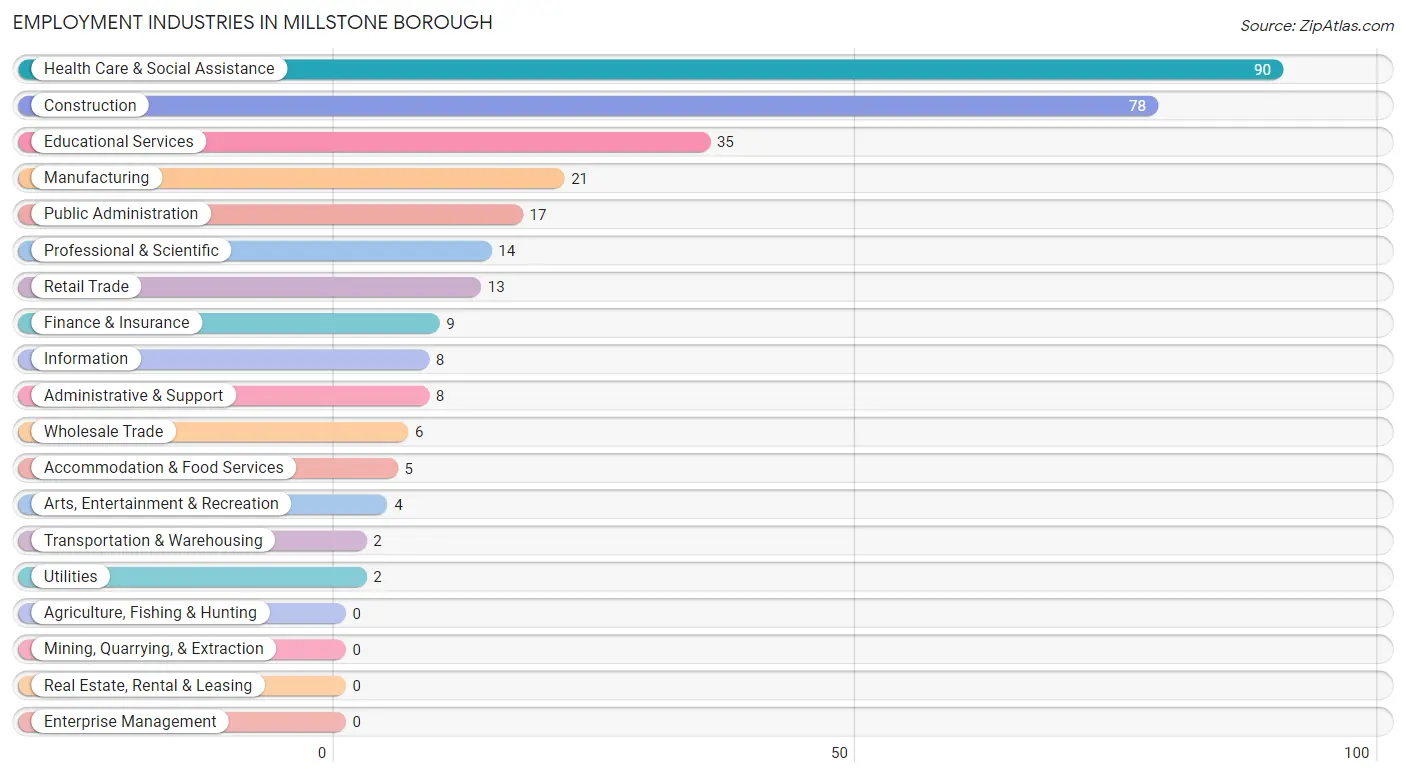
Employment Industries in Millstone borough
The major employment industries in Millstone borough include Health Care & Social Assistance (90 | 25.2%), Construction (78 | 21.8%), Educational Services (35 | 9.8%), Manufacturing (21 | 5.9%), and Public Administration (17 | 4.8%).
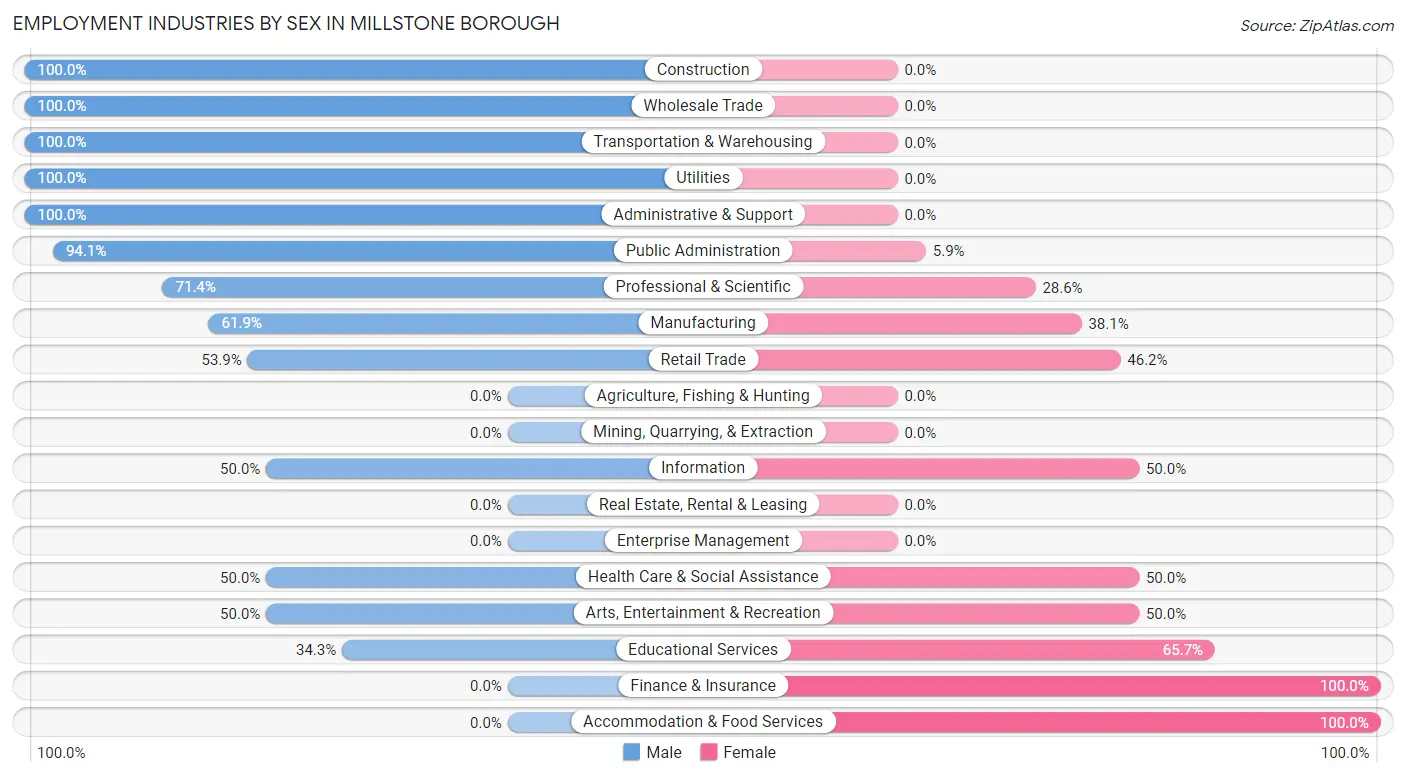
Employment Industries by Sex in Millstone borough
The Millstone borough industries that see more men than women are Construction (100.0%), Wholesale Trade (100.0%), and Transportation & Warehousing (100.0%), whereas the industries that tend to have a higher number of women are Finance & Insurance (100.0%), Accommodation & Food Services (100.0%), and Educational Services (65.7%).
| Industry | Male | Female |
| Agriculture, Fishing & Hunting | 0 (0.0%) | 0 (0.0%) |
| Mining, Quarrying, & Extraction | 0 (0.0%) | 0 (0.0%) |
| Construction | 78 (100.0%) | 0 (0.0%) |
| Manufacturing | 13 (61.9%) | 8 (38.1%) |
| Wholesale Trade | 6 (100.0%) | 0 (0.0%) |
| Retail Trade | 7 (53.8%) | 6 (46.2%) |
| Transportation & Warehousing | 2 (100.0%) | 0 (0.0%) |
| Utilities | 2 (100.0%) | 0 (0.0%) |
| Information | 4 (50.0%) | 4 (50.0%) |
| Finance & Insurance | 0 (0.0%) | 9 (100.0%) |
| Real Estate, Rental & Leasing | 0 (0.0%) | 0 (0.0%) |
| Professional & Scientific | 10 (71.4%) | 4 (28.6%) |
| Enterprise Management | 0 (0.0%) | 0 (0.0%) |
| Administrative & Support | 8 (100.0%) | 0 (0.0%) |
| Educational Services | 12 (34.3%) | 23 (65.7%) |
| Health Care & Social Assistance | 45 (50.0%) | 45 (50.0%) |
| Arts, Entertainment & Recreation | 2 (50.0%) | 2 (50.0%) |
| Accommodation & Food Services | 0 (0.0%) | 5 (100.0%) |
| Public Administration | 16 (94.1%) | 1 (5.9%) |
| Total | 211 (59.1%) | 146 (40.9%) |
Education in Millstone borough
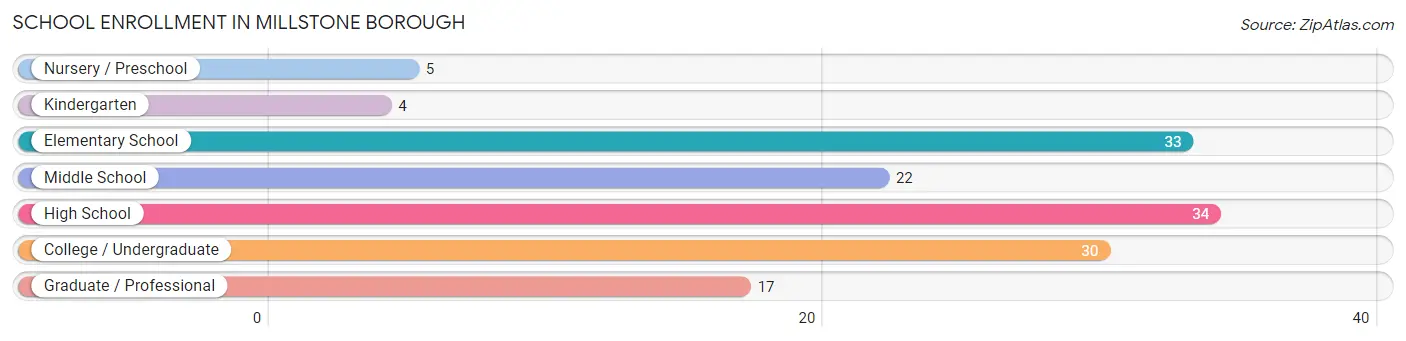
School Enrollment in Millstone borough
The most common levels of schooling among the 145 students in Millstone borough are high school (34 | 23.4%), elementary school (33 | 22.8%), and college / undergraduate (30 | 20.7%).
| School Level | # Students | % Students |
| Nursery / Preschool | 5 | 3.5% |
| Kindergarten | 4 | 2.8% |
| Elementary School | 33 | 22.8% |
| Middle School | 22 | 15.2% |
| High School | 34 | 23.4% |
| College / Undergraduate | 30 | 20.7% |
| Graduate / Professional | 17 | 11.7% |
| Total | 145 | 100.0% |
School Enrollment by Age by Funding Source in Millstone borough
Out of a total of 145 students who are enrolled in schools in Millstone borough, 14 (9.7%) attend a private institution, while the remaining 131 (90.3%) are enrolled in public schools. The age group of 18 to 19 year olds has the highest likelihood of being enrolled in private schools, with 3 (100.0% in the age bracket) enrolled. Conversely, the age group of 35 years and over has the lowest likelihood of being enrolled in a private school, with 7 (100.0% in the age bracket) attending a public institution.
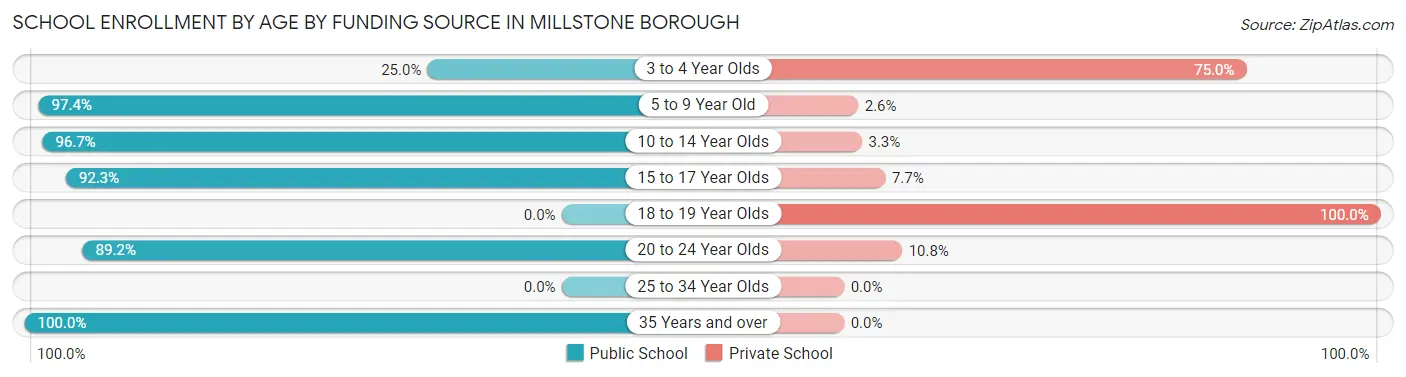
| Age Bracket | Public School | Private School |
| 3 to 4 Year Olds | 1 (25.0%) | 3 (75.0%) |
| 5 to 9 Year Old | 37 (97.4%) | 1 (2.6%) |
| 10 to 14 Year Olds | 29 (96.7%) | 1 (3.3%) |
| 15 to 17 Year Olds | 24 (92.3%) | 2 (7.7%) |
| 18 to 19 Year Olds | 0 (0.0%) | 3 (100.0%) |
| 20 to 24 Year Olds | 33 (89.2%) | 4 (10.8%) |
| 25 to 34 Year Olds | 0 (0.0%) | 0 (0.0%) |
| 35 Years and over | 7 (100.0%) | 0 (0.0%) |
| Total | 131 (90.3%) | 14 (9.7%) |
Educational Attainment by Field of Study in Millstone borough
Business (48 | 24.4%), science & technology (29 | 14.7%), liberal arts & history (26 | 13.2%), education (23 | 11.7%), and arts & humanities (17 | 8.6%) are the most common fields of study among 197 individuals in Millstone borough who have obtained a bachelor's degree or higher.
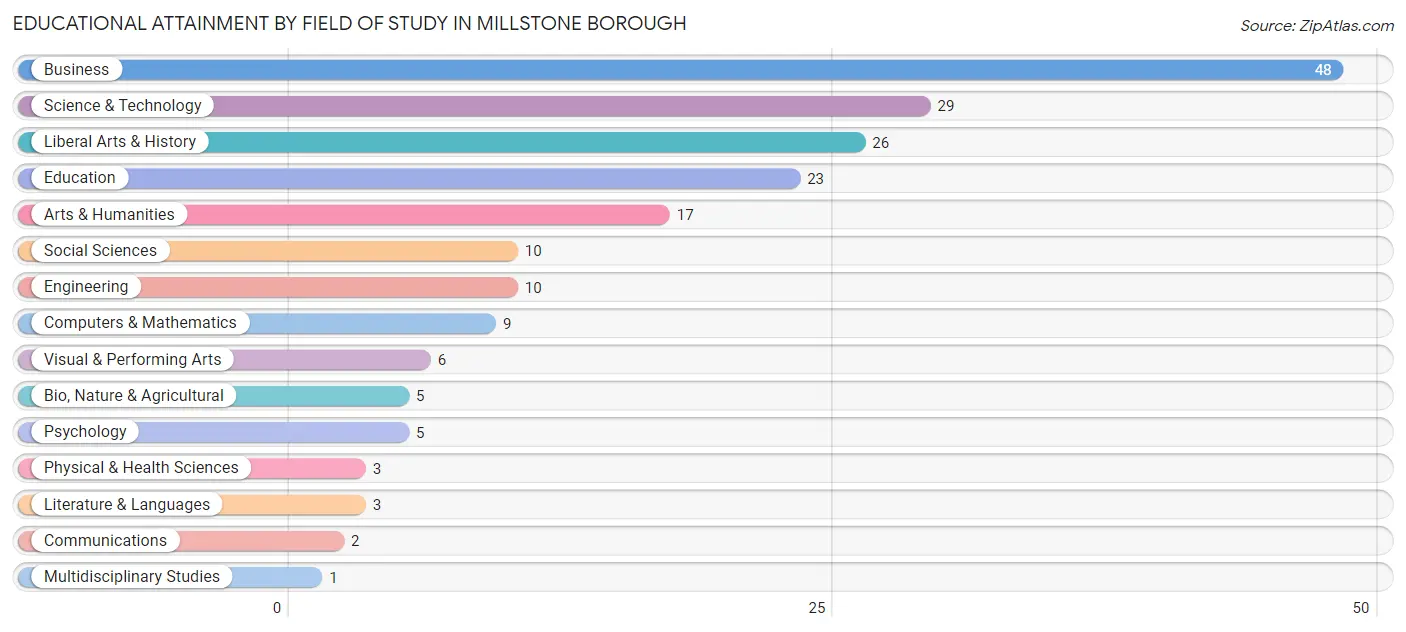
| Field of Study | # Graduates | % Graduates |
| Computers & Mathematics | 9 | 4.6% |
| Bio, Nature & Agricultural | 5 | 2.5% |
| Physical & Health Sciences | 3 | 1.5% |
| Psychology | 5 | 2.5% |
| Social Sciences | 10 | 5.1% |
| Engineering | 10 | 5.1% |
| Multidisciplinary Studies | 1 | 0.5% |
| Science & Technology | 29 | 14.7% |
| Business | 48 | 24.4% |
| Education | 23 | 11.7% |
| Literature & Languages | 3 | 1.5% |
| Liberal Arts & History | 26 | 13.2% |
| Visual & Performing Arts | 6 | 3.0% |
| Communications | 2 | 1.0% |
| Arts & Humanities | 17 | 8.6% |
| Total | 197 | 100.0% |
Transportation & Commute in Millstone borough
Vehicle Availability by Sex in Millstone borough
The most prevalent vehicle ownership categories in Millstone borough are males with 5 or more vehicles (106, accounting for 50.7%) and females with 5 or more vehicles (59, making up 74.1%).
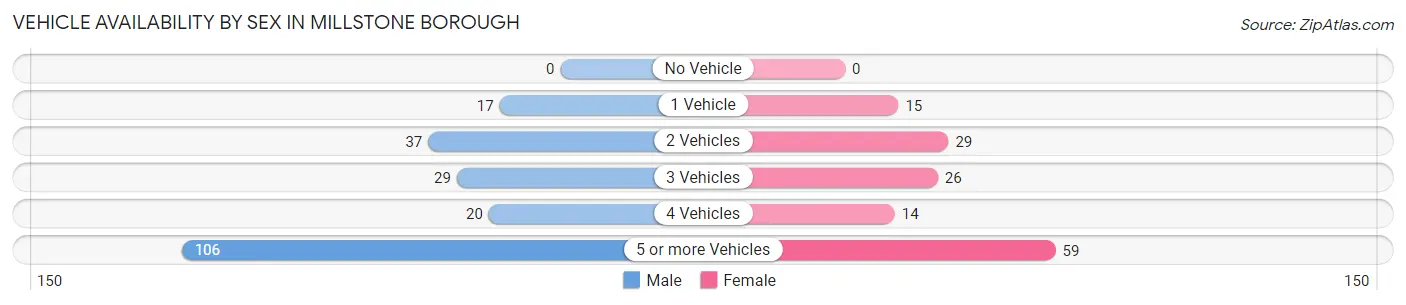
| Vehicles Available | Male | Female |
| No Vehicle | 0 (0.0%) | 0 (0.0%) |
| 1 Vehicle | 17 (8.1%) | 15 (10.5%) |
| 2 Vehicles | 37 (17.7%) | 29 (20.3%) |
| 3 Vehicles | 29 (13.9%) | 26 (18.2%) |
| 4 Vehicles | 20 (9.6%) | 14 (9.8%) |
| 5 or more Vehicles | 106 (50.7%) | 59 (41.3%) |
| Total | 209 (100.0%) | 143 (100.0%) |
Commute Time in Millstone borough
The most frequently occuring commute durations in Millstone borough are 30 to 34 minutes (86 commuters, 25.8%), 10 to 14 minutes (72 commuters, 21.6%), and 45 to 59 minutes (37 commuters, 11.1%).
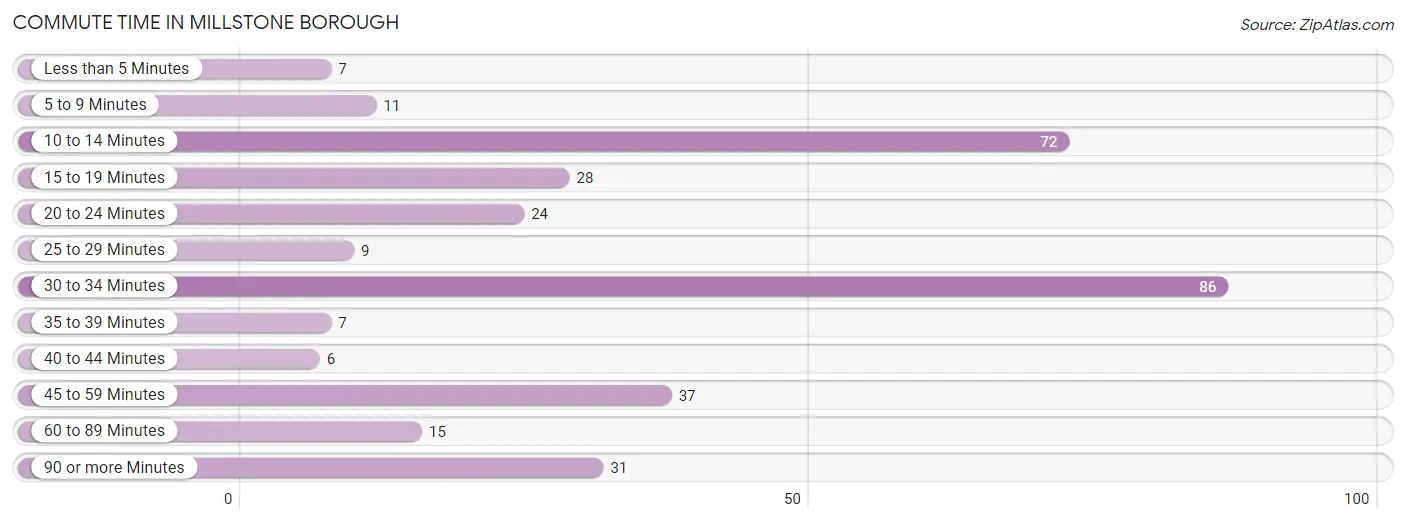
| Commute Time | # Commuters | % Commuters |
| Less than 5 Minutes | 7 | 2.1% |
| 5 to 9 Minutes | 11 | 3.3% |
| 10 to 14 Minutes | 72 | 21.6% |
| 15 to 19 Minutes | 28 | 8.4% |
| 20 to 24 Minutes | 24 | 7.2% |
| 25 to 29 Minutes | 9 | 2.7% |
| 30 to 34 Minutes | 86 | 25.8% |
| 35 to 39 Minutes | 7 | 2.1% |
| 40 to 44 Minutes | 6 | 1.8% |
| 45 to 59 Minutes | 37 | 11.1% |
| 60 to 89 Minutes | 15 | 4.5% |
| 90 or more Minutes | 31 | 9.3% |
Commute Time by Sex in Millstone borough
The most common commute times in Millstone borough are 10 to 14 minutes (69 commuters, 34.8%) for males and 30 to 34 minutes (42 commuters, 31.1%) for females.
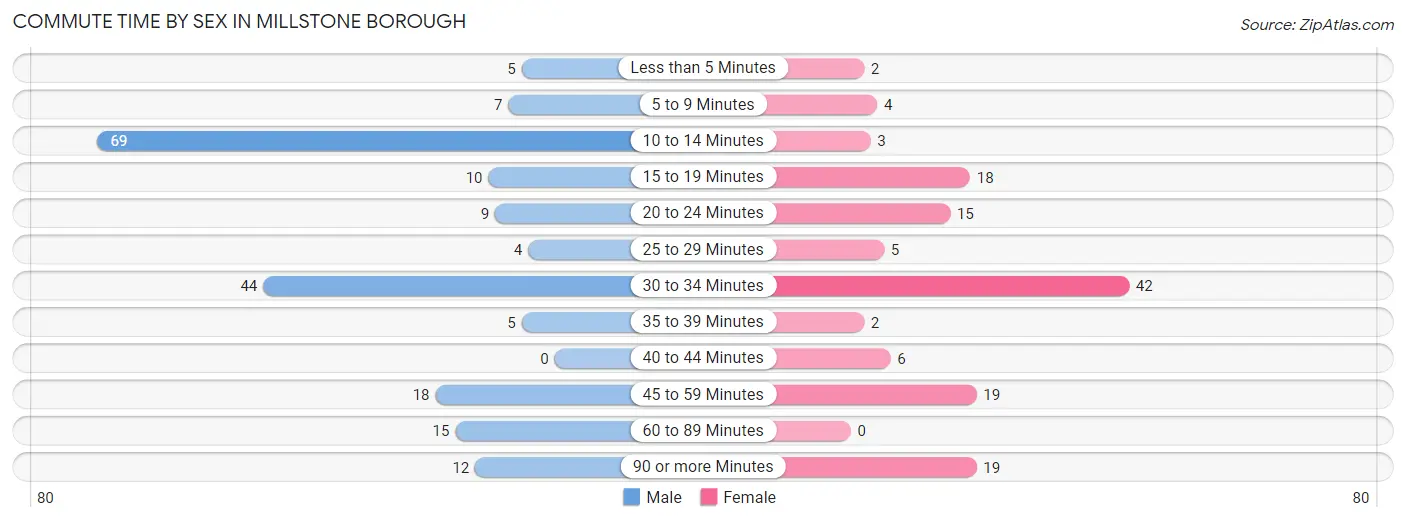
| Commute Time | Male | Female |
| Less than 5 Minutes | 5 (2.5%) | 2 (1.5%) |
| 5 to 9 Minutes | 7 (3.5%) | 4 (3.0%) |
| 10 to 14 Minutes | 69 (34.8%) | 3 (2.2%) |
| 15 to 19 Minutes | 10 (5.1%) | 18 (13.3%) |
| 20 to 24 Minutes | 9 (4.5%) | 15 (11.1%) |
| 25 to 29 Minutes | 4 (2.0%) | 5 (3.7%) |
| 30 to 34 Minutes | 44 (22.2%) | 42 (31.1%) |
| 35 to 39 Minutes | 5 (2.5%) | 2 (1.5%) |
| 40 to 44 Minutes | 0 (0.0%) | 6 (4.4%) |
| 45 to 59 Minutes | 18 (9.1%) | 19 (14.1%) |
| 60 to 89 Minutes | 15 (7.6%) | 0 (0.0%) |
| 90 or more Minutes | 12 (6.1%) | 19 (14.1%) |
Time of Departure to Work by Sex in Millstone borough
The most frequent times of departure to work in Millstone borough are 6:30 AM to 6:59 AM (80, 40.4%) for males and 10:00 AM to 10:59 AM (44, 32.6%) for females.
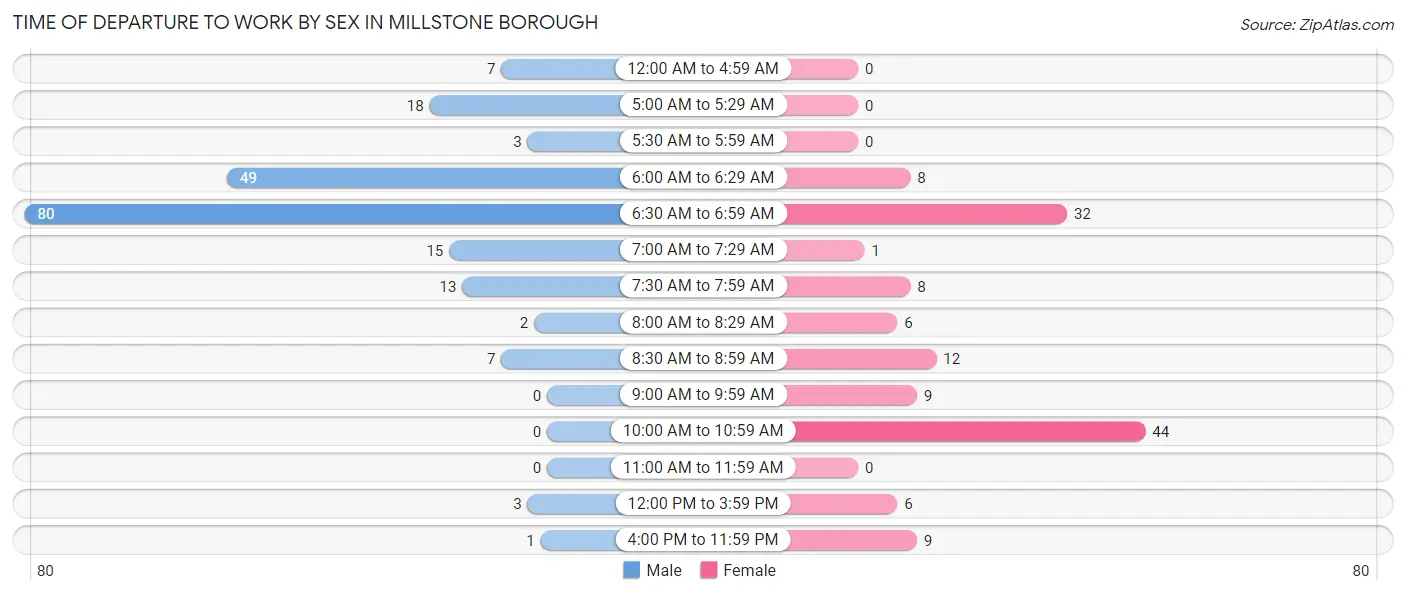
| Time of Departure | Male | Female |
| 12:00 AM to 4:59 AM | 7 (3.5%) | 0 (0.0%) |
| 5:00 AM to 5:29 AM | 18 (9.1%) | 0 (0.0%) |
| 5:30 AM to 5:59 AM | 3 (1.5%) | 0 (0.0%) |
| 6:00 AM to 6:29 AM | 49 (24.7%) | 8 (5.9%) |
| 6:30 AM to 6:59 AM | 80 (40.4%) | 32 (23.7%) |
| 7:00 AM to 7:29 AM | 15 (7.6%) | 1 (0.7%) |
| 7:30 AM to 7:59 AM | 13 (6.6%) | 8 (5.9%) |
| 8:00 AM to 8:29 AM | 2 (1.0%) | 6 (4.4%) |
| 8:30 AM to 8:59 AM | 7 (3.5%) | 12 (8.9%) |
| 9:00 AM to 9:59 AM | 0 (0.0%) | 9 (6.7%) |
| 10:00 AM to 10:59 AM | 0 (0.0%) | 44 (32.6%) |
| 11:00 AM to 11:59 AM | 0 (0.0%) | 0 (0.0%) |
| 12:00 PM to 3:59 PM | 3 (1.5%) | 6 (4.4%) |
| 4:00 PM to 11:59 PM | 1 (0.5%) | 9 (6.7%) |
| Total | 198 (100.0%) | 135 (100.0%) |
Housing Occupancy in Millstone borough
Occupancy by Ownership in Millstone borough
Of the total 184 dwellings in Millstone borough, owner-occupied units account for 168 (91.3%), while renter-occupied units make up 16 (8.7%).
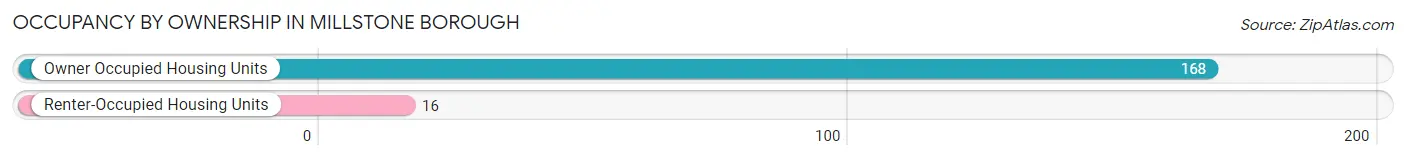
| Occupancy | # Housing Units | % Housing Units |
| Owner Occupied Housing Units | 168 | 91.3% |
| Renter-Occupied Housing Units | 16 | 8.7% |
| Total Occupied Housing Units | 184 | 100.0% |
Occupancy by Household Size in Millstone borough
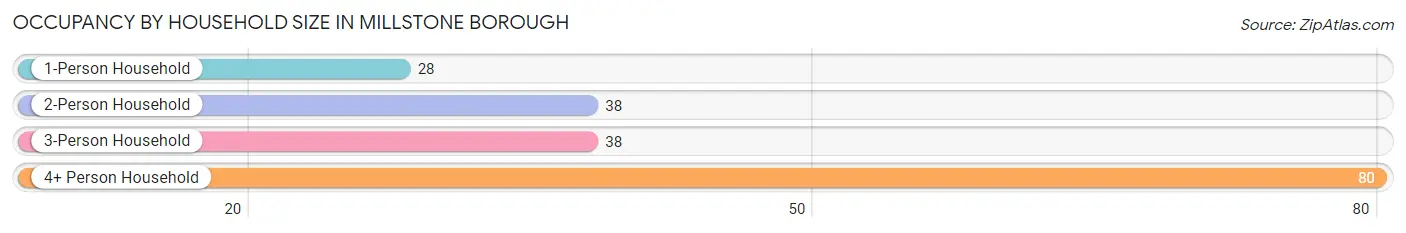
| Household Size | # Housing Units | % Housing Units |
| 1-Person Household | 28 | 15.2% |
| 2-Person Household | 38 | 20.6% |
| 3-Person Household | 38 | 20.6% |
| 4+ Person Household | 80 | 43.5% |
| Total Housing Units | 184 | 100.0% |
Occupancy by Ownership by Household Size in Millstone borough
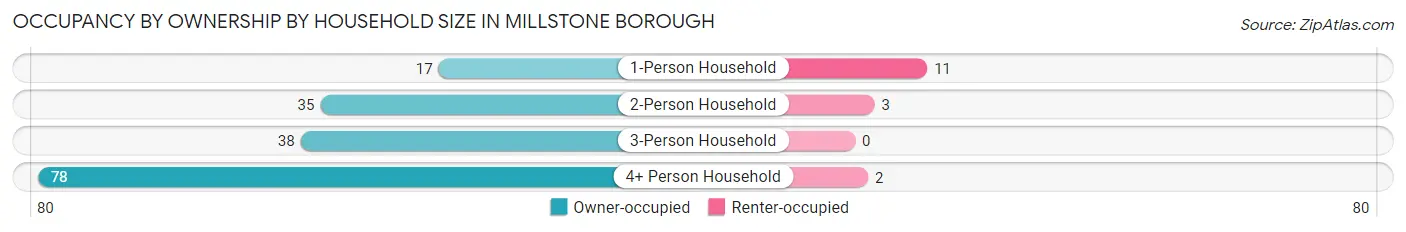
| Household Size | Owner-occupied | Renter-occupied |
| 1-Person Household | 17 (60.7%) | 11 (39.3%) |
| 2-Person Household | 35 (92.1%) | 3 (7.9%) |
| 3-Person Household | 38 (100.0%) | 0 (0.0%) |
| 4+ Person Household | 78 (97.5%) | 2 (2.5%) |
| Total Housing Units | 168 (91.3%) | 16 (8.7%) |
Occupancy by Educational Attainment in Millstone borough
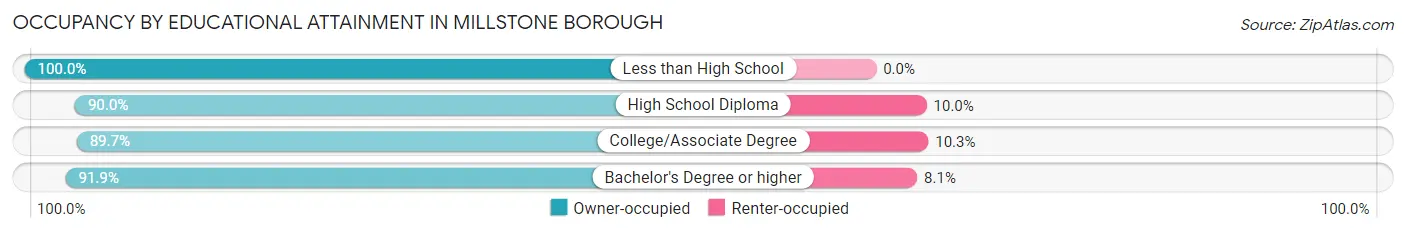
| Household Size | Owner-occupied | Renter-occupied |
| Less than High School | 2 (100.0%) | 0 (0.0%) |
| High School Diploma | 27 (90.0%) | 3 (10.0%) |
| College/Associate Degree | 26 (89.7%) | 3 (10.3%) |
| Bachelor's Degree or higher | 113 (91.9%) | 10 (8.1%) |
Occupancy by Age of Householder in Millstone borough
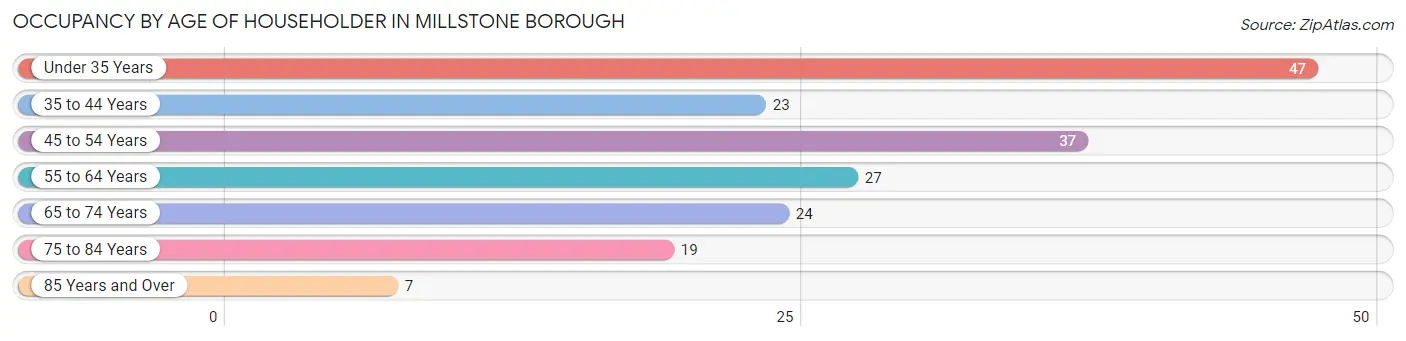
| Age Bracket | # Households | % Households |
| Under 35 Years | 47 | 25.5% |
| 35 to 44 Years | 23 | 12.5% |
| 45 to 54 Years | 37 | 20.1% |
| 55 to 64 Years | 27 | 14.7% |
| 65 to 74 Years | 24 | 13.0% |
| 75 to 84 Years | 19 | 10.3% |
| 85 Years and Over | 7 | 3.8% |
| Total | 184 | 100.0% |
Housing Finances in Millstone borough
Median Income by Occupancy in Millstone borough
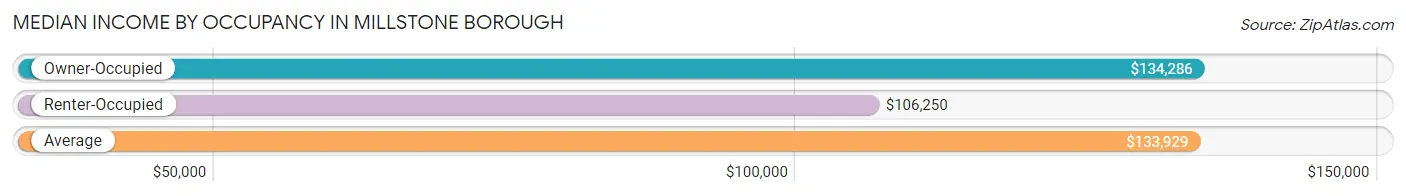
| Occupancy Type | # Households | Median Income |
| Owner-Occupied | 168 (91.3%) | $134,286 |
| Renter-Occupied | 16 (8.7%) | $106,250 |
| Average | 184 (100.0%) | $133,929 |
Occupancy by Householder Income Bracket in Millstone borough
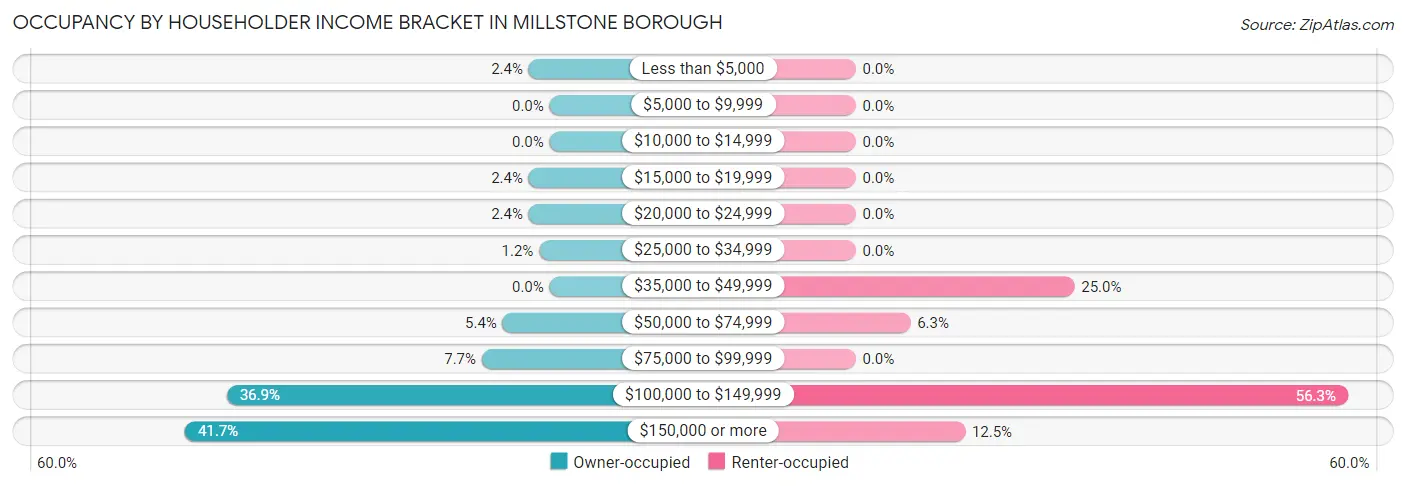
| Income Bracket | Owner-occupied | Renter-occupied |
| Less than $5,000 | 4 (2.4%) | 0 (0.0%) |
| $5,000 to $9,999 | 0 (0.0%) | 0 (0.0%) |
| $10,000 to $14,999 | 0 (0.0%) | 0 (0.0%) |
| $15,000 to $19,999 | 4 (2.4%) | 0 (0.0%) |
| $20,000 to $24,999 | 4 (2.4%) | 0 (0.0%) |
| $25,000 to $34,999 | 2 (1.2%) | 0 (0.0%) |
| $35,000 to $49,999 | 0 (0.0%) | 4 (25.0%) |
| $50,000 to $74,999 | 9 (5.4%) | 1 (6.2%) |
| $75,000 to $99,999 | 13 (7.7%) | 0 (0.0%) |
| $100,000 to $149,999 | 62 (36.9%) | 9 (56.2%) |
| $150,000 or more | 70 (41.7%) | 2 (12.5%) |
| Total | 168 (100.0%) | 16 (100.0%) |
Monthly Housing Cost Tiers in Millstone borough
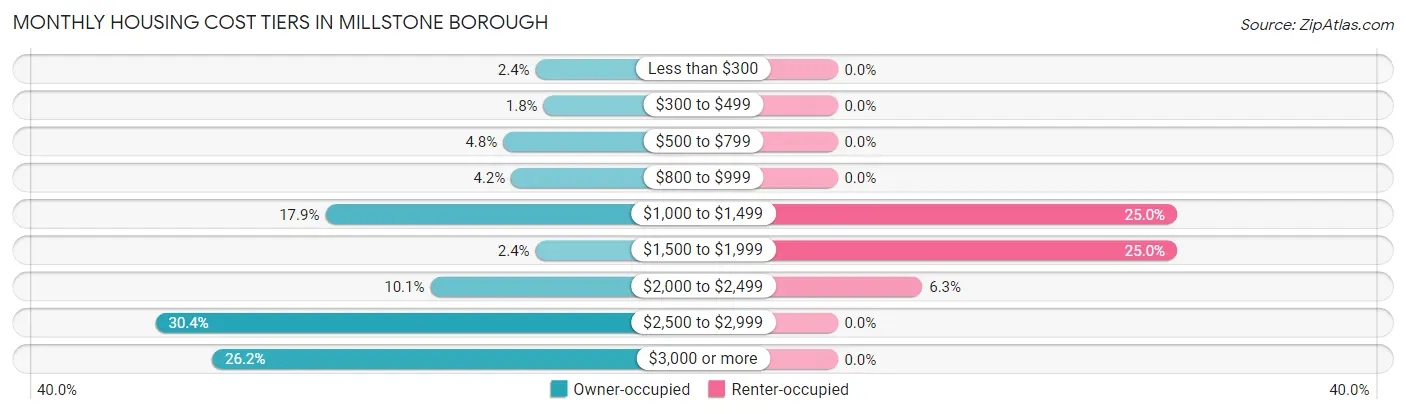
| Monthly Cost | Owner-occupied | Renter-occupied |
| Less than $300 | 4 (2.4%) | 0 (0.0%) |
| $300 to $499 | 3 (1.8%) | 0 (0.0%) |
| $500 to $799 | 8 (4.8%) | 0 (0.0%) |
| $800 to $999 | 7 (4.2%) | 0 (0.0%) |
| $1,000 to $1,499 | 30 (17.9%) | 4 (25.0%) |
| $1,500 to $1,999 | 4 (2.4%) | 4 (25.0%) |
| $2,000 to $2,499 | 17 (10.1%) | 1 (6.2%) |
| $2,500 to $2,999 | 51 (30.4%) | 0 (0.0%) |
| $3,000 or more | 44 (26.2%) | 0 (0.0%) |
| Total | 168 (100.0%) | 16 (100.0%) |
Physical Housing Characteristics in Millstone borough
Housing Structures in Millstone borough
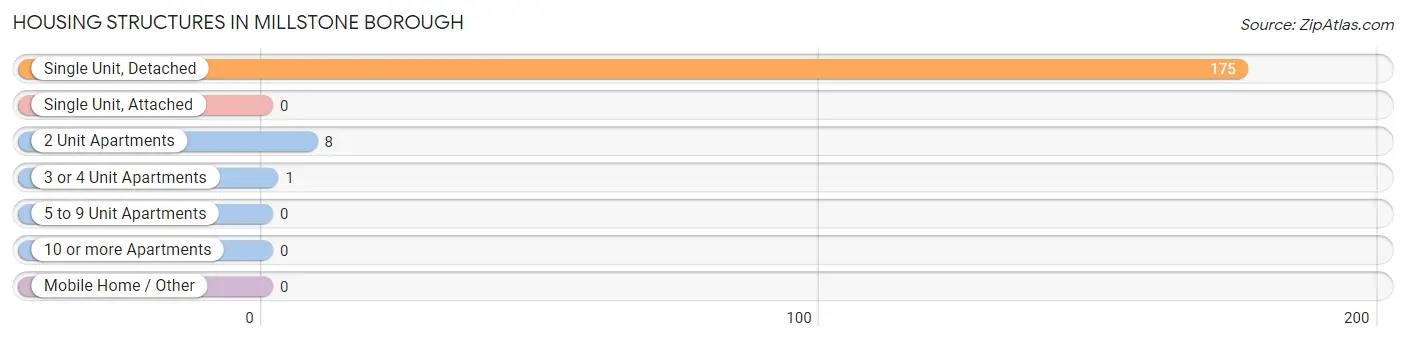
| Structure Type | # Housing Units | % Housing Units |
| Single Unit, Detached | 175 | 95.1% |
| Single Unit, Attached | 0 | 0.0% |
| 2 Unit Apartments | 8 | 4.3% |
| 3 or 4 Unit Apartments | 1 | 0.5% |
| 5 to 9 Unit Apartments | 0 | 0.0% |
| 10 or more Apartments | 0 | 0.0% |
| Mobile Home / Other | 0 | 0.0% |
| Total | 184 | 100.0% |
Housing Structures by Occupancy in Millstone borough
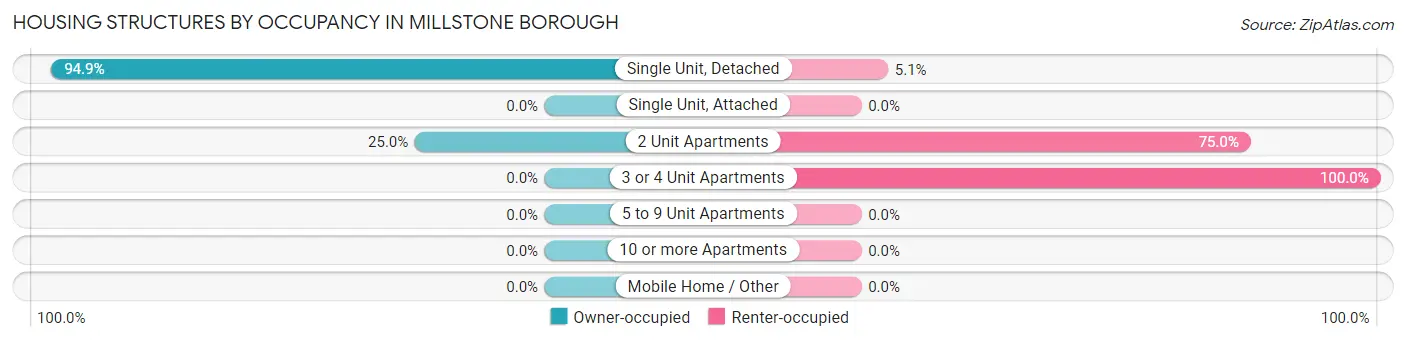
| Structure Type | Owner-occupied | Renter-occupied |
| Single Unit, Detached | 166 (94.9%) | 9 (5.1%) |
| Single Unit, Attached | 0 (0.0%) | 0 (0.0%) |
| 2 Unit Apartments | 2 (25.0%) | 6 (75.0%) |
| 3 or 4 Unit Apartments | 0 (0.0%) | 1 (100.0%) |
| 5 to 9 Unit Apartments | 0 (0.0%) | 0 (0.0%) |
| 10 or more Apartments | 0 (0.0%) | 0 (0.0%) |
| Mobile Home / Other | 0 (0.0%) | 0 (0.0%) |
| Total | 168 (91.3%) | 16 (8.7%) |
Housing Structures by Number of Rooms in Millstone borough
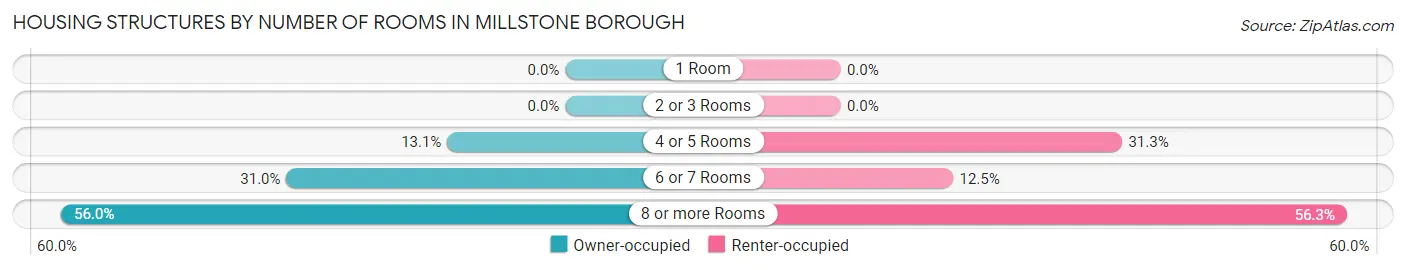
| Number of Rooms | Owner-occupied | Renter-occupied |
| 1 Room | 0 (0.0%) | 0 (0.0%) |
| 2 or 3 Rooms | 0 (0.0%) | 0 (0.0%) |
| 4 or 5 Rooms | 22 (13.1%) | 5 (31.2%) |
| 6 or 7 Rooms | 52 (30.9%) | 2 (12.5%) |
| 8 or more Rooms | 94 (55.9%) | 9 (56.2%) |
| Total | 168 (100.0%) | 16 (100.0%) |
Housing Structure by Heating Type in Millstone borough
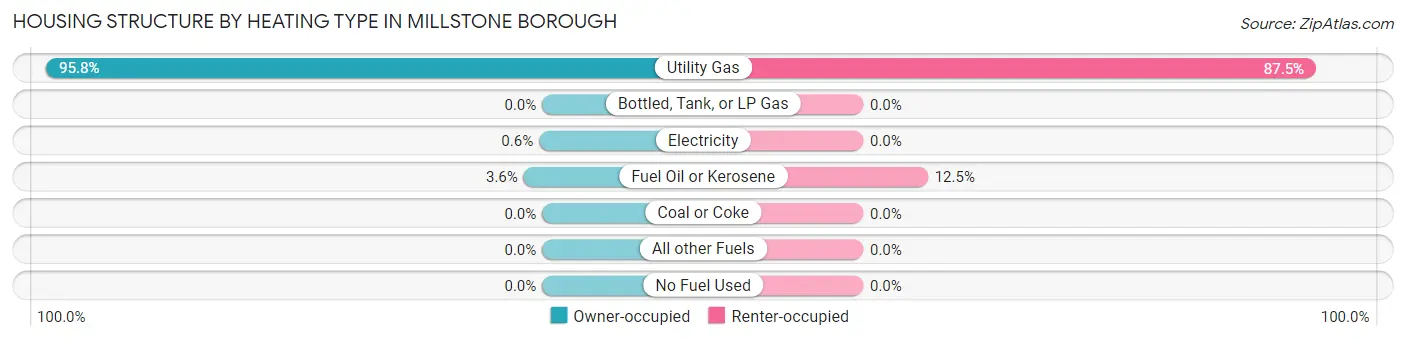
| Heating Type | Owner-occupied | Renter-occupied |
| Utility Gas | 161 (95.8%) | 14 (87.5%) |
| Bottled, Tank, or LP Gas | 0 (0.0%) | 0 (0.0%) |
| Electricity | 1 (0.6%) | 0 (0.0%) |
| Fuel Oil or Kerosene | 6 (3.6%) | 2 (12.5%) |
| Coal or Coke | 0 (0.0%) | 0 (0.0%) |
| All other Fuels | 0 (0.0%) | 0 (0.0%) |
| No Fuel Used | 0 (0.0%) | 0 (0.0%) |
| Total | 168 (100.0%) | 16 (100.0%) |
Household Vehicle Usage in Millstone borough
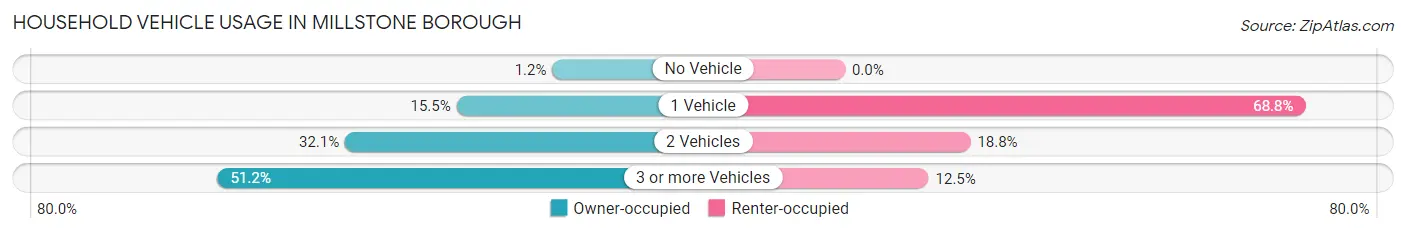
| Vehicles per Household | Owner-occupied | Renter-occupied |
| No Vehicle | 2 (1.2%) | 0 (0.0%) |
| 1 Vehicle | 26 (15.5%) | 11 (68.8%) |
| 2 Vehicles | 54 (32.1%) | 3 (18.8%) |
| 3 or more Vehicles | 86 (51.2%) | 2 (12.5%) |
| Total | 168 (100.0%) | 16 (100.0%) |
Real Estate & Mortgages in Millstone borough
Real Estate and Mortgage Overview in Millstone borough
| Characteristic | Without Mortgage | With Mortgage |
| Housing Units | 52 | 116 |
| Median Property Value | $400,000 | $531,300 |
| Median Household Income | $148,750 | $44 |
| Monthly Housing Costs | $1,086 | $44 |
| Real Estate Taxes | $9,205 | $0 |
Property Value by Mortgage Status in Millstone borough
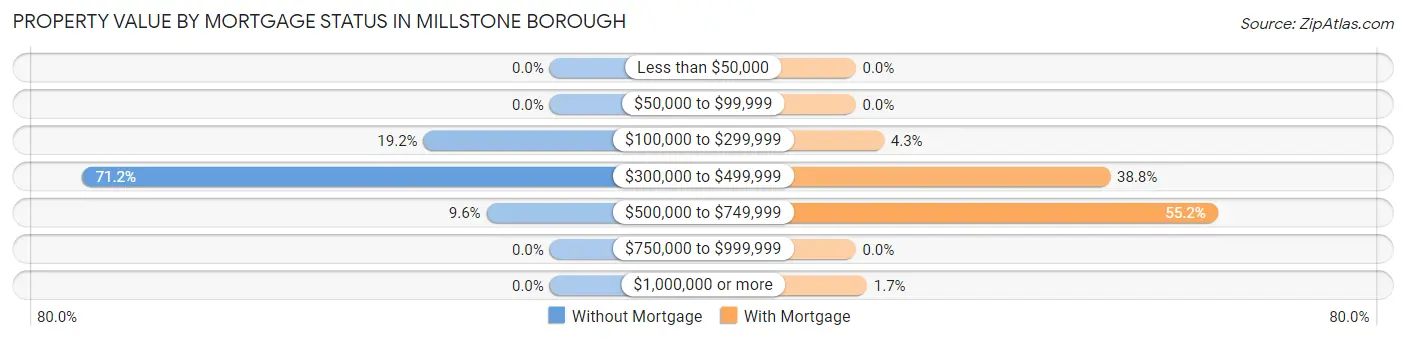
| Property Value | Without Mortgage | With Mortgage |
| Less than $50,000 | 0 (0.0%) | 0 (0.0%) |
| $50,000 to $99,999 | 0 (0.0%) | 0 (0.0%) |
| $100,000 to $299,999 | 10 (19.2%) | 5 (4.3%) |
| $300,000 to $499,999 | 37 (71.2%) | 45 (38.8%) |
| $500,000 to $749,999 | 5 (9.6%) | 64 (55.2%) |
| $750,000 to $999,999 | 0 (0.0%) | 0 (0.0%) |
| $1,000,000 or more | 0 (0.0%) | 2 (1.7%) |
| Total | 52 (100.0%) | 116 (100.0%) |
Household Income by Mortgage Status in Millstone borough
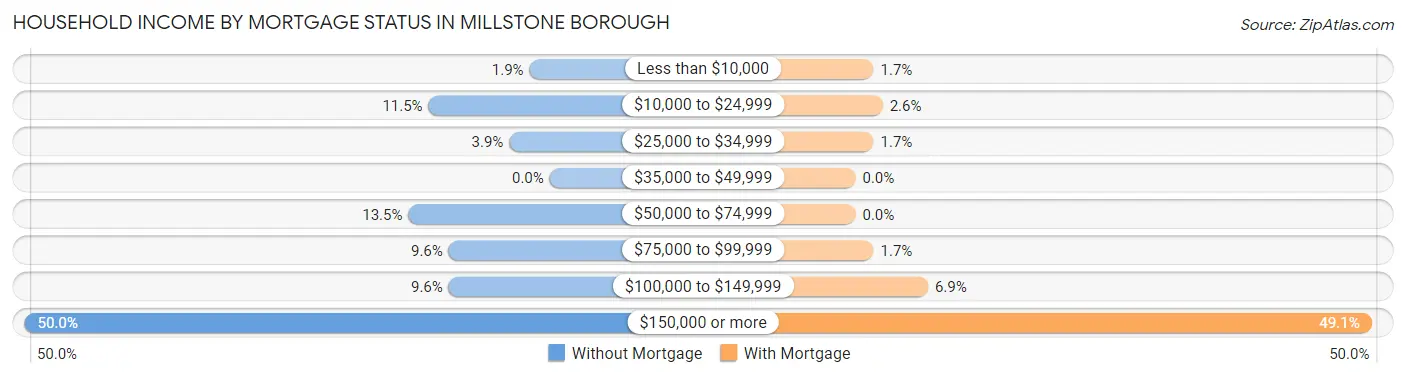
| Household Income | Without Mortgage | With Mortgage |
| Less than $10,000 | 1 (1.9%) | 2 (1.7%) |
| $10,000 to $24,999 | 6 (11.5%) | 3 (2.6%) |
| $25,000 to $34,999 | 2 (3.8%) | 2 (1.7%) |
| $35,000 to $49,999 | 0 (0.0%) | 0 (0.0%) |
| $50,000 to $74,999 | 7 (13.5%) | 0 (0.0%) |
| $75,000 to $99,999 | 5 (9.6%) | 2 (1.7%) |
| $100,000 to $149,999 | 5 (9.6%) | 8 (6.9%) |
| $150,000 or more | 26 (50.0%) | 57 (49.1%) |
| Total | 52 (100.0%) | 116 (100.0%) |
Property Value to Household Income Ratio in Millstone borough
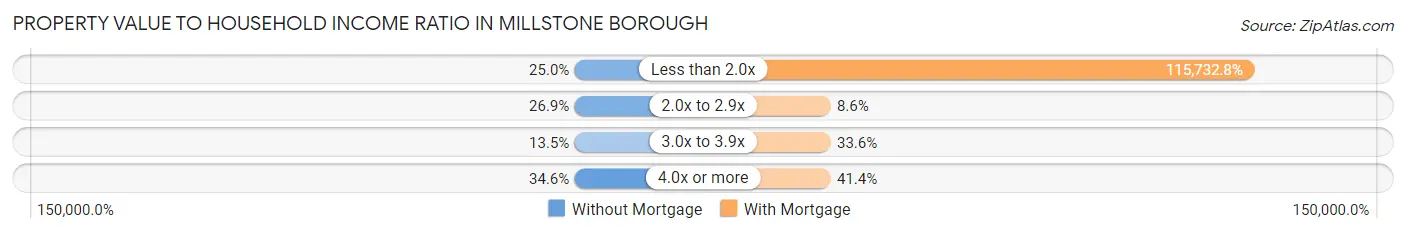
| Value-to-Income Ratio | Without Mortgage | With Mortgage |
| Less than 2.0x | 13 (25.0%) | 134,250 (115,732.8%) |
| 2.0x to 2.9x | 14 (26.9%) | 10 (8.6%) |
| 3.0x to 3.9x | 7 (13.5%) | 39 (33.6%) |
| 4.0x or more | 18 (34.6%) | 48 (41.4%) |
| Total | 52 (100.0%) | 116 (100.0%) |
Real Estate Taxes by Mortgage Status in Millstone borough
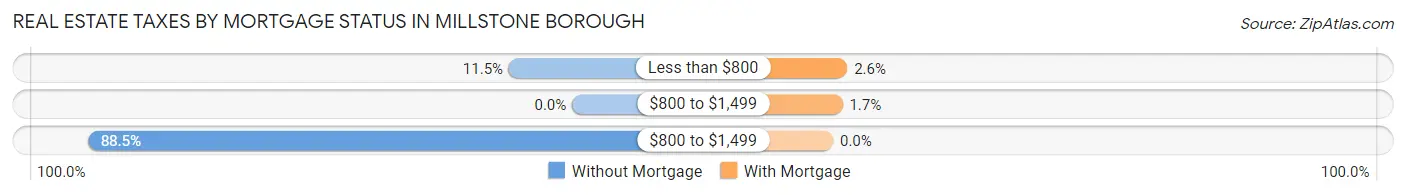
| Property Taxes | Without Mortgage | With Mortgage |
| Less than $800 | 6 (11.5%) | 3 (2.6%) |
| $800 to $1,499 | 0 (0.0%) | 2 (1.7%) |
| $800 to $1,499 | 46 (88.5%) | 0 (0.0%) |
| Total | 52 (100.0%) | 116 (100.0%) |
Health & Disability in Millstone borough
Health Insurance Coverage by Age in Millstone borough
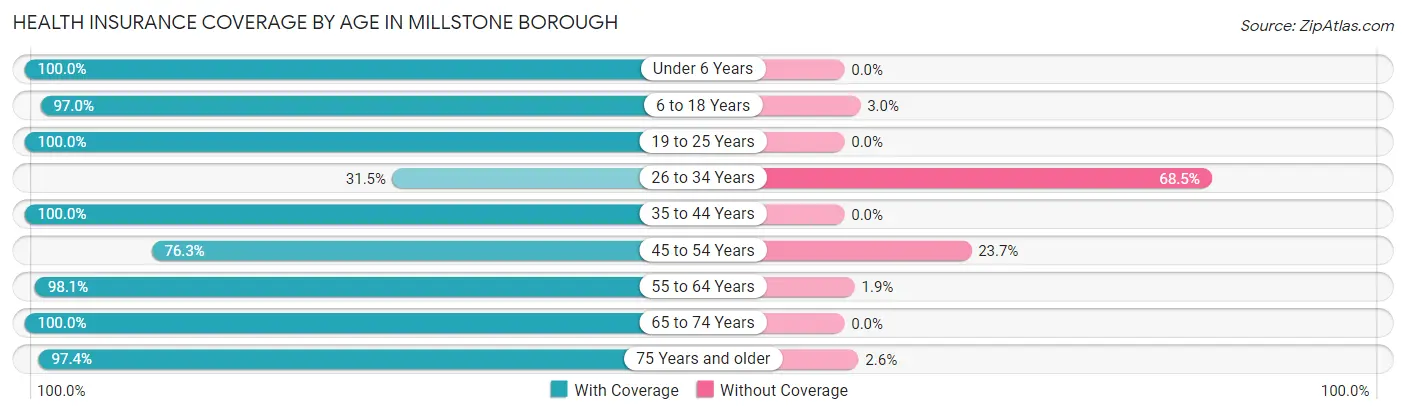
| Age Bracket | With Coverage | Without Coverage |
| Under 6 Years | 15 (100.0%) | 0 (0.0%) |
| 6 to 18 Years | 98 (97.0%) | 3 (3.0%) |
| 19 to 25 Years | 75 (100.0%) | 0 (0.0%) |
| 26 to 34 Years | 23 (31.5%) | 50 (68.5%) |
| 35 to 44 Years | 59 (100.0%) | 0 (0.0%) |
| 45 to 54 Years | 100 (76.3%) | 31 (23.7%) |
| 55 to 64 Years | 51 (98.1%) | 1 (1.9%) |
| 65 to 74 Years | 40 (100.0%) | 0 (0.0%) |
| 75 Years and older | 37 (97.4%) | 1 (2.6%) |
| Total | 498 (85.3%) | 86 (14.7%) |
Health Insurance Coverage by Citizenship Status in Millstone borough
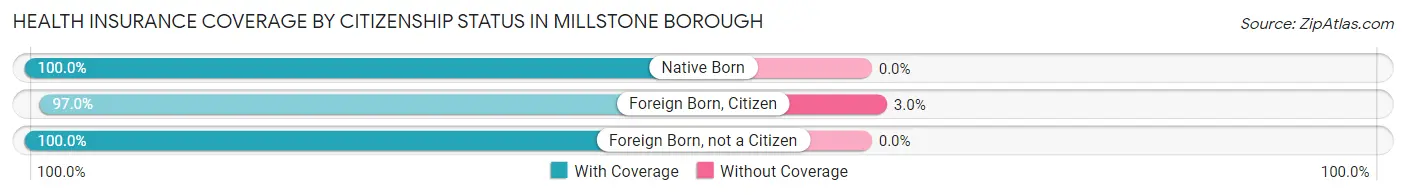
| Citizenship Status | With Coverage | Without Coverage |
| Native Born | 15 (100.0%) | 0 (0.0%) |
| Foreign Born, Citizen | 98 (97.0%) | 3 (3.0%) |
| Foreign Born, not a Citizen | 75 (100.0%) | 0 (0.0%) |
Health Insurance Coverage by Household Income in Millstone borough
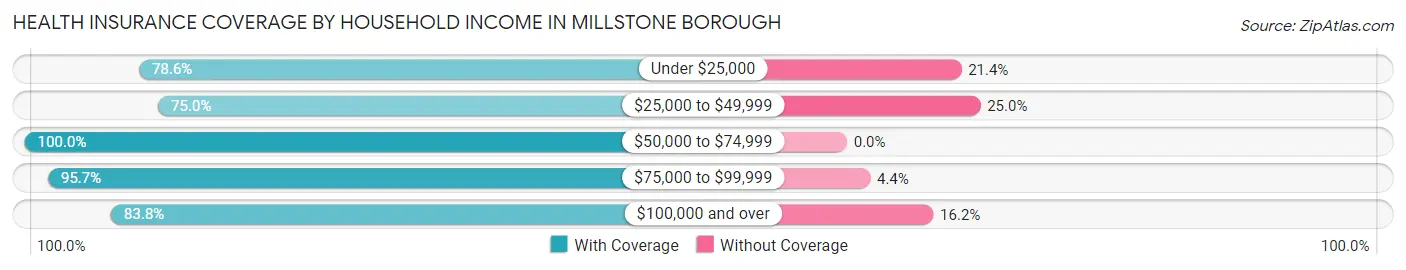
| Household Income | With Coverage | Without Coverage |
| Under $25,000 | 11 (78.6%) | 3 (21.4%) |
| $25,000 to $49,999 | 6 (75.0%) | 2 (25.0%) |
| $50,000 to $74,999 | 20 (100.0%) | 0 (0.0%) |
| $75,000 to $99,999 | 44 (95.7%) | 2 (4.3%) |
| $100,000 and over | 404 (83.8%) | 78 (16.2%) |
Public vs Private Health Insurance Coverage by Age in Millstone borough
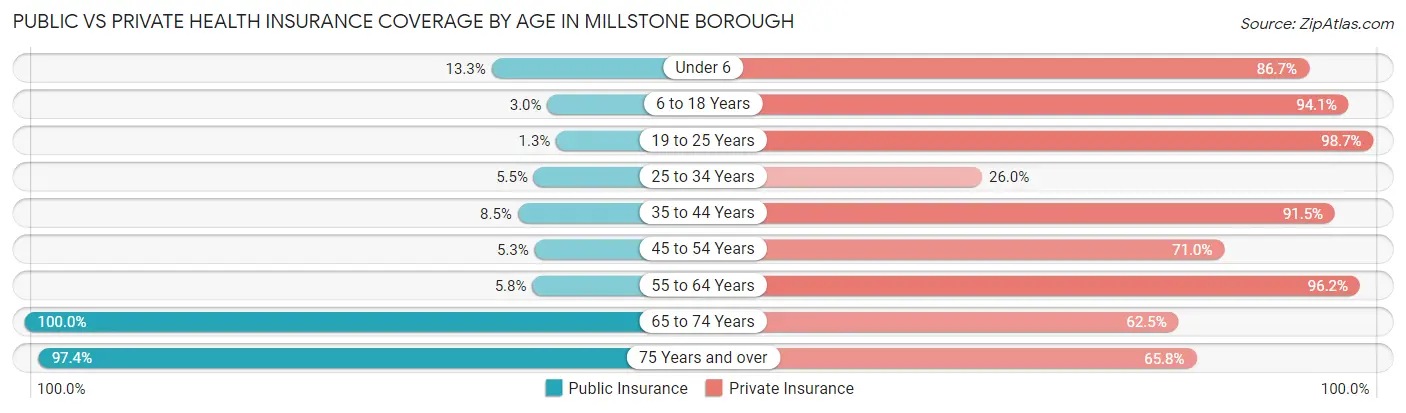
| Age Bracket | Public Insurance | Private Insurance |
| Under 6 | 2 (13.3%) | 13 (86.7%) |
| 6 to 18 Years | 3 (3.0%) | 95 (94.1%) |
| 19 to 25 Years | 1 (1.3%) | 74 (98.7%) |
| 25 to 34 Years | 4 (5.5%) | 19 (26.0%) |
| 35 to 44 Years | 5 (8.5%) | 54 (91.5%) |
| 45 to 54 Years | 7 (5.3%) | 93 (71.0%) |
| 55 to 64 Years | 3 (5.8%) | 50 (96.2%) |
| 65 to 74 Years | 40 (100.0%) | 25 (62.5%) |
| 75 Years and over | 37 (97.4%) | 25 (65.8%) |
| Total | 102 (17.5%) | 448 (76.7%) |
Disability Status by Sex by Age in Millstone borough
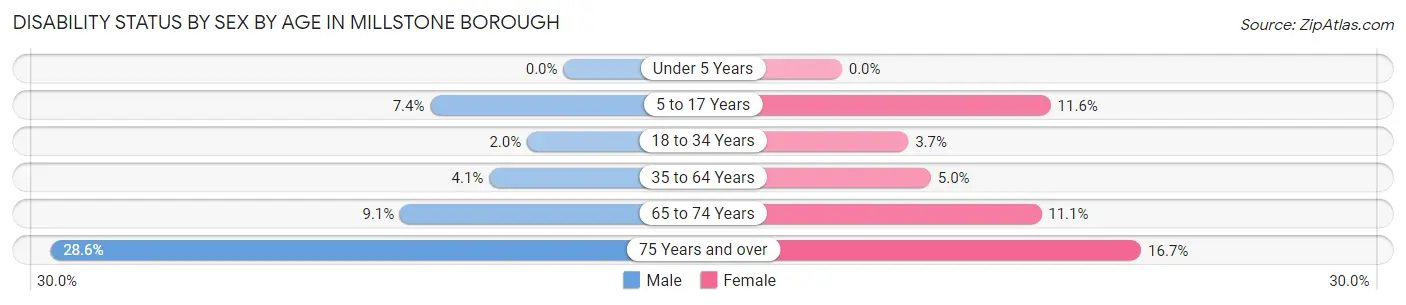
| Age Bracket | Male | Female |
| Under 5 Years | 0 (0.0%) | 0 (0.0%) |
| 5 to 17 Years | 4 (7.4%) | 5 (11.6%) |
| 18 to 34 Years | 2 (2.0%) | 2 (3.7%) |
| 35 to 64 Years | 5 (4.1%) | 6 (5.0%) |
| 65 to 74 Years | 2 (9.1%) | 2 (11.1%) |
| 75 Years and over | 4 (28.6%) | 4 (16.7%) |
Disability Class by Sex by Age in Millstone borough
Disability Class: Hearing Difficulty
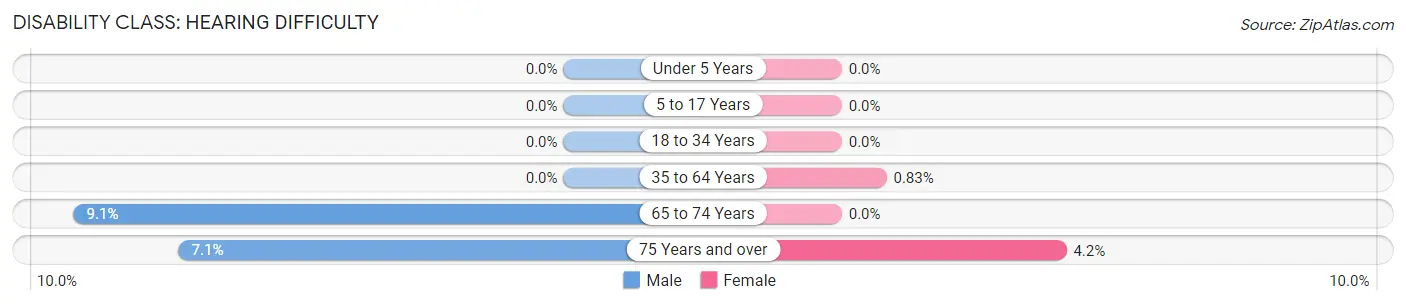
| Age Bracket | Male | Female |
| Under 5 Years | 0 (0.0%) | 0 (0.0%) |
| 5 to 17 Years | 0 (0.0%) | 0 (0.0%) |
| 18 to 34 Years | 0 (0.0%) | 0 (0.0%) |
| 35 to 64 Years | 0 (0.0%) | 1 (0.8%) |
| 65 to 74 Years | 2 (9.1%) | 0 (0.0%) |
| 75 Years and over | 1 (7.1%) | 1 (4.2%) |
Disability Class: Vision Difficulty
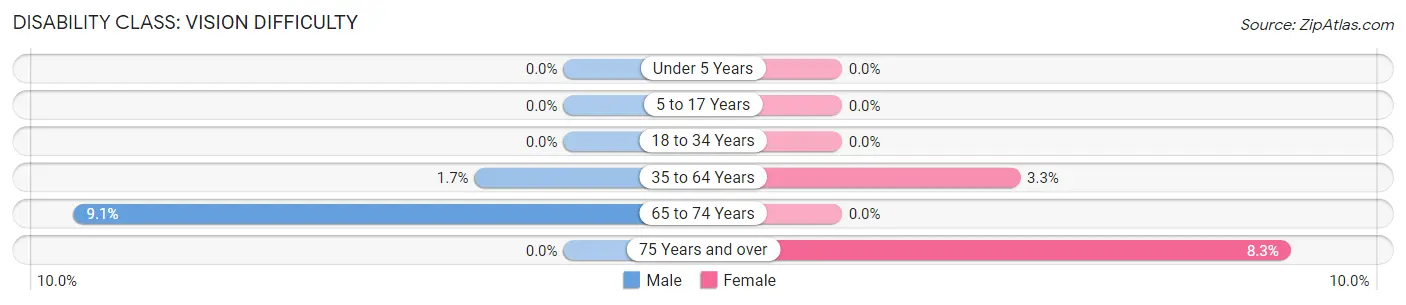
| Age Bracket | Male | Female |
| Under 5 Years | 0 (0.0%) | 0 (0.0%) |
| 5 to 17 Years | 0 (0.0%) | 0 (0.0%) |
| 18 to 34 Years | 0 (0.0%) | 0 (0.0%) |
| 35 to 64 Years | 2 (1.7%) | 4 (3.3%) |
| 65 to 74 Years | 2 (9.1%) | 0 (0.0%) |
| 75 Years and over | 0 (0.0%) | 2 (8.3%) |
Disability Class: Cognitive Difficulty
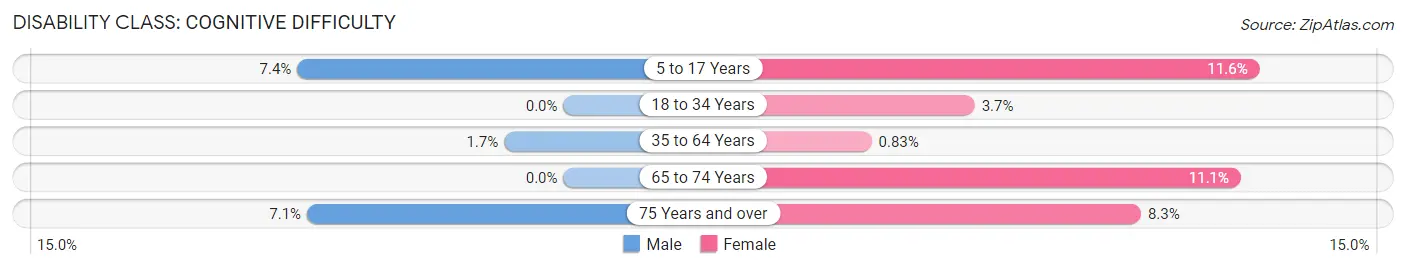
| Age Bracket | Male | Female |
| 5 to 17 Years | 4 (7.4%) | 5 (11.6%) |
| 18 to 34 Years | 0 (0.0%) | 2 (3.7%) |
| 35 to 64 Years | 2 (1.7%) | 1 (0.8%) |
| 65 to 74 Years | 0 (0.0%) | 2 (11.1%) |
| 75 Years and over | 1 (7.1%) | 2 (8.3%) |
Disability Class: Ambulatory Difficulty
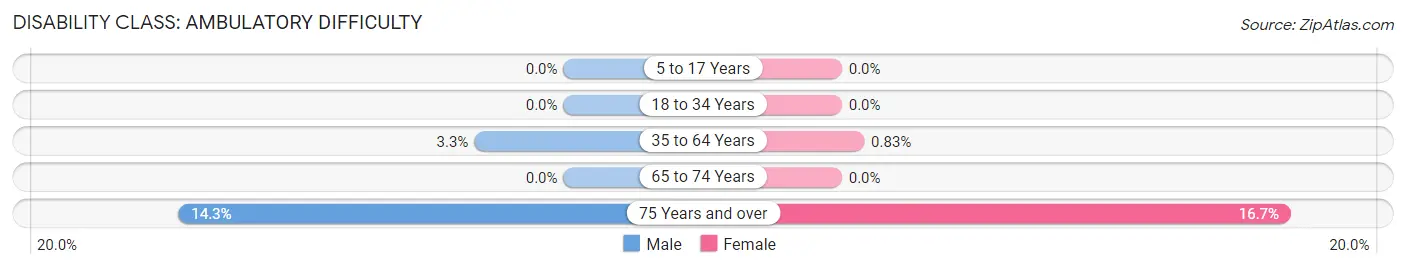
| Age Bracket | Male | Female |
| 5 to 17 Years | 0 (0.0%) | 0 (0.0%) |
| 18 to 34 Years | 0 (0.0%) | 0 (0.0%) |
| 35 to 64 Years | 4 (3.3%) | 1 (0.8%) |
| 65 to 74 Years | 0 (0.0%) | 0 (0.0%) |
| 75 Years and over | 2 (14.3%) | 4 (16.7%) |
Disability Class: Self-Care Difficulty
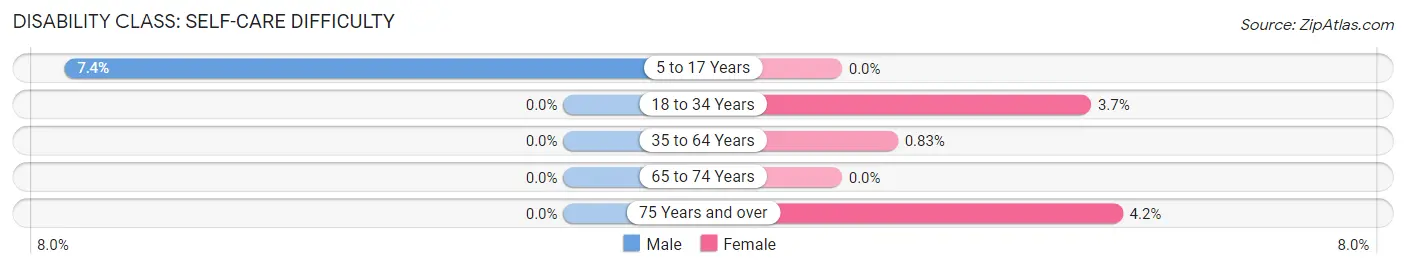
| Age Bracket | Male | Female |
| 5 to 17 Years | 4 (7.4%) | 0 (0.0%) |
| 18 to 34 Years | 0 (0.0%) | 2 (3.7%) |
| 35 to 64 Years | 0 (0.0%) | 1 (0.8%) |
| 65 to 74 Years | 0 (0.0%) | 0 (0.0%) |
| 75 Years and over | 0 (0.0%) | 1 (4.2%) |
Technology Access in Millstone borough
Computing Device Access in Millstone borough
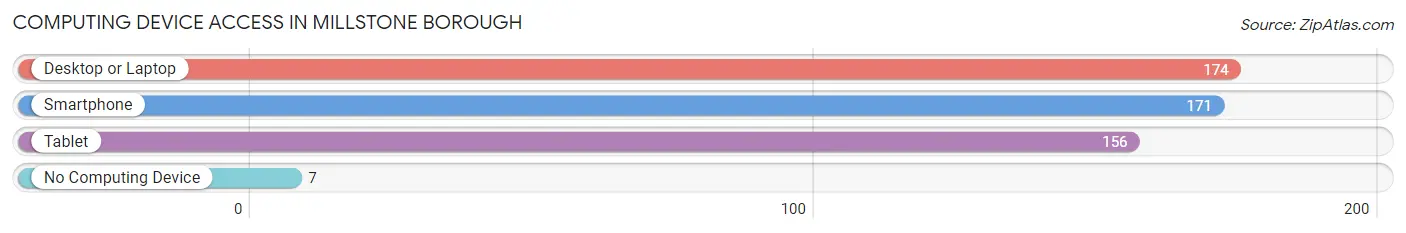
| Device Type | # Households | % Households |
| Desktop or Laptop | 174 | 94.6% |
| Smartphone | 171 | 92.9% |
| Tablet | 156 | 84.8% |
| No Computing Device | 7 | 3.8% |
| Total | 184 | 100.0% |
Internet Access in Millstone borough
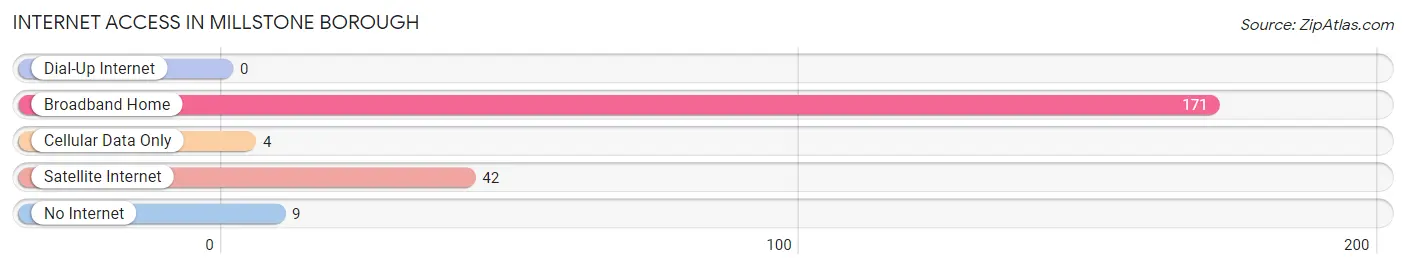
| Internet Type | # Households | % Households |
| Dial-Up Internet | 0 | 0.0% |
| Broadband Home | 171 | 92.9% |
| Cellular Data Only | 4 | 2.2% |
| Satellite Internet | 42 | 22.8% |
| No Internet | 9 | 4.9% |
| Total | 184 | 100.0% |
Millstone borough Summary
Millstone Borough is a small borough located in Monmouth County, New Jersey. It is situated in the northern part of the county, and is bordered by Manalapan Township to the north, Freehold Township to the east, and Upper Freehold Township to the south and west. The borough is home to a population of approximately 1,400 people, and covers an area of just over one square mile.
History
Millstone Borough was originally part of Freehold Township, and was incorporated as a borough in 1894. The borough was named after the Millstone River, which runs through the area. The river was named for the numerous millstones that were found along its banks.
The area was first settled in the late 17th century by Dutch and English settlers. The area was primarily agricultural, and the main crops grown were wheat, corn, and potatoes. The area was also known for its iron ore deposits, which were mined and used to make tools and weapons.
In the 19th century, the area began to develop into a small industrial center. The first industry to be established was a paper mill, which was built in 1820. This was followed by a grist mill, a saw mill, and a woolen mill. The area also became known for its brickyards, which produced bricks for the construction of homes and businesses.
Geography
Millstone Borough is located in northern Monmouth County, and is bordered by Manalapan Township to the north, Freehold Township to the east, and Upper Freehold Township to the south and west. The borough covers an area of just over one square mile, and is located approximately 25 miles south of New York City.
The borough is situated in the Raritan Valley, and is surrounded by rolling hills and woodlands. The Millstone River runs through the borough, and is a popular spot for fishing and canoeing. The borough is also home to several parks, including the Millstone Borough Park, which features a playground, picnic area, and walking trails.
Economy
The economy of Millstone Borough is primarily based on agriculture and manufacturing. The area is home to several farms, which produce a variety of crops, including wheat, corn, and potatoes. The borough is also home to several manufacturing companies, which produce a variety of products, including paper, textiles, and metal products.
The borough is also home to several small businesses, including restaurants, retail stores, and professional services. The borough is also home to several small industrial parks, which are home to a variety of businesses, including light manufacturing, warehousing, and distribution.
Demographics
As of the 2010 census, the population of Millstone Borough was 1,400. The racial makeup of the borough was 94.3% White, 2.3% African American, 0.7% Asian, 0.3% Native American, and 2.4% from other races. Hispanic or Latino of any race were 5.3% of the population.
The median household income in the borough was $76,250, and the median family income was $87,500. The per capita income was $35,000. About 4.3% of families and 5.7% of the population were below the poverty line.
Millstone Borough is a small borough with a rich history and a diverse economy. The borough is home to a variety of businesses, and is a popular spot for fishing and canoeing. The borough is also home to several parks, which provide residents with a variety of recreational activities. The borough is a great place to live, work, and play.
Common Questions
What is Per Capita Income in Millstone borough?
Per Capita income in Millstone borough is $45,353.
What is the Median Family Income in Millstone borough?
Median Family Income in Millstone borough is $134,554.
What is the Median Household income in Millstone borough?
Median Household Income in Millstone borough is $133,929.
What is Inequality or Gini Index in Millstone borough?
Inequality or Gini Index in Millstone borough is 0.28.
What is the Total Population of Millstone borough?
Total Population of Millstone borough is 584.
What is the Total Male Population of Millstone borough?
Total Male Population of Millstone borough is 317.
What is the Total Female Population of Millstone borough?
Total Female Population of Millstone borough is 267.
What is the Ratio of Males per 100 Females in Millstone borough?
There are 118.73 Males per 100 Females in Millstone borough.
What is the Ratio of Females per 100 Males in Millstone borough?
There are 84.23 Females per 100 Males in Millstone borough.
What is the Median Population Age in Millstone borough?
Median Population Age in Millstone borough is 40.4 Years.
What is the Average Family Size in Millstone borough
Average Family Size in Millstone borough is 3.5 People.
What is the Average Household Size in Millstone borough
Average Household Size in Millstone borough is 3.1 People.
How Large is the Labor Force in Millstone borough?
There are 374 People in the Labor Forcein in Millstone borough.
What is the Percentage of People in the Labor Force in Millstone borough?
76.3% of People are in the Labor Force in Millstone borough.
What is the Unemployment Rate in Millstone borough?
Unemployment Rate in Millstone borough is 4.5%.