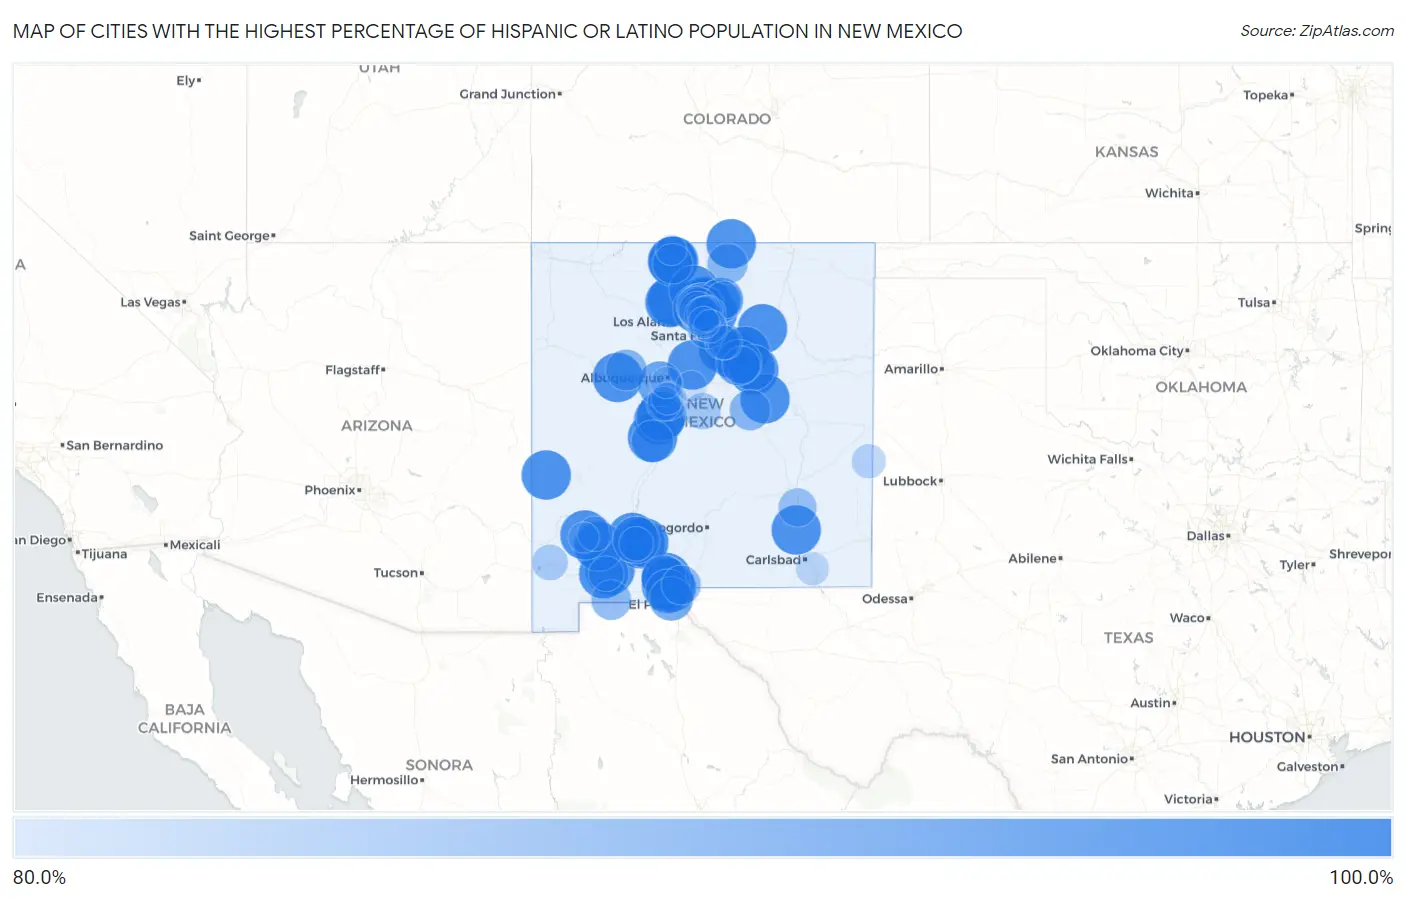
Cities with the Highest Percentage of Hispanic or Latino Population in New Mexico
RELATED REPORTS & OPTIONS
Hispanic or Latino
New Mexico
Compare Cities
Map of Cities with the Highest Percentage of Hispanic or Latino Population in New Mexico
0.0%
100.0%
Cities with the Highest Percentage of Hispanic or Latino Population in New Mexico
| City | Hispanic or Latino | vs State | vs National | |
| 1. | Berino | 100.0% | 49.8%(+50.2)#1 | 18.7%(+81.3)#90 |
| 2. | Chamberino | 100.0% | 49.8%(+50.2)#2 | 18.7%(+81.3)#153 |
| 3. | Mesquite | 100.0% | 49.8%(+50.2)#3 | 18.7%(+81.3)#167 |
| 4. | Canova | 100.0% | 49.8%(+50.2)#4 | 18.7%(+81.3)#172 |
| 5. | Rowe | 100.0% | 49.8%(+50.2)#5 | 18.7%(+81.3)#174 |
| 6. | Morningside | 100.0% | 49.8%(+50.2)#6 | 18.7%(+81.3)#175 |
| 7. | Placitas Cdp Dona Ana County | 100.0% | 49.8%(+50.2)#7 | 18.7%(+81.3)#181 |
| 8. | Pecan Park | 100.0% | 49.8%(+50.2)#8 | 18.7%(+81.3)#186 |
| 9. | Costilla | 100.0% | 49.8%(+50.2)#9 | 18.7%(+81.3)#196 |
| 10. | Rodey | 100.0% | 49.8%(+50.2)#10 | 18.7%(+81.3)#200 |
| 11. | Ensenada | 100.0% | 49.8%(+50.2)#11 | 18.7%(+81.3)#224 |
| 12. | Velarde | 100.0% | 49.8%(+50.2)#12 | 18.7%(+81.3)#226 |
| 13. | Rincon | 100.0% | 49.8%(+50.2)#13 | 18.7%(+81.3)#232 |
| 14. | Soham | 100.0% | 49.8%(+50.2)#14 | 18.7%(+81.3)#241 |
| 15. | Rio Chiquito | 100.0% | 49.8%(+50.2)#15 | 18.7%(+81.3)#248 |
| 16. | Anton Chico | 100.0% | 49.8%(+50.2)#16 | 18.7%(+81.3)#258 |
| 17. | Cordova | 100.0% | 49.8%(+50.2)#17 | 18.7%(+81.3)#263 |
| 18. | Medanales | 100.0% | 49.8%(+50.2)#18 | 18.7%(+81.3)#267 |
| 19. | Abeytas | 100.0% | 49.8%(+50.2)#19 | 18.7%(+81.3)#271 |
| 20. | Lyden | 100.0% | 49.8%(+50.2)#20 | 18.7%(+81.3)#298 |
| 21. | Pulpotio Bareas | 100.0% | 49.8%(+50.2)#21 | 18.7%(+81.3)#299 |
| 22. | Canones | 100.0% | 49.8%(+50.2)#22 | 18.7%(+81.3)#309 |
| 23. | Garfield | 100.0% | 49.8%(+50.2)#23 | 18.7%(+81.3)#315 |
| 24. | Cubero | 100.0% | 49.8%(+50.2)#24 | 18.7%(+81.3)#317 |
| 25. | Watrous | 100.0% | 49.8%(+50.2)#25 | 18.7%(+81.3)#331 |
| 26. | Youngsville | 100.0% | 49.8%(+50.2)#26 | 18.7%(+81.3)#338 |
| 27. | Chamizal | 100.0% | 49.8%(+50.2)#27 | 18.7%(+81.3)#342 |
| 28. | Rivers | 100.0% | 49.8%(+50.2)#28 | 18.7%(+81.3)#352 |
| 29. | Faywood | 100.0% | 49.8%(+50.2)#29 | 18.7%(+81.3)#353 |
| 30. | Cobre | 100.0% | 49.8%(+50.2)#31 | 18.7%(+81.3)#356 |
| 31. | Coyote | 100.0% | 49.8%(+50.2)#32 | 18.7%(+81.3)#357 |
| 32. | Veguita | 100.0% | 49.8%(+50.2)#33 | 18.7%(+81.3)#358 |
| 33. | Tecolote | 100.0% | 49.8%(+50.2)#34 | 18.7%(+81.3)#368 |
| 34. | Golden | 100.0% | 49.8%(+50.2)#35 | 18.7%(+81.3)#369 |
| 35. | Los Ojos | 100.0% | 49.8%(+50.2)#36 | 18.7%(+81.3)#372 |
| 36. | La Bajada | 100.0% | 49.8%(+50.2)#37 | 18.7%(+81.3)#375 |
| 37. | Pastura | 100.0% | 49.8%(+50.2)#38 | 18.7%(+81.3)#390 |
| 38. | El Rito | 99.8% | 49.8%(+50.0)#39 | 18.7%(+81.1)#408 |
| 39. | Anthony | 99.8% | 49.8%(+50.0)#40 | 18.7%(+81.1)#409 |
| 40. | El Duende | 99.6% | 49.8%(+49.9)#41 | 18.7%(+81.0)#417 |
| 41. | Alcalde | 98.7% | 49.8%(+48.9)#42 | 18.7%(+80.1)#489 |
| 42. | La Mesa | 97.5% | 49.8%(+47.8)#43 | 18.7%(+78.9)#556 |
| 43. | Salem | 97.3% | 49.8%(+47.5)#44 | 18.7%(+78.6)#566 |
| 44. | Tecolotito | 96.4% | 49.8%(+46.6)#45 | 18.7%(+77.7)#598 |
| 45. | Sena | 96.2% | 49.8%(+46.4)#46 | 18.7%(+77.6)#606 |
| 46. | Dona Ana | 95.8% | 49.8%(+46.0)#47 | 18.7%(+77.1)#620 |
| 47. | Cuartelez | 95.6% | 49.8%(+45.8)#48 | 18.7%(+77.0)#623 |
| 48. | Pajarito Mesa | 95.6% | 49.8%(+45.8)#49 | 18.7%(+76.9)#624 |
| 49. | Vado | 95.1% | 49.8%(+45.3)#50 | 18.7%(+76.4)#645 |
| 50. | San Miguel | 94.9% | 49.8%(+45.2)#51 | 18.7%(+76.3)#651 |
| 51. | Rio Lucio | 94.8% | 49.8%(+45.1)#52 | 18.7%(+76.2)#655 |
| 52. | Los Luceros | 94.7% | 49.8%(+44.9)#53 | 18.7%(+76.0)#661 |
| 53. | La Union | 94.4% | 49.8%(+44.6)#54 | 18.7%(+75.7)#672 |
| 54. | Sunland Park | 94.3% | 49.8%(+44.5)#55 | 18.7%(+75.7)#673 |
| 55. | Chamisal | 93.9% | 49.8%(+44.1)#56 | 18.7%(+75.2)#688 |
| 56. | San Jose Cdp Rio Arriba County | 93.0% | 49.8%(+43.2)#57 | 18.7%(+74.4)#707 |
| 57. | La Villita | 92.6% | 49.8%(+42.8)#58 | 18.7%(+73.9)#719 |
| 58. | Lemitar | 92.5% | 49.8%(+42.7)#59 | 18.7%(+73.8)#721 |
| 59. | Chamita | 91.9% | 49.8%(+42.1)#60 | 18.7%(+73.3)#735 |
| 60. | Seboyeta | 91.5% | 49.8%(+41.7)#61 | 18.7%(+72.8)#745 |
| 61. | Santa Cruz | 91.3% | 49.8%(+41.5)#62 | 18.7%(+72.7)#748 |
| 62. | Vaughn | 91.1% | 49.8%(+41.3)#63 | 18.7%(+72.5)#752 |
| 63. | Questa | 90.7% | 49.8%(+40.9)#64 | 18.7%(+72.1)#758 |
| 64. | Tierra Amarilla | 90.4% | 49.8%(+40.6)#65 | 18.7%(+71.7)#767 |
| 65. | Columbus | 90.3% | 49.8%(+40.5)#66 | 18.7%(+71.7)#769 |
| 66. | Chili | 90.0% | 49.8%(+40.2)#67 | 18.7%(+71.3)#775 |
| 67. | Tortugas | 90.0% | 49.8%(+40.2)#68 | 18.7%(+71.3)#777 |
| 68. | Peak Place | 89.9% | 49.8%(+40.1)#69 | 18.7%(+71.2)#781 |
| 69. | Valle Vista | 89.8% | 49.8%(+40.0)#70 | 18.7%(+71.2)#782 |
| 70. | Chaparral | 89.7% | 49.8%(+40.0)#71 | 18.7%(+71.1)#784 |
| 71. | Monterey Park | 89.2% | 49.8%(+39.4)#72 | 18.7%(+70.6)#801 |
| 72. | Penasco | 88.8% | 49.8%(+39.1)#73 | 18.7%(+70.2)#812 |
| 73. | Dexter | 88.8% | 49.8%(+39.0)#74 | 18.7%(+70.1)#814 |
| 74. | Villanueva | 88.0% | 49.8%(+38.2)#75 | 18.7%(+69.3)#833 |
| 75. | Vadito | 87.8% | 49.8%(+38.1)#76 | 18.7%(+69.2)#836 |
| 76. | Hernandez | 87.3% | 49.8%(+37.5)#77 | 18.7%(+68.6)#845 |
| 77. | Willard | 86.9% | 49.8%(+37.2)#78 | 18.7%(+68.3)#850 |
| 78. | Chimayo | 86.9% | 49.8%(+37.1)#79 | 18.7%(+68.2)#853 |
| 79. | Sombrillo | 86.7% | 49.8%(+36.9)#80 | 18.7%(+68.0)#858 |
| 80. | Glen Acres | 86.3% | 49.8%(+36.5)#81 | 18.7%(+67.6)#862 |
| 81. | La Puebla | 86.0% | 49.8%(+36.2)#82 | 18.7%(+67.4)#871 |
| 82. | La Hacienda | 85.5% | 49.8%(+35.7)#83 | 18.7%(+66.9)#882 |
| 83. | San Lorenzo | 85.4% | 49.8%(+35.6)#84 | 18.7%(+66.7)#885 |
| 84. | Canada De Los Alamos | 85.3% | 49.8%(+35.5)#85 | 18.7%(+66.6)#887 |
| 85. | Pena Blanca | 85.0% | 49.8%(+35.2)#86 | 18.7%(+66.4)#891 |
| 86. | Pecos | 85.0% | 49.8%(+35.2)#87 | 18.7%(+66.3)#893 |
| 87. | Espanola | 84.8% | 49.8%(+35.0)#88 | 18.7%(+66.2)#898 |
| 88. | Causey | 84.7% | 49.8%(+34.9)#89 | 18.7%(+66.1)#901 |
| 89. | Adelino | 84.7% | 49.8%(+34.9)#90 | 18.7%(+66.0)#903 |
| 90. | East Pecos | 84.6% | 49.8%(+34.8)#91 | 18.7%(+65.9)#905 |
| 91. | Hatch | 84.4% | 49.8%(+34.6)#92 | 18.7%(+65.7)#907 |
| 92. | Loving | 83.7% | 49.8%(+33.9)#93 | 18.7%(+65.0)#924 |
| 93. | Rio En Medio | 83.2% | 49.8%(+33.4)#94 | 18.7%(+64.5)#934 |
| 94. | Ojo Sarco | 82.9% | 49.8%(+33.1)#95 | 18.7%(+64.3)#941 |
| 95. | El Cerro Mission | 82.3% | 49.8%(+32.5)#96 | 18.7%(+63.6)#956 |
| 96. | Cuyamungue | 82.0% | 49.8%(+32.2)#97 | 18.7%(+63.4)#963 |
| 97. | South Valley | 81.9% | 49.8%(+32.1)#98 | 18.7%(+63.2)#967 |
| 98. | Manzano Springs | 81.6% | 49.8%(+31.9)#99 | 18.7%(+63.0)#972 |
| 99. | Bayard | 81.0% | 49.8%(+31.2)#100 | 18.7%(+62.3)#986 |
| 100. | Chama | 80.9% | 49.8%(+31.1)#101 | 18.7%(+62.2)#989 |
Common Questions
What are the Top 10 Cities with the Highest Percentage of Hispanic or Latino Population in New Mexico?
Top 10 Cities with the Highest Percentage of Hispanic or Latino Population in New Mexico are:
#1
100.0%
#2
100.0%
#3
100.0%
#4
100.0%
#5
100.0%
#6
100.0%
#7
100.0%
#8
100.0%
#9
100.0%
#10
100.0%
What city has the Highest Percentage of Hispanic or Latino Population in New Mexico?
Berino has the Highest Percentage of Hispanic or Latino Population in New Mexico with 100.0%.
What is the Percentage of Hispanic or Latino Population in the State of New Mexico?
Percentage of Hispanic or Latino Population in New Mexico is 49.8%.
What is the Percentage of Hispanic or Latino Population in the United States?
Percentage of Hispanic or Latino Population in the United States is 18.7%.