East Newark borough, NJ Map & Demographics
East Newark borough Overview
$27,315
PER CAPITA INCOME
$53,750
AVG FAMILY INCOME
$63,594
AVG HOUSEHOLD INCOME
54.5%
WAGE / INCOME GAP [ % ]
45.5¢/ $1
WAGE / INCOME GAP [ $ ]
$7,375
FAMILY INCOME DEFICIT
0.51
INEQUALITY / GINI INDEX
2,718
TOTAL POPULATION
1,243
MALE POPULATION
1,475
FEMALE POPULATION
84.27
MALES / 100 FEMALES
118.66
FEMALES / 100 MALES
39.3
MEDIAN AGE
3.0
AVG FAMILY SIZE
3.2
AVG HOUSEHOLD SIZE
1,504
LABOR FORCE [ PEOPLE ]
67.7%
PERCENT IN LABOR FORCE
8.2%
UNEMPLOYMENT RATE
Income in East Newark borough
Income Overview in East Newark borough
Per Capita Income in East Newark borough is $27,315, while median incomes of families and households are $53,750 and $63,594 respectively.
| Characteristic | Number | Measure |
| Per Capita Income | 2,718 | $27,315 |
| Median Family Income | 674 | $53,750 |
| Mean Family Income | 674 | $81,561 |
| Median Household Income | 846 | $63,594 |
| Mean Household Income | 846 | $89,832 |
| Income Deficit | 674 | $7,375 |
| Wage / Income Gap (%) | 2,718 | 54.50% |
| Wage / Income Gap ($) | 2,718 | 45.50¢ per $1 |
| Gini / Inequality Index | 2,718 | 0.51 |
Earnings by Sex in East Newark borough
Average Earnings in East Newark borough are $26,500, $39,894 for men and $18,150 for women, a difference of 54.5%.
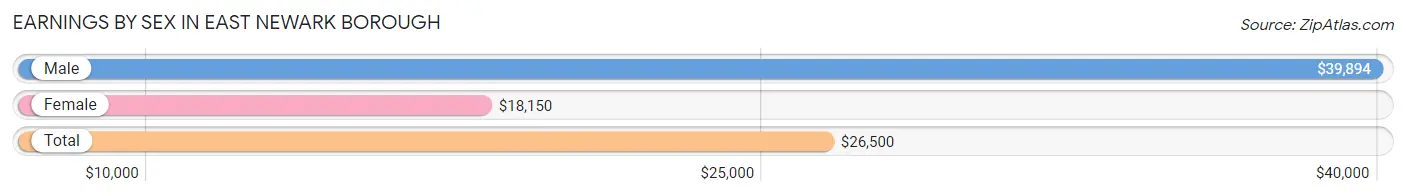
| Sex | Number | Average Earnings |
| Male | 682 (43.6%) | $39,894 |
| Female | 882 (56.4%) | $18,150 |
| Total | 1,564 (100.0%) | $26,500 |
Earnings by Sex by Income Bracket in East Newark borough
The most common earnings brackets in East Newark borough are $25,000 to $29,999 for men (134 | 19.7%) and $17,500 to $19,999 for women (127 | 14.4%).
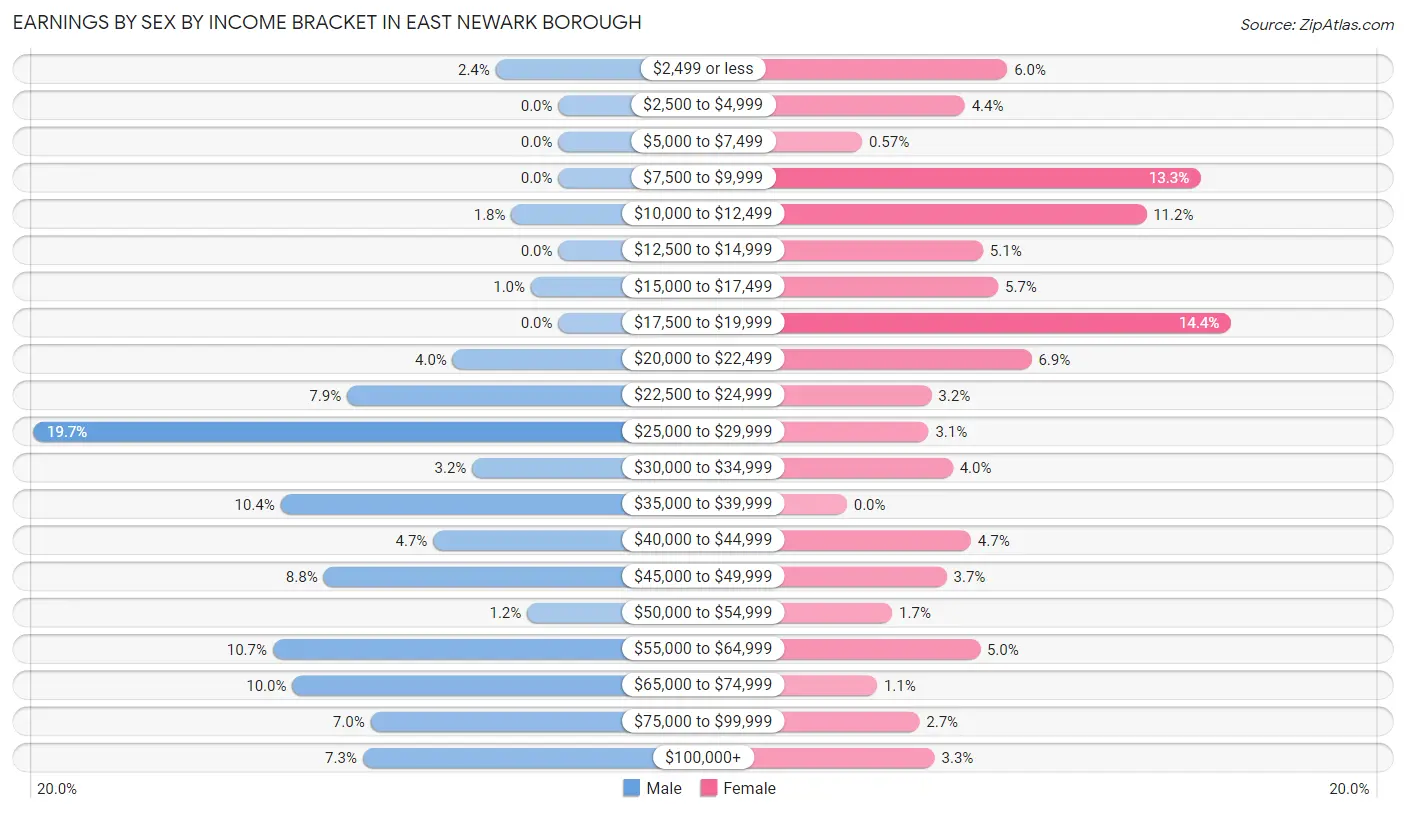
| Income | Male | Female |
| $2,499 or less | 16 (2.4%) | 53 (6.0%) |
| $2,500 to $4,999 | 0 (0.0%) | 39 (4.4%) |
| $5,000 to $7,499 | 0 (0.0%) | 5 (0.6%) |
| $7,500 to $9,999 | 0 (0.0%) | 117 (13.3%) |
| $10,000 to $12,499 | 12 (1.8%) | 99 (11.2%) |
| $12,500 to $14,999 | 0 (0.0%) | 45 (5.1%) |
| $15,000 to $17,499 | 7 (1.0%) | 50 (5.7%) |
| $17,500 to $19,999 | 0 (0.0%) | 127 (14.4%) |
| $20,000 to $22,499 | 27 (4.0%) | 61 (6.9%) |
| $22,500 to $24,999 | 54 (7.9%) | 28 (3.2%) |
| $25,000 to $29,999 | 134 (19.7%) | 27 (3.1%) |
| $30,000 to $34,999 | 22 (3.2%) | 35 (4.0%) |
| $35,000 to $39,999 | 71 (10.4%) | 0 (0.0%) |
| $40,000 to $44,999 | 32 (4.7%) | 41 (4.6%) |
| $45,000 to $49,999 | 60 (8.8%) | 33 (3.7%) |
| $50,000 to $54,999 | 8 (1.2%) | 15 (1.7%) |
| $55,000 to $64,999 | 73 (10.7%) | 44 (5.0%) |
| $65,000 to $74,999 | 68 (10.0%) | 10 (1.1%) |
| $75,000 to $99,999 | 48 (7.0%) | 24 (2.7%) |
| $100,000+ | 50 (7.3%) | 29 (3.3%) |
| Total | 682 (100.0%) | 882 (100.0%) |
Earnings by Sex by Educational Attainment in East Newark borough
Average earnings in East Newark borough are $43,750 for men and $18,878 for women, a difference of 56.9%. Men with an educational attainment of college or associate's degree enjoy the highest average annual earnings of $71,635, while those with less than high school education earn the least with $26,719. Women with an educational attainment of bachelor's degree earn the most with the average annual earnings of $25,417, while those with less than high school education have the smallest earnings of $16,761.
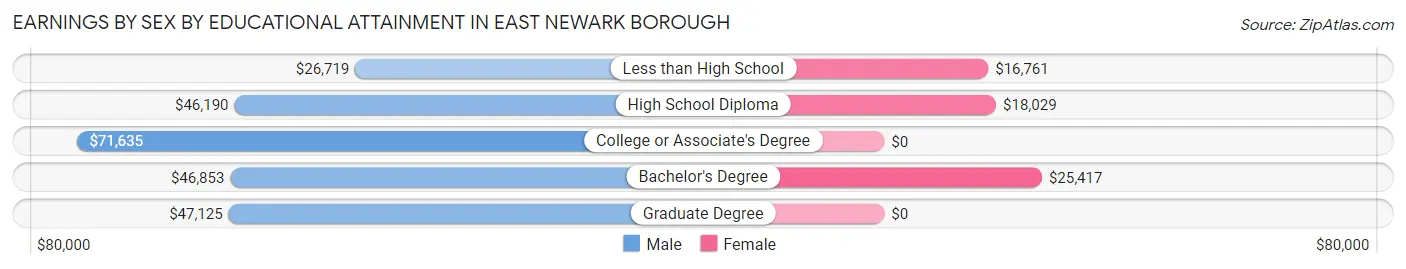
| Educational Attainment | Male Income | Female Income |
| Less than High School | $26,719 | $16,761 |
| High School Diploma | $46,190 | $18,029 |
| College or Associate's Degree | $71,635 | $0 |
| Bachelor's Degree | $46,853 | $25,417 |
| Graduate Degree | $47,125 | $0 |
| Total | $43,750 | $18,878 |
Family Income in East Newark borough
Family Income Brackets in East Newark borough
According to the East Newark borough family income data, there are 140 families falling into the $35,000 to $49,999 income range, which is the most common income bracket and makes up 20.8% of all families. Conversely, the $10,000 to $14,999 income bracket is the least frequent group with only 4 families (0.6%) belonging to this category.
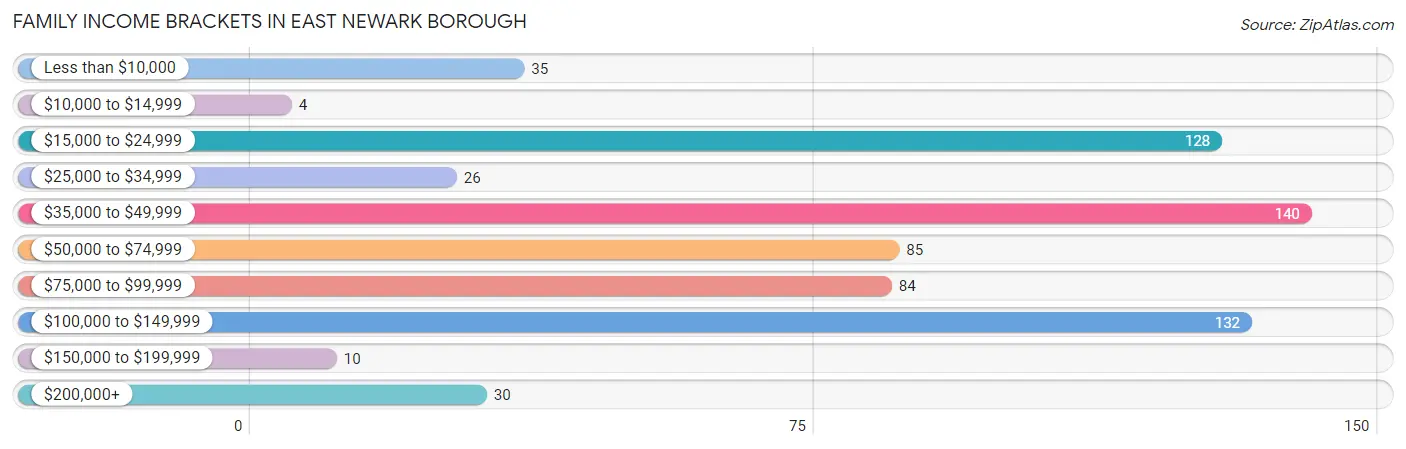
| Income Bracket | # Families | % Families |
| Less than $10,000 | 35 | 5.2% |
| $10,000 to $14,999 | 4 | 0.6% |
| $15,000 to $24,999 | 128 | 19.0% |
| $25,000 to $34,999 | 26 | 3.9% |
| $35,000 to $49,999 | 140 | 20.8% |
| $50,000 to $74,999 | 85 | 12.6% |
| $75,000 to $99,999 | 84 | 12.5% |
| $100,000 to $149,999 | 132 | 19.6% |
| $150,000 to $199,999 | 10 | 1.5% |
| $200,000+ | 30 | 4.5% |
Family Income by Famaliy Size in East Newark borough
5-person families (53 | 7.9%) account for the highest median family income in East Newark borough with $113,224 per family, while 5-person families (53 | 7.9%) have the highest median income of $22,645 per family member.
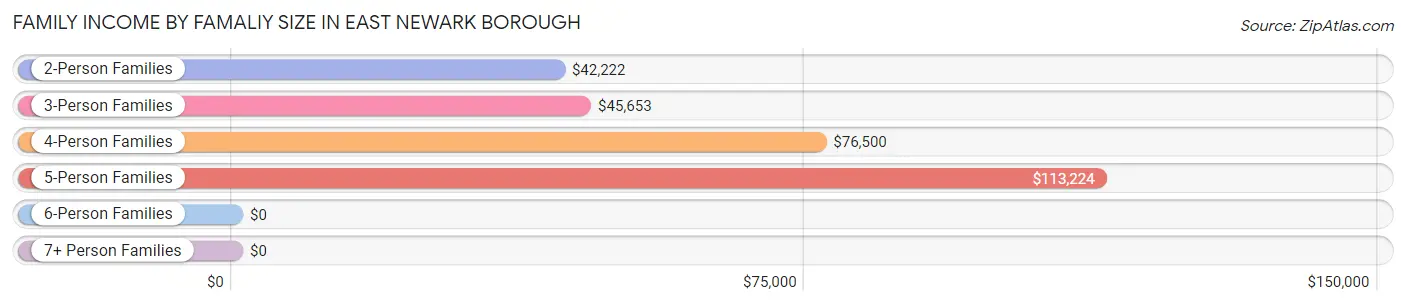
| Income Bracket | # Families | Median Income |
| 2-Person Families | 206 (30.6%) | $42,222 |
| 3-Person Families | 243 (36.0%) | $45,653 |
| 4-Person Families | 162 (24.0%) | $76,500 |
| 5-Person Families | 53 (7.9%) | $113,224 |
| 6-Person Families | 10 (1.5%) | $0 |
| 7+ Person Families | 0 (0.0%) | $0 |
| Total | 674 (100.0%) | $53,750 |
Family Income by Number of Earners in East Newark borough
The median family income in East Newark borough is $53,750, with families comprising 3+ earners (92) having the highest median family income of $112,763, while families with 1 earner (328) have the lowest median family income of $40,139, accounting for 13.7% and 48.7% of families, respectively.
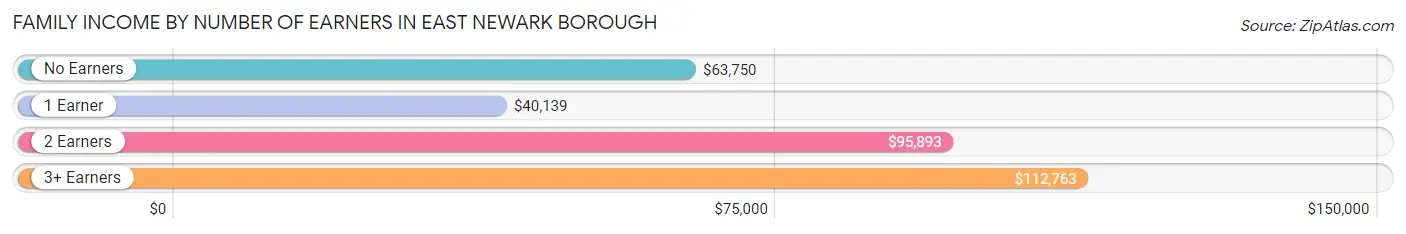
| Number of Earners | # Families | Median Income |
| No Earners | 31 (4.6%) | $63,750 |
| 1 Earner | 328 (48.7%) | $40,139 |
| 2 Earners | 223 (33.1%) | $95,893 |
| 3+ Earners | 92 (13.7%) | $112,763 |
| Total | 674 (100.0%) | $53,750 |
Household Income in East Newark borough
Household Income Brackets in East Newark borough
With 163 households falling in the category, the $100,000 to $149,999 income range is the most frequent in East Newark borough, accounting for 19.3% of all households. In contrast, only 21 households (2.5%) fall into the $10,000 to $14,999 income bracket, making it the least populous group.
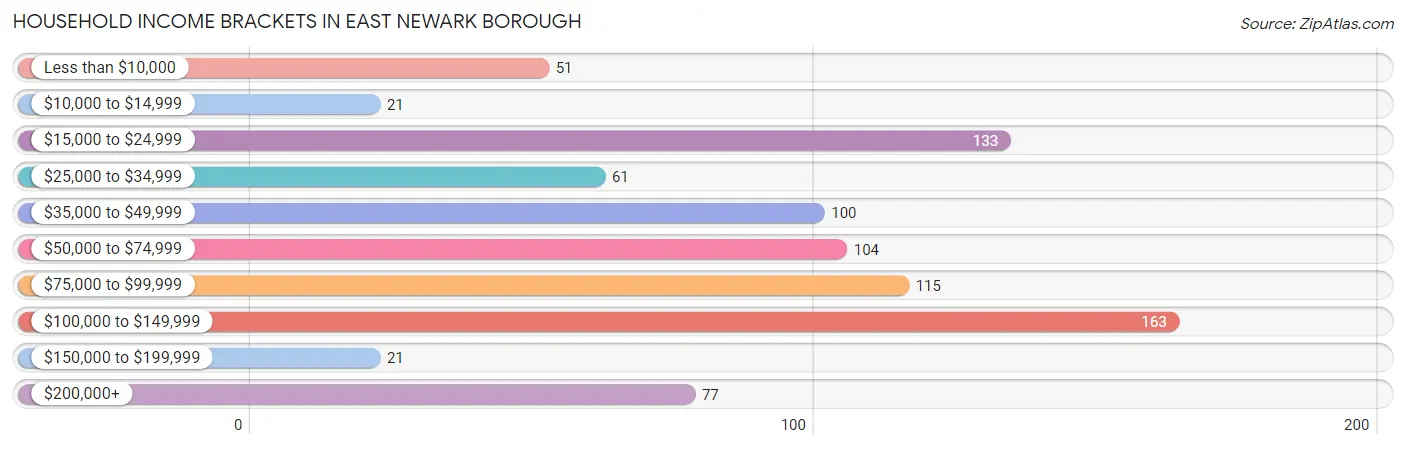
| Income Bracket | # Households | % Households |
| Less than $10,000 | 51 | 6.0% |
| $10,000 to $14,999 | 21 | 2.5% |
| $15,000 to $24,999 | 133 | 15.7% |
| $25,000 to $34,999 | 61 | 7.2% |
| $35,000 to $49,999 | 100 | 11.8% |
| $50,000 to $74,999 | 104 | 12.3% |
| $75,000 to $99,999 | 115 | 13.6% |
| $100,000 to $149,999 | 163 | 19.3% |
| $150,000 to $199,999 | 21 | 2.5% |
| $200,000+ | 77 | 9.1% |
Household Income by Householder Age in East Newark borough
The median household income in East Newark borough is $63,594, with the highest median household income of $85,469 found in the 45 to 64 years age bracket for the primary householder. A total of 478 households (56.5%) fall into this category.
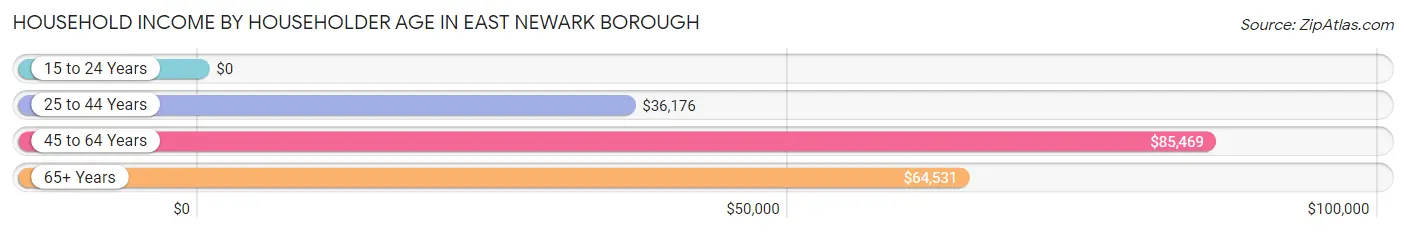
| Income Bracket | # Households | Median Income |
| 15 to 24 Years | 0 (0.0%) | $0 |
| 25 to 44 Years | 238 (28.1%) | $36,176 |
| 45 to 64 Years | 478 (56.5%) | $85,469 |
| 65+ Years | 130 (15.4%) | $64,531 |
| Total | 846 (100.0%) | $63,594 |
Poverty in East Newark borough
Income Below Poverty by Sex and Age in East Newark borough
With 22.6% poverty level for males and 25.9% for females among the residents of East Newark borough, 15 year old males and 12 to 14 year old females are the most vulnerable to poverty, with 29 males (100.0%) and 23 females (59.0%) in their respective age groups living below the poverty level.
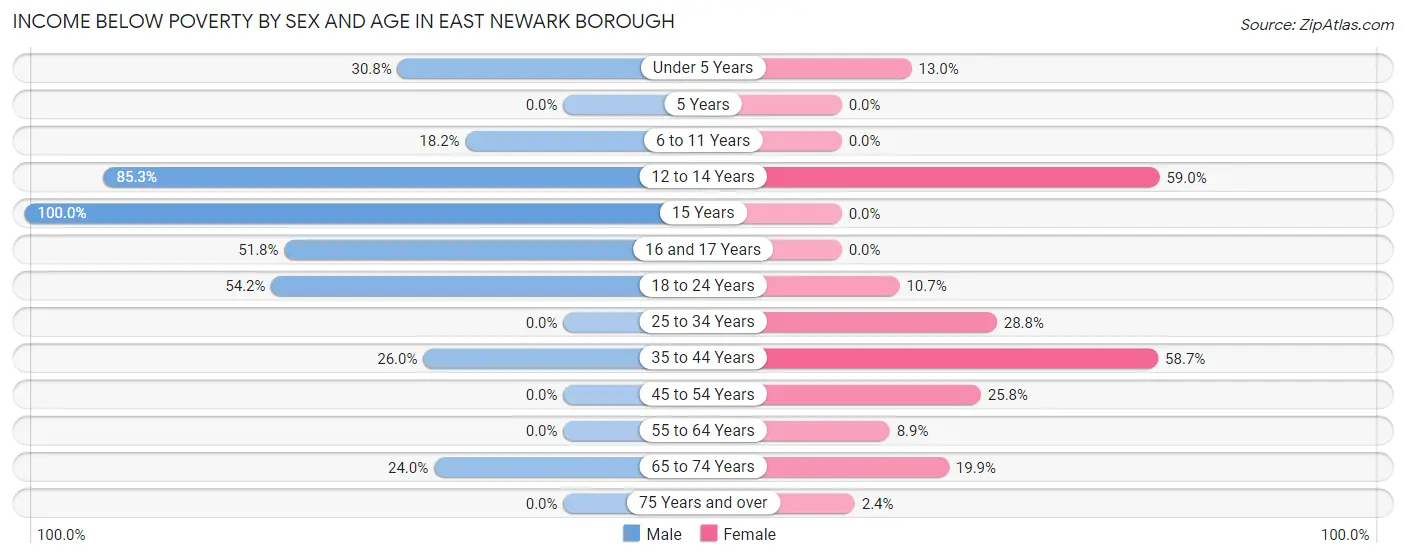
| Age Bracket | Male | Female |
| Under 5 Years | 16 (30.8%) | 7 (13.0%) |
| 5 Years | 0 (0.0%) | 0 (0.0%) |
| 6 to 11 Years | 14 (18.2%) | 0 (0.0%) |
| 12 to 14 Years | 64 (85.3%) | 23 (59.0%) |
| 15 Years | 29 (100.0%) | 0 (0.0%) |
| 16 and 17 Years | 29 (51.8%) | 0 (0.0%) |
| 18 to 24 Years | 71 (54.2%) | 6 (10.7%) |
| 25 to 34 Years | 0 (0.0%) | 42 (28.8%) |
| 35 to 44 Years | 46 (26.0%) | 175 (58.7%) |
| 45 to 54 Years | 0 (0.0%) | 48 (25.8%) |
| 55 to 64 Years | 0 (0.0%) | 24 (8.9%) |
| 65 to 74 Years | 12 (24.0%) | 30 (19.9%) |
| 75 Years and over | 0 (0.0%) | 2 (2.4%) |
| Total | 281 (22.6%) | 357 (25.9%) |
Income Above Poverty by Sex and Age in East Newark borough
According to the poverty statistics in East Newark borough, males aged 5 years and females aged 6 to 11 years are the age groups that are most secure financially, with 100.0% of males and 100.0% of females in these age groups living above the poverty line.
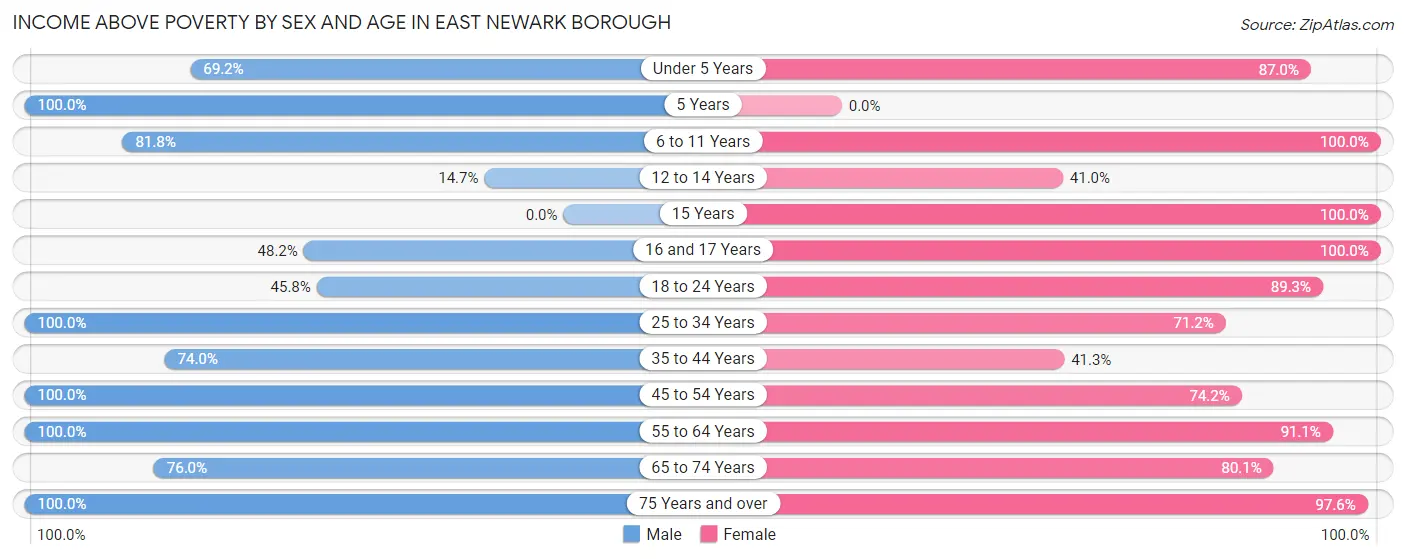
| Age Bracket | Male | Female |
| Under 5 Years | 36 (69.2%) | 47 (87.0%) |
| 5 Years | 40 (100.0%) | 0 (0.0%) |
| 6 to 11 Years | 63 (81.8%) | 14 (100.0%) |
| 12 to 14 Years | 11 (14.7%) | 16 (41.0%) |
| 15 Years | 0 (0.0%) | 18 (100.0%) |
| 16 and 17 Years | 27 (48.2%) | 61 (100.0%) |
| 18 to 24 Years | 60 (45.8%) | 50 (89.3%) |
| 25 to 34 Years | 146 (100.0%) | 104 (71.2%) |
| 35 to 44 Years | 131 (74.0%) | 123 (41.3%) |
| 45 to 54 Years | 194 (100.0%) | 138 (74.2%) |
| 55 to 64 Years | 192 (100.0%) | 246 (91.1%) |
| 65 to 74 Years | 38 (76.0%) | 121 (80.1%) |
| 75 Years and over | 24 (100.0%) | 81 (97.6%) |
| Total | 962 (77.4%) | 1,019 (74.1%) |
Income Below Poverty Among Married-Couple Families in East Newark borough
The poverty statistics for married-couple families in East Newark borough show that 10.8% or 47 of the total 434 families live below the poverty line. Families with 1 or 2 children have the highest poverty rate of 18.4%, comprising of 35 families. On the other hand, families with 3 or 4 children have the lowest poverty rate of 0.0%, which includes 0 families.
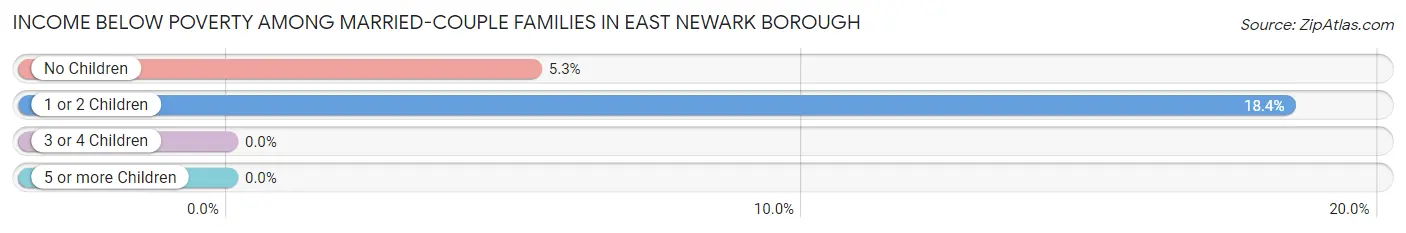
| Children | Above Poverty | Below Poverty |
| No Children | 215 (94.7%) | 12 (5.3%) |
| 1 or 2 Children | 155 (81.6%) | 35 (18.4%) |
| 3 or 4 Children | 17 (100.0%) | 0 (0.0%) |
| 5 or more Children | 0 (0.0%) | 0 (0.0%) |
| Total | 387 (89.2%) | 47 (10.8%) |
Income Below Poverty Among Single-Parent Households in East Newark borough
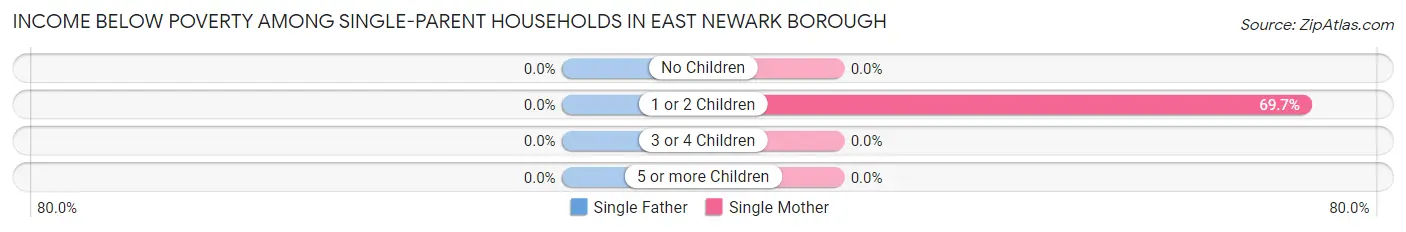
| Children | Single Father | Single Mother |
| No Children | 0 (0.0%) | 0 (0.0%) |
| 1 or 2 Children | 0 (0.0%) | 99 (69.7%) |
| 3 or 4 Children | 0 (0.0%) | 0 (0.0%) |
| 5 or more Children | 0 (0.0%) | 0 (0.0%) |
| Total | 0 (0.0%) | 99 (46.7%) |
Income Below Poverty Among Married-Couple vs Single-Parent Households in East Newark borough
The poverty data for East Newark borough shows that 47 of the married-couple family households (10.8%) and 99 of the single-parent households (41.2%) are living below the poverty level. Within the married-couple family households, those with 1 or 2 children have the highest poverty rate, with 35 households (18.4%) falling below the poverty line. Among the single-parent households, those with 1 or 2 children have the highest poverty rate, with 99 household (59.6%) living below poverty.
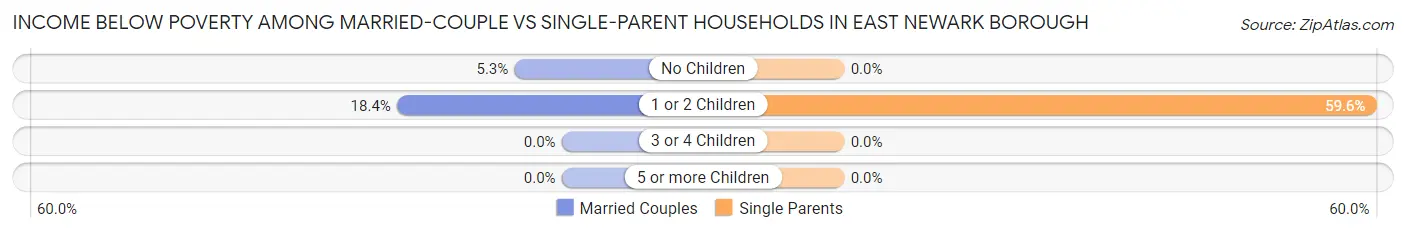
| Children | Married-Couple Families | Single-Parent Households |
| No Children | 12 (5.3%) | 0 (0.0%) |
| 1 or 2 Children | 35 (18.4%) | 99 (59.6%) |
| 3 or 4 Children | 0 (0.0%) | 0 (0.0%) |
| 5 or more Children | 0 (0.0%) | 0 (0.0%) |
| Total | 47 (10.8%) | 99 (41.2%) |
Race in East Newark borough
The most populous races in East Newark borough are Hispanic or Latino (1,789 | 65.8%), White / Caucasian (937 | 34.5%), and Some other Race (883 | 32.5%).
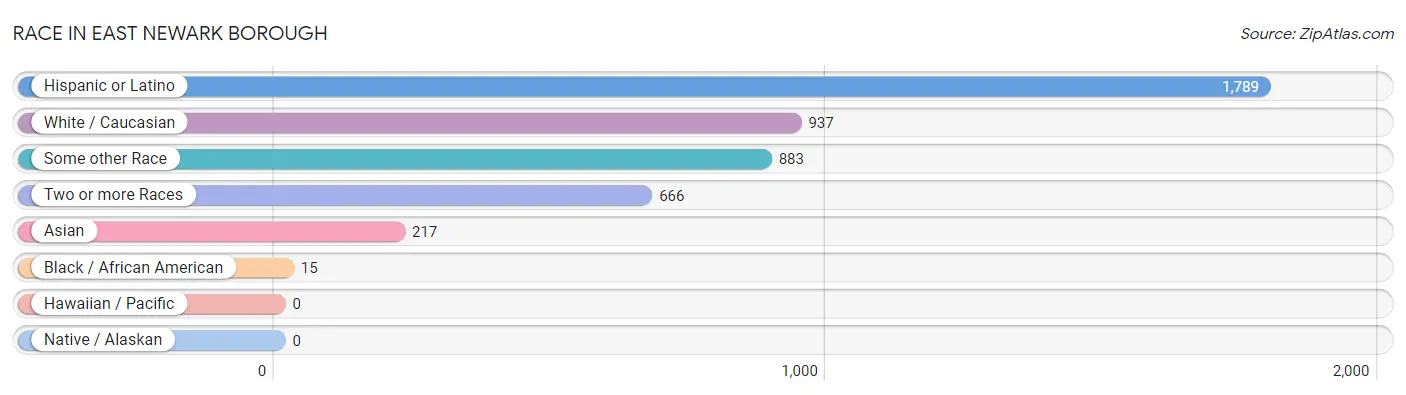
| Race | # Population | % Population |
| Asian | 217 | 8.0% |
| Black / African American | 15 | 0.5% |
| Hawaiian / Pacific | 0 | 0.0% |
| Hispanic or Latino | 1,789 | 65.8% |
| Native / Alaskan | 0 | 0.0% |
| White / Caucasian | 937 | 34.5% |
| Two or more Races | 666 | 24.5% |
| Some other Race | 883 | 32.5% |
| Total | 2,718 | 100.0% |
Ancestry in East Newark borough
The most populous ancestries reported in East Newark borough are South American (1,376 | 50.6%), Ecuadorian (972 | 35.8%), Peruvian (249 | 9.2%), Mexican (196 | 7.2%), and Indian (Asian) (171 | 6.3%), together accounting for 109.0% of all East Newark borough residents.
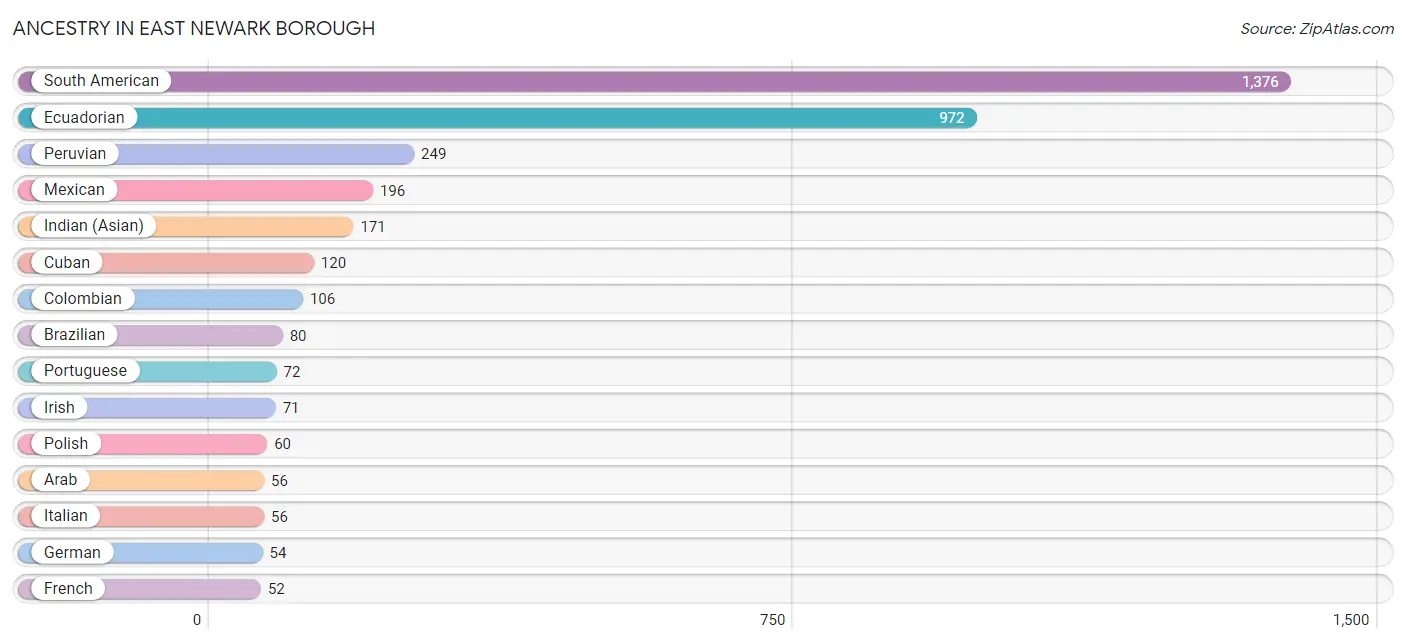
| Ancestry | # Population | % Population |
| Arab | 56 | 2.1% |
| Brazilian | 80 | 2.9% |
| Central American | 50 | 1.8% |
| Chilean | 29 | 1.1% |
| Colombian | 106 | 3.9% |
| Cuban | 120 | 4.4% |
| Dominican | 19 | 0.7% |
| Dutch | 1 | 0.0% |
| Ecuadorian | 972 | 35.8% |
| English | 17 | 0.6% |
| French | 52 | 1.9% |
| German | 54 | 2.0% |
| Indian (Asian) | 171 | 6.3% |
| Irish | 71 | 2.6% |
| Italian | 56 | 2.1% |
| Korean | 4 | 0.2% |
| Mexican | 196 | 7.2% |
| Peruvian | 249 | 9.2% |
| Polish | 60 | 2.2% |
| Portuguese | 72 | 2.6% |
| Salvadoran | 50 | 1.8% |
| Scotch-Irish | 2 | 0.1% |
| Scottish | 9 | 0.3% |
| South American | 1,376 | 50.6% |
| Spanish | 5 | 0.2% |
| Thai | 42 | 1.5% |
| Uruguayan | 20 | 0.7% | View All 27 Rows |
Immigrants in East Newark borough
The most numerous immigrant groups reported in East Newark borough came from Latin America (1,507 | 55.4%), South America (1,298 | 47.8%), Ecuador (770 | 28.3%), Brazil (199 | 7.3%), and Peru (167 | 6.1%), together accounting for 145.0% of all East Newark borough residents.
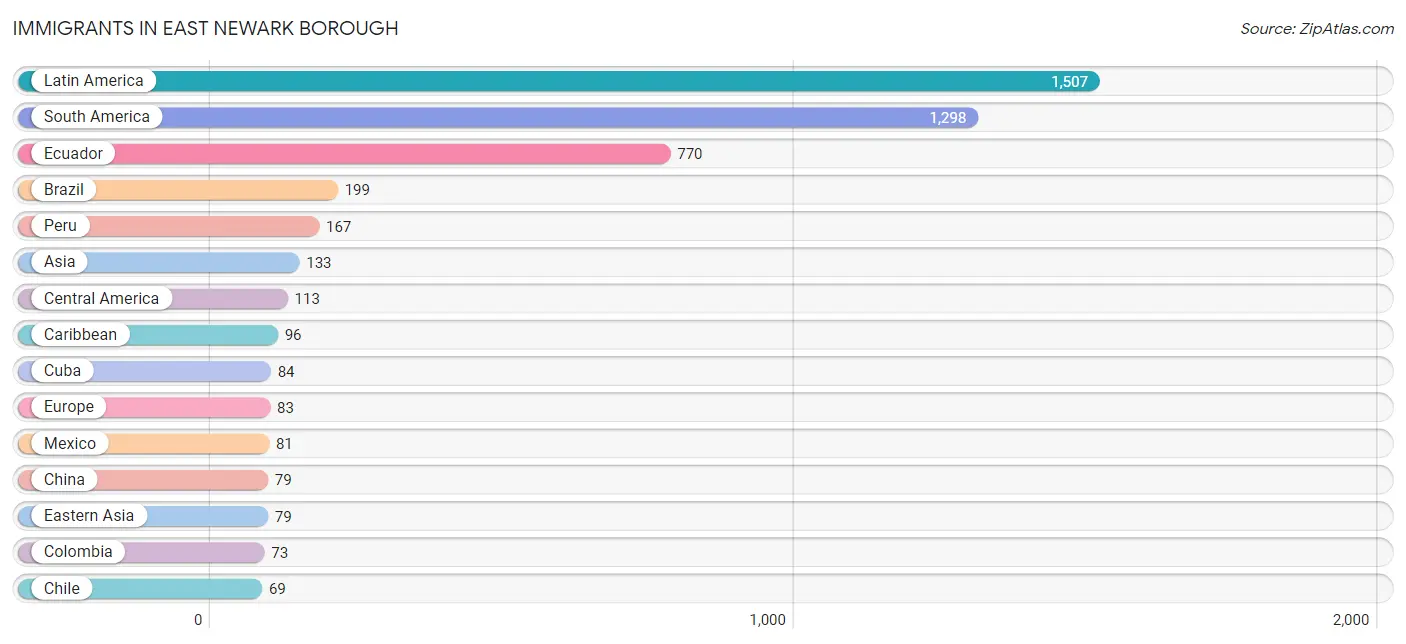
| Immigration Origin | # Population | % Population |
| Africa | 50 | 1.8% |
| Asia | 133 | 4.9% |
| Brazil | 199 | 7.3% |
| Caribbean | 96 | 3.5% |
| Central America | 113 | 4.2% |
| Chile | 69 | 2.5% |
| China | 79 | 2.9% |
| Colombia | 73 | 2.7% |
| Cuba | 84 | 3.1% |
| Dominican Republic | 12 | 0.4% |
| Eastern Asia | 79 | 2.9% |
| Eastern Europe | 19 | 0.7% |
| Ecuador | 770 | 28.3% |
| El Salvador | 32 | 1.2% |
| Europe | 83 | 3.0% |
| Germany | 15 | 0.5% |
| Hong Kong | 5 | 0.2% |
| India | 50 | 1.8% |
| Latin America | 1,507 | 55.4% |
| Mexico | 81 | 3.0% |
| Middle Africa | 3 | 0.1% |
| Morocco | 47 | 1.7% |
| Northern Africa | 47 | 1.7% |
| Peru | 167 | 6.1% |
| Philippines | 4 | 0.2% |
| Poland | 19 | 0.7% |
| Portugal | 47 | 1.7% |
| South America | 1,298 | 47.8% |
| South Central Asia | 50 | 1.8% |
| South Eastern Asia | 4 | 0.2% |
| Southern Europe | 49 | 1.8% |
| Spain | 2 | 0.1% |
| Uruguay | 20 | 0.7% |
| Western Europe | 15 | 0.5% | View All 34 Rows |
Sex and Age in East Newark borough
Sex and Age in East Newark borough
The most populous age groups in East Newark borough are 15 to 19 Years (156 | 12.6%) for men and 55 to 59 Years (196 | 13.3%) for women.
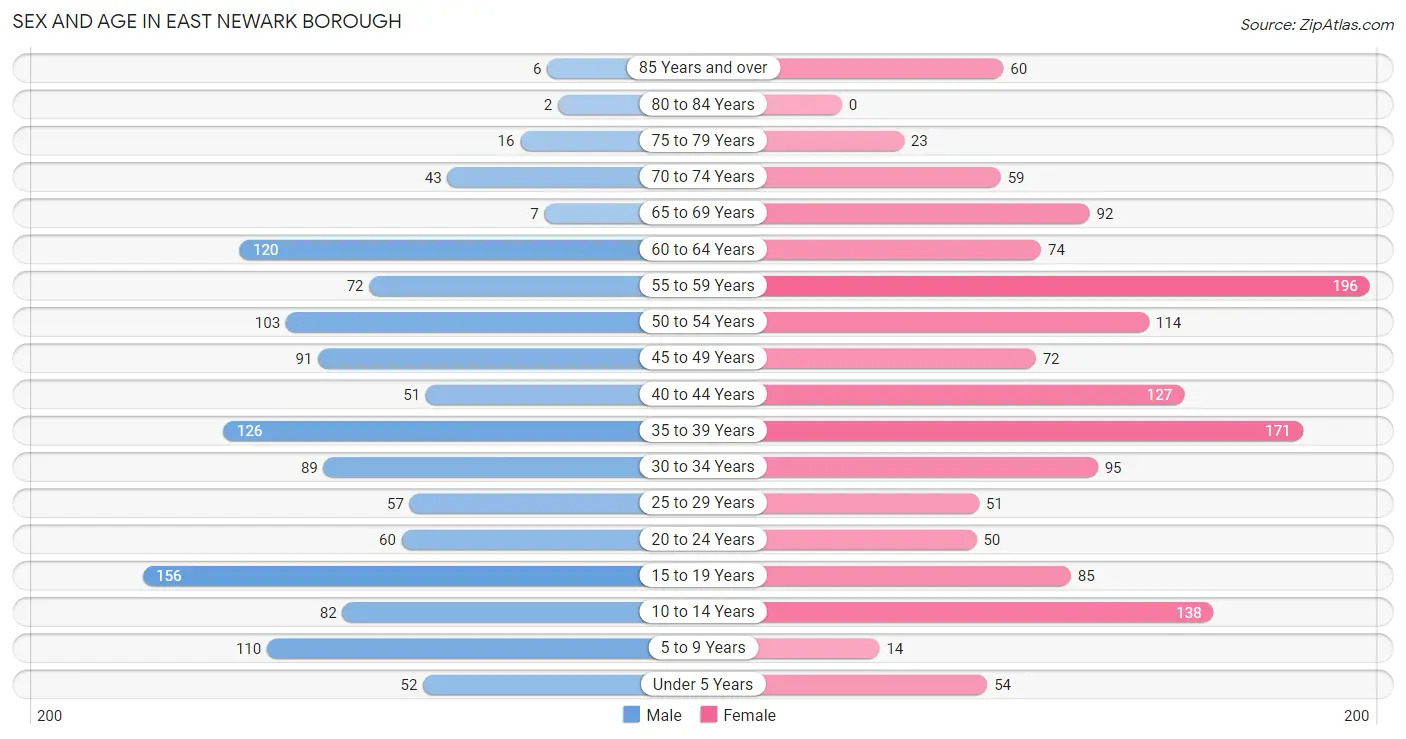
| Age Bracket | Male | Female |
| Under 5 Years | 52 (4.2%) | 54 (3.7%) |
| 5 to 9 Years | 110 (8.8%) | 14 (0.9%) |
| 10 to 14 Years | 82 (6.6%) | 138 (9.4%) |
| 15 to 19 Years | 156 (12.6%) | 85 (5.8%) |
| 20 to 24 Years | 60 (4.8%) | 50 (3.4%) |
| 25 to 29 Years | 57 (4.6%) | 51 (3.5%) |
| 30 to 34 Years | 89 (7.2%) | 95 (6.4%) |
| 35 to 39 Years | 126 (10.1%) | 171 (11.6%) |
| 40 to 44 Years | 51 (4.1%) | 127 (8.6%) |
| 45 to 49 Years | 91 (7.3%) | 72 (4.9%) |
| 50 to 54 Years | 103 (8.3%) | 114 (7.7%) |
| 55 to 59 Years | 72 (5.8%) | 196 (13.3%) |
| 60 to 64 Years | 120 (9.7%) | 74 (5.0%) |
| 65 to 69 Years | 7 (0.6%) | 92 (6.2%) |
| 70 to 74 Years | 43 (3.5%) | 59 (4.0%) |
| 75 to 79 Years | 16 (1.3%) | 23 (1.6%) |
| 80 to 84 Years | 2 (0.2%) | 0 (0.0%) |
| 85 Years and over | 6 (0.5%) | 60 (4.1%) |
| Total | 1,243 (100.0%) | 1,475 (100.0%) |
Families and Households in East Newark borough
Median Family Size in East Newark borough
The median family size in East Newark borough is 3.05 persons per family, with single male/father families (28 | 4.2%) accounting for the largest median family size of 3.46 persons per family. On the other hand, single female/mother families (212 | 31.5%) represent the smallest median family size with 2.51 persons per family.
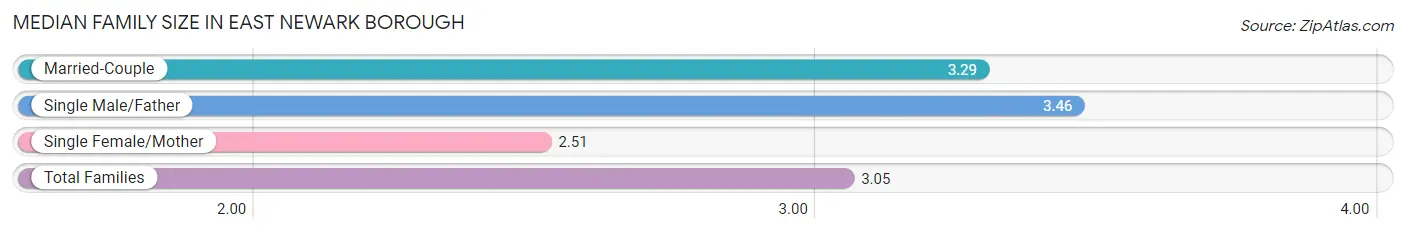
| Family Type | # Families | Family Size |
| Married-Couple | 434 (64.4%) | 3.29 |
| Single Male/Father | 28 (4.2%) | 3.46 |
| Single Female/Mother | 212 (31.5%) | 2.51 |
| Total Families | 674 (100.0%) | 3.05 |
Median Household Size in East Newark borough
The median household size in East Newark borough is 3.21 persons per household, with single male/father households (28 | 3.3%) accounting for the largest median household size of 4.04 persons per household. single female/mother households (212 | 25.1%) represent the smallest median household size with 2.56 persons per household.
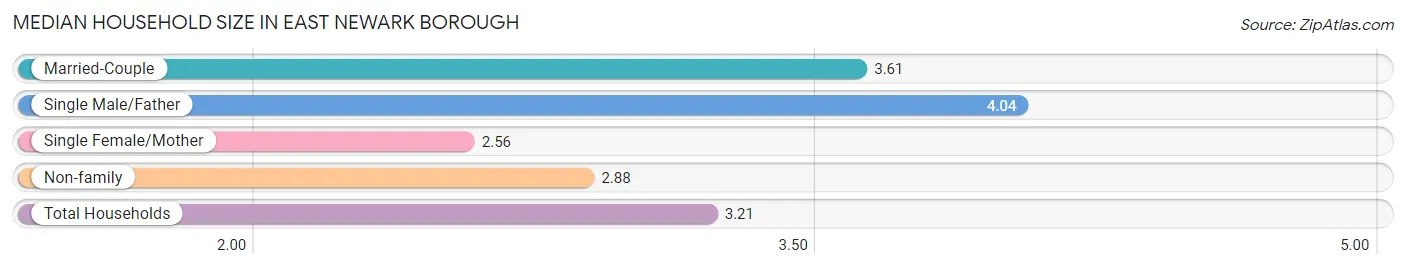
| Household Type | # Households | Household Size |
| Married-Couple | 434 (51.3%) | 3.61 |
| Single Male/Father | 28 (3.3%) | 4.04 |
| Single Female/Mother | 212 (25.1%) | 2.56 |
| Non-family | 172 (20.3%) | 2.88 |
| Total Households | 846 (100.0%) | 3.21 |
Household Size by Marriage Status in East Newark borough
Out of a total of 846 households in East Newark borough, 674 (79.7%) are family households, while 172 (20.3%) are nonfamily households. The most numerous type of family households are 4-person households, comprising 209, and the most common type of nonfamily households are 1-person households, comprising 127.
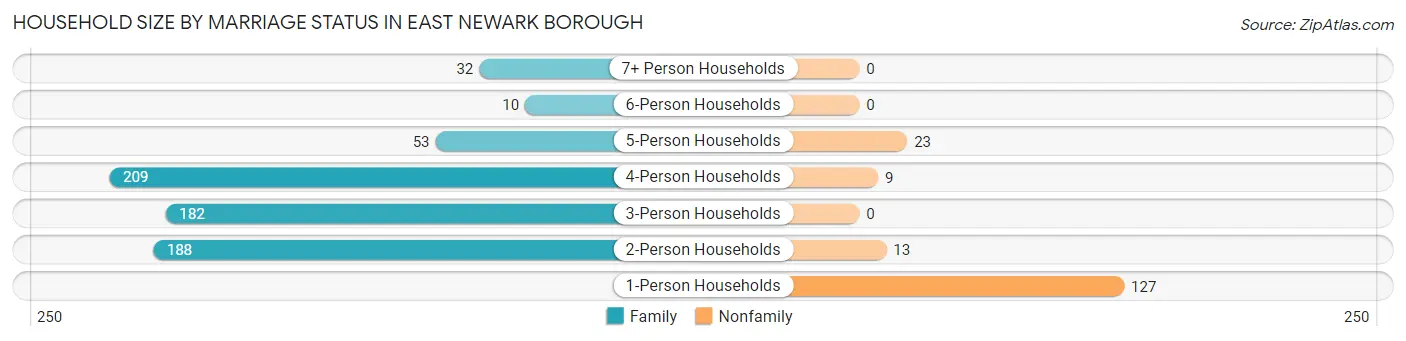
| Household Size | Family Households | Nonfamily Households |
| 1-Person Households | - | 127 (15.0%) |
| 2-Person Households | 188 (22.2%) | 13 (1.5%) |
| 3-Person Households | 182 (21.5%) | 0 (0.0%) |
| 4-Person Households | 209 (24.7%) | 9 (1.1%) |
| 5-Person Households | 53 (6.3%) | 23 (2.7%) |
| 6-Person Households | 10 (1.2%) | 0 (0.0%) |
| 7+ Person Households | 32 (3.8%) | 0 (0.0%) |
| Total | 674 (79.7%) | 172 (20.3%) |
Female Fertility in East Newark borough
Fertility by Age in East Newark borough
Average fertility rate in East Newark borough is 49.0 births per 1,000 women. Women in the age bracket of 20 to 34 years have the highest fertility rate with 163.0 births per 1,000 women. Women in the age bracket of 20 to 34 years acount for 100.0% of all women with births.
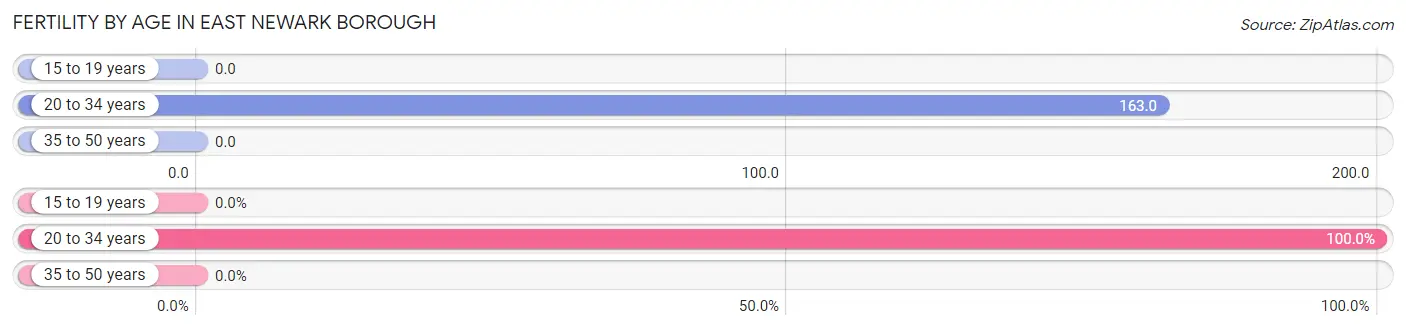
| Age Bracket | Women with Births | Births / 1,000 Women |
| 15 to 19 years | 0 (0.0%) | 0.0 |
| 20 to 34 years | 32 (100.0%) | 163.0 |
| 35 to 50 years | 0 (0.0%) | 0.0 |
| Total | 32 (100.0%) | 49.0 |
Fertility by Age by Marriage Status in East Newark borough
43.8% of women with births (32) in East Newark borough are married. The highest percentage of unmarried women with births falls into 20 to 34 years age bracket with 56.2% of them unmarried at the time of birth, while the lowest percentage of unmarried women with births belong to 20 to 34 years age bracket with 56.2% of them unmarried.
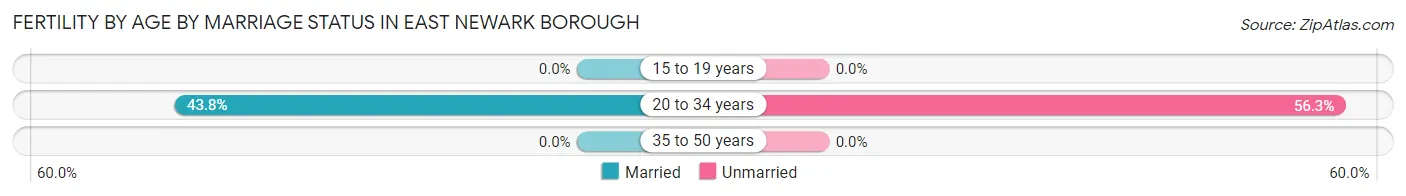
| Age Bracket | Married | Unmarried |
| 15 to 19 years | 0 (0.0%) | 0 (0.0%) |
| 20 to 34 years | 14 (43.8%) | 18 (56.2%) |
| 35 to 50 years | 0 (0.0%) | 0 (0.0%) |
| Total | 14 (43.8%) | 18 (56.2%) |
Fertility by Education in East Newark borough
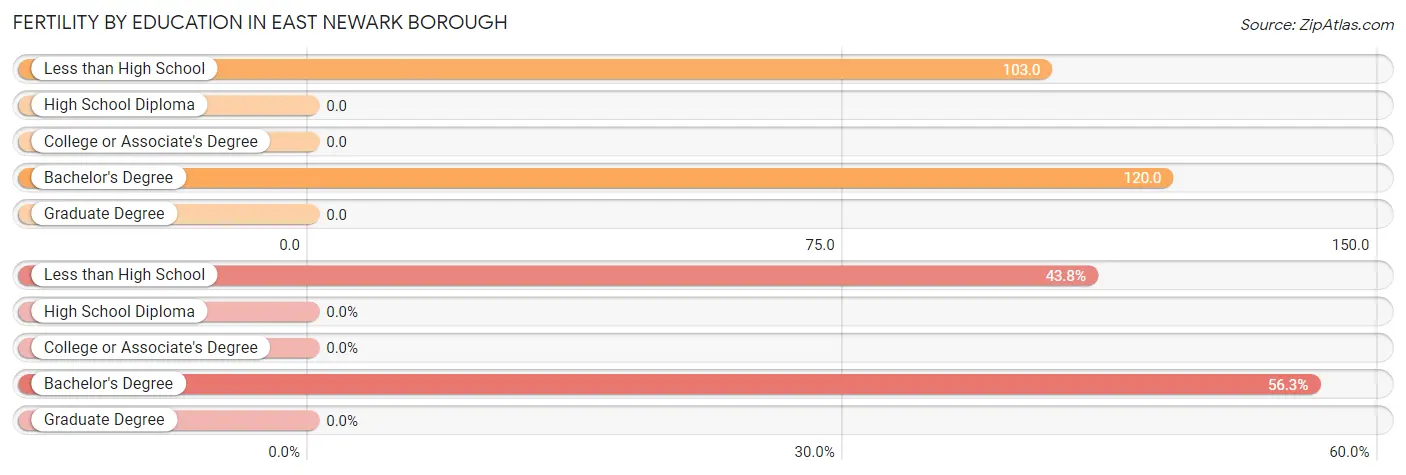
| Educational Attainment | Women with Births | Births / 1,000 Women |
| Less than High School | 14 (43.8%) | 103.0 |
| High School Diploma | 0 (0.0%) | 0.0 |
| College or Associate's Degree | 0 (0.0%) | 0.0 |
| Bachelor's Degree | 18 (56.2%) | 120.0 |
| Graduate Degree | 0 (0.0%) | 0.0 |
| Total | 32 (100.0%) | 49.0 |
Fertility by Education by Marriage Status in East Newark borough
56.2% of women with births in East Newark borough are unmarried. Women with the educational attainment of less than high school are most likely to be married with 100.0% of them married at childbirth, while women with the educational attainment of bachelor's degree are least likely to be married with 100.0% of them unmarried at childbirth.
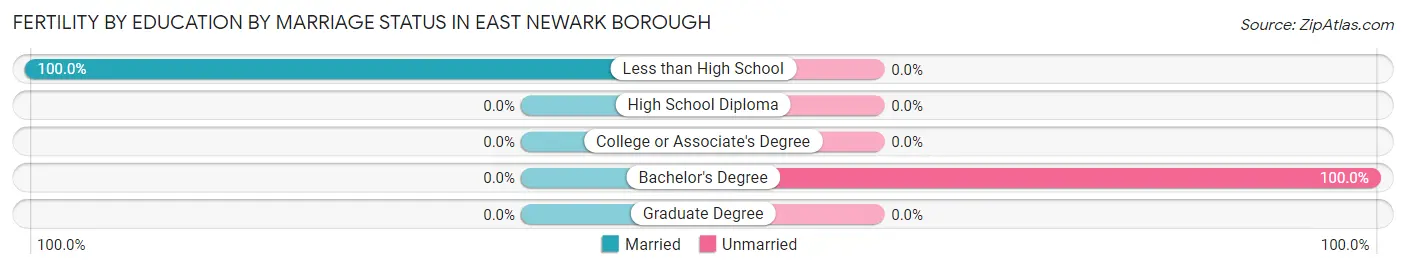
| Educational Attainment | Married | Unmarried |
| Less than High School | 14 (100.0%) | 0 (0.0%) |
| High School Diploma | 0 (0.0%) | 0 (0.0%) |
| College or Associate's Degree | 0 (0.0%) | 0 (0.0%) |
| Bachelor's Degree | 0 (0.0%) | 18 (100.0%) |
| Graduate Degree | 0 (0.0%) | 0 (0.0%) |
| Total | 14 (43.8%) | 18 (56.2%) |
Employment Characteristics in East Newark borough
Employment by Class of Employer in East Newark borough
Among the 1,369 employed individuals in East Newark borough, private company employees (1,145 | 83.6%), federal government employees (55 | 4.0%), and self-employed (incorporated) (47 | 3.4%) make up the most common classes of employment.
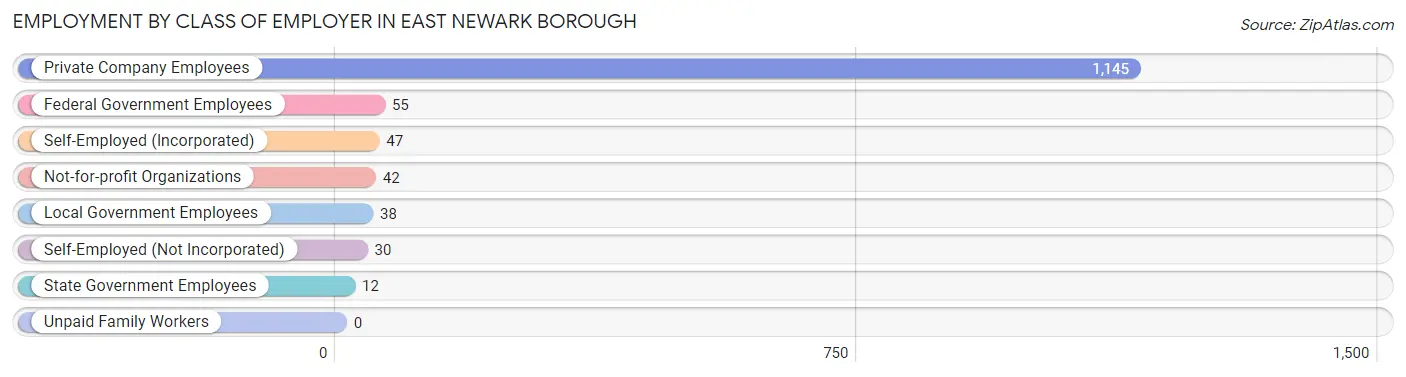
| Employer Class | # Employees | % Employees |
| Private Company Employees | 1,145 | 83.6% |
| Self-Employed (Incorporated) | 47 | 3.4% |
| Self-Employed (Not Incorporated) | 30 | 2.2% |
| Not-for-profit Organizations | 42 | 3.1% |
| Local Government Employees | 38 | 2.8% |
| State Government Employees | 12 | 0.9% |
| Federal Government Employees | 55 | 4.0% |
| Unpaid Family Workers | 0 | 0.0% |
| Total | 1,369 | 100.0% |
Employment Status by Age in East Newark borough
According to the labor force statistics for East Newark borough, out of the total population over 16 years of age (2,221), 67.7% or 1,504 individuals are in the labor force, with 8.2% or 123 of them unemployed. The age group with the highest labor force participation rate is 45 to 54 years, with 97.6% or 371 individuals in the labor force. Within the labor force, the 65 to 74 years age range has the highest percentage of unemployed individuals, with 27.4% or 23 of them being unemployed.
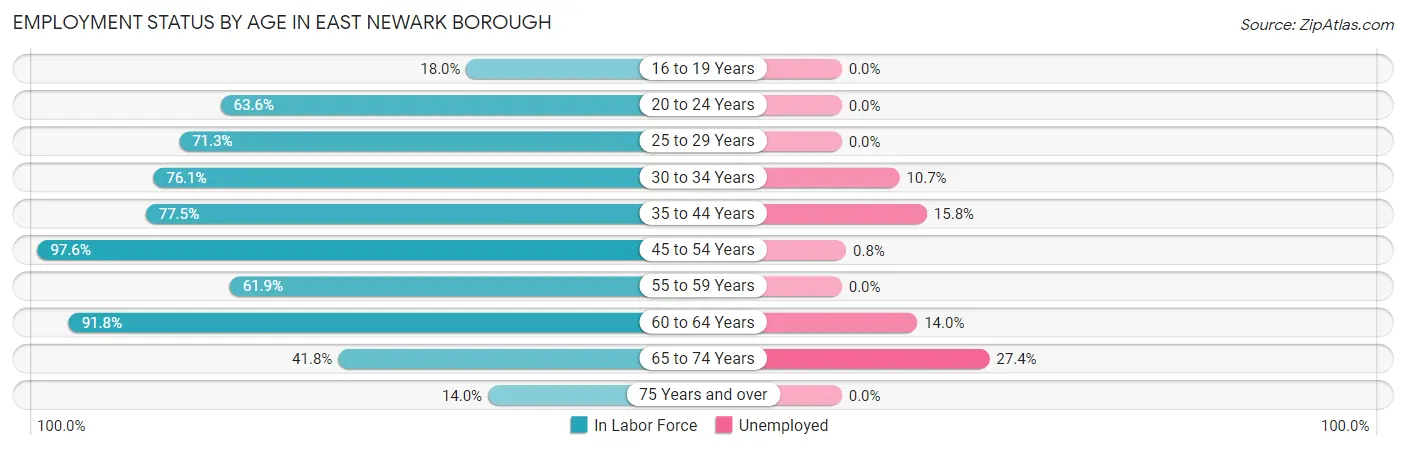
| Age Bracket | In Labor Force | Unemployed |
| 16 to 19 Years | 35 (18.0%) | 0 (0.0%) |
| 20 to 24 Years | 70 (63.6%) | 0 (0.0%) |
| 25 to 29 Years | 77 (71.3%) | 0 (0.0%) |
| 30 to 34 Years | 140 (76.1%) | 15 (10.7%) |
| 35 to 44 Years | 368 (77.5%) | 58 (15.8%) |
| 45 to 54 Years | 371 (97.6%) | 3 (0.8%) |
| 55 to 59 Years | 166 (61.9%) | 0 (0.0%) |
| 60 to 64 Years | 178 (91.8%) | 25 (14.0%) |
| 65 to 74 Years | 84 (41.8%) | 23 (27.4%) |
| 75 Years and over | 15 (14.0%) | 0 (0.0%) |
| Total | 1,504 (67.7%) | 123 (8.2%) |
Employment Status by Educational Attainment in East Newark borough
According to labor force statistics for East Newark borough, 80.8% of individuals (1,300) out of the total population between 25 and 64 years of age (1,609) are in the labor force, with 7.8% or 101 of them being unemployed. The group with the highest labor force participation rate are those with the educational attainment of college / associate degree, with 85.8% or 235 individuals in the labor force. Within the labor force, individuals with high school diploma education have the highest percentage of unemployment, with 13.7% or 56 of them being unemployed.
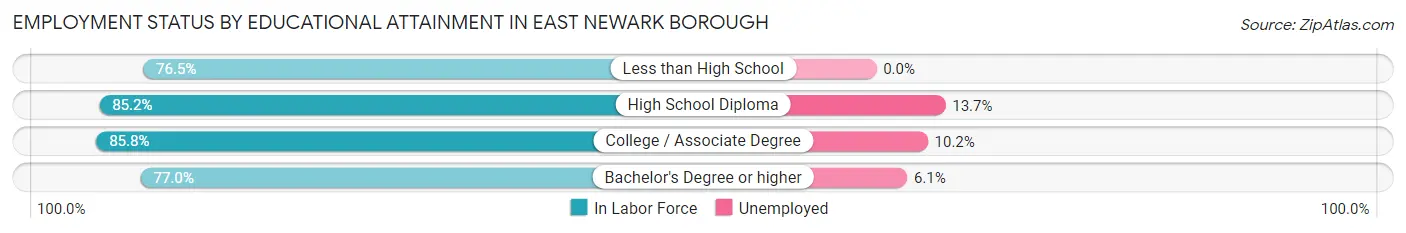
| Educational Attainment | In Labor Force | Unemployed |
| Less than High School | 315 (76.5%) | 0 (0.0%) |
| High School Diploma | 408 (85.2%) | 66 (13.7%) |
| College / Associate Degree | 235 (85.8%) | 28 (10.2%) |
| Bachelor's Degree or higher | 342 (77.0%) | 27 (6.1%) |
| Total | 1,300 (80.8%) | 126 (7.8%) |
Employment Occupations by Sex in East Newark borough
Management, Business, Science and Arts Occupations
The most common Management, Business, Science and Arts occupations in East Newark borough are Business & Financial (104 | 7.5%), Community & Social Service (83 | 6.0%), Management (68 | 4.9%), Computers, Engineering & Science (57 | 4.1%), and Arts, Media & Entertainment (47 | 3.4%).
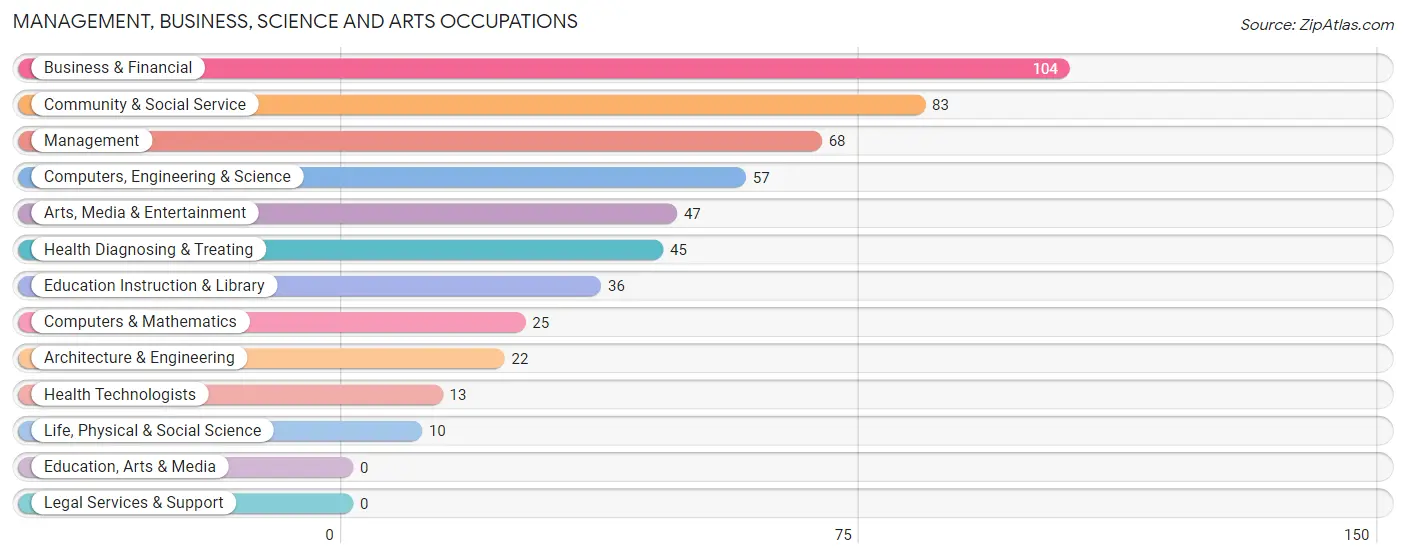
Management, Business, Science and Arts Occupations by Sex
Within the Management, Business, Science and Arts occupations in East Newark borough, the most male-oriented occupations are Architecture & Engineering (100.0%), Life, Physical & Social Science (100.0%), and Health Technologists (100.0%), while the most female-oriented occupations are Business & Financial (89.4%), Management (77.9%), and Health Diagnosing & Treating (64.4%).
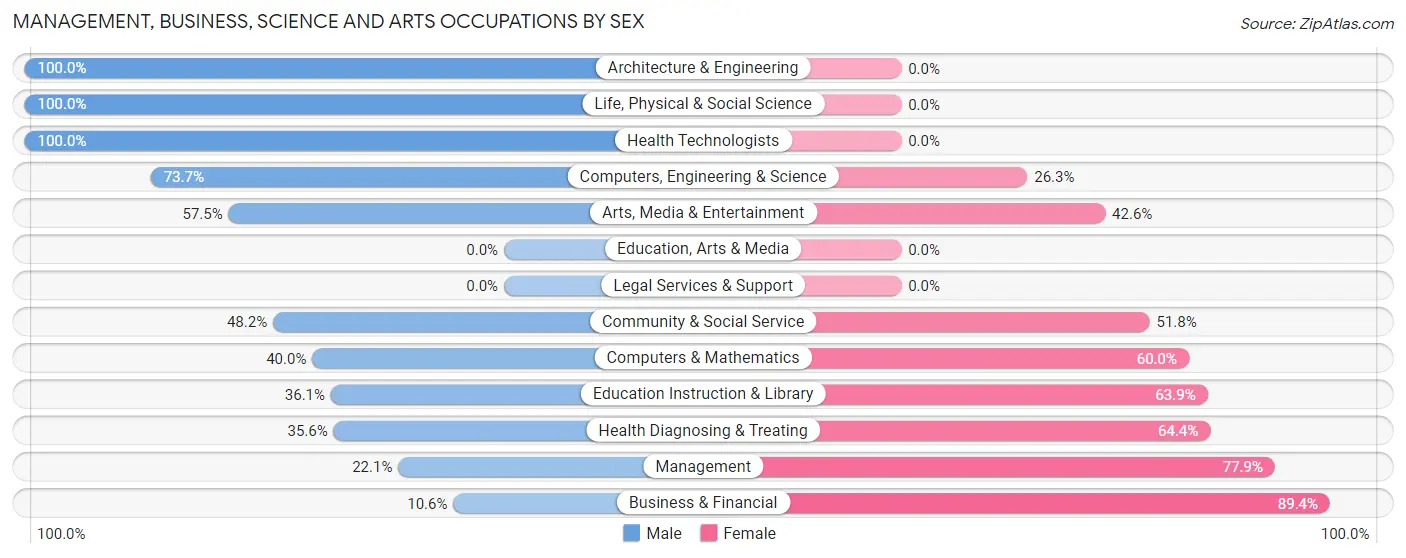
| Occupation | Male | Female |
| Management | 15 (22.1%) | 53 (77.9%) |
| Business & Financial | 11 (10.6%) | 93 (89.4%) |
| Computers, Engineering & Science | 42 (73.7%) | 15 (26.3%) |
| Computers & Mathematics | 10 (40.0%) | 15 (60.0%) |
| Architecture & Engineering | 22 (100.0%) | 0 (0.0%) |
| Life, Physical & Social Science | 10 (100.0%) | 0 (0.0%) |
| Community & Social Service | 40 (48.2%) | 43 (51.8%) |
| Education, Arts & Media | 0 (0.0%) | 0 (0.0%) |
| Legal Services & Support | 0 (0.0%) | 0 (0.0%) |
| Education Instruction & Library | 13 (36.1%) | 23 (63.9%) |
| Arts, Media & Entertainment | 27 (57.5%) | 20 (42.5%) |
| Health Diagnosing & Treating | 16 (35.6%) | 29 (64.4%) |
| Health Technologists | 13 (100.0%) | 0 (0.0%) |
| Total (Category) | 124 (34.7%) | 233 (65.3%) |
| Total (Overall) | 662 (48.0%) | 718 (52.0%) |
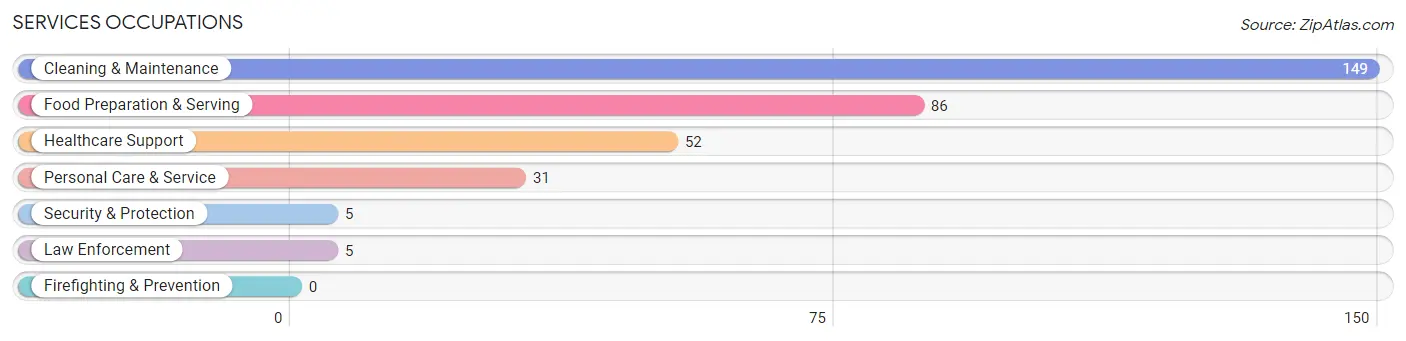
Services Occupations
The most common Services occupations in East Newark borough are Cleaning & Maintenance (149 | 10.8%), Food Preparation & Serving (86 | 6.2%), Healthcare Support (52 | 3.8%), Personal Care & Service (31 | 2.2%), and Security & Protection (5 | 0.4%).
Services Occupations by Sex
Within the Services occupations in East Newark borough, the most male-oriented occupations are Security & Protection (80.0%), Law Enforcement (80.0%), and Food Preparation & Serving (61.6%), while the most female-oriented occupations are Healthcare Support (100.0%), Personal Care & Service (100.0%), and Cleaning & Maintenance (88.6%).
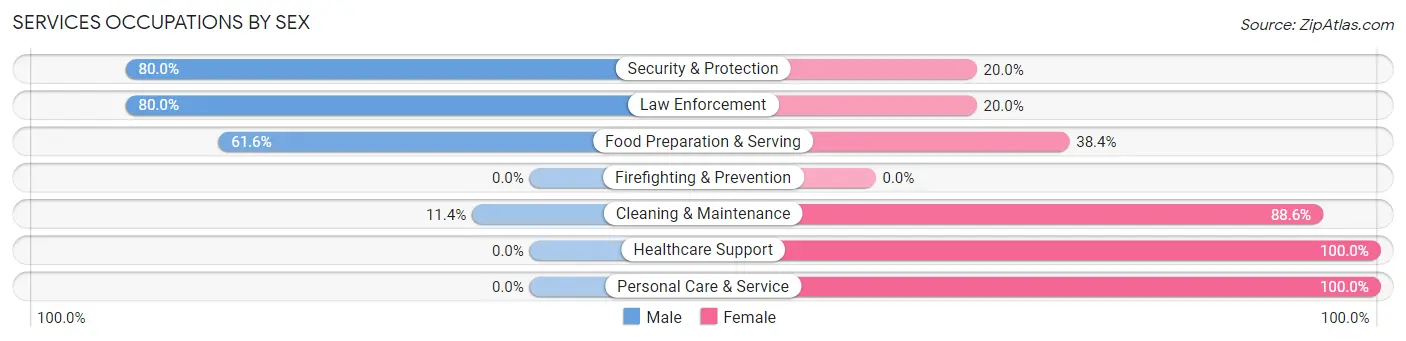
| Occupation | Male | Female |
| Healthcare Support | 0 (0.0%) | 52 (100.0%) |
| Security & Protection | 4 (80.0%) | 1 (20.0%) |
| Firefighting & Prevention | 0 (0.0%) | 0 (0.0%) |
| Law Enforcement | 4 (80.0%) | 1 (20.0%) |
| Food Preparation & Serving | 53 (61.6%) | 33 (38.4%) |
| Cleaning & Maintenance | 17 (11.4%) | 132 (88.6%) |
| Personal Care & Service | 0 (0.0%) | 31 (100.0%) |
| Total (Category) | 74 (22.9%) | 249 (77.1%) |
| Total (Overall) | 662 (48.0%) | 718 (52.0%) |
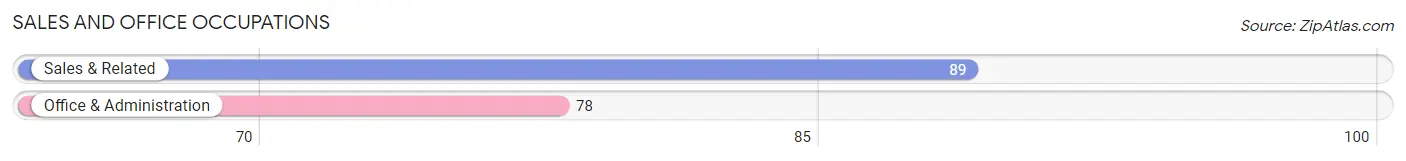
Sales and Office Occupations
The most common Sales and Office occupations in East Newark borough are Sales & Related (89 | 6.5%), and Office & Administration (78 | 5.7%).
Sales and Office Occupations by Sex
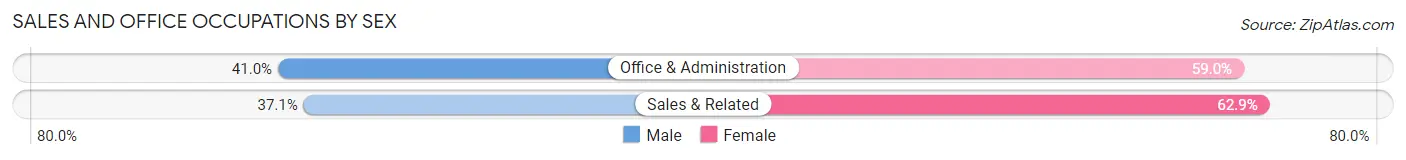
| Occupation | Male | Female |
| Sales & Related | 33 (37.1%) | 56 (62.9%) |
| Office & Administration | 32 (41.0%) | 46 (59.0%) |
| Total (Category) | 65 (38.9%) | 102 (61.1%) |
| Total (Overall) | 662 (48.0%) | 718 (52.0%) |
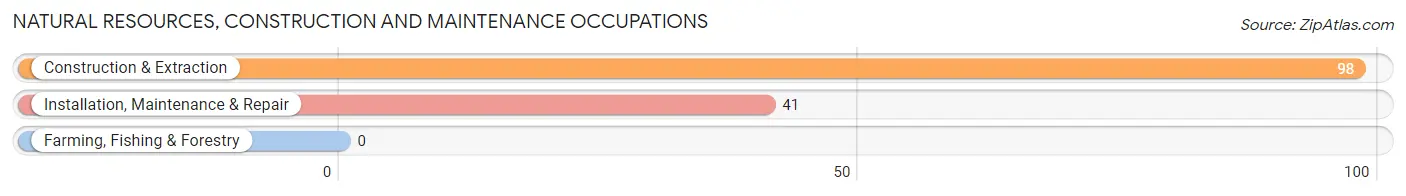
Natural Resources, Construction and Maintenance Occupations
The most common Natural Resources, Construction and Maintenance occupations in East Newark borough are Construction & Extraction (98 | 7.1%), and Installation, Maintenance & Repair (41 | 3.0%).
Natural Resources, Construction and Maintenance Occupations by Sex
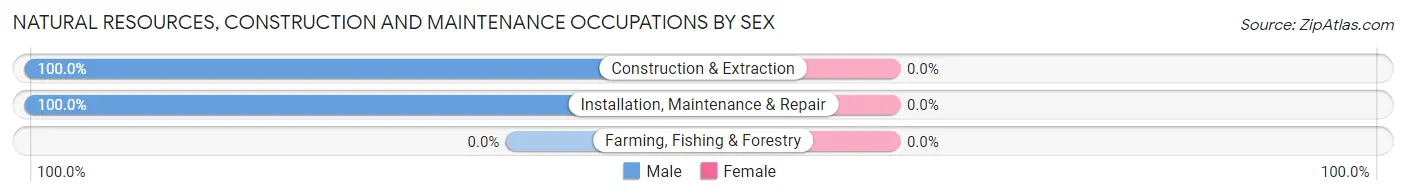
| Occupation | Male | Female |
| Farming, Fishing & Forestry | 0 (0.0%) | 0 (0.0%) |
| Construction & Extraction | 98 (100.0%) | 0 (0.0%) |
| Installation, Maintenance & Repair | 41 (100.0%) | 0 (0.0%) |
| Total (Category) | 139 (100.0%) | 0 (0.0%) |
| Total (Overall) | 662 (48.0%) | 718 (52.0%) |
Production, Transportation and Moving Occupations
The most common Production, Transportation and Moving occupations in East Newark borough are Production (250 | 18.1%), Material Moving (99 | 7.2%), and Transportation (45 | 3.3%).
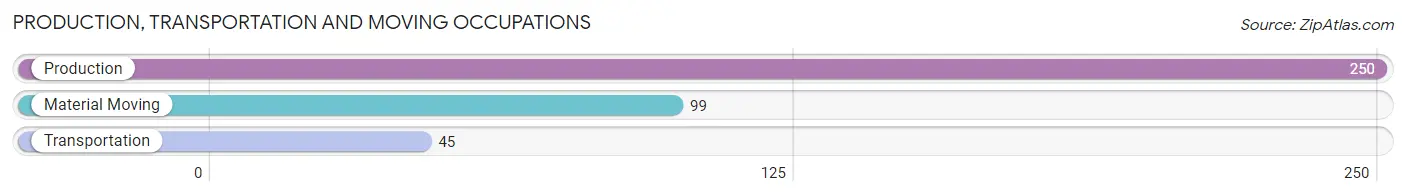
Production, Transportation and Moving Occupations by Sex
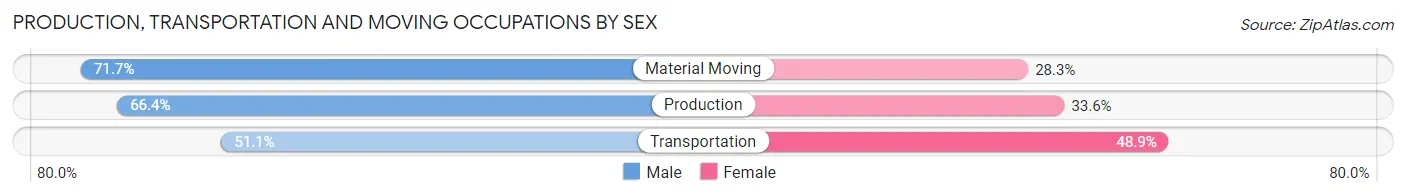
| Occupation | Male | Female |
| Production | 166 (66.4%) | 84 (33.6%) |
| Transportation | 23 (51.1%) | 22 (48.9%) |
| Material Moving | 71 (71.7%) | 28 (28.3%) |
| Total (Category) | 260 (66.0%) | 134 (34.0%) |
| Total (Overall) | 662 (48.0%) | 718 (52.0%) |
Employment Industries by Sex in East Newark borough
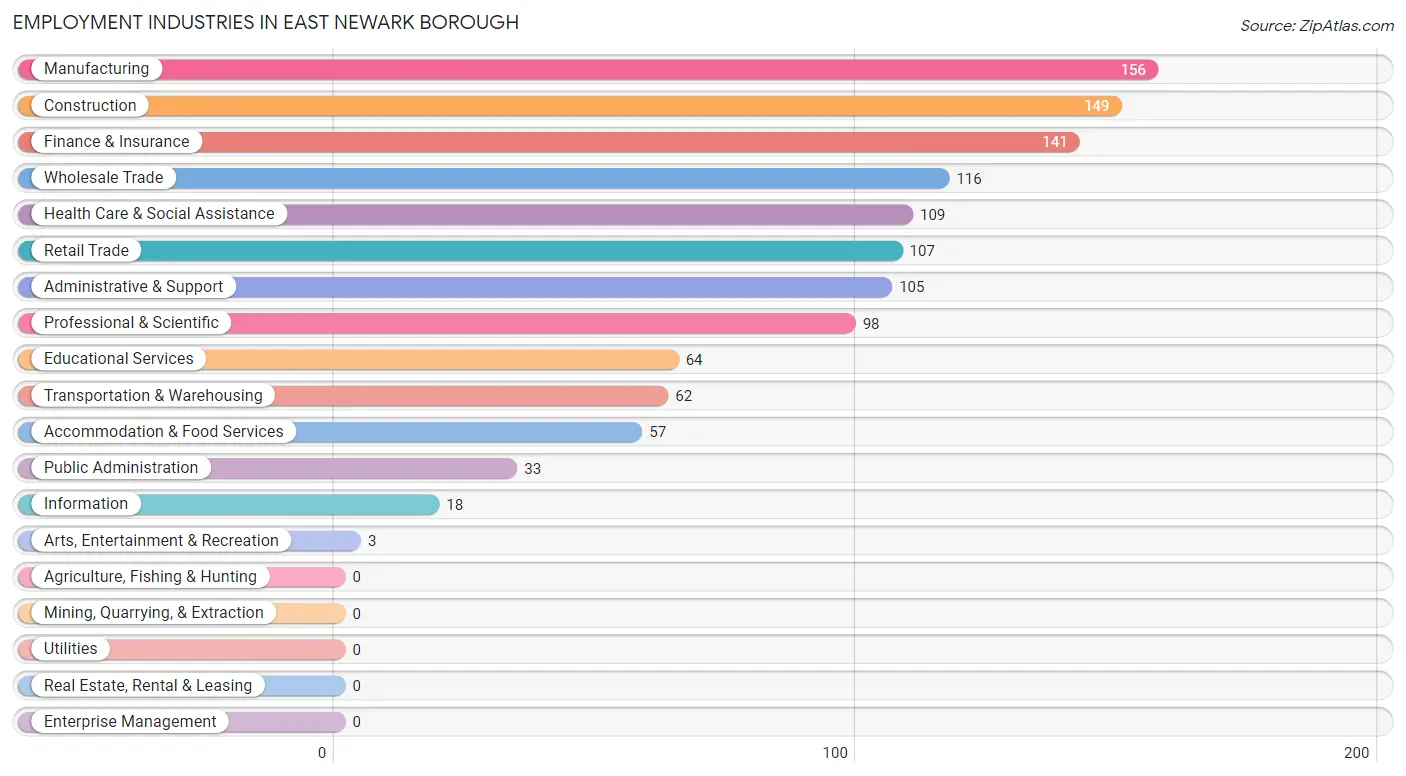
Employment Industries in East Newark borough
The major employment industries in East Newark borough include Manufacturing (156 | 11.3%), Construction (149 | 10.8%), Finance & Insurance (141 | 10.2%), Wholesale Trade (116 | 8.4%), and Health Care & Social Assistance (109 | 7.9%).
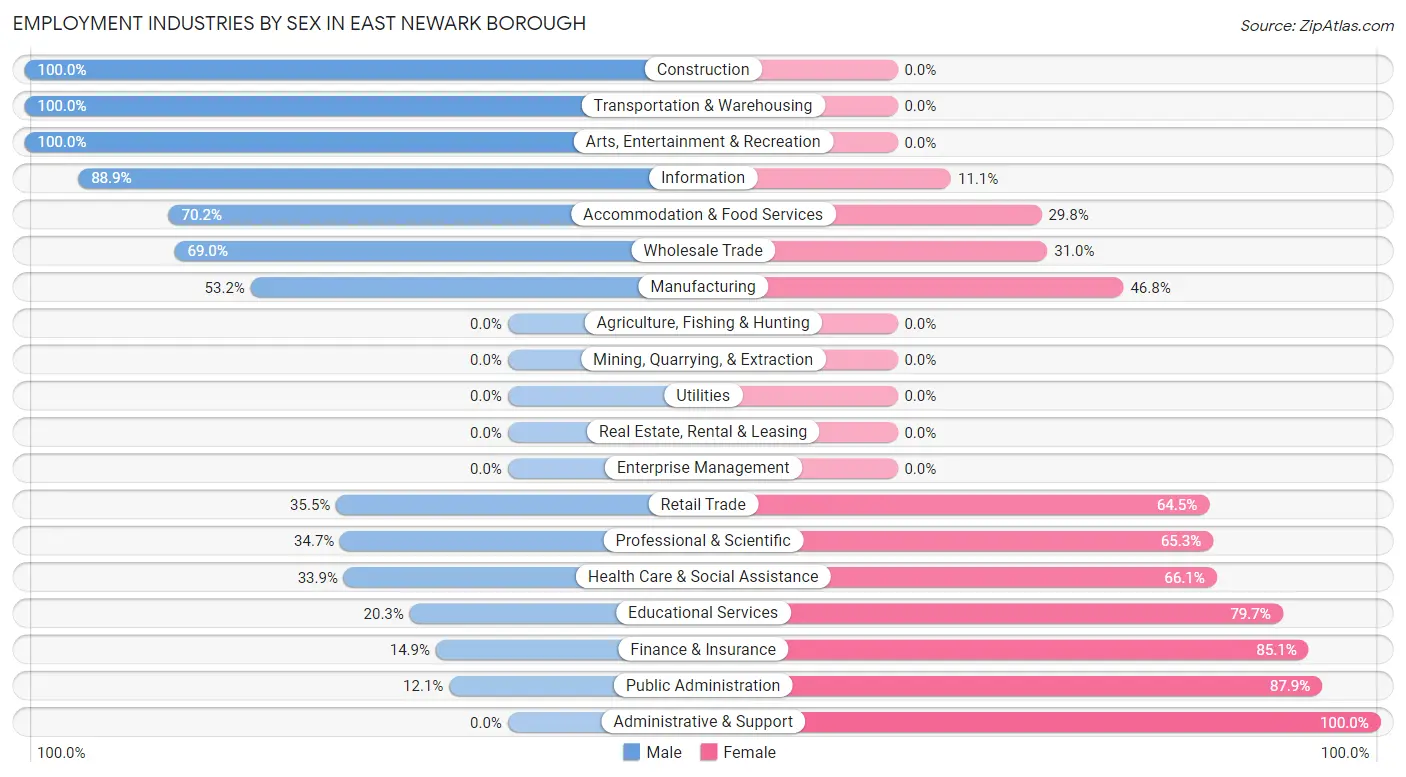
Employment Industries by Sex in East Newark borough
The East Newark borough industries that see more men than women are Construction (100.0%), Transportation & Warehousing (100.0%), and Arts, Entertainment & Recreation (100.0%), whereas the industries that tend to have a higher number of women are Administrative & Support (100.0%), Public Administration (87.9%), and Finance & Insurance (85.1%).
| Industry | Male | Female |
| Agriculture, Fishing & Hunting | 0 (0.0%) | 0 (0.0%) |
| Mining, Quarrying, & Extraction | 0 (0.0%) | 0 (0.0%) |
| Construction | 149 (100.0%) | 0 (0.0%) |
| Manufacturing | 83 (53.2%) | 73 (46.8%) |
| Wholesale Trade | 80 (69.0%) | 36 (31.0%) |
| Retail Trade | 38 (35.5%) | 69 (64.5%) |
| Transportation & Warehousing | 62 (100.0%) | 0 (0.0%) |
| Utilities | 0 (0.0%) | 0 (0.0%) |
| Information | 16 (88.9%) | 2 (11.1%) |
| Finance & Insurance | 21 (14.9%) | 120 (85.1%) |
| Real Estate, Rental & Leasing | 0 (0.0%) | 0 (0.0%) |
| Professional & Scientific | 34 (34.7%) | 64 (65.3%) |
| Enterprise Management | 0 (0.0%) | 0 (0.0%) |
| Administrative & Support | 0 (0.0%) | 105 (100.0%) |
| Educational Services | 13 (20.3%) | 51 (79.7%) |
| Health Care & Social Assistance | 37 (33.9%) | 72 (66.1%) |
| Arts, Entertainment & Recreation | 3 (100.0%) | 0 (0.0%) |
| Accommodation & Food Services | 40 (70.2%) | 17 (29.8%) |
| Public Administration | 4 (12.1%) | 29 (87.9%) |
| Total | 662 (48.0%) | 718 (52.0%) |
Education in East Newark borough
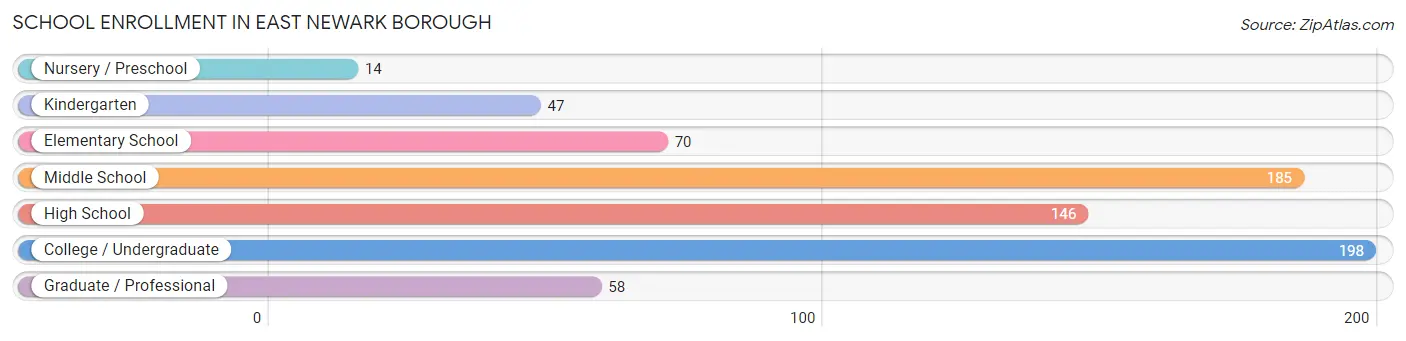
School Enrollment in East Newark borough
The most common levels of schooling among the 718 students in East Newark borough are college / undergraduate (198 | 27.6%), middle school (185 | 25.8%), and high school (146 | 20.3%).
| School Level | # Students | % Students |
| Nursery / Preschool | 14 | 1.9% |
| Kindergarten | 47 | 6.6% |
| Elementary School | 70 | 9.8% |
| Middle School | 185 | 25.8% |
| High School | 146 | 20.3% |
| College / Undergraduate | 198 | 27.6% |
| Graduate / Professional | 58 | 8.1% |
| Total | 718 | 100.0% |
School Enrollment by Age by Funding Source in East Newark borough
Out of a total of 718 students who are enrolled in schools in East Newark borough, 102 (14.2%) attend a private institution, while the remaining 616 (85.8%) are enrolled in public schools. The age group of 3 to 4 year olds has the highest likelihood of being enrolled in private schools, with 14 (100.0% in the age bracket) enrolled. Conversely, the age group of 5 to 9 year old has the lowest likelihood of being enrolled in a private school, with 117 (100.0% in the age bracket) attending a public institution.
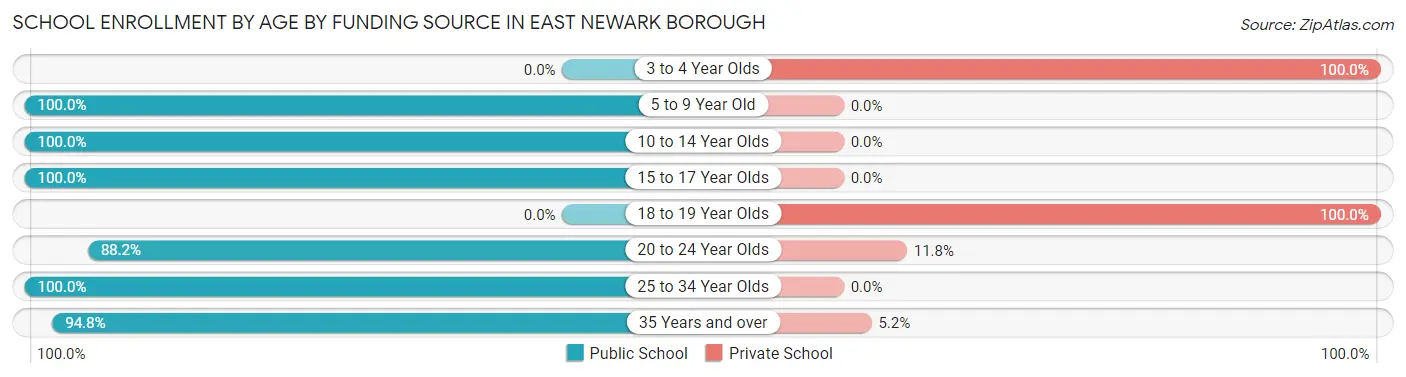
| Age Bracket | Public School | Private School |
| 3 to 4 Year Olds | 0 (0.0%) | 14 (100.0%) |
| 5 to 9 Year Old | 117 (100.0%) | 0 (0.0%) |
| 10 to 14 Year Olds | 220 (100.0%) | 0 (0.0%) |
| 15 to 17 Year Olds | 106 (100.0%) | 0 (0.0%) |
| 18 to 19 Year Olds | 0 (0.0%) | 77 (100.0%) |
| 20 to 24 Year Olds | 60 (88.2%) | 8 (11.8%) |
| 25 to 34 Year Olds | 58 (100.0%) | 0 (0.0%) |
| 35 Years and over | 55 (94.8%) | 3 (5.2%) |
| Total | 616 (85.8%) | 102 (14.2%) |
Educational Attainment by Field of Study in East Newark borough
Business (134 | 26.8%), bio, nature & agricultural (72 | 14.4%), psychology (63 | 12.6%), engineering (61 | 12.2%), and computers & mathematics (45 | 9.0%) are the most common fields of study among 501 individuals in East Newark borough who have obtained a bachelor's degree or higher.
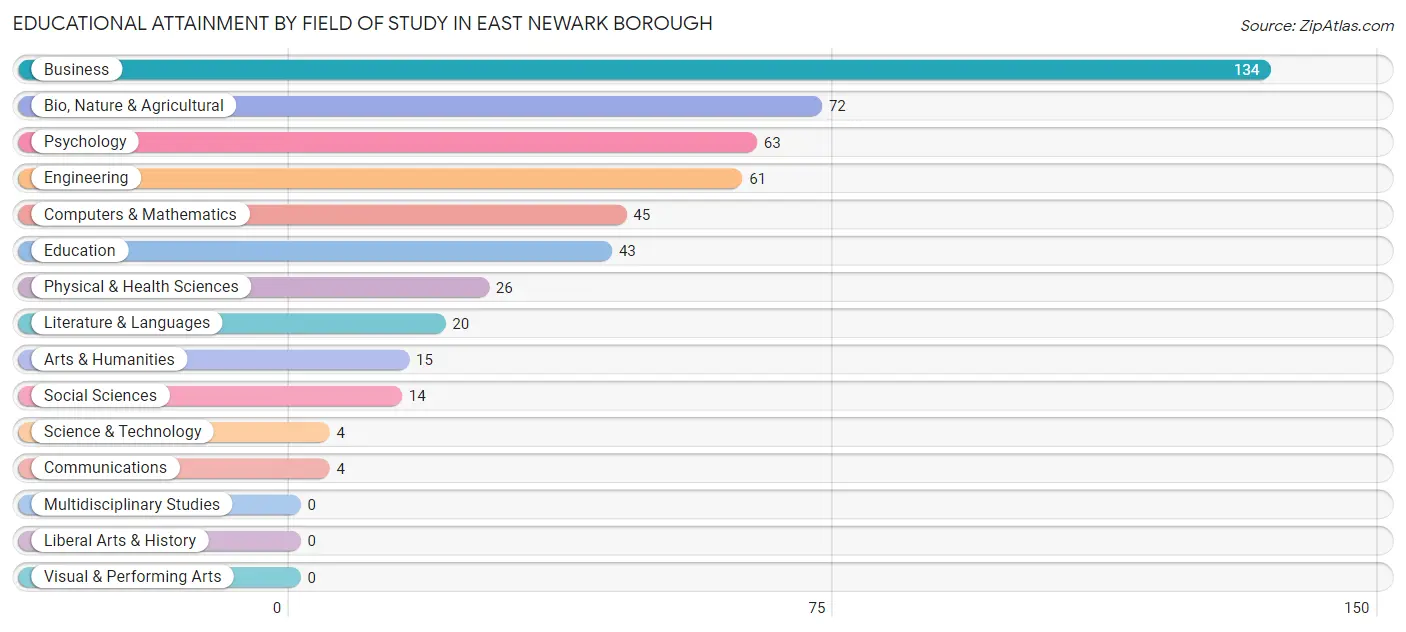
| Field of Study | # Graduates | % Graduates |
| Computers & Mathematics | 45 | 9.0% |
| Bio, Nature & Agricultural | 72 | 14.4% |
| Physical & Health Sciences | 26 | 5.2% |
| Psychology | 63 | 12.6% |
| Social Sciences | 14 | 2.8% |
| Engineering | 61 | 12.2% |
| Multidisciplinary Studies | 0 | 0.0% |
| Science & Technology | 4 | 0.8% |
| Business | 134 | 26.8% |
| Education | 43 | 8.6% |
| Literature & Languages | 20 | 4.0% |
| Liberal Arts & History | 0 | 0.0% |
| Visual & Performing Arts | 0 | 0.0% |
| Communications | 4 | 0.8% |
| Arts & Humanities | 15 | 3.0% |
| Total | 501 | 100.0% |
Transportation & Commute in East Newark borough
Vehicle Availability by Sex in East Newark borough
The most prevalent vehicle ownership categories in East Newark borough are males with 2 vehicles (194, accounting for 29.6%) and females with 2 vehicles (281, making up 27.2%).
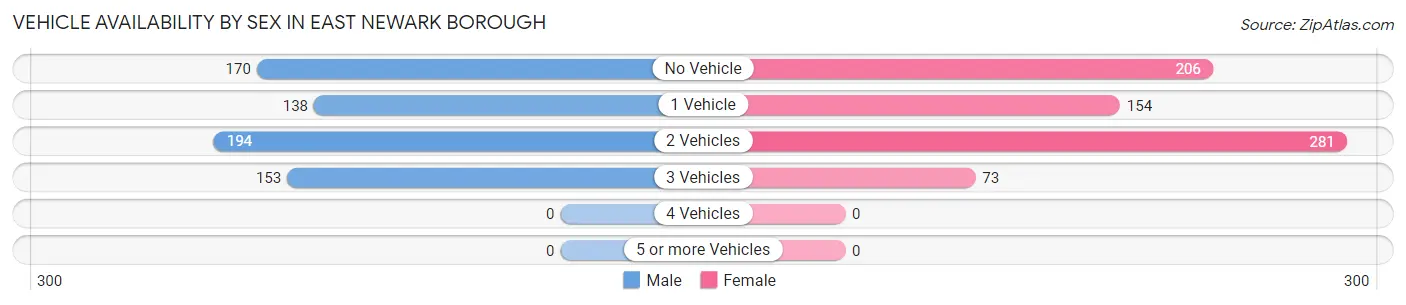
| Vehicles Available | Male | Female |
| No Vehicle | 170 (26.0%) | 206 (28.8%) |
| 1 Vehicle | 138 (21.1%) | 154 (21.6%) |
| 2 Vehicles | 194 (29.6%) | 281 (39.4%) |
| 3 Vehicles | 153 (23.4%) | 73 (10.2%) |
| 4 Vehicles | 0 (0.0%) | 0 (0.0%) |
| 5 or more Vehicles | 0 (0.0%) | 0 (0.0%) |
| Total | 655 (100.0%) | 714 (100.0%) |
Commute Time in East Newark borough
The most frequently occuring commute durations in East Newark borough are 20 to 24 minutes (305 commuters, 25.4%), 30 to 34 minutes (193 commuters, 16.0%), and 10 to 14 minutes (192 commuters, 16.0%).
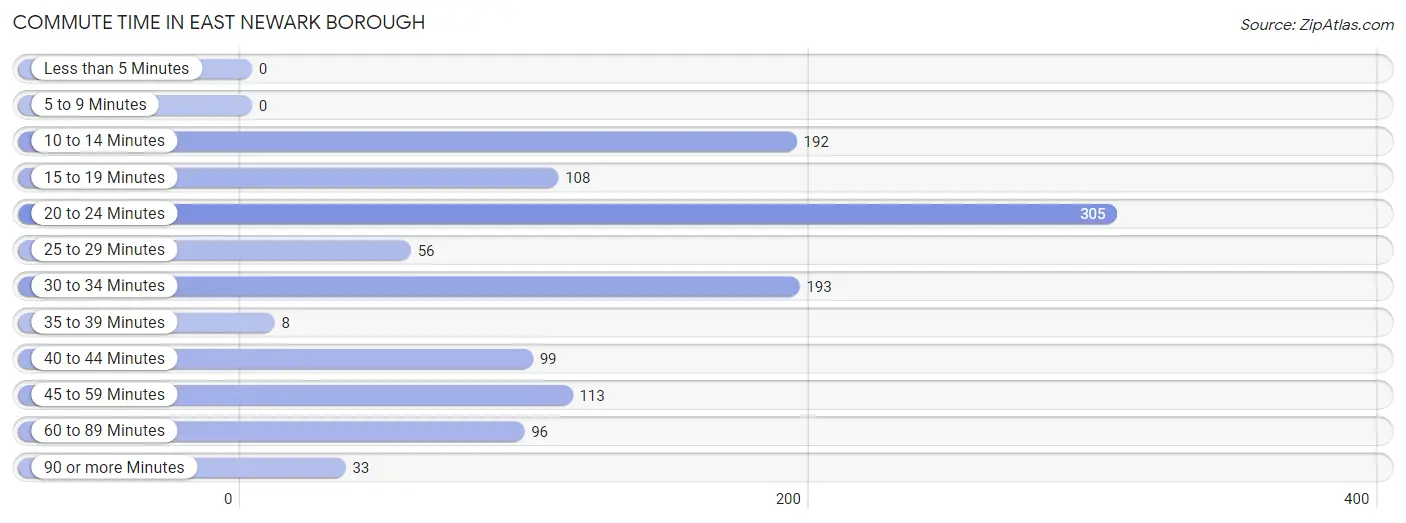
| Commute Time | # Commuters | % Commuters |
| Less than 5 Minutes | 0 | 0.0% |
| 5 to 9 Minutes | 0 | 0.0% |
| 10 to 14 Minutes | 192 | 16.0% |
| 15 to 19 Minutes | 108 | 9.0% |
| 20 to 24 Minutes | 305 | 25.4% |
| 25 to 29 Minutes | 56 | 4.7% |
| 30 to 34 Minutes | 193 | 16.0% |
| 35 to 39 Minutes | 8 | 0.7% |
| 40 to 44 Minutes | 99 | 8.2% |
| 45 to 59 Minutes | 113 | 9.4% |
| 60 to 89 Minutes | 96 | 8.0% |
| 90 or more Minutes | 33 | 2.7% |
Commute Time by Sex in East Newark borough
The most common commute times in East Newark borough are 20 to 24 minutes (210 commuters, 33.8%) for males and 45 to 59 minutes (108 commuters, 18.6%) for females.
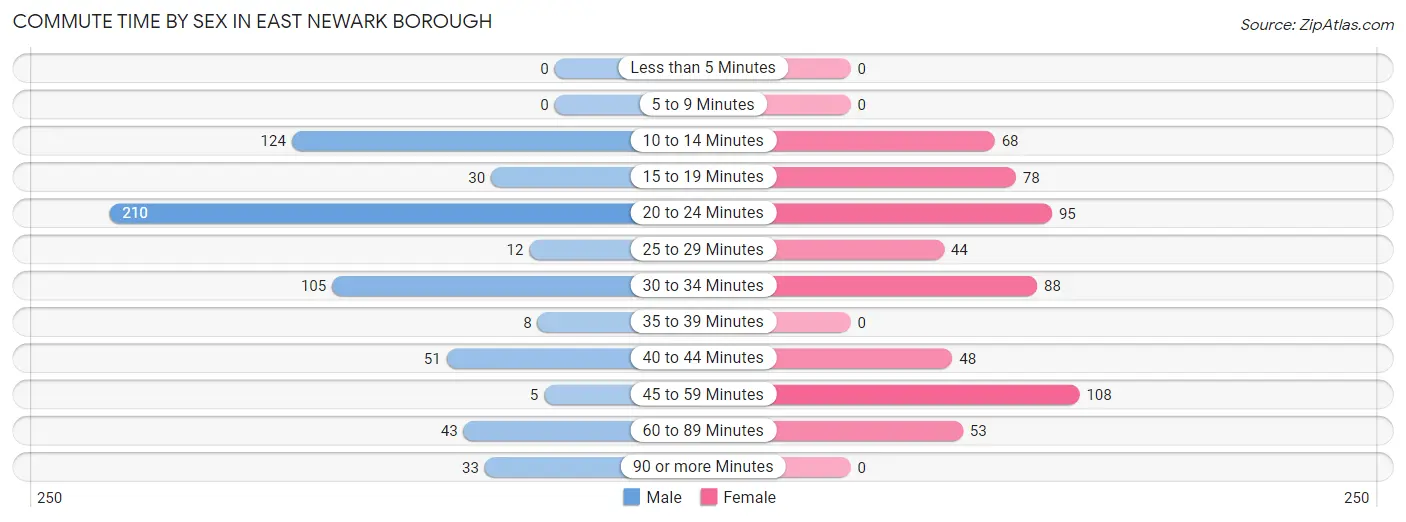
| Commute Time | Male | Female |
| Less than 5 Minutes | 0 (0.0%) | 0 (0.0%) |
| 5 to 9 Minutes | 0 (0.0%) | 0 (0.0%) |
| 10 to 14 Minutes | 124 (20.0%) | 68 (11.7%) |
| 15 to 19 Minutes | 30 (4.8%) | 78 (13.4%) |
| 20 to 24 Minutes | 210 (33.8%) | 95 (16.3%) |
| 25 to 29 Minutes | 12 (1.9%) | 44 (7.6%) |
| 30 to 34 Minutes | 105 (16.9%) | 88 (15.1%) |
| 35 to 39 Minutes | 8 (1.3%) | 0 (0.0%) |
| 40 to 44 Minutes | 51 (8.2%) | 48 (8.3%) |
| 45 to 59 Minutes | 5 (0.8%) | 108 (18.6%) |
| 60 to 89 Minutes | 43 (6.9%) | 53 (9.1%) |
| 90 or more Minutes | 33 (5.3%) | 0 (0.0%) |
Time of Departure to Work by Sex in East Newark borough
The most frequent times of departure to work in East Newark borough are 7:00 AM to 7:29 AM (105, 16.9%) for males and 6:30 AM to 6:59 AM (95, 16.3%) for females.
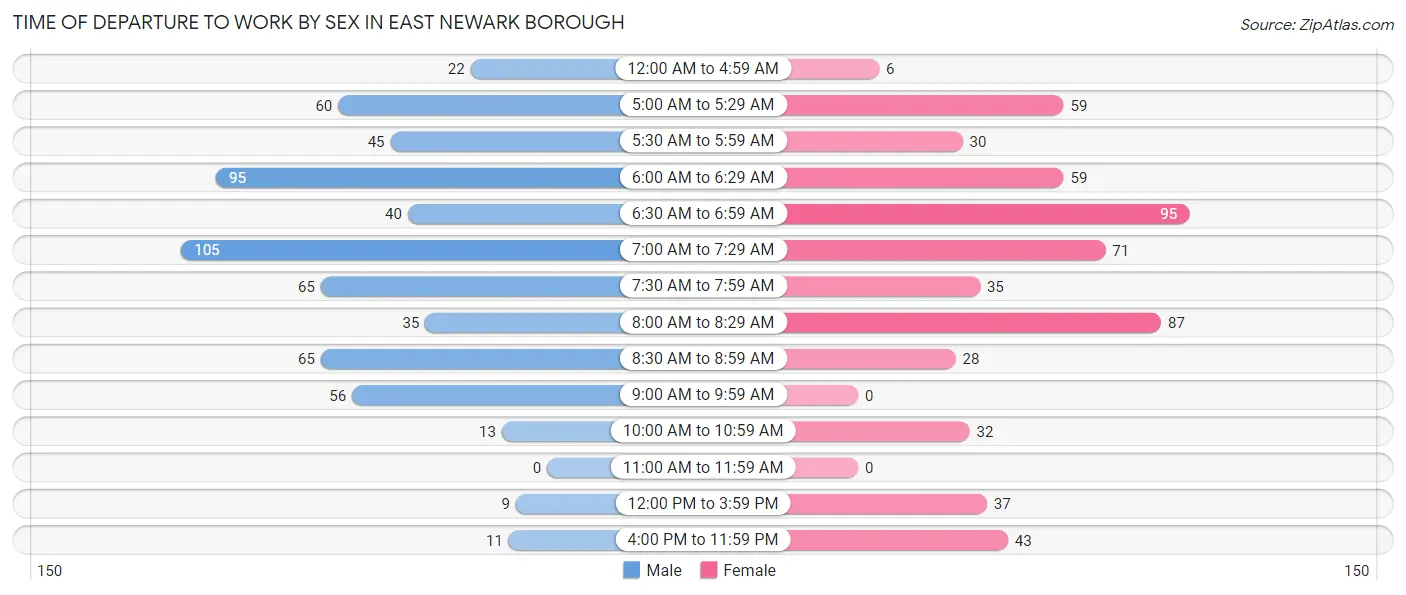
| Time of Departure | Male | Female |
| 12:00 AM to 4:59 AM | 22 (3.5%) | 6 (1.0%) |
| 5:00 AM to 5:29 AM | 60 (9.7%) | 59 (10.1%) |
| 5:30 AM to 5:59 AM | 45 (7.2%) | 30 (5.1%) |
| 6:00 AM to 6:29 AM | 95 (15.3%) | 59 (10.1%) |
| 6:30 AM to 6:59 AM | 40 (6.4%) | 95 (16.3%) |
| 7:00 AM to 7:29 AM | 105 (16.9%) | 71 (12.2%) |
| 7:30 AM to 7:59 AM | 65 (10.5%) | 35 (6.0%) |
| 8:00 AM to 8:29 AM | 35 (5.6%) | 87 (14.9%) |
| 8:30 AM to 8:59 AM | 65 (10.5%) | 28 (4.8%) |
| 9:00 AM to 9:59 AM | 56 (9.0%) | 0 (0.0%) |
| 10:00 AM to 10:59 AM | 13 (2.1%) | 32 (5.5%) |
| 11:00 AM to 11:59 AM | 0 (0.0%) | 0 (0.0%) |
| 12:00 PM to 3:59 PM | 9 (1.5%) | 37 (6.4%) |
| 4:00 PM to 11:59 PM | 11 (1.8%) | 43 (7.4%) |
| Total | 621 (100.0%) | 582 (100.0%) |
Housing Occupancy in East Newark borough
Occupancy by Ownership in East Newark borough
Of the total 846 dwellings in East Newark borough, owner-occupied units account for 277 (32.7%), while renter-occupied units make up 569 (67.3%).
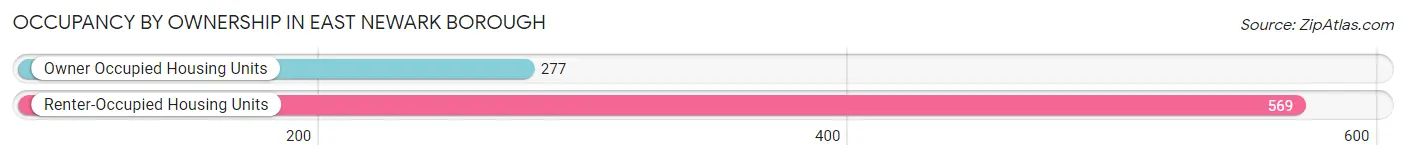
| Occupancy | # Housing Units | % Housing Units |
| Owner Occupied Housing Units | 277 | 32.7% |
| Renter-Occupied Housing Units | 569 | 67.3% |
| Total Occupied Housing Units | 846 | 100.0% |
Occupancy by Household Size in East Newark borough
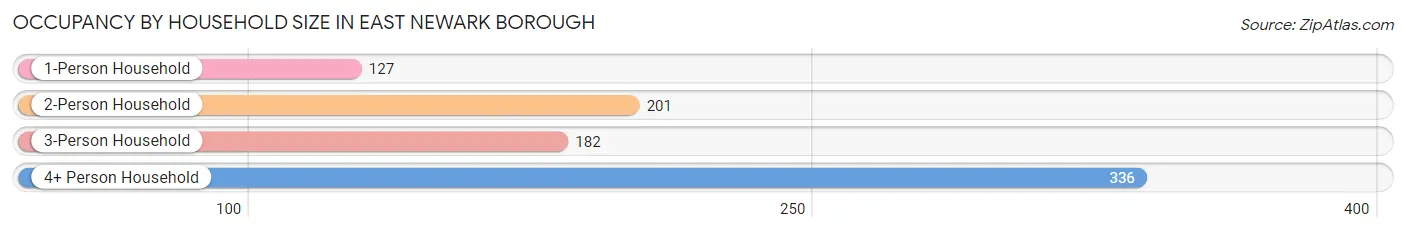
| Household Size | # Housing Units | % Housing Units |
| 1-Person Household | 127 | 15.0% |
| 2-Person Household | 201 | 23.8% |
| 3-Person Household | 182 | 21.5% |
| 4+ Person Household | 336 | 39.7% |
| Total Housing Units | 846 | 100.0% |
Occupancy by Ownership by Household Size in East Newark borough
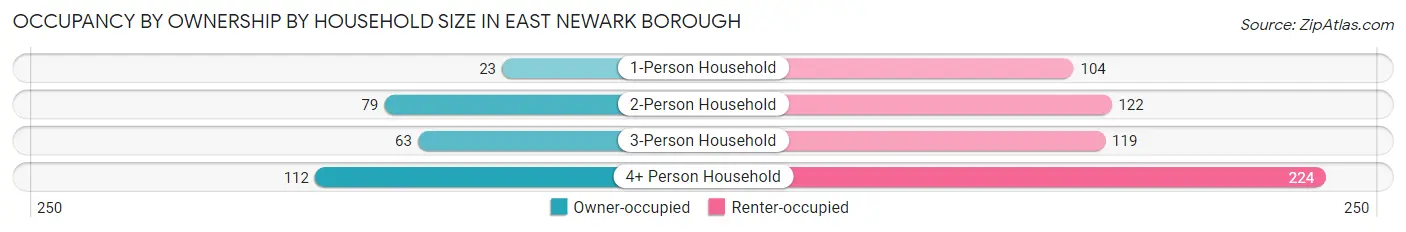
| Household Size | Owner-occupied | Renter-occupied |
| 1-Person Household | 23 (18.1%) | 104 (81.9%) |
| 2-Person Household | 79 (39.3%) | 122 (60.7%) |
| 3-Person Household | 63 (34.6%) | 119 (65.4%) |
| 4+ Person Household | 112 (33.3%) | 224 (66.7%) |
| Total Housing Units | 277 (32.7%) | 569 (67.3%) |
Occupancy by Educational Attainment in East Newark borough
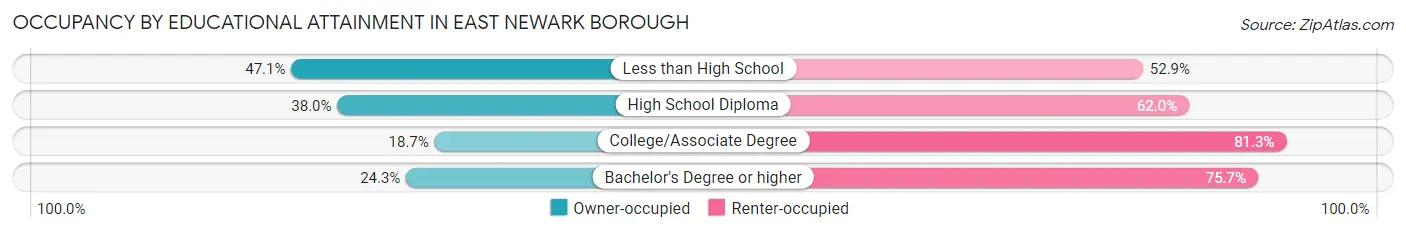
| Household Size | Owner-occupied | Renter-occupied |
| Less than High School | 74 (47.1%) | 83 (52.9%) |
| High School Diploma | 125 (38.0%) | 204 (62.0%) |
| College/Associate Degree | 32 (18.7%) | 139 (81.3%) |
| Bachelor's Degree or higher | 46 (24.3%) | 143 (75.7%) |
Occupancy by Age of Householder in East Newark borough
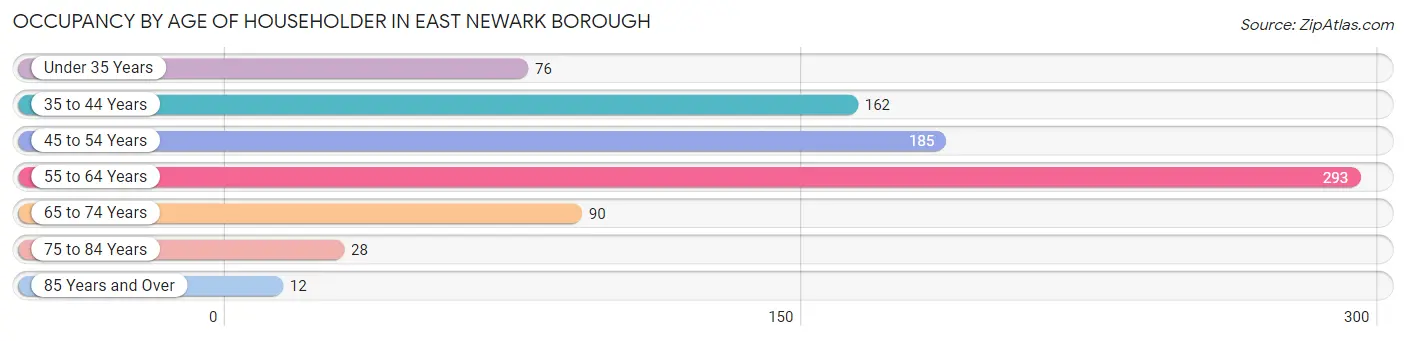
| Age Bracket | # Households | % Households |
| Under 35 Years | 76 | 9.0% |
| 35 to 44 Years | 162 | 19.2% |
| 45 to 54 Years | 185 | 21.9% |
| 55 to 64 Years | 293 | 34.6% |
| 65 to 74 Years | 90 | 10.6% |
| 75 to 84 Years | 28 | 3.3% |
| 85 Years and Over | 12 | 1.4% |
| Total | 846 | 100.0% |
Housing Finances in East Newark borough
Median Income by Occupancy in East Newark borough
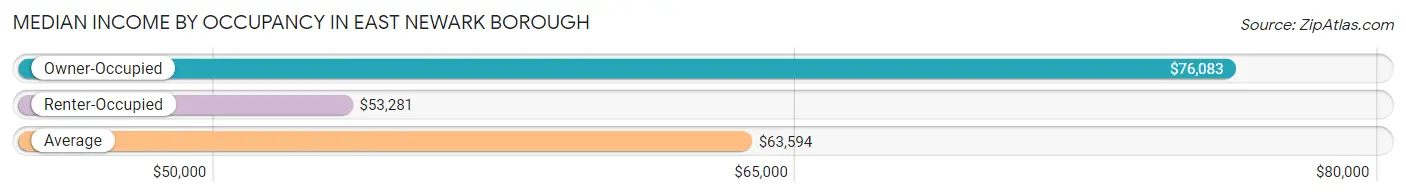
| Occupancy Type | # Households | Median Income |
| Owner-Occupied | 277 (32.7%) | $76,083 |
| Renter-Occupied | 569 (67.3%) | $53,281 |
| Average | 846 (100.0%) | $63,594 |
Occupancy by Householder Income Bracket in East Newark borough
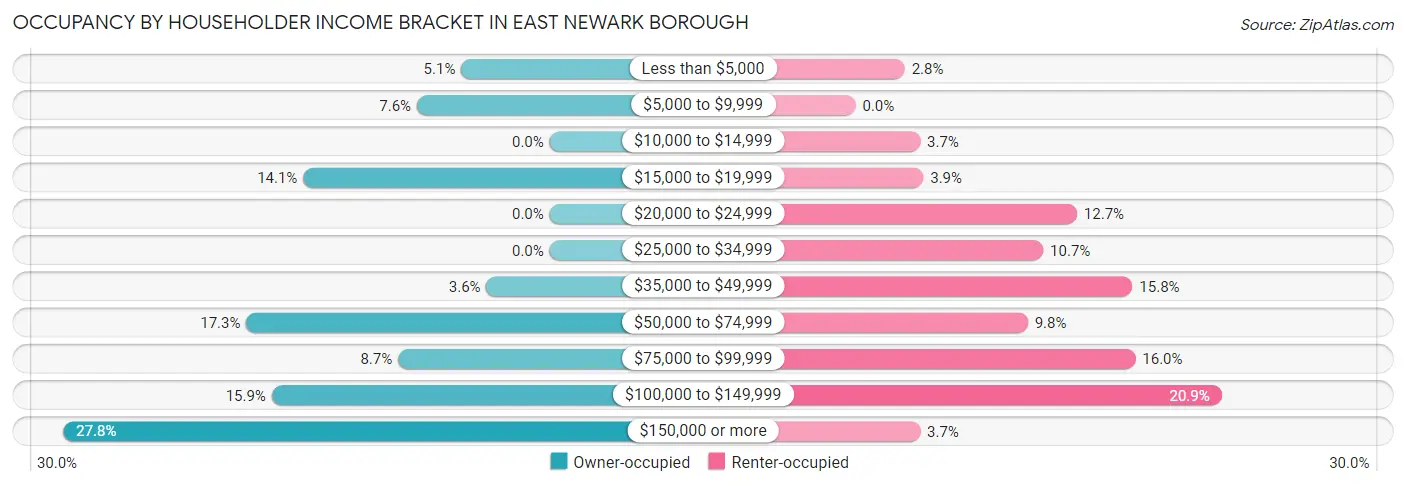
| Income Bracket | Owner-occupied | Renter-occupied |
| Less than $5,000 | 14 (5.1%) | 16 (2.8%) |
| $5,000 to $9,999 | 21 (7.6%) | 0 (0.0%) |
| $10,000 to $14,999 | 0 (0.0%) | 21 (3.7%) |
| $15,000 to $19,999 | 39 (14.1%) | 22 (3.9%) |
| $20,000 to $24,999 | 0 (0.0%) | 72 (12.7%) |
| $25,000 to $34,999 | 0 (0.0%) | 61 (10.7%) |
| $35,000 to $49,999 | 10 (3.6%) | 90 (15.8%) |
| $50,000 to $74,999 | 48 (17.3%) | 56 (9.8%) |
| $75,000 to $99,999 | 24 (8.7%) | 91 (16.0%) |
| $100,000 to $149,999 | 44 (15.9%) | 119 (20.9%) |
| $150,000 or more | 77 (27.8%) | 21 (3.7%) |
| Total | 277 (100.0%) | 569 (100.0%) |
Monthly Housing Cost Tiers in East Newark borough
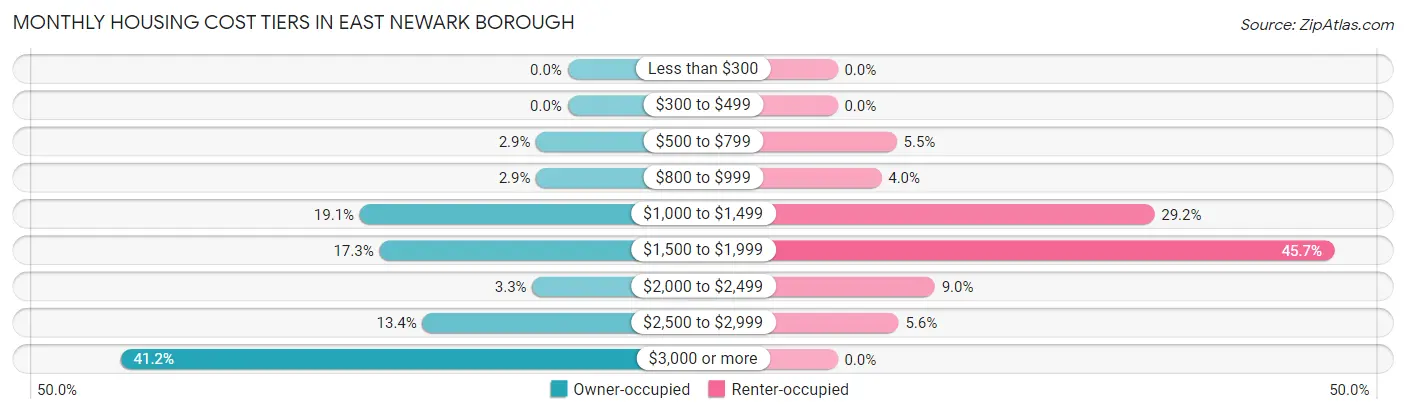
| Monthly Cost | Owner-occupied | Renter-occupied |
| Less than $300 | 0 (0.0%) | 0 (0.0%) |
| $300 to $499 | 0 (0.0%) | 0 (0.0%) |
| $500 to $799 | 8 (2.9%) | 31 (5.4%) |
| $800 to $999 | 8 (2.9%) | 23 (4.0%) |
| $1,000 to $1,499 | 53 (19.1%) | 166 (29.2%) |
| $1,500 to $1,999 | 48 (17.3%) | 260 (45.7%) |
| $2,000 to $2,499 | 9 (3.3%) | 51 (9.0%) |
| $2,500 to $2,999 | 37 (13.4%) | 32 (5.6%) |
| $3,000 or more | 114 (41.2%) | 0 (0.0%) |
| Total | 277 (100.0%) | 569 (100.0%) |
Physical Housing Characteristics in East Newark borough
Housing Structures in East Newark borough
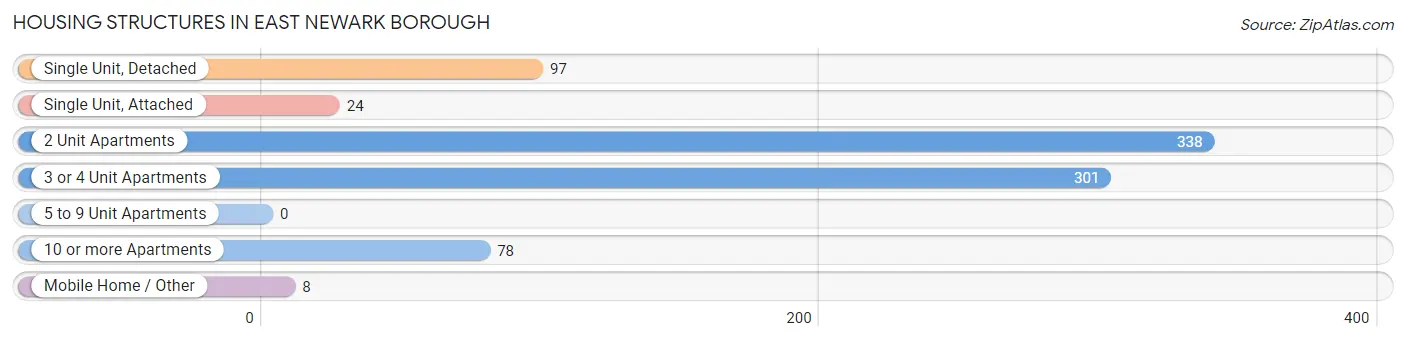
| Structure Type | # Housing Units | % Housing Units |
| Single Unit, Detached | 97 | 11.5% |
| Single Unit, Attached | 24 | 2.8% |
| 2 Unit Apartments | 338 | 40.0% |
| 3 or 4 Unit Apartments | 301 | 35.6% |
| 5 to 9 Unit Apartments | 0 | 0.0% |
| 10 or more Apartments | 78 | 9.2% |
| Mobile Home / Other | 8 | 0.9% |
| Total | 846 | 100.0% |
Housing Structures by Occupancy in East Newark borough
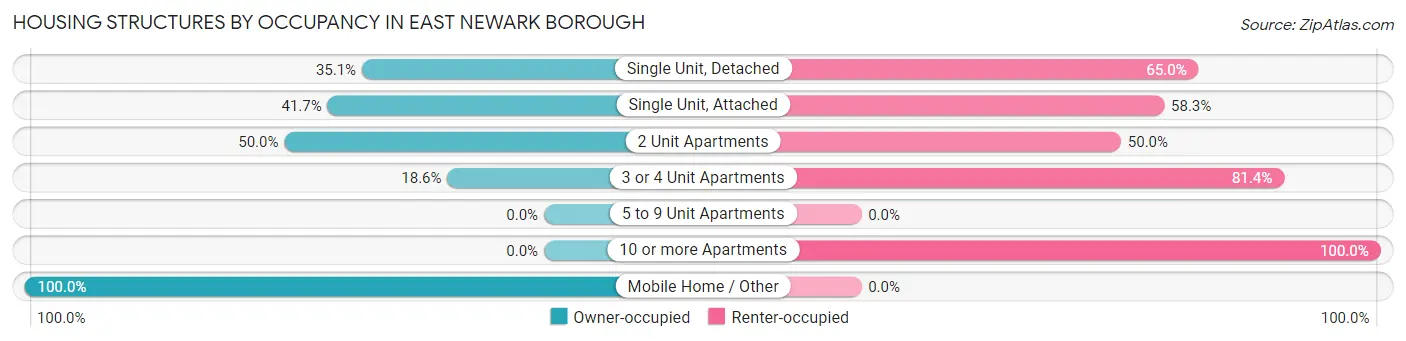
| Structure Type | Owner-occupied | Renter-occupied |
| Single Unit, Detached | 34 (35.0%) | 63 (64.9%) |
| Single Unit, Attached | 10 (41.7%) | 14 (58.3%) |
| 2 Unit Apartments | 169 (50.0%) | 169 (50.0%) |
| 3 or 4 Unit Apartments | 56 (18.6%) | 245 (81.4%) |
| 5 to 9 Unit Apartments | 0 (0.0%) | 0 (0.0%) |
| 10 or more Apartments | 0 (0.0%) | 78 (100.0%) |
| Mobile Home / Other | 8 (100.0%) | 0 (0.0%) |
| Total | 277 (32.7%) | 569 (67.3%) |
Housing Structures by Number of Rooms in East Newark borough
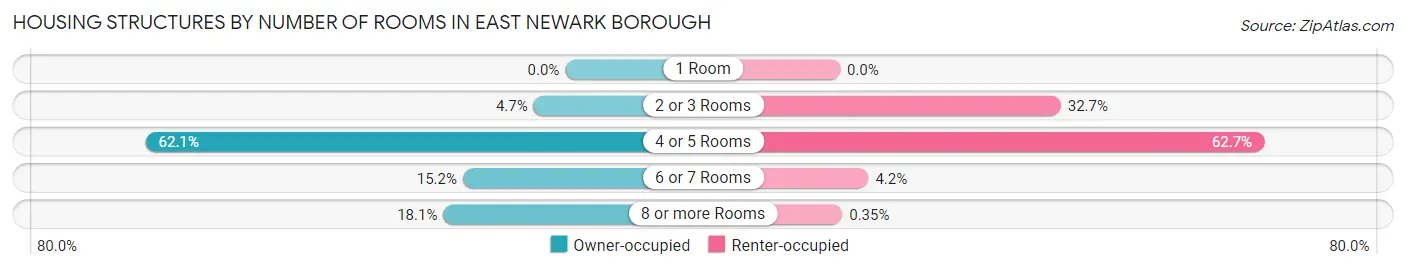
| Number of Rooms | Owner-occupied | Renter-occupied |
| 1 Room | 0 (0.0%) | 0 (0.0%) |
| 2 or 3 Rooms | 13 (4.7%) | 186 (32.7%) |
| 4 or 5 Rooms | 172 (62.1%) | 357 (62.7%) |
| 6 or 7 Rooms | 42 (15.2%) | 24 (4.2%) |
| 8 or more Rooms | 50 (18.0%) | 2 (0.4%) |
| Total | 277 (100.0%) | 569 (100.0%) |
Housing Structure by Heating Type in East Newark borough
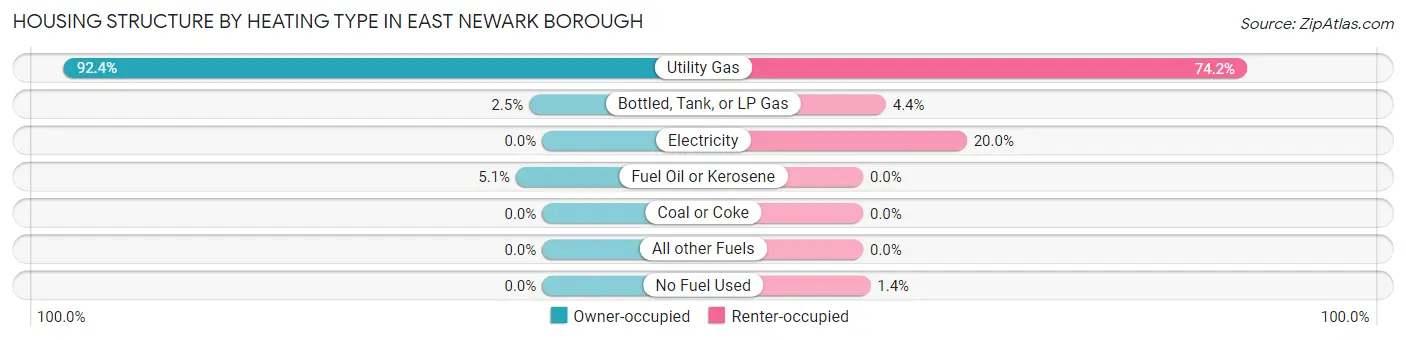
| Heating Type | Owner-occupied | Renter-occupied |
| Utility Gas | 256 (92.4%) | 422 (74.2%) |
| Bottled, Tank, or LP Gas | 7 (2.5%) | 25 (4.4%) |
| Electricity | 0 (0.0%) | 114 (20.0%) |
| Fuel Oil or Kerosene | 14 (5.1%) | 0 (0.0%) |
| Coal or Coke | 0 (0.0%) | 0 (0.0%) |
| All other Fuels | 0 (0.0%) | 0 (0.0%) |
| No Fuel Used | 0 (0.0%) | 8 (1.4%) |
| Total | 277 (100.0%) | 569 (100.0%) |
Household Vehicle Usage in East Newark borough
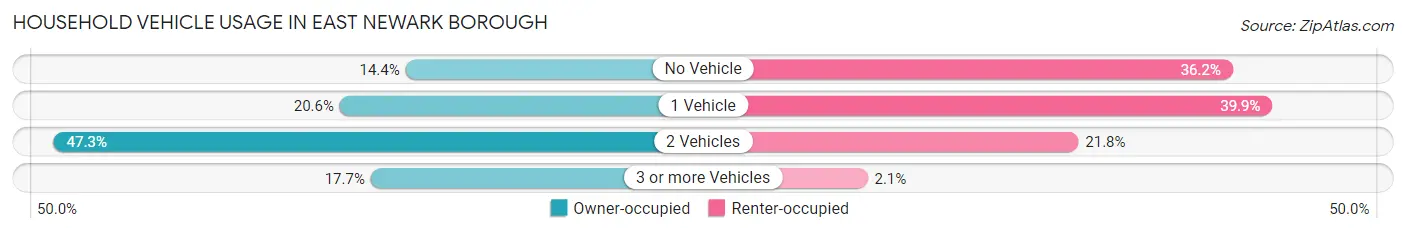
| Vehicles per Household | Owner-occupied | Renter-occupied |
| No Vehicle | 40 (14.4%) | 206 (36.2%) |
| 1 Vehicle | 57 (20.6%) | 227 (39.9%) |
| 2 Vehicles | 131 (47.3%) | 124 (21.8%) |
| 3 or more Vehicles | 49 (17.7%) | 12 (2.1%) |
| Total | 277 (100.0%) | 569 (100.0%) |
Real Estate & Mortgages in East Newark borough
Real Estate and Mortgage Overview in East Newark borough
| Characteristic | Without Mortgage | With Mortgage |
| Housing Units | 78 | 199 |
| Median Property Value | $300,000 | $317,500 |
| Median Household Income | $66,875 | $70 |
| Monthly Housing Costs | $1,133 | $114 |
| Real Estate Taxes | $7,697 | $15 |
Property Value by Mortgage Status in East Newark borough
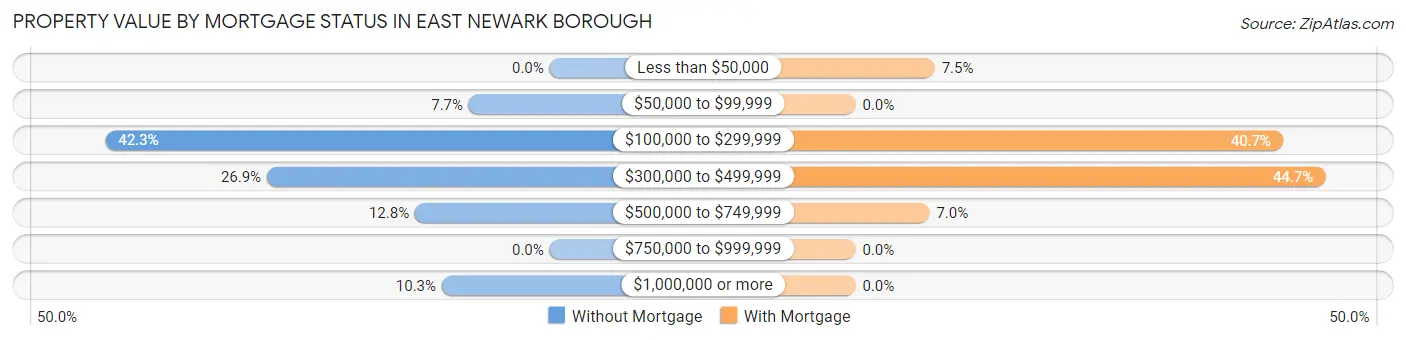
| Property Value | Without Mortgage | With Mortgage |
| Less than $50,000 | 0 (0.0%) | 15 (7.5%) |
| $50,000 to $99,999 | 6 (7.7%) | 0 (0.0%) |
| $100,000 to $299,999 | 33 (42.3%) | 81 (40.7%) |
| $300,000 to $499,999 | 21 (26.9%) | 89 (44.7%) |
| $500,000 to $749,999 | 10 (12.8%) | 14 (7.0%) |
| $750,000 to $999,999 | 0 (0.0%) | 0 (0.0%) |
| $1,000,000 or more | 8 (10.3%) | 0 (0.0%) |
| Total | 78 (100.0%) | 199 (100.0%) |
Household Income by Mortgage Status in East Newark borough
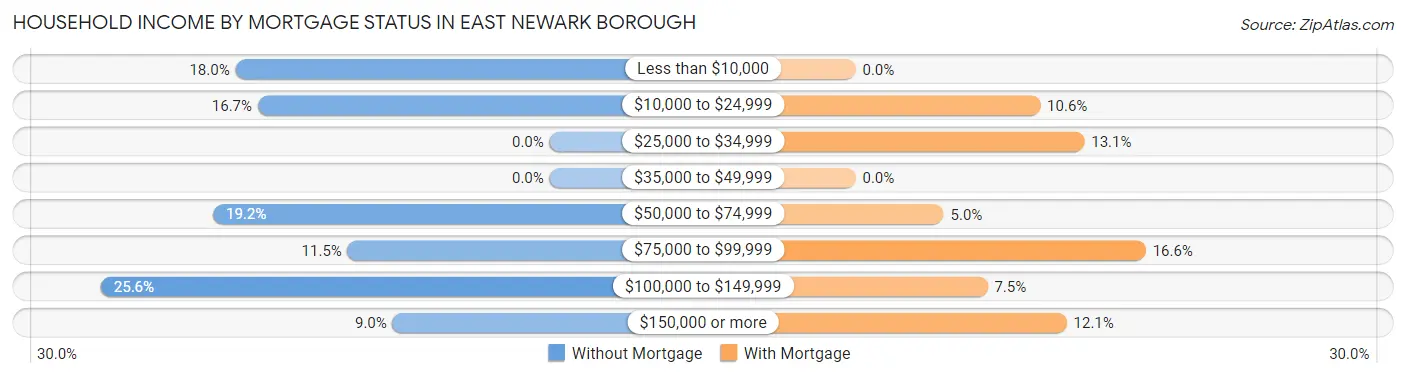
| Household Income | Without Mortgage | With Mortgage |
| Less than $10,000 | 14 (17.9%) | 0 (0.0%) |
| $10,000 to $24,999 | 13 (16.7%) | 21 (10.5%) |
| $25,000 to $34,999 | 0 (0.0%) | 26 (13.1%) |
| $35,000 to $49,999 | 0 (0.0%) | 0 (0.0%) |
| $50,000 to $74,999 | 15 (19.2%) | 10 (5.0%) |
| $75,000 to $99,999 | 9 (11.5%) | 33 (16.6%) |
| $100,000 to $149,999 | 20 (25.6%) | 15 (7.5%) |
| $150,000 or more | 7 (9.0%) | 24 (12.1%) |
| Total | 78 (100.0%) | 199 (100.0%) |
Property Value to Household Income Ratio in East Newark borough
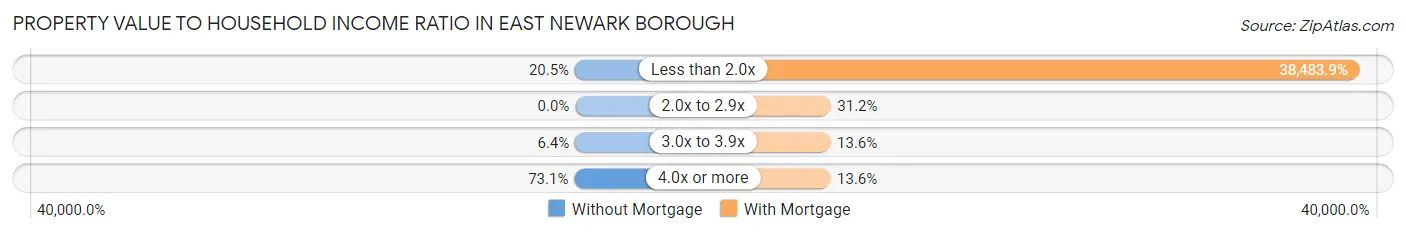
| Value-to-Income Ratio | Without Mortgage | With Mortgage |
| Less than 2.0x | 16 (20.5%) | 76,583 (38,483.9%) |
| 2.0x to 2.9x | 0 (0.0%) | 62 (31.2%) |
| 3.0x to 3.9x | 5 (6.4%) | 27 (13.6%) |
| 4.0x or more | 57 (73.1%) | 27 (13.6%) |
| Total | 78 (100.0%) | 199 (100.0%) |
Real Estate Taxes by Mortgage Status in East Newark borough
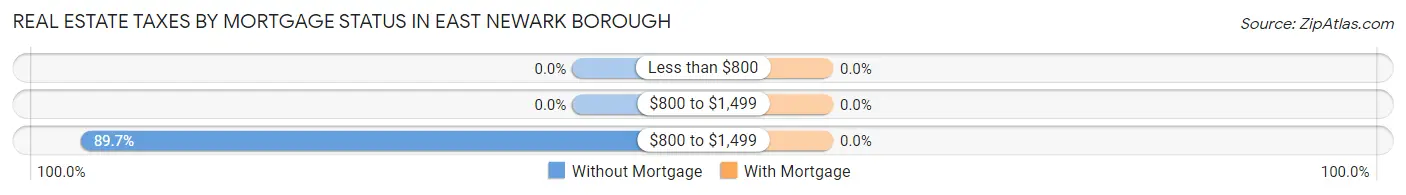
| Property Taxes | Without Mortgage | With Mortgage |
| Less than $800 | 0 (0.0%) | 0 (0.0%) |
| $800 to $1,499 | 0 (0.0%) | 0 (0.0%) |
| $800 to $1,499 | 70 (89.7%) | 0 (0.0%) |
| Total | 78 (100.0%) | 199 (100.0%) |
Health & Disability in East Newark borough
Health Insurance Coverage by Age in East Newark borough
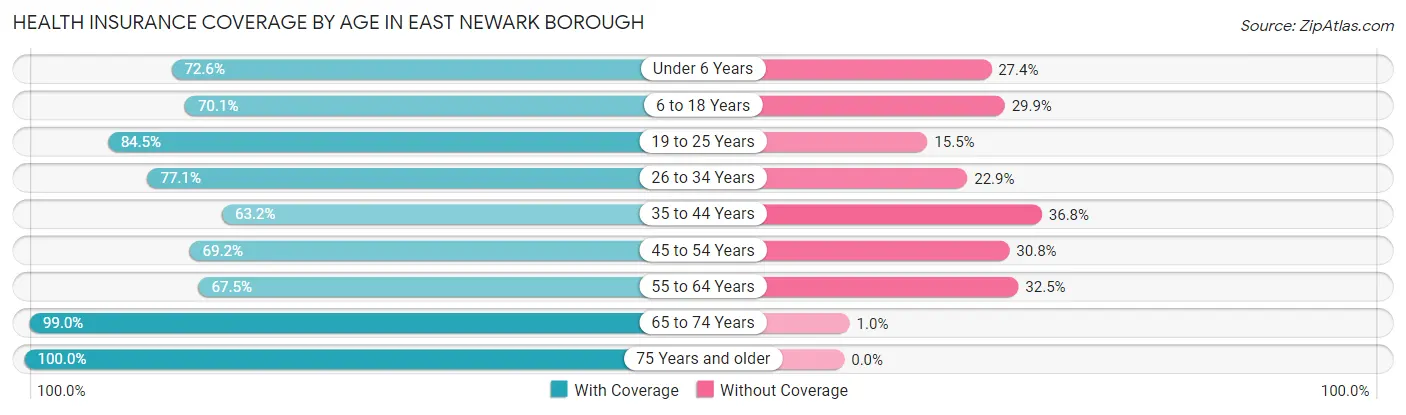
| Age Bracket | With Coverage | Without Coverage |
| Under 6 Years | 106 (72.6%) | 40 (27.4%) |
| 6 to 18 Years | 328 (70.1%) | 140 (29.9%) |
| 19 to 25 Years | 169 (84.5%) | 31 (15.5%) |
| 26 to 34 Years | 215 (77.1%) | 64 (22.9%) |
| 35 to 44 Years | 300 (63.2%) | 175 (36.8%) |
| 45 to 54 Years | 263 (69.2%) | 117 (30.8%) |
| 55 to 64 Years | 312 (67.5%) | 150 (32.5%) |
| 65 to 74 Years | 199 (99.0%) | 2 (1.0%) |
| 75 Years and older | 107 (100.0%) | 0 (0.0%) |
| Total | 1,999 (73.6%) | 719 (26.5%) |
Health Insurance Coverage by Citizenship Status in East Newark borough
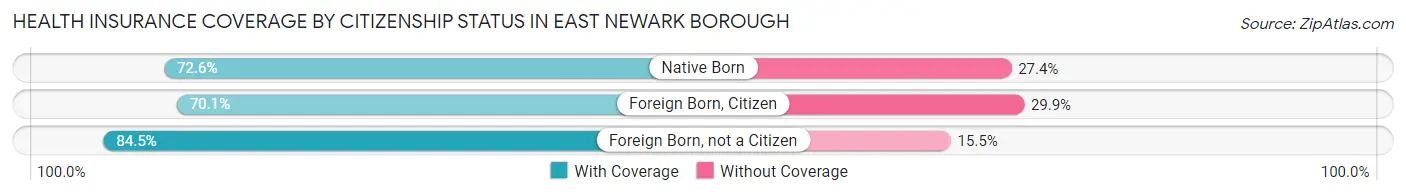
| Citizenship Status | With Coverage | Without Coverage |
| Native Born | 106 (72.6%) | 40 (27.4%) |
| Foreign Born, Citizen | 328 (70.1%) | 140 (29.9%) |
| Foreign Born, not a Citizen | 169 (84.5%) | 31 (15.5%) |
Health Insurance Coverage by Household Income in East Newark borough
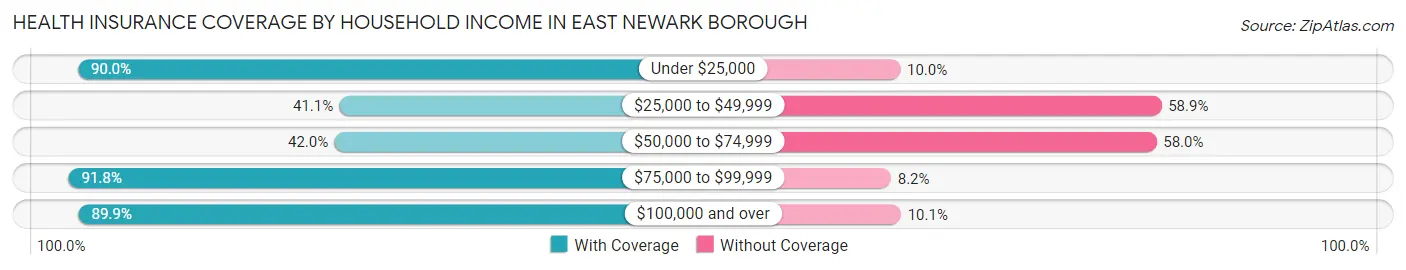
| Household Income | With Coverage | Without Coverage |
| Under $25,000 | 487 (90.0%) | 54 (10.0%) |
| $25,000 to $49,999 | 173 (41.1%) | 248 (58.9%) |
| $50,000 to $74,999 | 216 (42.0%) | 298 (58.0%) |
| $75,000 to $99,999 | 323 (91.8%) | 29 (8.2%) |
| $100,000 and over | 800 (89.9%) | 90 (10.1%) |
Public vs Private Health Insurance Coverage by Age in East Newark borough
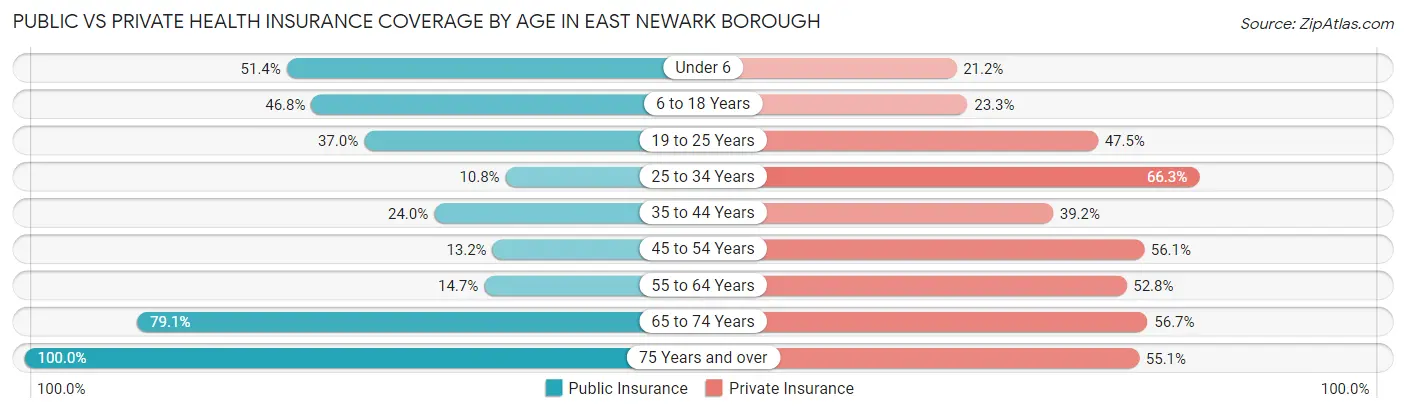
| Age Bracket | Public Insurance | Private Insurance |
| Under 6 | 75 (51.4%) | 31 (21.2%) |
| 6 to 18 Years | 219 (46.8%) | 109 (23.3%) |
| 19 to 25 Years | 74 (37.0%) | 95 (47.5%) |
| 25 to 34 Years | 30 (10.7%) | 185 (66.3%) |
| 35 to 44 Years | 114 (24.0%) | 186 (39.2%) |
| 45 to 54 Years | 50 (13.2%) | 213 (56.0%) |
| 55 to 64 Years | 68 (14.7%) | 244 (52.8%) |
| 65 to 74 Years | 159 (79.1%) | 114 (56.7%) |
| 75 Years and over | 107 (100.0%) | 59 (55.1%) |
| Total | 896 (33.0%) | 1,236 (45.5%) |
Disability Status by Sex by Age in East Newark borough
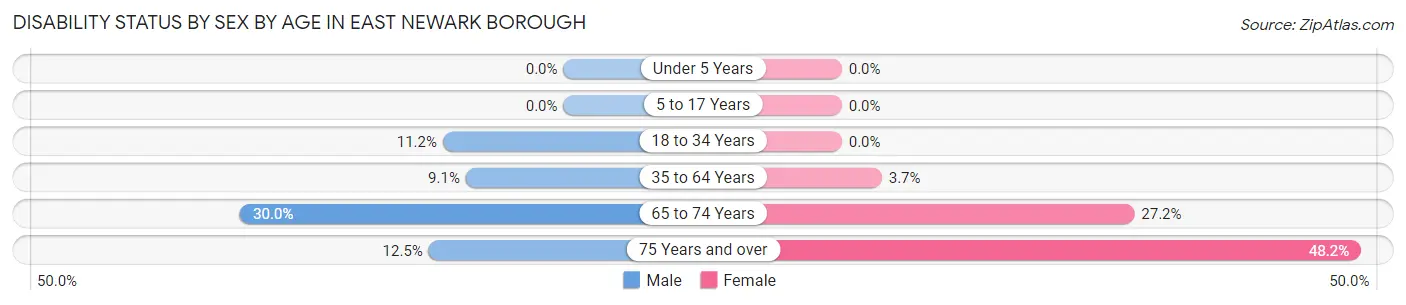
| Age Bracket | Male | Female |
| Under 5 Years | 0 (0.0%) | 0 (0.0%) |
| 5 to 17 Years | 0 (0.0%) | 0 (0.0%) |
| 18 to 34 Years | 31 (11.2%) | 0 (0.0%) |
| 35 to 64 Years | 51 (9.1%) | 28 (3.7%) |
| 65 to 74 Years | 15 (30.0%) | 41 (27.2%) |
| 75 Years and over | 3 (12.5%) | 40 (48.2%) |
Disability Class by Sex by Age in East Newark borough
Disability Class: Hearing Difficulty
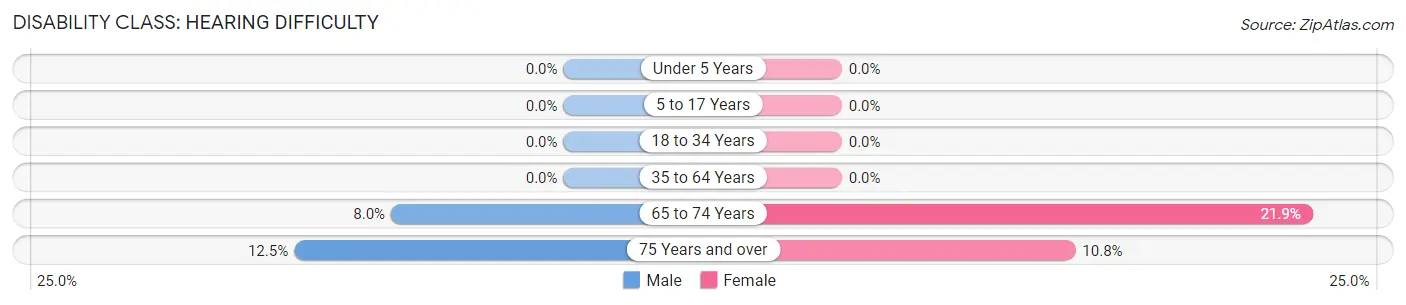
| Age Bracket | Male | Female |
| Under 5 Years | 0 (0.0%) | 0 (0.0%) |
| 5 to 17 Years | 0 (0.0%) | 0 (0.0%) |
| 18 to 34 Years | 0 (0.0%) | 0 (0.0%) |
| 35 to 64 Years | 0 (0.0%) | 0 (0.0%) |
| 65 to 74 Years | 4 (8.0%) | 33 (21.8%) |
| 75 Years and over | 3 (12.5%) | 9 (10.8%) |
Disability Class: Vision Difficulty
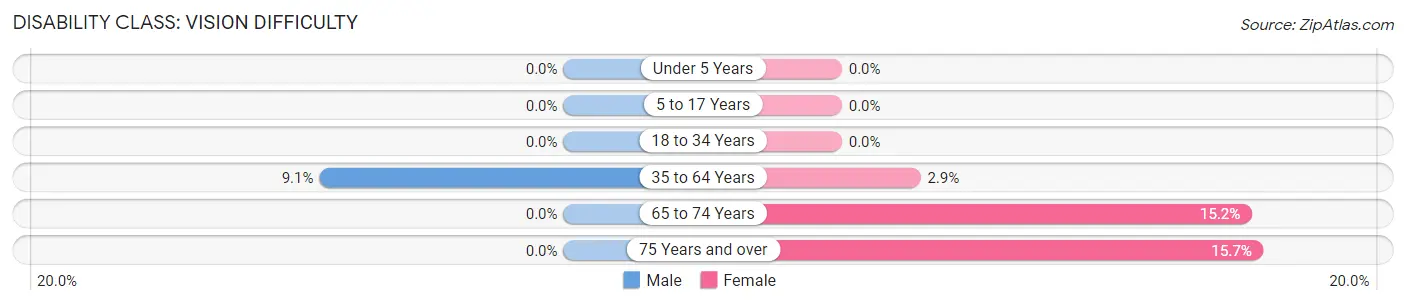
| Age Bracket | Male | Female |
| Under 5 Years | 0 (0.0%) | 0 (0.0%) |
| 5 to 17 Years | 0 (0.0%) | 0 (0.0%) |
| 18 to 34 Years | 0 (0.0%) | 0 (0.0%) |
| 35 to 64 Years | 51 (9.1%) | 22 (2.9%) |
| 65 to 74 Years | 0 (0.0%) | 23 (15.2%) |
| 75 Years and over | 0 (0.0%) | 13 (15.7%) |
Disability Class: Cognitive Difficulty
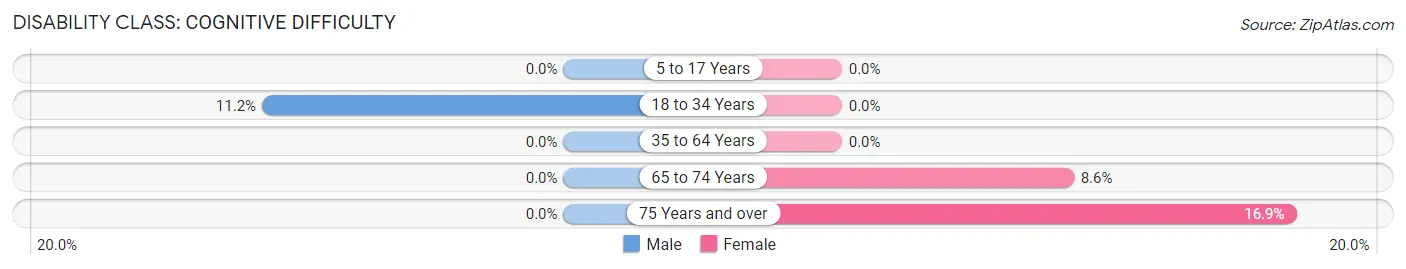
| Age Bracket | Male | Female |
| 5 to 17 Years | 0 (0.0%) | 0 (0.0%) |
| 18 to 34 Years | 31 (11.2%) | 0 (0.0%) |
| 35 to 64 Years | 0 (0.0%) | 0 (0.0%) |
| 65 to 74 Years | 0 (0.0%) | 13 (8.6%) |
| 75 Years and over | 0 (0.0%) | 14 (16.9%) |
Disability Class: Ambulatory Difficulty
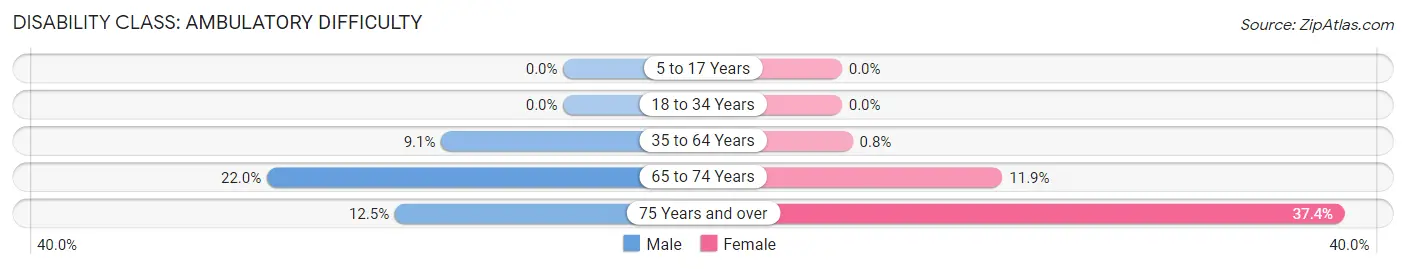
| Age Bracket | Male | Female |
| 5 to 17 Years | 0 (0.0%) | 0 (0.0%) |
| 18 to 34 Years | 0 (0.0%) | 0 (0.0%) |
| 35 to 64 Years | 51 (9.1%) | 6 (0.8%) |
| 65 to 74 Years | 11 (22.0%) | 18 (11.9%) |
| 75 Years and over | 3 (12.5%) | 31 (37.3%) |
Disability Class: Self-Care Difficulty
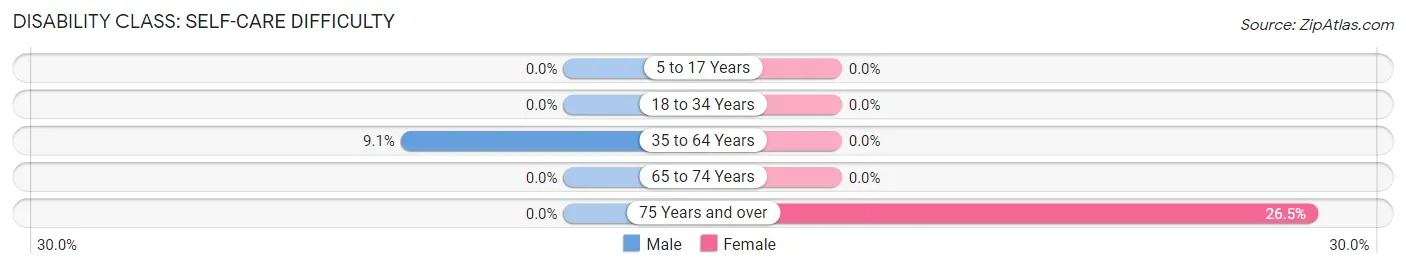
| Age Bracket | Male | Female |
| 5 to 17 Years | 0 (0.0%) | 0 (0.0%) |
| 18 to 34 Years | 0 (0.0%) | 0 (0.0%) |
| 35 to 64 Years | 51 (9.1%) | 0 (0.0%) |
| 65 to 74 Years | 0 (0.0%) | 0 (0.0%) |
| 75 Years and over | 0 (0.0%) | 22 (26.5%) |
Technology Access in East Newark borough
Computing Device Access in East Newark borough
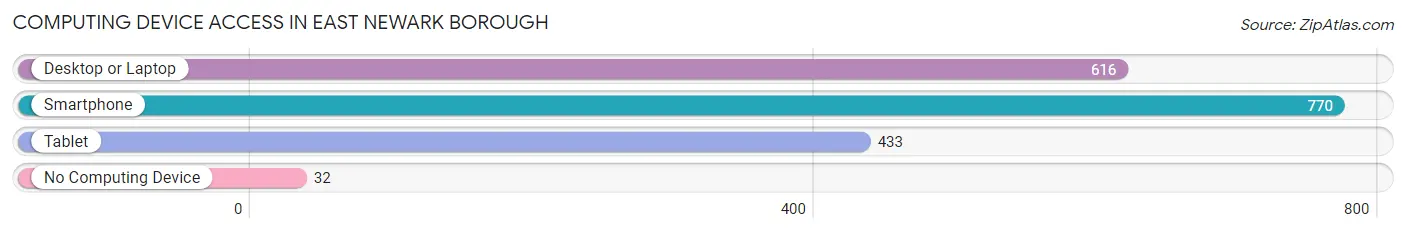
| Device Type | # Households | % Households |
| Desktop or Laptop | 616 | 72.8% |
| Smartphone | 770 | 91.0% |
| Tablet | 433 | 51.2% |
| No Computing Device | 32 | 3.8% |
| Total | 846 | 100.0% |
Internet Access in East Newark borough
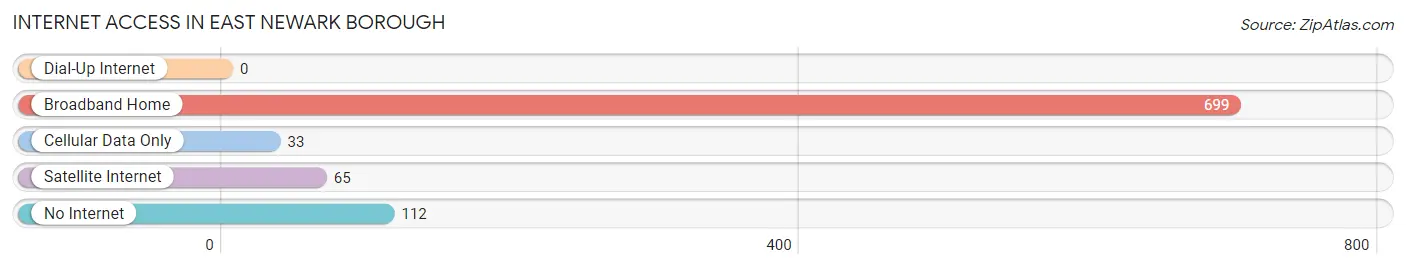
| Internet Type | # Households | % Households |
| Dial-Up Internet | 0 | 0.0% |
| Broadband Home | 699 | 82.6% |
| Cellular Data Only | 33 | 3.9% |
| Satellite Internet | 65 | 7.7% |
| No Internet | 112 | 13.2% |
| Total | 846 | 100.0% |
East Newark borough Summary
History
East Newark Borough is a small town located in Hudson County, New Jersey. It is bordered by the cities of Newark and Harrison, and is part of the New York metropolitan area. The town was originally part of the Township of Harrison, which was incorporated in 1840. In 1895, East Newark was incorporated as a separate borough.
The area was first settled by Dutch and English settlers in the early 1700s. The area was known as the “Dutch Neck” and was part of the Township of Harrison. The area was primarily agricultural, with farms and orchards. In the late 1800s, the area began to industrialize, with factories and warehouses being built. The area was also home to a large Italian-American population, which was drawn to the area by the industrial jobs.
The town was officially incorporated in 1895, and the first mayor was elected in 1896. The town was primarily residential, with a few small businesses. The town was also home to a large Italian-American population, which was drawn to the area by the industrial jobs.
In the early 1900s, the town began to experience a population boom, as more people moved to the area. The population peaked in the 1950s, when the town had a population of over 10,000. Since then, the population has declined, and the town now has a population of about 5,000.
Geography
East Newark is located in Hudson County, New Jersey. It is bordered by the cities of Newark and Harrison, and is part of the New York metropolitan area. The town is located on the Passaic River, and is about 5 miles from the Hudson River.
The town has a total area of 0.7 square miles, all of which is land. The town is mostly flat, with some hills in the northern part of town. The town is located in a humid subtropical climate zone, with hot, humid summers and cold, wet winters.
Economy
East Newark’s economy is primarily based on small businesses and manufacturing. The town is home to several small businesses, including restaurants, retail stores, and professional services. The town is also home to several manufacturing companies, including a steel mill and a paper mill.
The town is also home to several large employers, including the Port Authority of New York and New Jersey, which operates the nearby Newark Liberty International Airport. The airport is a major economic driver for the town, providing jobs and economic activity.
Demographics
As of the 2010 census, the town had a population of 5,039. The population is primarily white (76.2%), with a large Hispanic population (17.3%). The town also has a small African American population (3.2%) and a small Asian population (2.3%).
The median household income in the town is $50,945, and the median family income is $60,945. The town has a poverty rate of 11.3%, which is slightly higher than the national average.
Conclusion
East Newark Borough is a small town located in Hudson County, New Jersey. It is bordered by the cities of Newark and Harrison, and is part of the New York metropolitan area. The town was originally part of the Township of Harrison, which was incorporated in 1840. In 1895, East Newark was incorporated as a separate borough. The town has a population of 5,039, and is primarily white (76.2%), with a large Hispanic population (17.3%). The town’s economy is primarily based on small businesses and manufacturing, and the town is home to several large employers, including the Port Authority of New York and New Jersey. The town has a median household income of $50,945, and a poverty rate of 11.3%.
Common Questions
What is Per Capita Income in East Newark borough?
Per Capita income in East Newark borough is $27,315.
What is the Median Family Income in East Newark borough?
Median Family Income in East Newark borough is $53,750.
What is the Median Household income in East Newark borough?
Median Household Income in East Newark borough is $63,594.
What is Income or Wage Gap in East Newark borough?
Income or Wage Gap in East Newark borough is 54.5%.
Women in East Newark borough earn 45.5 cents for every dollar earned by a man.
What is Family Income Deficit in East Newark borough?
Family Income Deficit in East Newark borough is $7,375.
Families that are below poverty line in East Newark borough earn $7,375 less on average than the poverty threshold level.
What is Inequality or Gini Index in East Newark borough?
Inequality or Gini Index in East Newark borough is 0.51.
What is the Total Population of East Newark borough?
Total Population of East Newark borough is 2,718.
What is the Total Male Population of East Newark borough?
Total Male Population of East Newark borough is 1,243.
What is the Total Female Population of East Newark borough?
Total Female Population of East Newark borough is 1,475.
What is the Ratio of Males per 100 Females in East Newark borough?
There are 84.27 Males per 100 Females in East Newark borough.
What is the Ratio of Females per 100 Males in East Newark borough?
There are 118.66 Females per 100 Males in East Newark borough.
What is the Median Population Age in East Newark borough?
Median Population Age in East Newark borough is 39.3 Years.
What is the Average Family Size in East Newark borough
Average Family Size in East Newark borough is 3.0 People.
What is the Average Household Size in East Newark borough
Average Household Size in East Newark borough is 3.2 People.
How Large is the Labor Force in East Newark borough?
There are 1,504 People in the Labor Forcein in East Newark borough.
What is the Percentage of People in the Labor Force in East Newark borough?
67.7% of People are in the Labor Force in East Newark borough.
What is the Unemployment Rate in East Newark borough?
Unemployment Rate in East Newark borough is 8.2%.