Ridgefield borough, NJ Map & Demographics
Ridgefield borough Overview
$45,604
PER CAPITA INCOME
$112,377
AVG FAMILY INCOME
$105,609
AVG HOUSEHOLD INCOME
30.9%
WAGE / INCOME GAP [ % ]
69.1¢/ $1
WAGE / INCOME GAP [ $ ]
0.42
INEQUALITY / GINI INDEX
11,465
TOTAL POPULATION
5,582
MALE POPULATION
5,883
FEMALE POPULATION
94.88
MALES / 100 FEMALES
105.39
FEMALES / 100 MALES
41.2
MEDIAN AGE
3.2
AVG FAMILY SIZE
2.8
AVG HOUSEHOLD SIZE
6,569
LABOR FORCE [ PEOPLE ]
67.1%
PERCENT IN LABOR FORCE
6.9%
UNEMPLOYMENT RATE
Income in Ridgefield borough
Income Overview in Ridgefield borough
Per Capita Income in Ridgefield borough is $45,604, while median incomes of families and households are $112,377 and $105,609 respectively.
| Characteristic | Number | Measure |
| Per Capita Income | 11,465 | $45,604 |
| Median Family Income | 3,105 | $112,377 |
| Mean Family Income | 3,105 | $141,418 |
| Median Household Income | 4,028 | $105,609 |
| Mean Household Income | 4,028 | $128,594 |
| Income Deficit | 3,105 | $0 |
| Wage / Income Gap (%) | 11,465 | 30.90% |
| Wage / Income Gap ($) | 11,465 | 69.10¢ per $1 |
| Gini / Inequality Index | 11,465 | 0.42 |
Earnings by Sex in Ridgefield borough
Average Earnings in Ridgefield borough are $50,678, $57,020 for men and $39,400 for women, a difference of 30.9%.
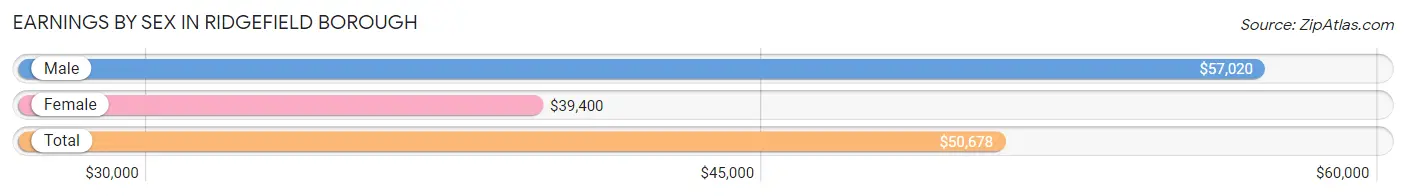
| Sex | Number | Average Earnings |
| Male | 3,199 (48.5%) | $57,020 |
| Female | 3,396 (51.5%) | $39,400 |
| Total | 6,595 (100.0%) | $50,678 |
Earnings by Sex by Income Bracket in Ridgefield borough
The most common earnings brackets in Ridgefield borough are $100,000+ for men (859 | 26.9%) and $75,000 to $99,999 for women (521 | 15.3%).
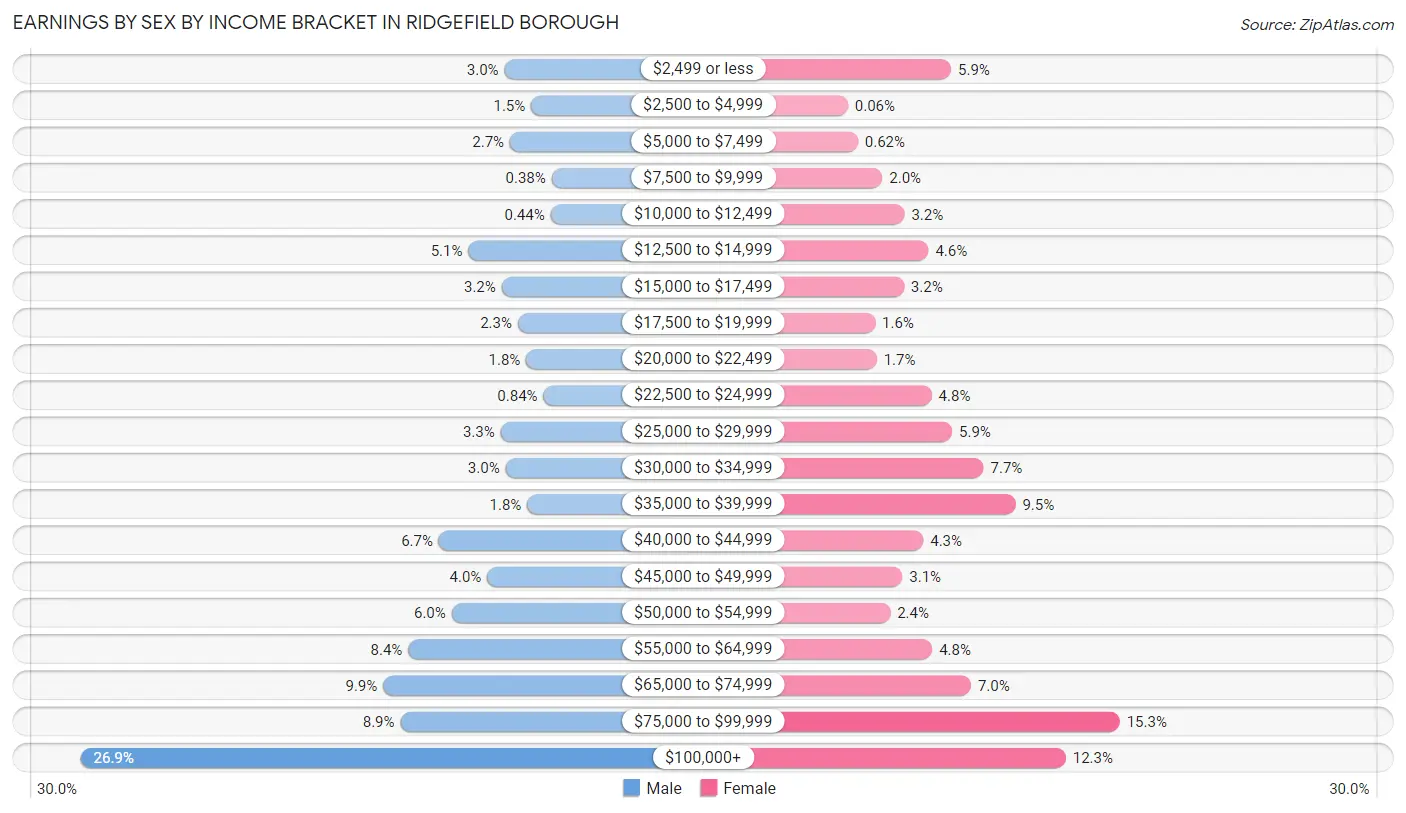
| Income | Male | Female |
| $2,499 or less | 97 (3.0%) | 199 (5.9%) |
| $2,500 to $4,999 | 49 (1.5%) | 2 (0.1%) |
| $5,000 to $7,499 | 87 (2.7%) | 21 (0.6%) |
| $7,500 to $9,999 | 12 (0.4%) | 68 (2.0%) |
| $10,000 to $12,499 | 14 (0.4%) | 110 (3.2%) |
| $12,500 to $14,999 | 162 (5.1%) | 156 (4.6%) |
| $15,000 to $17,499 | 102 (3.2%) | 109 (3.2%) |
| $17,500 to $19,999 | 73 (2.3%) | 54 (1.6%) |
| $20,000 to $22,499 | 58 (1.8%) | 57 (1.7%) |
| $22,500 to $24,999 | 27 (0.8%) | 162 (4.8%) |
| $25,000 to $29,999 | 104 (3.3%) | 201 (5.9%) |
| $30,000 to $34,999 | 95 (3.0%) | 261 (7.7%) |
| $35,000 to $39,999 | 56 (1.8%) | 322 (9.5%) |
| $40,000 to $44,999 | 215 (6.7%) | 146 (4.3%) |
| $45,000 to $49,999 | 128 (4.0%) | 106 (3.1%) |
| $50,000 to $54,999 | 192 (6.0%) | 83 (2.4%) |
| $55,000 to $64,999 | 270 (8.4%) | 163 (4.8%) |
| $65,000 to $74,999 | 315 (9.9%) | 237 (7.0%) |
| $75,000 to $99,999 | 284 (8.9%) | 521 (15.3%) |
| $100,000+ | 859 (26.9%) | 418 (12.3%) |
| Total | 3,199 (100.0%) | 3,396 (100.0%) |
Earnings by Sex by Educational Attainment in Ridgefield borough
Average earnings in Ridgefield borough are $65,043 for men and $41,408 for women, a difference of 36.3%. Men with an educational attainment of graduate degree enjoy the highest average annual earnings of $84,427, while those with less than high school education earn the least with $44,096. Women with an educational attainment of bachelor's degree earn the most with the average annual earnings of $68,799, while those with college or associate's degree education have the smallest earnings of $32,306.
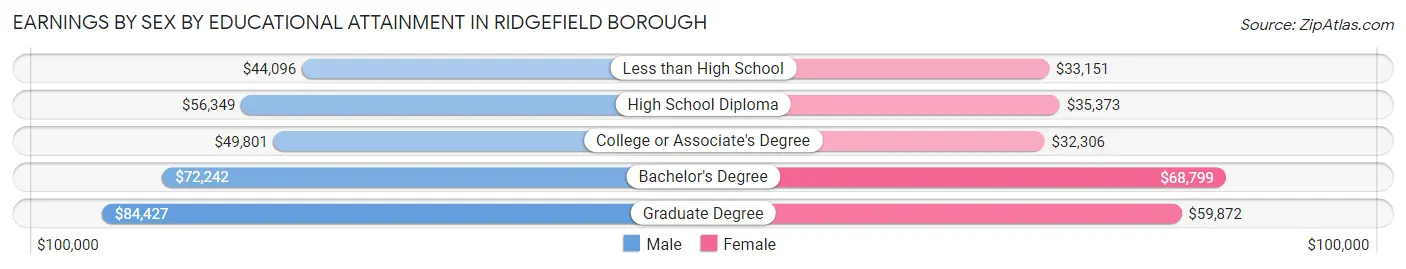
| Educational Attainment | Male Income | Female Income |
| Less than High School | $44,096 | $33,151 |
| High School Diploma | $56,349 | $35,373 |
| College or Associate's Degree | $49,801 | $32,306 |
| Bachelor's Degree | $72,242 | $68,799 |
| Graduate Degree | $84,427 | $59,872 |
| Total | $65,043 | $41,408 |
Family Income in Ridgefield borough
Family Income Brackets in Ridgefield borough
According to the Ridgefield borough family income data, there are 745 families falling into the $100,000 to $149,999 income range, which is the most common income bracket and makes up 24.0% of all families. Conversely, the less than $10,000 income bracket is the least frequent group with only 40 families (1.3%) belonging to this category.
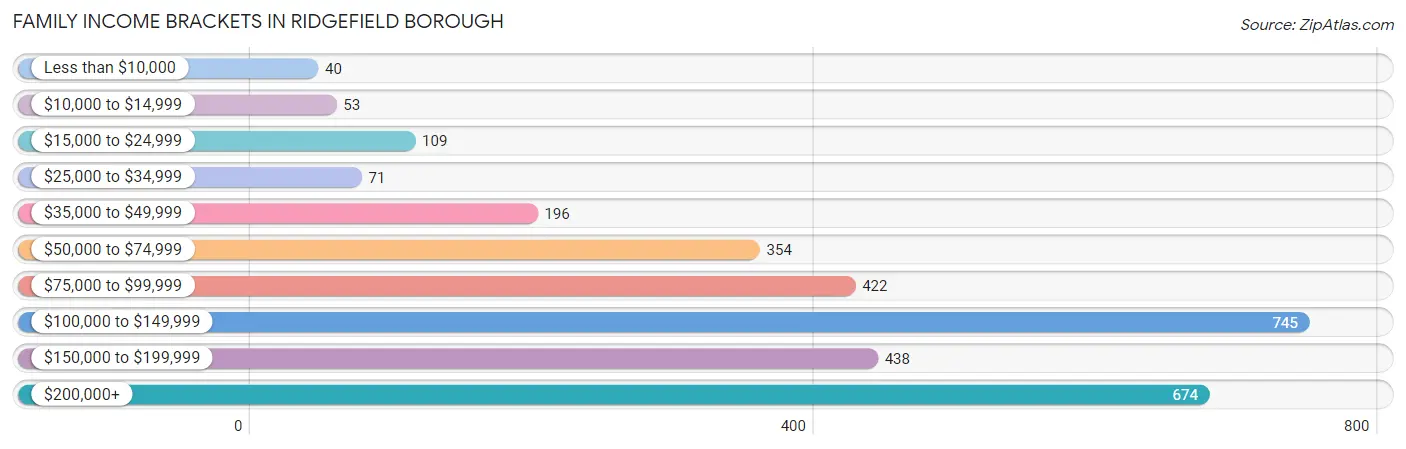
| Income Bracket | # Families | % Families |
| Less than $10,000 | 40 | 1.3% |
| $10,000 to $14,999 | 53 | 1.7% |
| $15,000 to $24,999 | 109 | 3.5% |
| $25,000 to $34,999 | 71 | 2.3% |
| $35,000 to $49,999 | 196 | 6.3% |
| $50,000 to $74,999 | 354 | 11.4% |
| $75,000 to $99,999 | 422 | 13.6% |
| $100,000 to $149,999 | 745 | 24.0% |
| $150,000 to $199,999 | 438 | 14.1% |
| $200,000+ | 674 | 21.7% |
Family Income by Famaliy Size in Ridgefield borough
6-person families (90 | 2.9%) account for the highest median family income in Ridgefield borough with $250,001 per family, while 2-person families (991 | 31.9%) have the highest median income of $51,562 per family member.
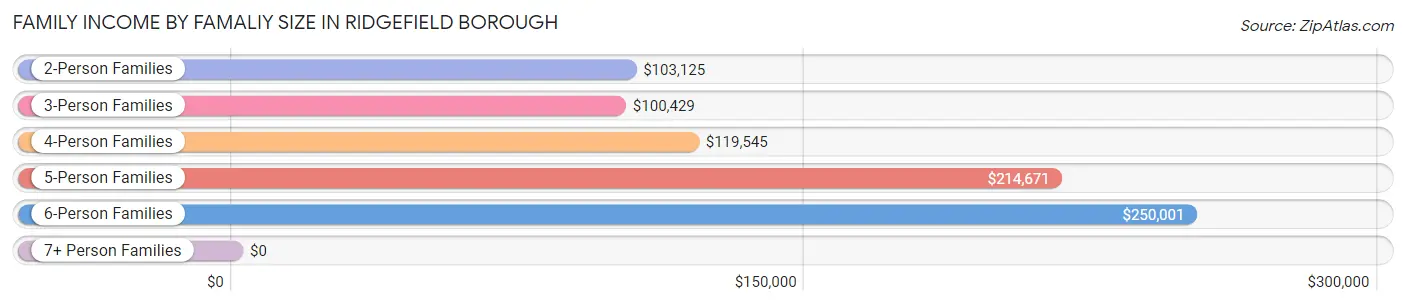
| Income Bracket | # Families | Median Income |
| 2-Person Families | 991 (31.9%) | $103,125 |
| 3-Person Families | 1,116 (35.9%) | $100,429 |
| 4-Person Families | 596 (19.2%) | $119,545 |
| 5-Person Families | 298 (9.6%) | $214,671 |
| 6-Person Families | 90 (2.9%) | $250,001 |
| 7+ Person Families | 14 (0.4%) | $0 |
| Total | 3,105 (100.0%) | $112,377 |
Family Income by Number of Earners in Ridgefield borough
The median family income in Ridgefield borough is $112,377, with families comprising 3+ earners (620) having the highest median family income of $193,429, while families with no earners (309) have the lowest median family income of $51,985, accounting for 20.0% and 10.0% of families, respectively.
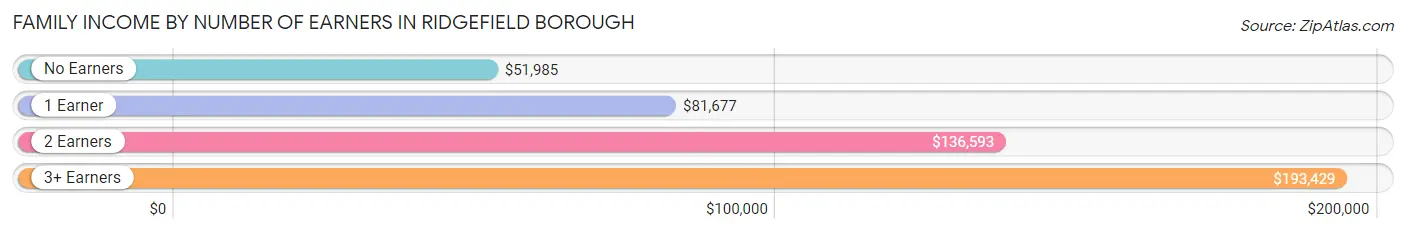
| Number of Earners | # Families | Median Income |
| No Earners | 309 (10.0%) | $51,985 |
| 1 Earner | 947 (30.5%) | $81,677 |
| 2 Earners | 1,229 (39.6%) | $136,593 |
| 3+ Earners | 620 (20.0%) | $193,429 |
| Total | 3,105 (100.0%) | $112,377 |
Household Income in Ridgefield borough
Household Income Brackets in Ridgefield borough
With 955 households falling in the category, the $100,000 to $149,999 income range is the most frequent in Ridgefield borough, accounting for 23.7% of all households. In contrast, only 85 households (2.1%) fall into the less than $10,000 income bracket, making it the least populous group.
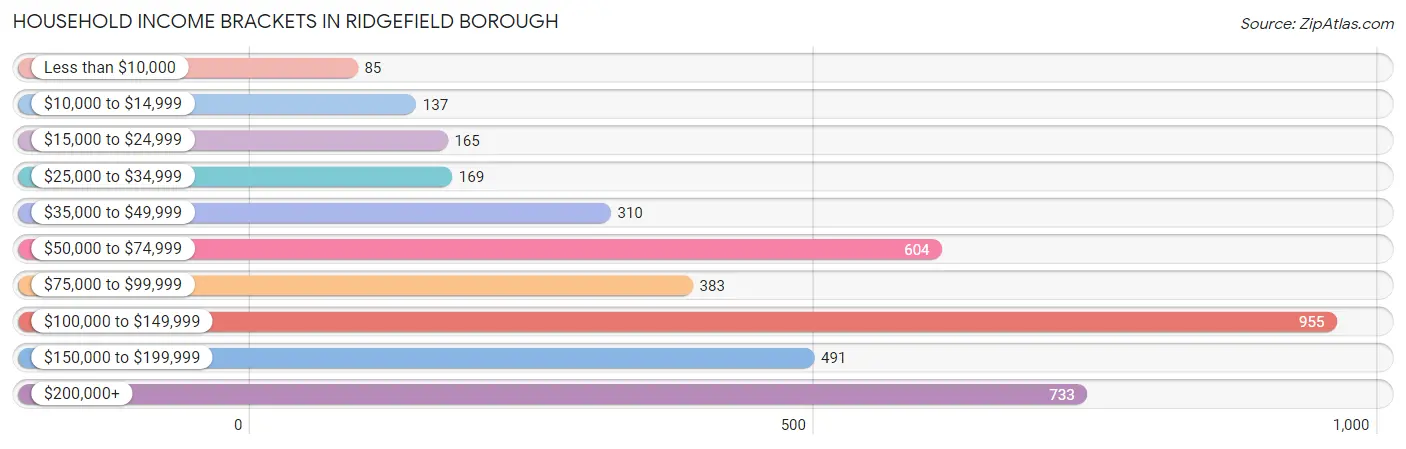
| Income Bracket | # Households | % Households |
| Less than $10,000 | 85 | 2.1% |
| $10,000 to $14,999 | 137 | 3.4% |
| $15,000 to $24,999 | 165 | 4.1% |
| $25,000 to $34,999 | 169 | 4.2% |
| $35,000 to $49,999 | 310 | 7.7% |
| $50,000 to $74,999 | 604 | 15.0% |
| $75,000 to $99,999 | 383 | 9.5% |
| $100,000 to $149,999 | 955 | 23.7% |
| $150,000 to $199,999 | 491 | 12.2% |
| $200,000+ | 733 | 18.2% |
Household Income by Householder Age in Ridgefield borough
The median household income in Ridgefield borough is $105,609, with the highest median household income of $148,034 found in the 25 to 44 years age bracket for the primary householder. A total of 1,306 households (32.4%) fall into this category. Meanwhile, the 15 to 24 years age bracket for the primary householder has the lowest median household income of $0, with 20 households (0.5%) in this group.
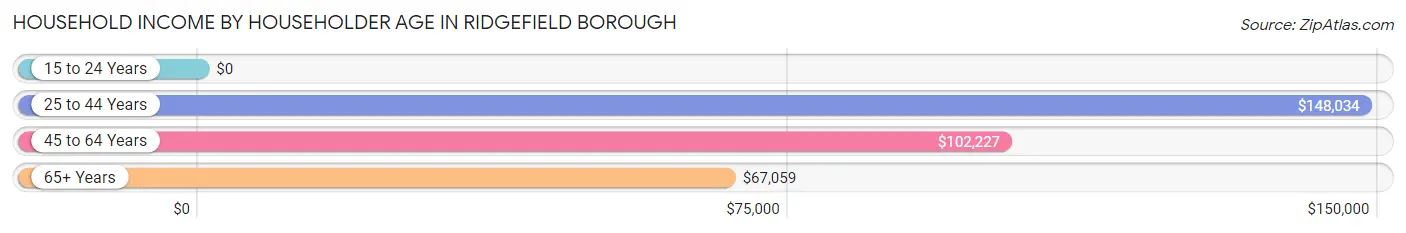
| Income Bracket | # Households | Median Income |
| 15 to 24 Years | 20 (0.5%) | $0 |
| 25 to 44 Years | 1,306 (32.4%) | $148,034 |
| 45 to 64 Years | 1,786 (44.3%) | $102,227 |
| 65+ Years | 916 (22.7%) | $67,059 |
| Total | 4,028 (100.0%) | $105,609 |
Poverty in Ridgefield borough
Income Below Poverty by Sex and Age in Ridgefield borough
With 4.8% poverty level for males and 4.6% for females among the residents of Ridgefield borough, under 5 year old males and 75 year old and over females are the most vulnerable to poverty, with 43 males (35.0%) and 78 females (24.5%) in their respective age groups living below the poverty level.
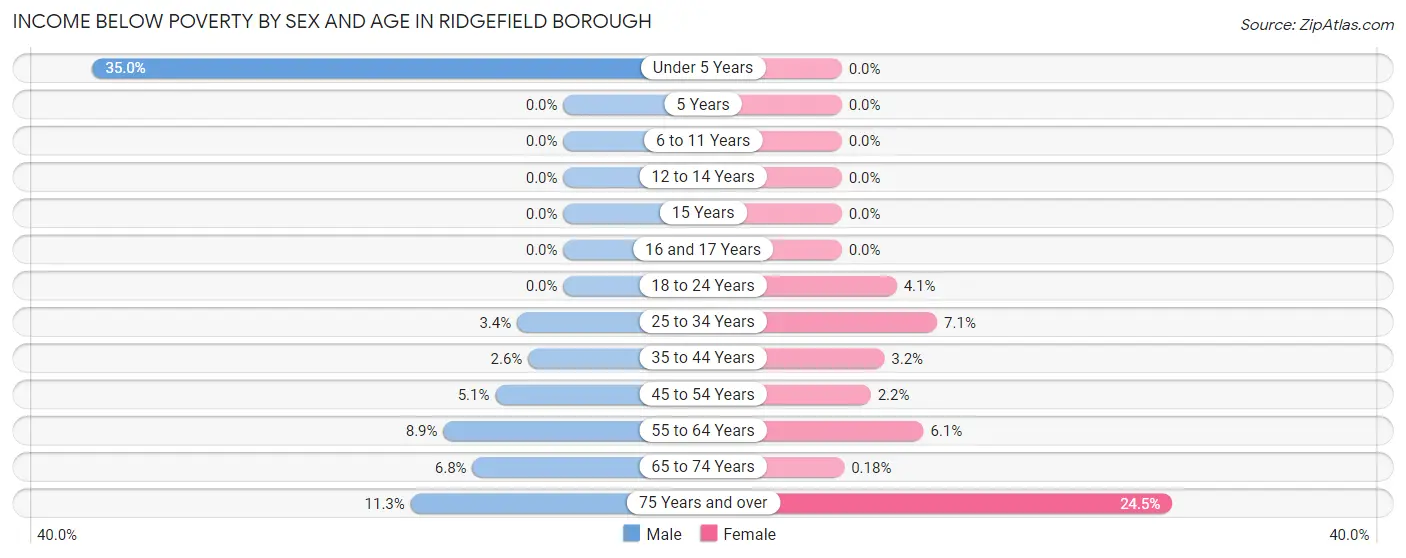
| Age Bracket | Male | Female |
| Under 5 Years | 43 (35.0%) | 0 (0.0%) |
| 5 Years | 0 (0.0%) | 0 (0.0%) |
| 6 to 11 Years | 0 (0.0%) | 0 (0.0%) |
| 12 to 14 Years | 0 (0.0%) | 0 (0.0%) |
| 15 Years | 0 (0.0%) | 0 (0.0%) |
| 16 and 17 Years | 0 (0.0%) | 0 (0.0%) |
| 18 to 24 Years | 0 (0.0%) | 16 (4.1%) |
| 25 to 34 Years | 25 (3.4%) | 60 (7.1%) |
| 35 to 44 Years | 19 (2.6%) | 31 (3.2%) |
| 45 to 54 Years | 39 (5.1%) | 15 (2.1%) |
| 55 to 64 Years | 78 (8.9%) | 68 (6.1%) |
| 65 to 74 Years | 38 (6.8%) | 1 (0.2%) |
| 75 Years and over | 28 (11.3%) | 78 (24.5%) |
| Total | 270 (4.8%) | 269 (4.6%) |
Income Above Poverty by Sex and Age in Ridgefield borough
According to the poverty statistics in Ridgefield borough, males aged 5 years and females aged under 5 years are the age groups that are most secure financially, with 100.0% of males and 100.0% of females in these age groups living above the poverty line.
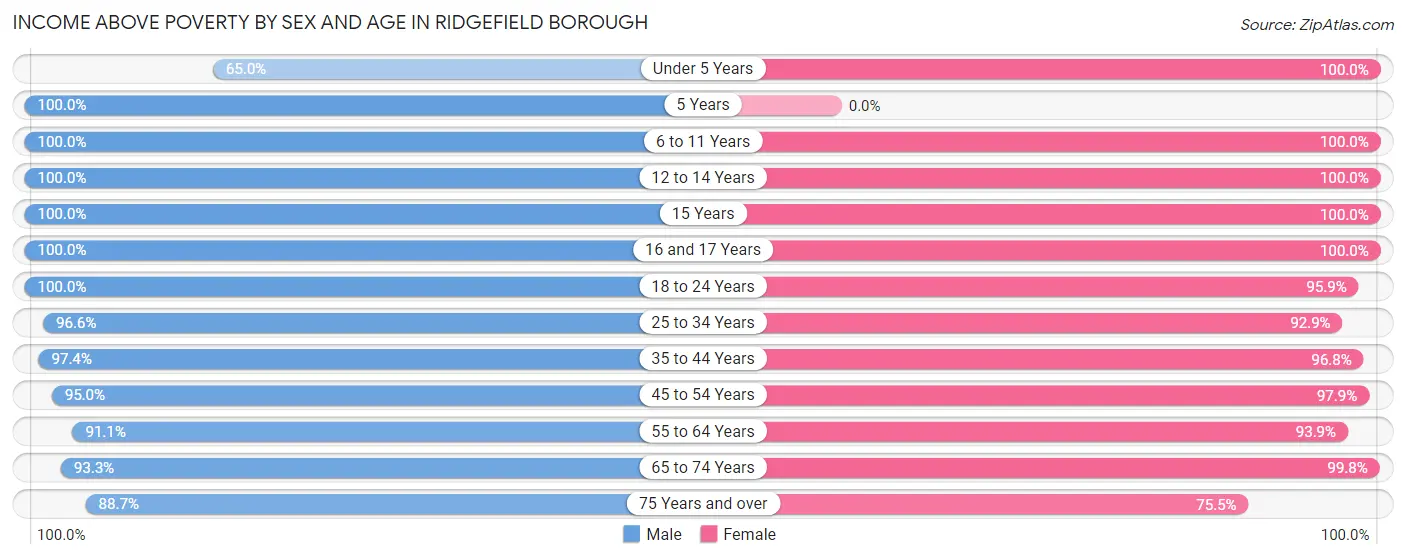
| Age Bracket | Male | Female |
| Under 5 Years | 80 (65.0%) | 168 (100.0%) |
| 5 Years | 41 (100.0%) | 0 (0.0%) |
| 6 to 11 Years | 445 (100.0%) | 214 (100.0%) |
| 12 to 14 Years | 283 (100.0%) | 262 (100.0%) |
| 15 Years | 19 (100.0%) | 119 (100.0%) |
| 16 and 17 Years | 171 (100.0%) | 196 (100.0%) |
| 18 to 24 Years | 587 (100.0%) | 376 (95.9%) |
| 25 to 34 Years | 701 (96.6%) | 787 (92.9%) |
| 35 to 44 Years | 710 (97.4%) | 951 (96.8%) |
| 45 to 54 Years | 733 (95.0%) | 682 (97.9%) |
| 55 to 64 Years | 797 (91.1%) | 1,053 (93.9%) |
| 65 to 74 Years | 525 (93.2%) | 566 (99.8%) |
| 75 Years and over | 219 (88.7%) | 240 (75.5%) |
| Total | 5,311 (95.2%) | 5,614 (95.4%) |
Income Below Poverty Among Married-Couple Families in Ridgefield borough
The poverty statistics for married-couple families in Ridgefield borough show that 4.1% or 84 of the total 2,059 families live below the poverty line. Families with no children have the highest poverty rate of 5.6%, comprising of 64 families. On the other hand, families with 5 or more children have the lowest poverty rate of 0.0%, which includes 0 families.
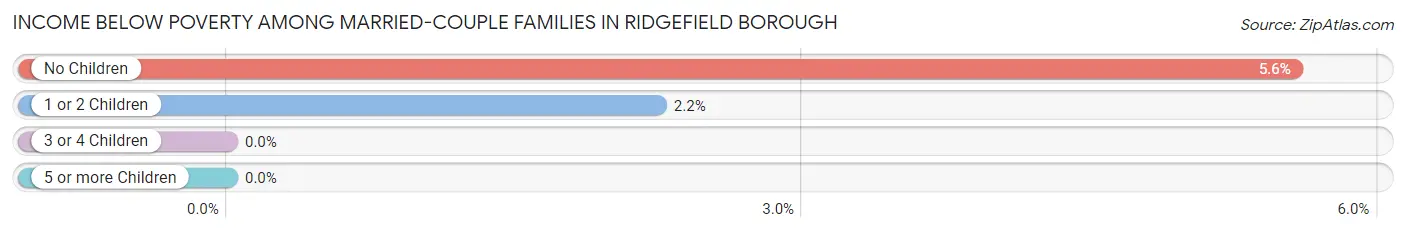
| Children | Above Poverty | Below Poverty |
| No Children | 1,087 (94.4%) | 64 (5.6%) |
| 1 or 2 Children | 874 (97.8%) | 20 (2.2%) |
| 3 or 4 Children | 0 (0.0%) | 0 (0.0%) |
| 5 or more Children | 14 (100.0%) | 0 (0.0%) |
| Total | 1,975 (95.9%) | 84 (4.1%) |
Income Below Poverty Among Single-Parent Households in Ridgefield borough
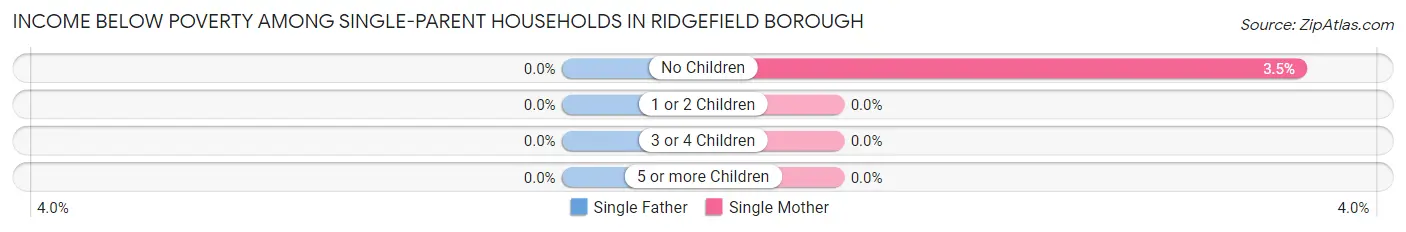
| Children | Single Father | Single Mother |
| No Children | 0 (0.0%) | 15 (3.5%) |
| 1 or 2 Children | 0 (0.0%) | 0 (0.0%) |
| 3 or 4 Children | 0 (0.0%) | 0 (0.0%) |
| 5 or more Children | 0 (0.0%) | 0 (0.0%) |
| Total | 0 (0.0%) | 15 (1.8%) |
Income Below Poverty Among Married-Couple vs Single-Parent Households in Ridgefield borough
The poverty data for Ridgefield borough shows that 84 of the married-couple family households (4.1%) and 15 of the single-parent households (1.4%) are living below the poverty level. Within the married-couple family households, those with no children have the highest poverty rate, with 64 households (5.6%) falling below the poverty line. Among the single-parent households, those with no children have the highest poverty rate, with 15 household (2.5%) living below poverty.
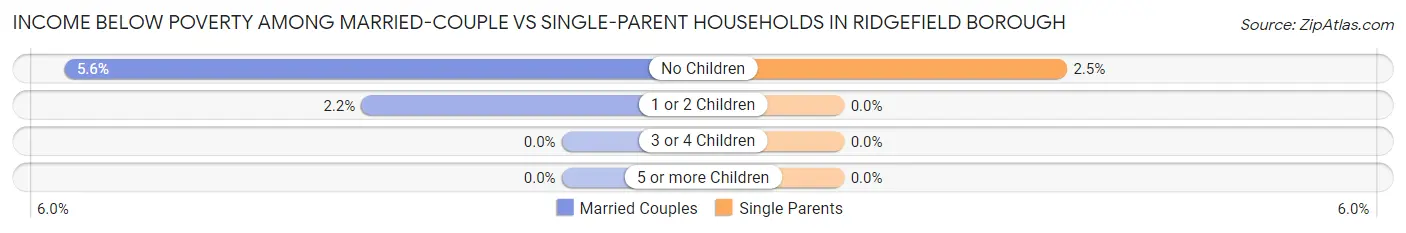
| Children | Married-Couple Families | Single-Parent Households |
| No Children | 64 (5.6%) | 15 (2.5%) |
| 1 or 2 Children | 20 (2.2%) | 0 (0.0%) |
| 3 or 4 Children | 0 (0.0%) | 0 (0.0%) |
| 5 or more Children | 0 (0.0%) | 0 (0.0%) |
| Total | 84 (4.1%) | 15 (1.4%) |
Race in Ridgefield borough
The most populous races in Ridgefield borough are White / Caucasian (5,275 | 46.0%), Hispanic or Latino (4,099 | 35.7%), and Asian (3,417 | 29.8%).
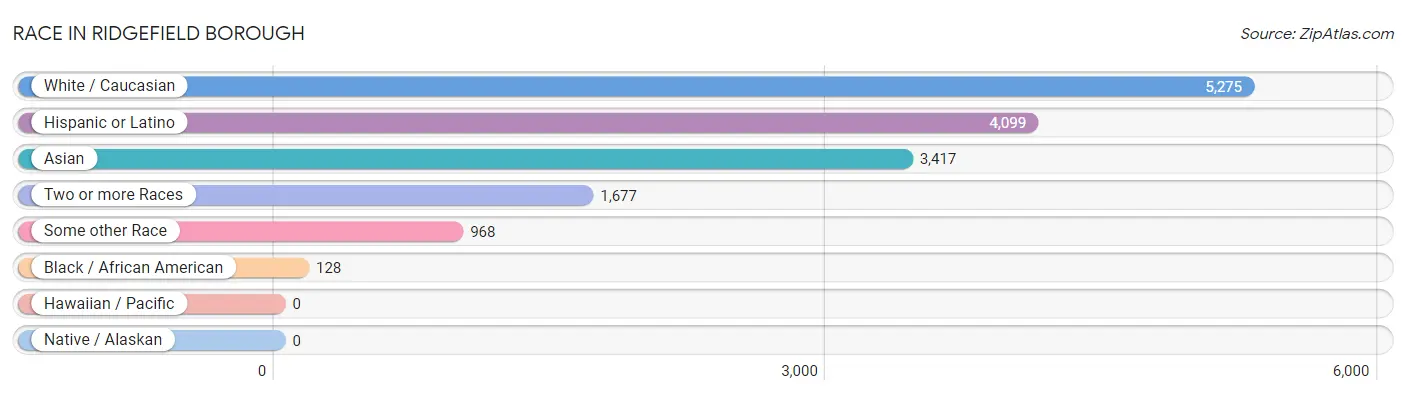
| Race | # Population | % Population |
| Asian | 3,417 | 29.8% |
| Black / African American | 128 | 1.1% |
| Hawaiian / Pacific | 0 | 0.0% |
| Hispanic or Latino | 4,099 | 35.7% |
| Native / Alaskan | 0 | 0.0% |
| White / Caucasian | 5,275 | 46.0% |
| Two or more Races | 1,677 | 14.6% |
| Some other Race | 968 | 8.4% |
| Total | 11,465 | 100.0% |
Ancestry in Ridgefield borough
The most populous ancestries reported in Ridgefield borough are Burmese (2,729 | 23.8%), Italian (1,741 | 15.2%), Cuban (797 | 7.0%), Dominican (787 | 6.9%), and South American (780 | 6.8%), together accounting for 59.6% of all Ridgefield borough residents.
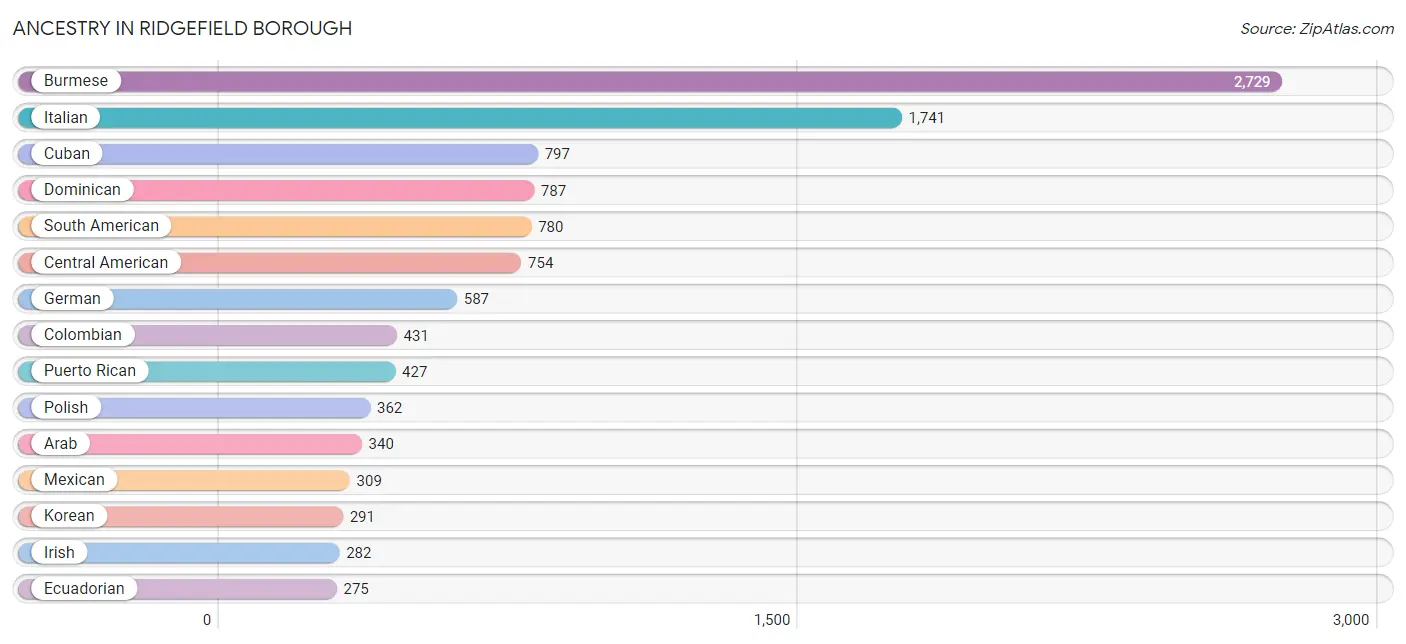
| Ancestry | # Population | % Population |
| African | 36 | 0.3% |
| Albanian | 31 | 0.3% |
| American | 237 | 2.1% |
| Arab | 340 | 3.0% |
| Armenian | 161 | 1.4% |
| Bhutanese | 238 | 2.1% |
| Brazilian | 48 | 0.4% |
| British West Indian | 40 | 0.4% |
| Burmese | 2,729 | 23.8% |
| Central American | 754 | 6.6% |
| Chilean | 14 | 0.1% |
| Colombian | 431 | 3.8% |
| Costa Rican | 153 | 1.3% |
| Croatian | 207 | 1.8% |
| Cuban | 797 | 7.0% |
| Cypriot | 14 | 0.1% |
| Dominican | 787 | 6.9% |
| Ecuadorian | 275 | 2.4% |
| Egyptian | 84 | 0.7% |
| English | 118 | 1.0% |
| Ethiopian | 35 | 0.3% |
| Filipino | 68 | 0.6% |
| French | 78 | 0.7% |
| French Canadian | 10 | 0.1% |
| German | 587 | 5.1% |
| Greek | 229 | 2.0% |
| Guatemalan | 260 | 2.3% |
| Haitian | 20 | 0.2% |
| Honduran | 102 | 0.9% |
| Hungarian | 11 | 0.1% |
| Indian (Asian) | 168 | 1.5% |
| Irish | 282 | 2.5% |
| Italian | 1,741 | 15.2% |
| Jamaican | 32 | 0.3% |
| Jordanian | 151 | 1.3% |
| Korean | 291 | 2.5% |
| Lebanese | 33 | 0.3% |
| Mexican | 309 | 2.7% |
| Mexican American Indian | 16 | 0.1% |
| Moroccan | 72 | 0.6% |
| Nicaraguan | 161 | 1.4% |
| Peruvian | 60 | 0.5% |
| Polish | 362 | 3.2% |
| Puerto Rican | 427 | 3.7% |
| Romanian | 20 | 0.2% |
| Russian | 31 | 0.3% |
| Salvadoran | 78 | 0.7% |
| Serbian | 46 | 0.4% |
| Slovene | 11 | 0.1% |
| South American | 780 | 6.8% |
| Spaniard | 105 | 0.9% |
| Spanish | 88 | 0.8% |
| Subsaharan African | 107 | 0.9% |
| Swiss | 164 | 1.4% |
| Thai | 185 | 1.6% |
| Turkish | 22 | 0.2% |
| Ukrainian | 31 | 0.3% |
| Welsh | 23 | 0.2% | View All 58 Rows |
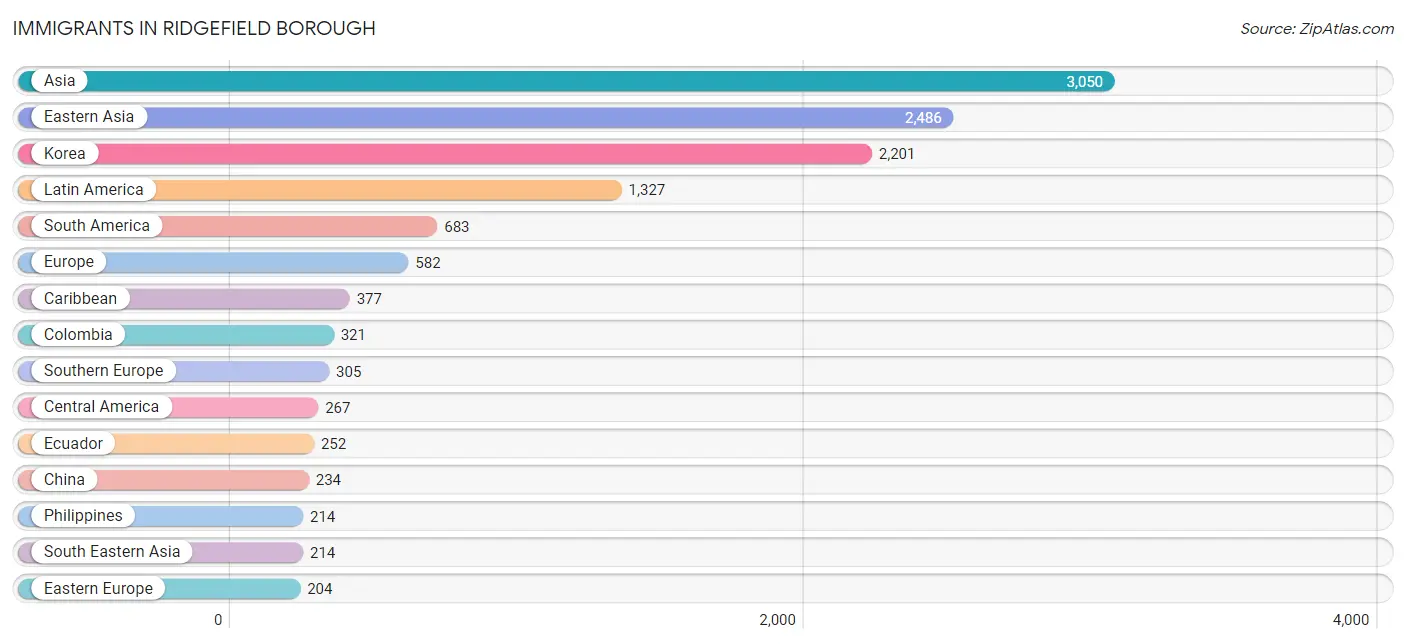
Immigrants in Ridgefield borough
The most numerous immigrant groups reported in Ridgefield borough came from Asia (3,050 | 26.6%), Eastern Asia (2,486 | 21.7%), Korea (2,201 | 19.2%), Latin America (1,327 | 11.6%), and South America (683 | 6.0%), together accounting for 85.0% of all Ridgefield borough residents.
| Immigration Origin | # Population | % Population |
| Africa | 101 | 0.9% |
| Argentina | 1 | 0.0% |
| Asia | 3,050 | 26.6% |
| Brazil | 22 | 0.2% |
| Canada | 10 | 0.1% |
| Caribbean | 377 | 3.3% |
| Central America | 267 | 2.3% |
| China | 234 | 2.0% |
| Colombia | 321 | 2.8% |
| Croatia | 86 | 0.7% |
| Cuba | 122 | 1.1% |
| Dominica | 87 | 0.8% |
| Dominican Republic | 168 | 1.5% |
| Eastern Africa | 52 | 0.4% |
| Eastern Asia | 2,486 | 21.7% |
| Eastern Europe | 204 | 1.8% |
| Ecuador | 252 | 2.2% |
| Egypt | 49 | 0.4% |
| El Salvador | 20 | 0.2% |
| England | 20 | 0.2% |
| Ethiopia | 35 | 0.3% |
| Europe | 582 | 5.1% |
| France | 46 | 0.4% |
| Greece | 155 | 1.3% |
| Guatemala | 117 | 1.0% |
| Guyana | 52 | 0.4% |
| Honduras | 41 | 0.4% |
| Hong Kong | 158 | 1.4% |
| India | 56 | 0.5% |
| Iraq | 17 | 0.2% |
| Ireland | 7 | 0.1% |
| Italy | 101 | 0.9% |
| Japan | 51 | 0.4% |
| Korea | 2,201 | 19.2% |
| Latin America | 1,327 | 11.6% |
| Lebanon | 62 | 0.5% |
| Mexico | 34 | 0.3% |
| Nicaragua | 55 | 0.5% |
| Northern Africa | 49 | 0.4% |
| Northern Europe | 27 | 0.2% |
| Pakistan | 98 | 0.9% |
| Peru | 35 | 0.3% |
| Philippines | 214 | 1.9% |
| Poland | 46 | 0.4% |
| Romania | 20 | 0.2% |
| South America | 683 | 6.0% |
| South Central Asia | 154 | 1.3% |
| South Eastern Asia | 214 | 1.9% |
| Southern Europe | 305 | 2.7% |
| Spain | 49 | 0.4% |
| Taiwan | 68 | 0.6% |
| Turkey | 71 | 0.6% |
| Ukraine | 21 | 0.2% |
| Western Asia | 196 | 1.7% |
| Western Europe | 46 | 0.4% | View All 55 Rows |
Sex and Age in Ridgefield borough
Sex and Age in Ridgefield borough
The most populous age groups in Ridgefield borough are 10 to 14 Years (582 | 10.4%) for men and 55 to 59 Years (613 | 10.4%) for women.
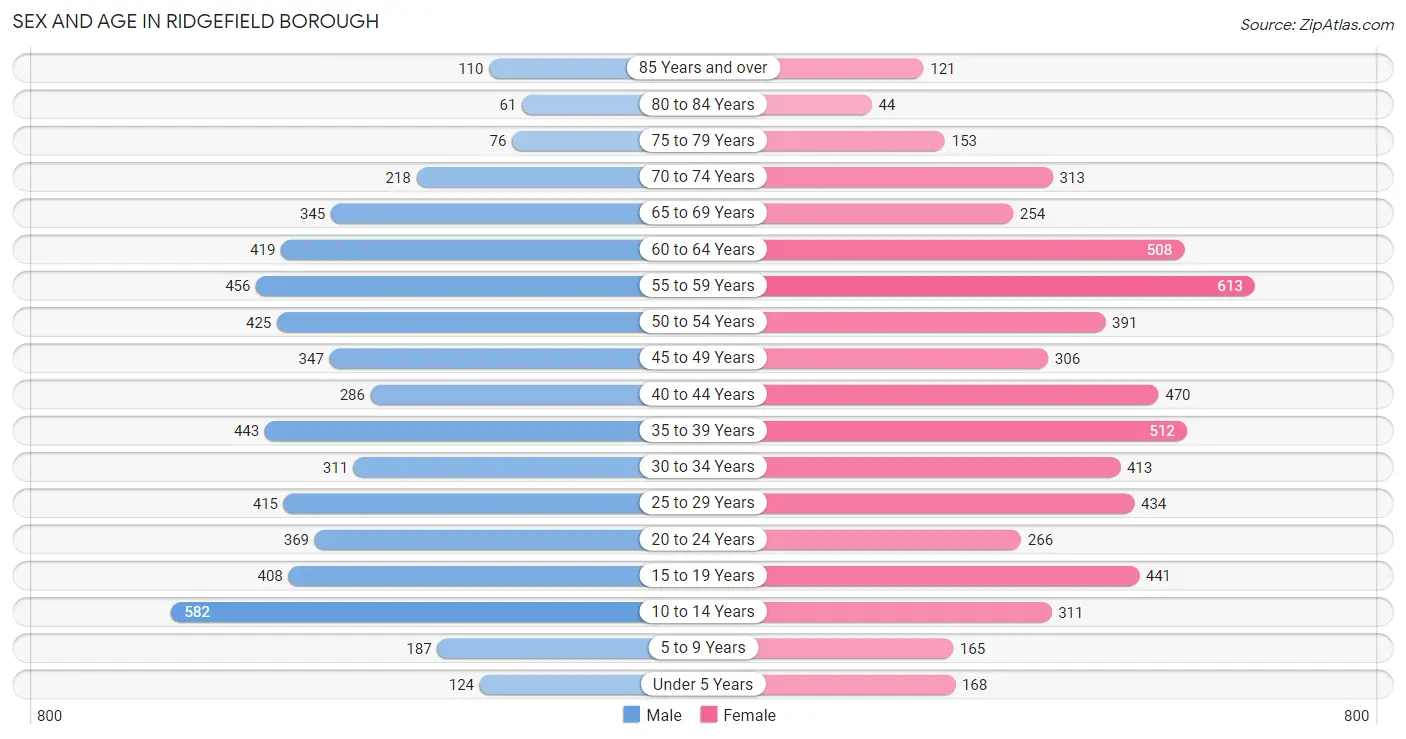
| Age Bracket | Male | Female |
| Under 5 Years | 124 (2.2%) | 168 (2.9%) |
| 5 to 9 Years | 187 (3.4%) | 165 (2.8%) |
| 10 to 14 Years | 582 (10.4%) | 311 (5.3%) |
| 15 to 19 Years | 408 (7.3%) | 441 (7.5%) |
| 20 to 24 Years | 369 (6.6%) | 266 (4.5%) |
| 25 to 29 Years | 415 (7.4%) | 434 (7.4%) |
| 30 to 34 Years | 311 (5.6%) | 413 (7.0%) |
| 35 to 39 Years | 443 (7.9%) | 512 (8.7%) |
| 40 to 44 Years | 286 (5.1%) | 470 (8.0%) |
| 45 to 49 Years | 347 (6.2%) | 306 (5.2%) |
| 50 to 54 Years | 425 (7.6%) | 391 (6.7%) |
| 55 to 59 Years | 456 (8.2%) | 613 (10.4%) |
| 60 to 64 Years | 419 (7.5%) | 508 (8.6%) |
| 65 to 69 Years | 345 (6.2%) | 254 (4.3%) |
| 70 to 74 Years | 218 (3.9%) | 313 (5.3%) |
| 75 to 79 Years | 76 (1.4%) | 153 (2.6%) |
| 80 to 84 Years | 61 (1.1%) | 44 (0.7%) |
| 85 Years and over | 110 (2.0%) | 121 (2.1%) |
| Total | 5,582 (100.0%) | 5,883 (100.0%) |
Families and Households in Ridgefield borough
Median Family Size in Ridgefield borough
The median family size in Ridgefield borough is 3.22 persons per family, with married-couple families (2,059 | 66.3%) accounting for the largest median family size of 3.41 persons per family. On the other hand, single male/father families (215 | 6.9%) represent the smallest median family size with 2.71 persons per family.
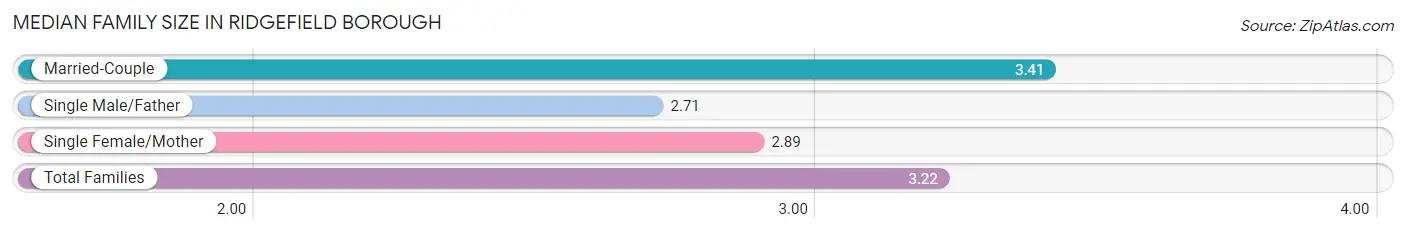
| Family Type | # Families | Family Size |
| Married-Couple | 2,059 (66.3%) | 3.41 |
| Single Male/Father | 215 (6.9%) | 2.71 |
| Single Female/Mother | 831 (26.8%) | 2.89 |
| Total Families | 3,105 (100.0%) | 3.22 |
Median Household Size in Ridgefield borough
The median household size in Ridgefield borough is 2.84 persons per household, with married-couple households (2,059 | 51.1%) accounting for the largest median household size of 3.47 persons per household. non-family households (923 | 22.9%) represent the smallest median household size with 1.16 persons per household.
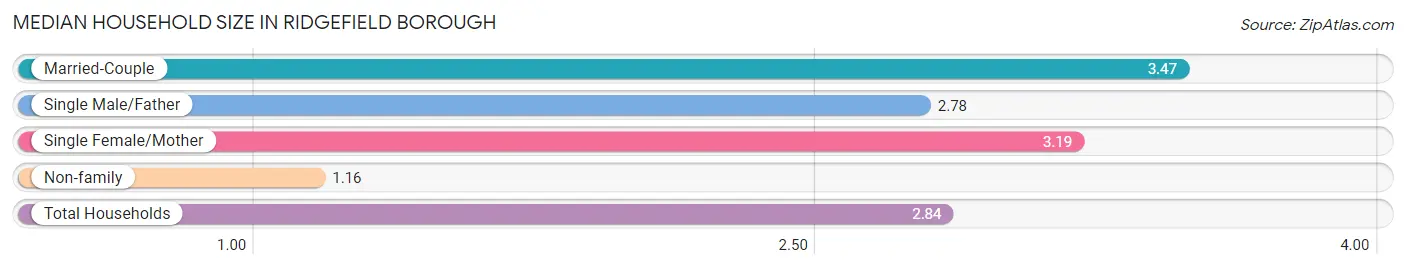
| Household Type | # Households | Household Size |
| Married-Couple | 2,059 (51.1%) | 3.47 |
| Single Male/Father | 215 (5.3%) | 2.78 |
| Single Female/Mother | 831 (20.6%) | 3.19 |
| Non-family | 923 (22.9%) | 1.16 |
| Total Households | 4,028 (100.0%) | 2.84 |
Household Size by Marriage Status in Ridgefield borough
Out of a total of 4,028 households in Ridgefield borough, 3,105 (77.1%) are family households, while 923 (22.9%) are nonfamily households. The most numerous type of family households are 3-person households, comprising 968, and the most common type of nonfamily households are 1-person households, comprising 826.
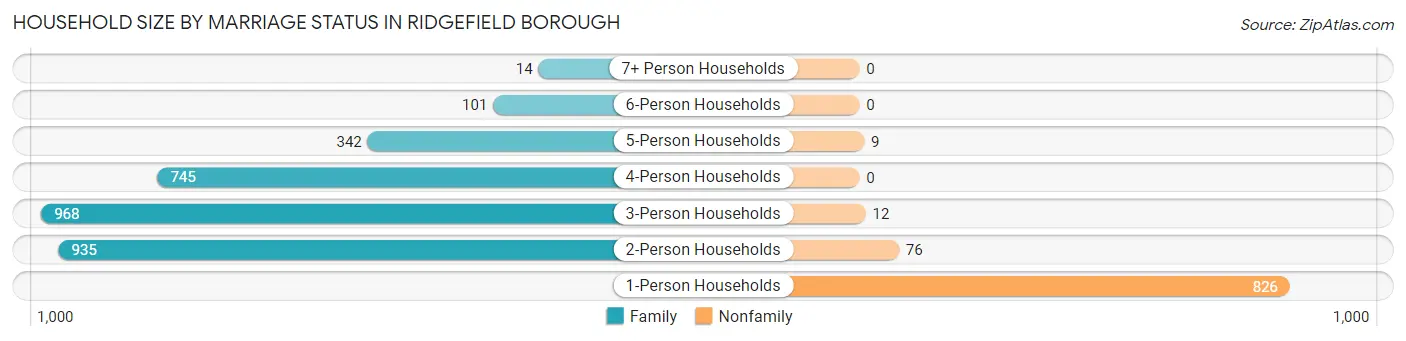
| Household Size | Family Households | Nonfamily Households |
| 1-Person Households | - | 826 (20.5%) |
| 2-Person Households | 935 (23.2%) | 76 (1.9%) |
| 3-Person Households | 968 (24.0%) | 12 (0.3%) |
| 4-Person Households | 745 (18.5%) | 0 (0.0%) |
| 5-Person Households | 342 (8.5%) | 9 (0.2%) |
| 6-Person Households | 101 (2.5%) | 0 (0.0%) |
| 7+ Person Households | 14 (0.4%) | 0 (0.0%) |
| Total | 3,105 (77.1%) | 923 (22.9%) |
Female Fertility in Ridgefield borough
Fertility by Age in Ridgefield borough
Average fertility rate in Ridgefield borough is 5.0 births per 1,000 women. Women in the age bracket of 35 to 50 years have the highest fertility rate with 11.0 births per 1,000 women. Women in the age bracket of 35 to 50 years acount for 100.0% of all women with births.
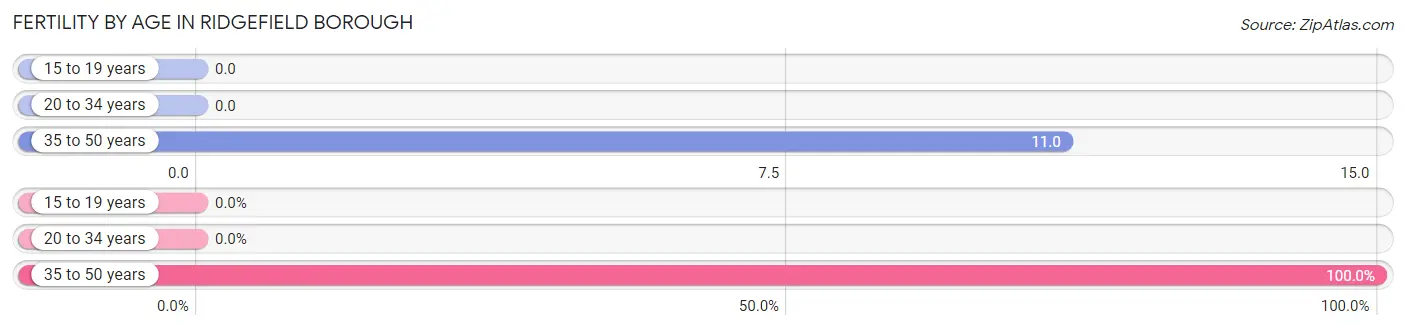
| Age Bracket | Women with Births | Births / 1,000 Women |
| 15 to 19 years | 0 (0.0%) | 0.0 |
| 20 to 34 years | 0 (0.0%) | 0.0 |
| 35 to 50 years | 16 (100.0%) | 11.0 |
| Total | 16 (100.0%) | 5.0 |
Fertility by Age by Marriage Status in Ridgefield borough
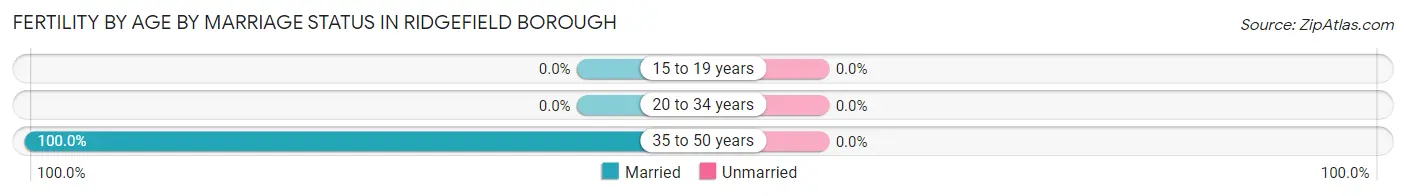
| Age Bracket | Married | Unmarried |
| 15 to 19 years | 0 (0.0%) | 0 (0.0%) |
| 20 to 34 years | 0 (0.0%) | 0 (0.0%) |
| 35 to 50 years | 16 (100.0%) | 0 (0.0%) |
| Total | 16 (100.0%) | 0 (0.0%) |
Fertility by Education in Ridgefield borough
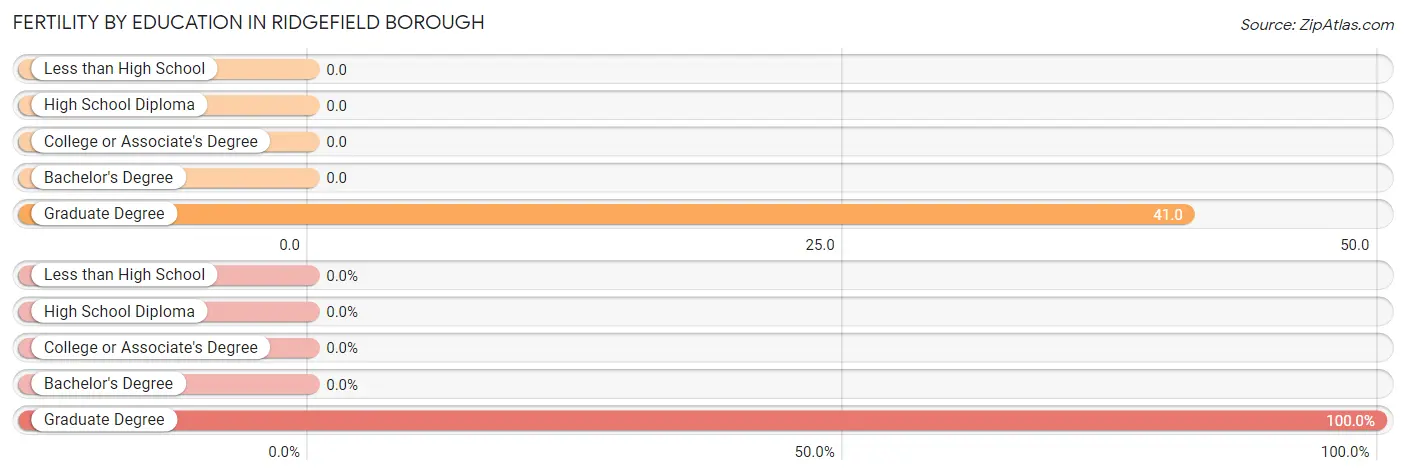
| Educational Attainment | Women with Births | Births / 1,000 Women |
| Less than High School | 0 (0.0%) | 0.0 |
| High School Diploma | 0 (0.0%) | 0.0 |
| College or Associate's Degree | 0 (0.0%) | 0.0 |
| Bachelor's Degree | 0 (0.0%) | 0.0 |
| Graduate Degree | 16 (100.0%) | 41.0 |
| Total | 16 (100.0%) | 5.0 |
Fertility by Education by Marriage Status in Ridgefield borough
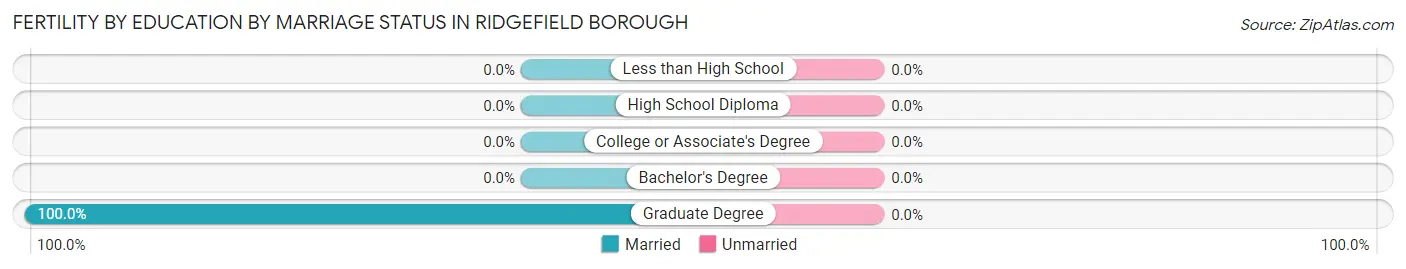
| Educational Attainment | Married | Unmarried |
| Less than High School | 0 (0.0%) | 0 (0.0%) |
| High School Diploma | 0 (0.0%) | 0 (0.0%) |
| College or Associate's Degree | 0 (0.0%) | 0 (0.0%) |
| Bachelor's Degree | 0 (0.0%) | 0 (0.0%) |
| Graduate Degree | 16 (100.0%) | 0 (0.0%) |
| Total | 16 (100.0%) | 0 (0.0%) |
Employment Characteristics in Ridgefield borough
Employment by Class of Employer in Ridgefield borough
Among the 6,029 employed individuals in Ridgefield borough, private company employees (4,288 | 71.1%), self-employed (not incorporated) (467 | 7.7%), and local government employees (458 | 7.6%) make up the most common classes of employment.
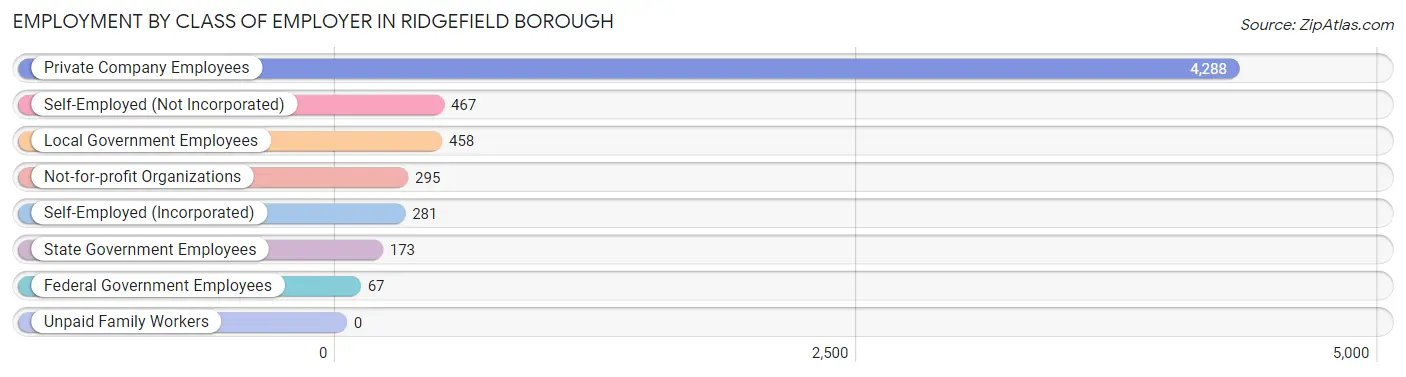
| Employer Class | # Employees | % Employees |
| Private Company Employees | 4,288 | 71.1% |
| Self-Employed (Incorporated) | 281 | 4.7% |
| Self-Employed (Not Incorporated) | 467 | 7.7% |
| Not-for-profit Organizations | 295 | 4.9% |
| Local Government Employees | 458 | 7.6% |
| State Government Employees | 173 | 2.9% |
| Federal Government Employees | 67 | 1.1% |
| Unpaid Family Workers | 0 | 0.0% |
| Total | 6,029 | 100.0% |
Employment Status by Age in Ridgefield borough
According to the labor force statistics for Ridgefield borough, out of the total population over 16 years of age (9,790), 67.1% or 6,569 individuals are in the labor force, with 6.9% or 453 of them unemployed. The age group with the highest labor force participation rate is 35 to 44 years, with 93.2% or 1,595 individuals in the labor force. Within the labor force, the 65 to 74 years age range has the highest percentage of unemployed individuals, with 27.3% or 130 of them being unemployed.
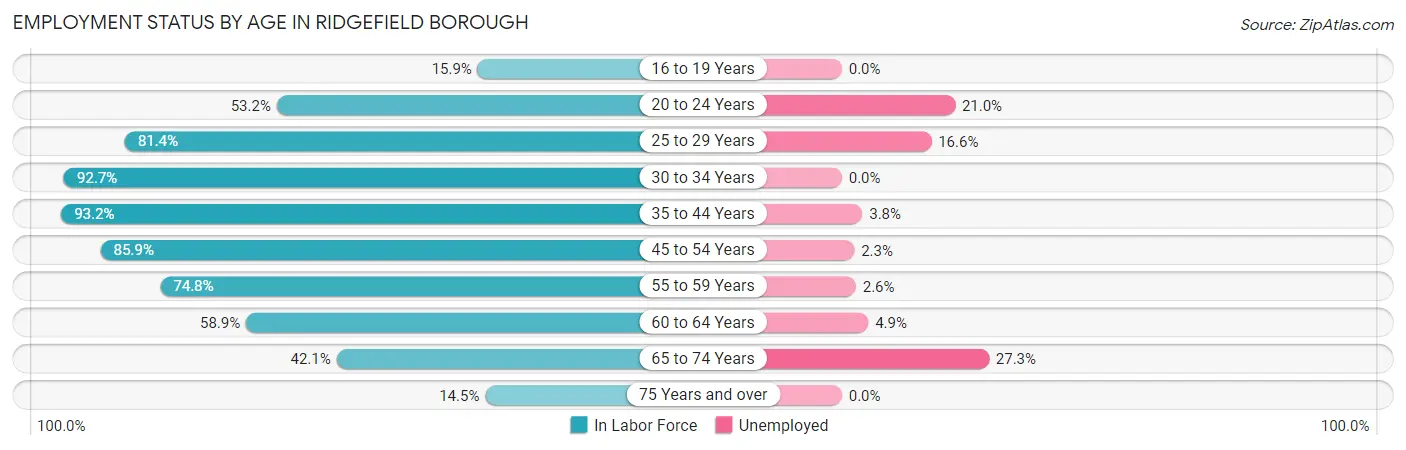
| Age Bracket | In Labor Force | Unemployed |
| 16 to 19 Years | 113 (15.9%) | 0 (0.0%) |
| 20 to 24 Years | 338 (53.2%) | 71 (21.0%) |
| 25 to 29 Years | 691 (81.4%) | 115 (16.6%) |
| 30 to 34 Years | 671 (92.7%) | 0 (0.0%) |
| 35 to 44 Years | 1,595 (93.2%) | 61 (3.8%) |
| 45 to 54 Years | 1,262 (85.9%) | 29 (2.3%) |
| 55 to 59 Years | 800 (74.8%) | 21 (2.6%) |
| 60 to 64 Years | 546 (58.9%) | 27 (4.9%) |
| 65 to 74 Years | 476 (42.1%) | 130 (27.3%) |
| 75 Years and over | 82 (14.5%) | 0 (0.0%) |
| Total | 6,569 (67.1%) | 453 (6.9%) |
Employment Status by Educational Attainment in Ridgefield borough
According to labor force statistics for Ridgefield borough, 82.4% of individuals (5,561) out of the total population between 25 and 64 years of age (6,749) are in the labor force, with 4.5% or 250 of them being unemployed. The group with the highest labor force participation rate are those with the educational attainment of less than high school, with 90.3% or 372 individuals in the labor force. Within the labor force, individuals with less than high school education have the highest percentage of unemployment, with 8.6% or 32 of them being unemployed.
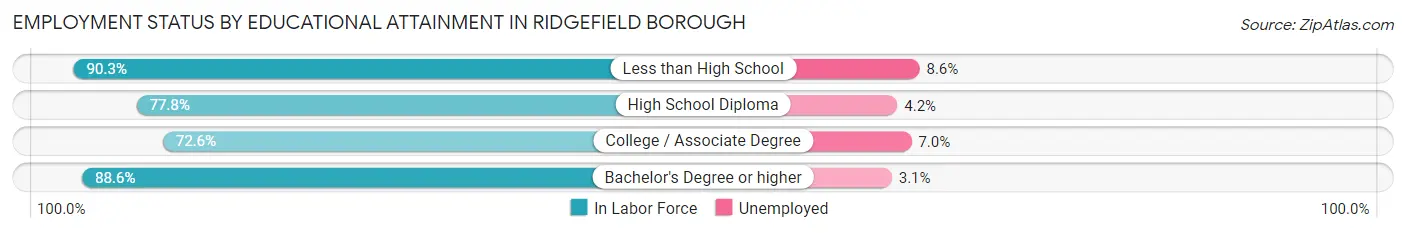
| Educational Attainment | In Labor Force | Unemployed |
| Less than High School | 372 (90.3%) | 35 (8.6%) |
| High School Diploma | 1,221 (77.8%) | 66 (4.2%) |
| College / Associate Degree | 1,143 (72.6%) | 110 (7.0%) |
| Bachelor's Degree or higher | 2,829 (88.6%) | 99 (3.1%) |
| Total | 5,561 (82.4%) | 304 (4.5%) |
Employment Occupations by Sex in Ridgefield borough
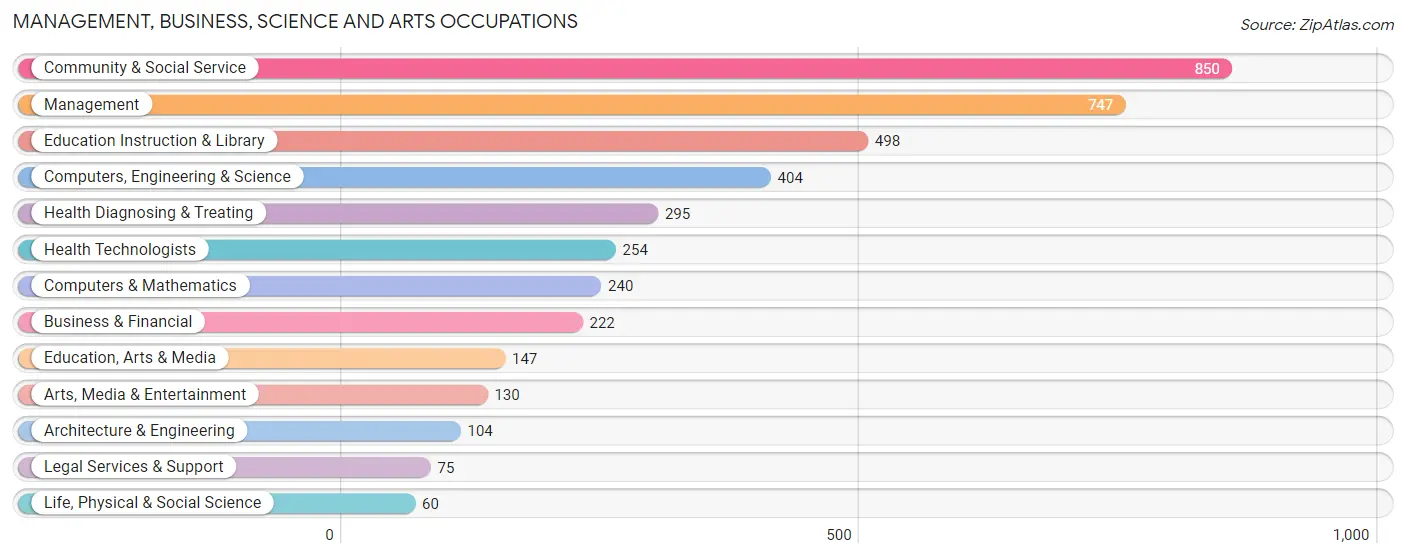
Management, Business, Science and Arts Occupations
The most common Management, Business, Science and Arts occupations in Ridgefield borough are Community & Social Service (850 | 13.9%), Management (747 | 12.2%), Education Instruction & Library (498 | 8.1%), Computers, Engineering & Science (404 | 6.6%), and Health Diagnosing & Treating (295 | 4.8%).
Management, Business, Science and Arts Occupations by Sex
Within the Management, Business, Science and Arts occupations in Ridgefield borough, the most male-oriented occupations are Life, Physical & Social Science (100.0%), Architecture & Engineering (86.5%), and Computers, Engineering & Science (77.0%), while the most female-oriented occupations are Health Diagnosing & Treating (75.2%), Health Technologists (73.2%), and Education Instruction & Library (60.6%).
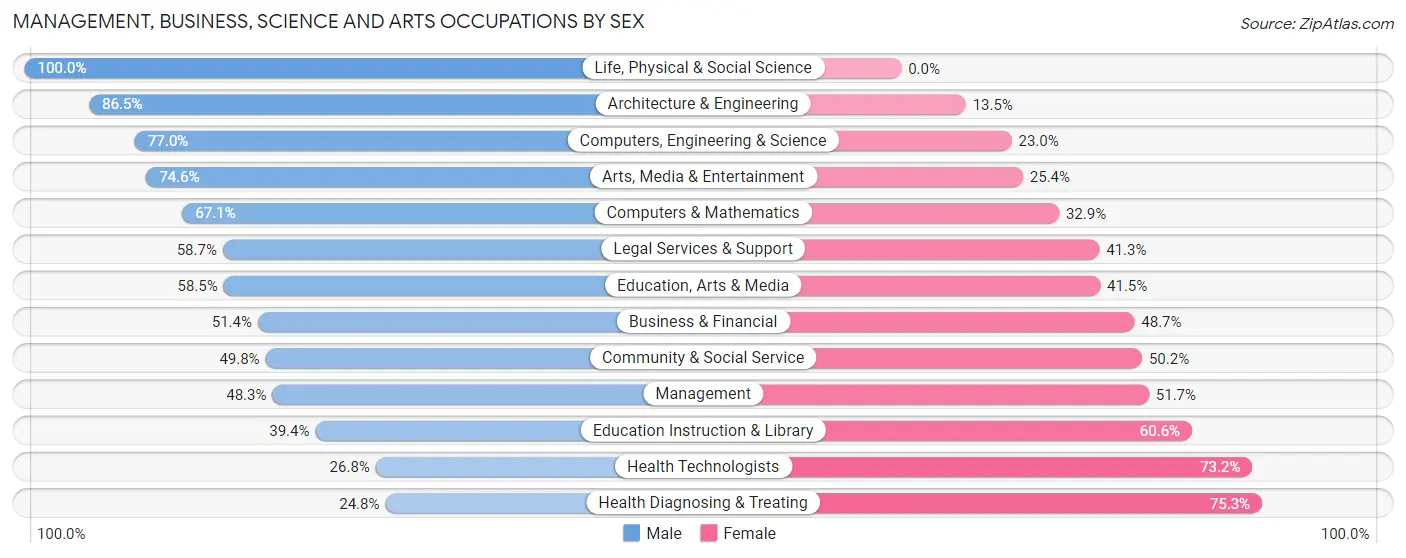
| Occupation | Male | Female |
| Management | 361 (48.3%) | 386 (51.7%) |
| Business & Financial | 114 (51.3%) | 108 (48.6%) |
| Computers, Engineering & Science | 311 (77.0%) | 93 (23.0%) |
| Computers & Mathematics | 161 (67.1%) | 79 (32.9%) |
| Architecture & Engineering | 90 (86.5%) | 14 (13.5%) |
| Life, Physical & Social Science | 60 (100.0%) | 0 (0.0%) |
| Community & Social Service | 423 (49.8%) | 427 (50.2%) |
| Education, Arts & Media | 86 (58.5%) | 61 (41.5%) |
| Legal Services & Support | 44 (58.7%) | 31 (41.3%) |
| Education Instruction & Library | 196 (39.4%) | 302 (60.6%) |
| Arts, Media & Entertainment | 97 (74.6%) | 33 (25.4%) |
| Health Diagnosing & Treating | 73 (24.7%) | 222 (75.2%) |
| Health Technologists | 68 (26.8%) | 186 (73.2%) |
| Total (Category) | 1,282 (50.9%) | 1,236 (49.1%) |
| Total (Overall) | 3,053 (49.9%) | 3,067 (50.1%) |
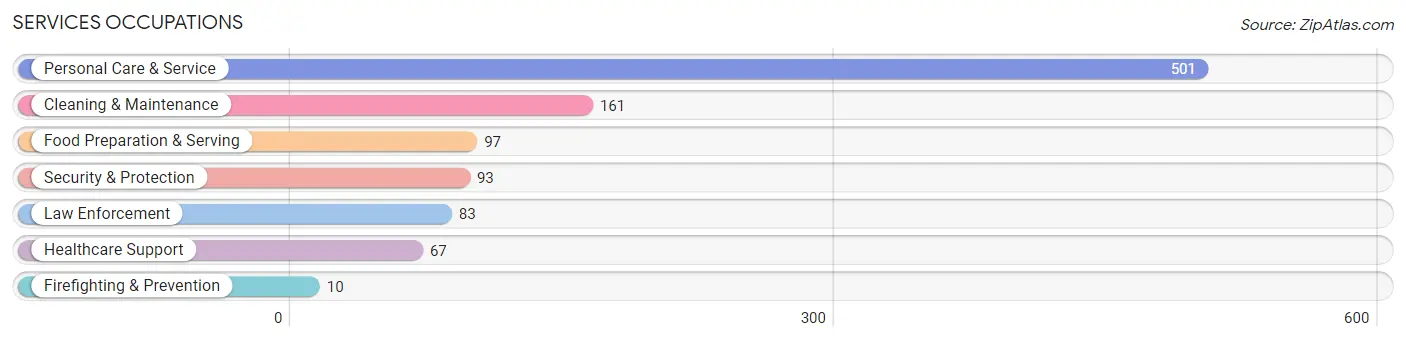
Services Occupations
The most common Services occupations in Ridgefield borough are Personal Care & Service (501 | 8.2%), Cleaning & Maintenance (161 | 2.6%), Food Preparation & Serving (97 | 1.6%), Security & Protection (93 | 1.5%), and Law Enforcement (83 | 1.4%).
Services Occupations by Sex
Within the Services occupations in Ridgefield borough, the most male-oriented occupations are Security & Protection (100.0%), Firefighting & Prevention (100.0%), and Law Enforcement (100.0%), while the most female-oriented occupations are Personal Care & Service (94.0%), Healthcare Support (74.6%), and Food Preparation & Serving (70.1%).
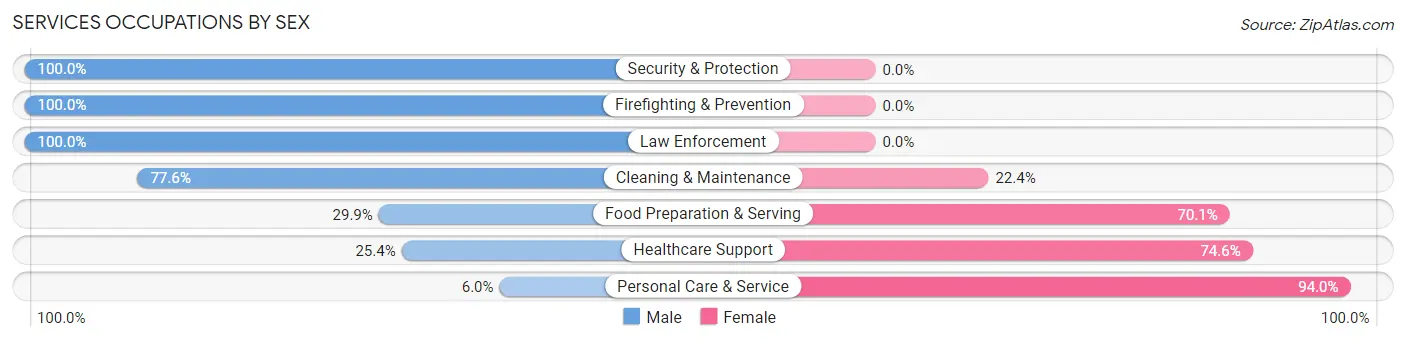
| Occupation | Male | Female |
| Healthcare Support | 17 (25.4%) | 50 (74.6%) |
| Security & Protection | 93 (100.0%) | 0 (0.0%) |
| Firefighting & Prevention | 10 (100.0%) | 0 (0.0%) |
| Law Enforcement | 83 (100.0%) | 0 (0.0%) |
| Food Preparation & Serving | 29 (29.9%) | 68 (70.1%) |
| Cleaning & Maintenance | 125 (77.6%) | 36 (22.4%) |
| Personal Care & Service | 30 (6.0%) | 471 (94.0%) |
| Total (Category) | 294 (32.0%) | 625 (68.0%) |
| Total (Overall) | 3,053 (49.9%) | 3,067 (50.1%) |
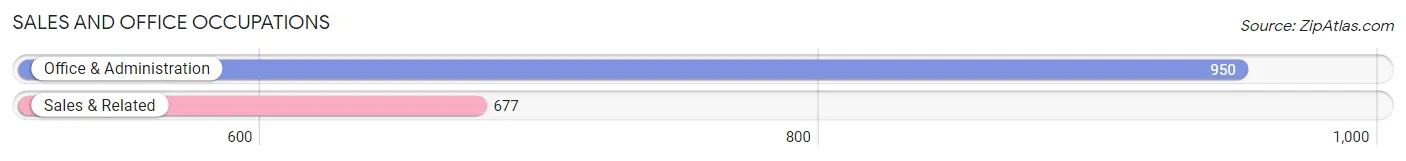
Sales and Office Occupations
The most common Sales and Office occupations in Ridgefield borough are Office & Administration (950 | 15.5%), and Sales & Related (677 | 11.1%).
Sales and Office Occupations by Sex
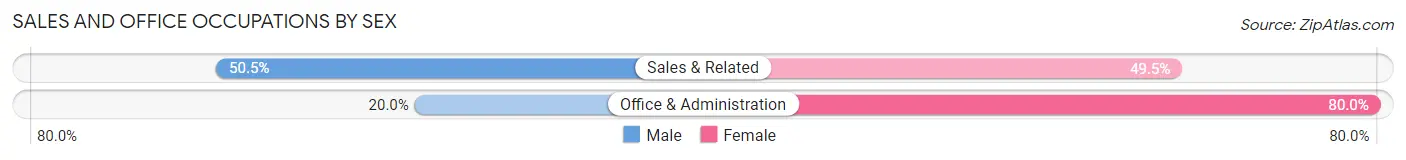
| Occupation | Male | Female |
| Sales & Related | 342 (50.5%) | 335 (49.5%) |
| Office & Administration | 190 (20.0%) | 760 (80.0%) |
| Total (Category) | 532 (32.7%) | 1,095 (67.3%) |
| Total (Overall) | 3,053 (49.9%) | 3,067 (50.1%) |
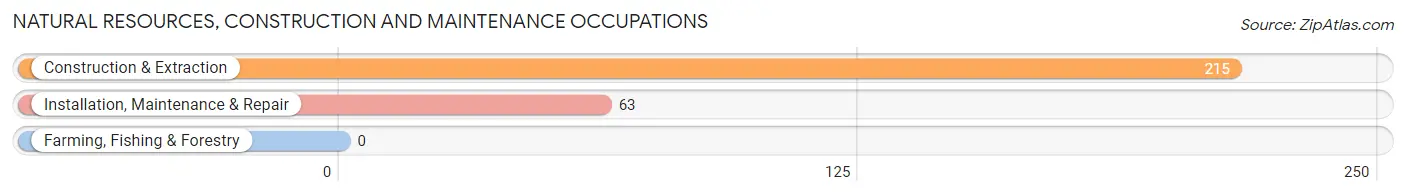
Natural Resources, Construction and Maintenance Occupations
The most common Natural Resources, Construction and Maintenance occupations in Ridgefield borough are Construction & Extraction (215 | 3.5%), and Installation, Maintenance & Repair (63 | 1.0%).
Natural Resources, Construction and Maintenance Occupations by Sex
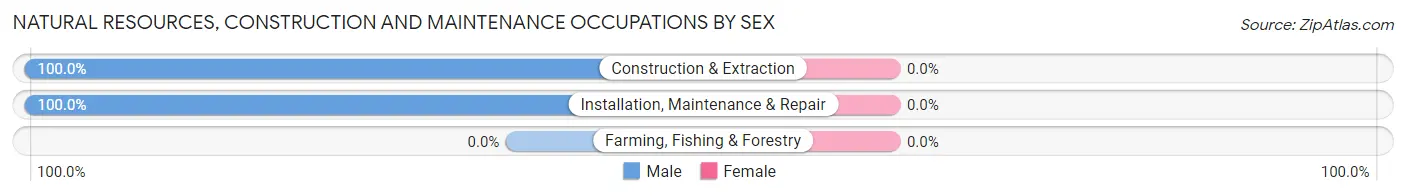
| Occupation | Male | Female |
| Farming, Fishing & Forestry | 0 (0.0%) | 0 (0.0%) |
| Construction & Extraction | 215 (100.0%) | 0 (0.0%) |
| Installation, Maintenance & Repair | 63 (100.0%) | 0 (0.0%) |
| Total (Category) | 278 (100.0%) | 0 (0.0%) |
| Total (Overall) | 3,053 (49.9%) | 3,067 (50.1%) |
Production, Transportation and Moving Occupations
The most common Production, Transportation and Moving occupations in Ridgefield borough are Production (381 | 6.2%), Transportation (239 | 3.9%), and Material Moving (158 | 2.6%).
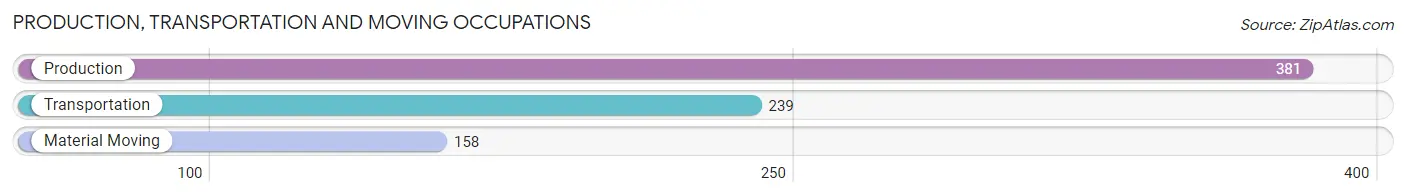
Production, Transportation and Moving Occupations by Sex
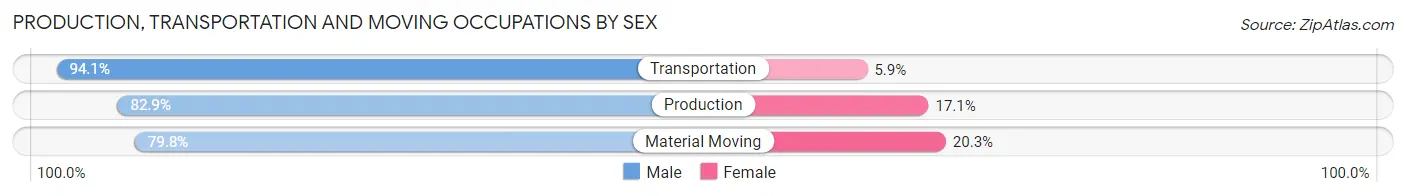
| Occupation | Male | Female |
| Production | 316 (82.9%) | 65 (17.1%) |
| Transportation | 225 (94.1%) | 14 (5.9%) |
| Material Moving | 126 (79.7%) | 32 (20.3%) |
| Total (Category) | 667 (85.7%) | 111 (14.3%) |
| Total (Overall) | 3,053 (49.9%) | 3,067 (50.1%) |
Employment Industries by Sex in Ridgefield borough
Employment Industries in Ridgefield borough
The major employment industries in Ridgefield borough include Retail Trade (936 | 15.3%), Health Care & Social Assistance (635 | 10.4%), Educational Services (603 | 9.9%), Manufacturing (476 | 7.8%), and Professional & Scientific (387 | 6.3%).
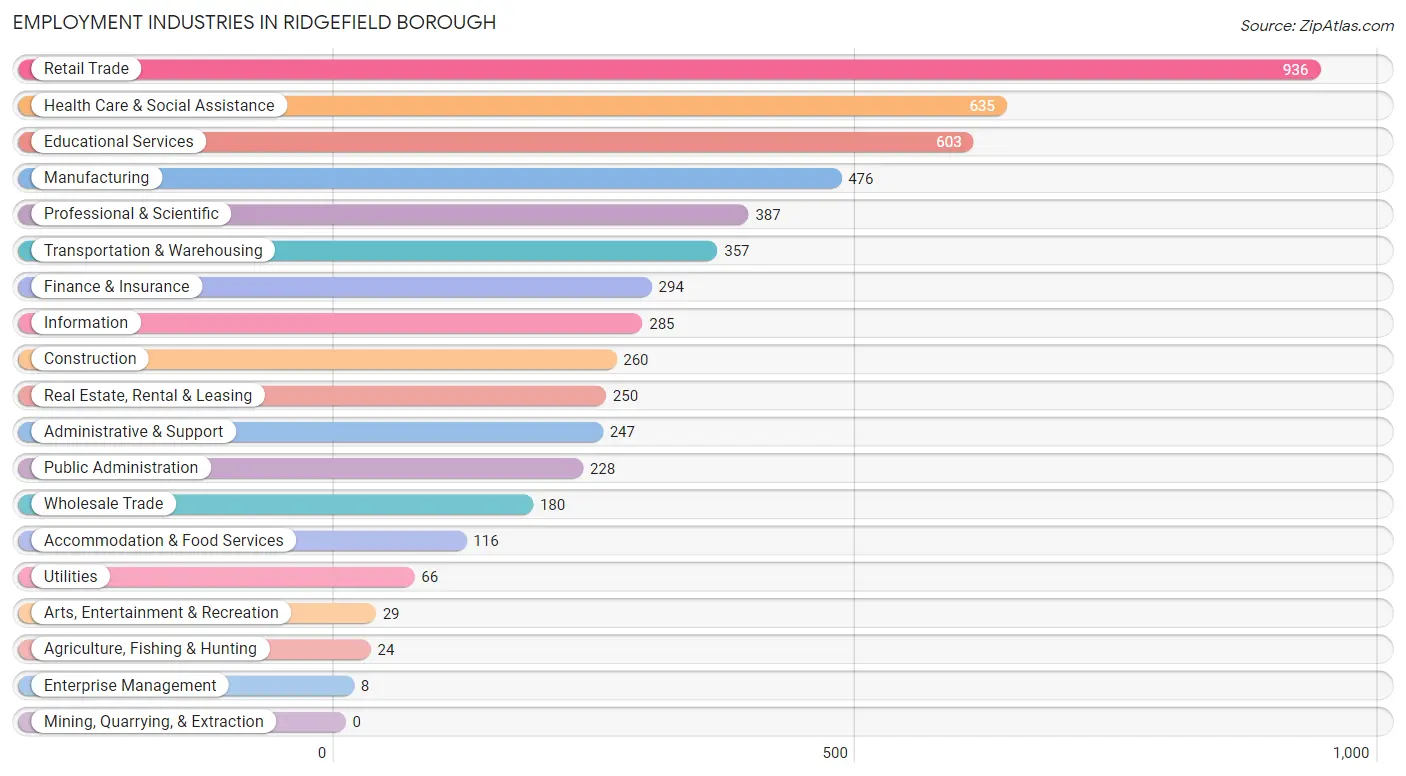
Employment Industries by Sex in Ridgefield borough
The Ridgefield borough industries that see more men than women are Agriculture, Fishing & Hunting (100.0%), Construction (92.7%), and Utilities (83.3%), whereas the industries that tend to have a higher number of women are Enterprise Management (100.0%), Real Estate, Rental & Leasing (84.0%), and Health Care & Social Assistance (73.2%).
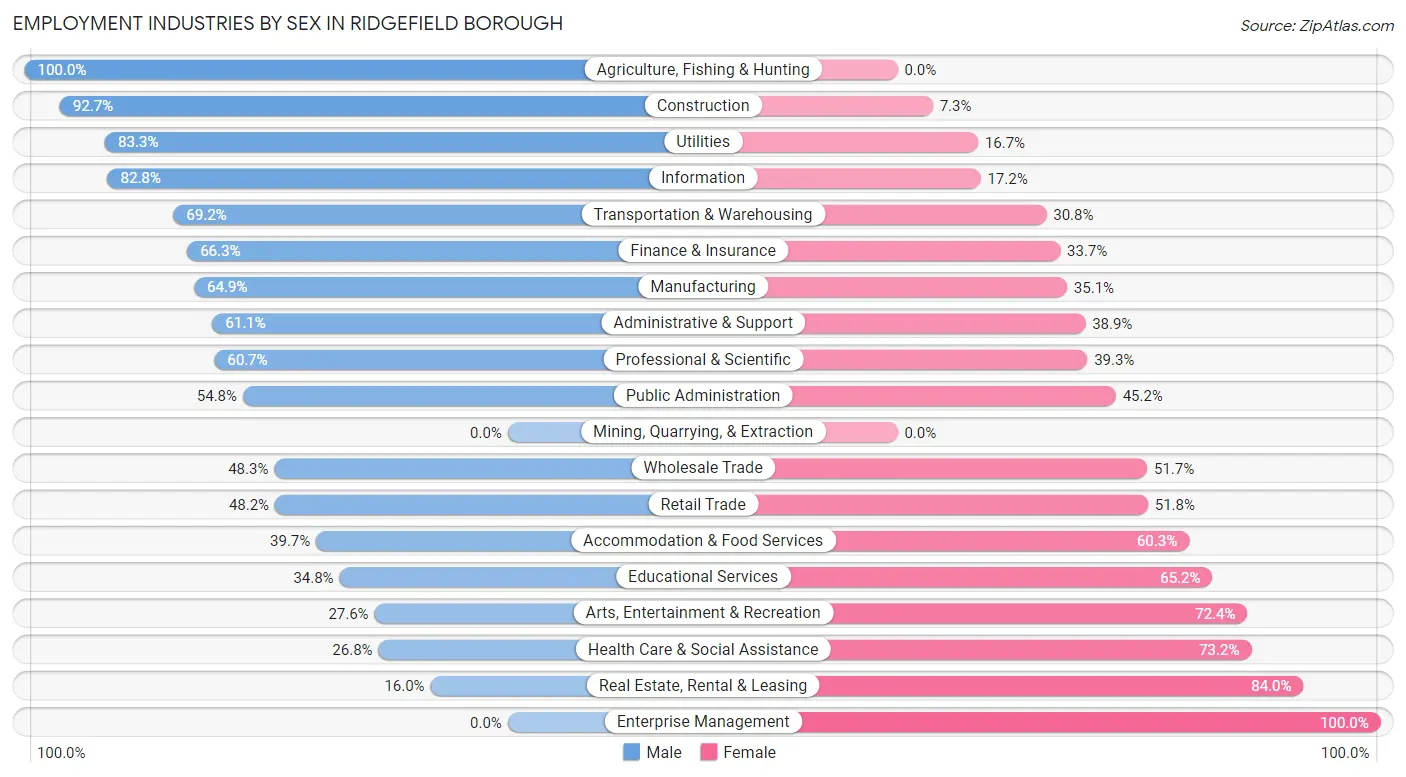
| Industry | Male | Female |
| Agriculture, Fishing & Hunting | 24 (100.0%) | 0 (0.0%) |
| Mining, Quarrying, & Extraction | 0 (0.0%) | 0 (0.0%) |
| Construction | 241 (92.7%) | 19 (7.3%) |
| Manufacturing | 309 (64.9%) | 167 (35.1%) |
| Wholesale Trade | 87 (48.3%) | 93 (51.7%) |
| Retail Trade | 451 (48.2%) | 485 (51.8%) |
| Transportation & Warehousing | 247 (69.2%) | 110 (30.8%) |
| Utilities | 55 (83.3%) | 11 (16.7%) |
| Information | 236 (82.8%) | 49 (17.2%) |
| Finance & Insurance | 195 (66.3%) | 99 (33.7%) |
| Real Estate, Rental & Leasing | 40 (16.0%) | 210 (84.0%) |
| Professional & Scientific | 235 (60.7%) | 152 (39.3%) |
| Enterprise Management | 0 (0.0%) | 8 (100.0%) |
| Administrative & Support | 151 (61.1%) | 96 (38.9%) |
| Educational Services | 210 (34.8%) | 393 (65.2%) |
| Health Care & Social Assistance | 170 (26.8%) | 465 (73.2%) |
| Arts, Entertainment & Recreation | 8 (27.6%) | 21 (72.4%) |
| Accommodation & Food Services | 46 (39.7%) | 70 (60.3%) |
| Public Administration | 125 (54.8%) | 103 (45.2%) |
| Total | 3,053 (49.9%) | 3,067 (50.1%) |
Education in Ridgefield borough
School Enrollment in Ridgefield borough
The most common levels of schooling among the 2,869 students in Ridgefield borough are middle school (747 | 26.0%), high school (719 | 25.1%), and college / undergraduate (688 | 24.0%).
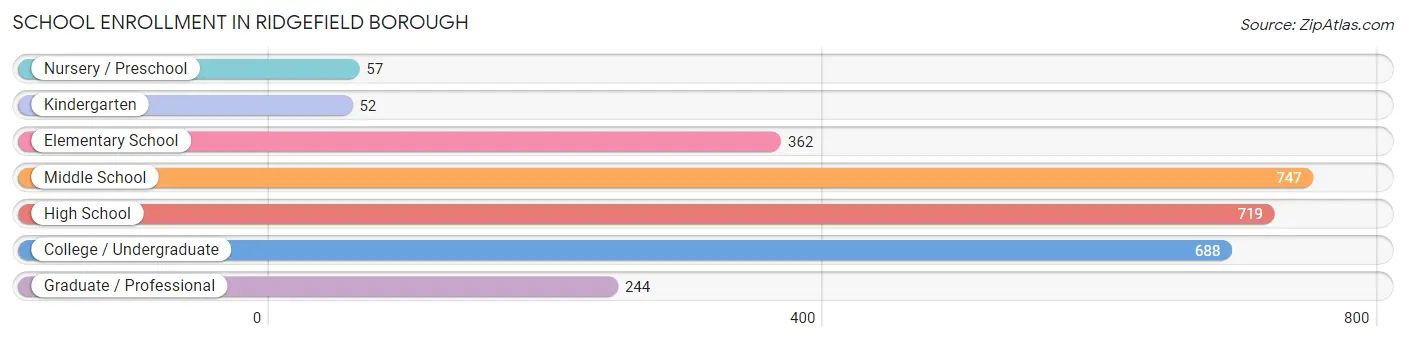
| School Level | # Students | % Students |
| Nursery / Preschool | 57 | 2.0% |
| Kindergarten | 52 | 1.8% |
| Elementary School | 362 | 12.6% |
| Middle School | 747 | 26.0% |
| High School | 719 | 25.1% |
| College / Undergraduate | 688 | 24.0% |
| Graduate / Professional | 244 | 8.5% |
| Total | 2,869 | 100.0% |
School Enrollment by Age by Funding Source in Ridgefield borough
Out of a total of 2,869 students who are enrolled in schools in Ridgefield borough, 588 (20.5%) attend a private institution, while the remaining 2,281 (79.5%) are enrolled in public schools. The age group of 3 to 4 year olds has the highest likelihood of being enrolled in private schools, with 41 (75.9% in the age bracket) enrolled. Conversely, the age group of 15 to 17 year olds has the lowest likelihood of being enrolled in a private school, with 492 (97.4% in the age bracket) attending a public institution.
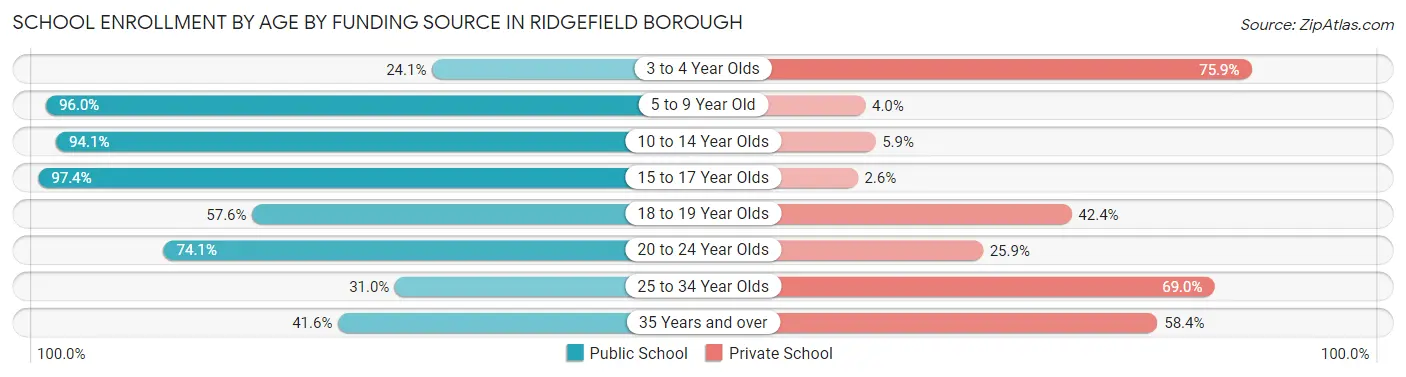
| Age Bracket | Public School | Private School |
| 3 to 4 Year Olds | 13 (24.1%) | 41 (75.9%) |
| 5 to 9 Year Old | 338 (96.0%) | 14 (4.0%) |
| 10 to 14 Year Olds | 816 (94.1%) | 51 (5.9%) |
| 15 to 17 Year Olds | 492 (97.4%) | 13 (2.6%) |
| 18 to 19 Year Olds | 133 (57.6%) | 98 (42.4%) |
| 20 to 24 Year Olds | 329 (74.1%) | 115 (25.9%) |
| 25 to 34 Year Olds | 35 (31.0%) | 78 (69.0%) |
| 35 Years and over | 126 (41.6%) | 177 (58.4%) |
| Total | 2,281 (79.5%) | 588 (20.5%) |
Educational Attainment by Field of Study in Ridgefield borough
Business (884 | 21.6%), engineering (423 | 10.3%), communications (350 | 8.5%), education (314 | 7.7%), and science & technology (312 | 7.6%) are the most common fields of study among 4,099 individuals in Ridgefield borough who have obtained a bachelor's degree or higher.
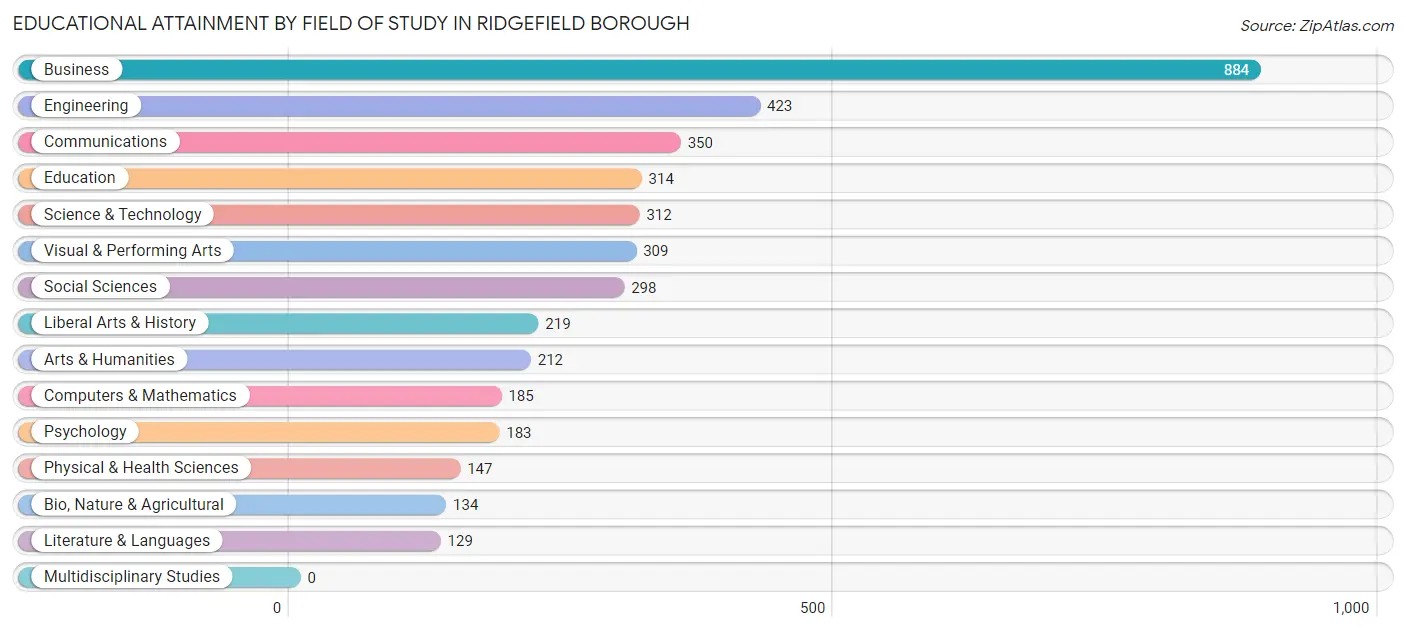
| Field of Study | # Graduates | % Graduates |
| Computers & Mathematics | 185 | 4.5% |
| Bio, Nature & Agricultural | 134 | 3.3% |
| Physical & Health Sciences | 147 | 3.6% |
| Psychology | 183 | 4.5% |
| Social Sciences | 298 | 7.3% |
| Engineering | 423 | 10.3% |
| Multidisciplinary Studies | 0 | 0.0% |
| Science & Technology | 312 | 7.6% |
| Business | 884 | 21.6% |
| Education | 314 | 7.7% |
| Literature & Languages | 129 | 3.2% |
| Liberal Arts & History | 219 | 5.3% |
| Visual & Performing Arts | 309 | 7.5% |
| Communications | 350 | 8.5% |
| Arts & Humanities | 212 | 5.2% |
| Total | 4,099 | 100.0% |
Transportation & Commute in Ridgefield borough
Vehicle Availability by Sex in Ridgefield borough
The most prevalent vehicle ownership categories in Ridgefield borough are males with 3 vehicles (1,054, accounting for 35.5%) and females with 3 vehicles (690, making up 34.5%).
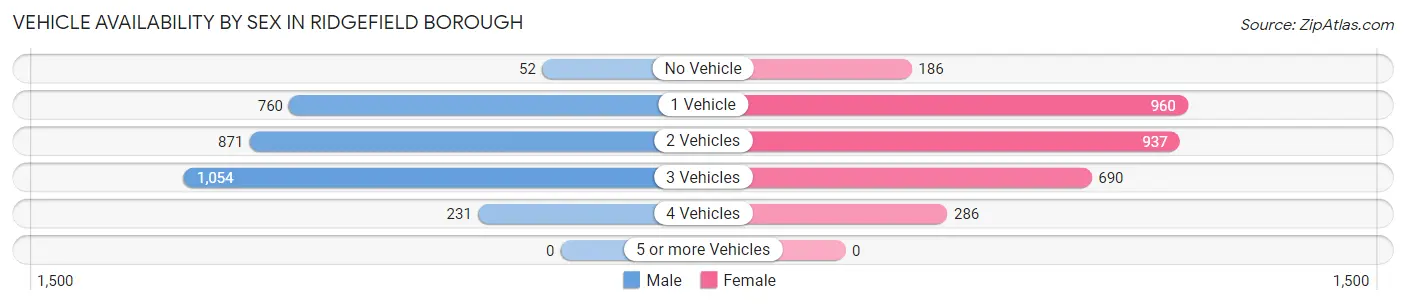
| Vehicles Available | Male | Female |
| No Vehicle | 52 (1.8%) | 186 (6.1%) |
| 1 Vehicle | 760 (25.6%) | 960 (31.4%) |
| 2 Vehicles | 871 (29.3%) | 937 (30.6%) |
| 3 Vehicles | 1,054 (35.5%) | 690 (22.6%) |
| 4 Vehicles | 231 (7.8%) | 286 (9.3%) |
| 5 or more Vehicles | 0 (0.0%) | 0 (0.0%) |
| Total | 2,968 (100.0%) | 3,059 (100.0%) |
Commute Time in Ridgefield borough
The most frequently occuring commute durations in Ridgefield borough are 15 to 19 minutes (1,103 commuters, 19.5%), 30 to 34 minutes (975 commuters, 17.2%), and 20 to 24 minutes (746 commuters, 13.2%).
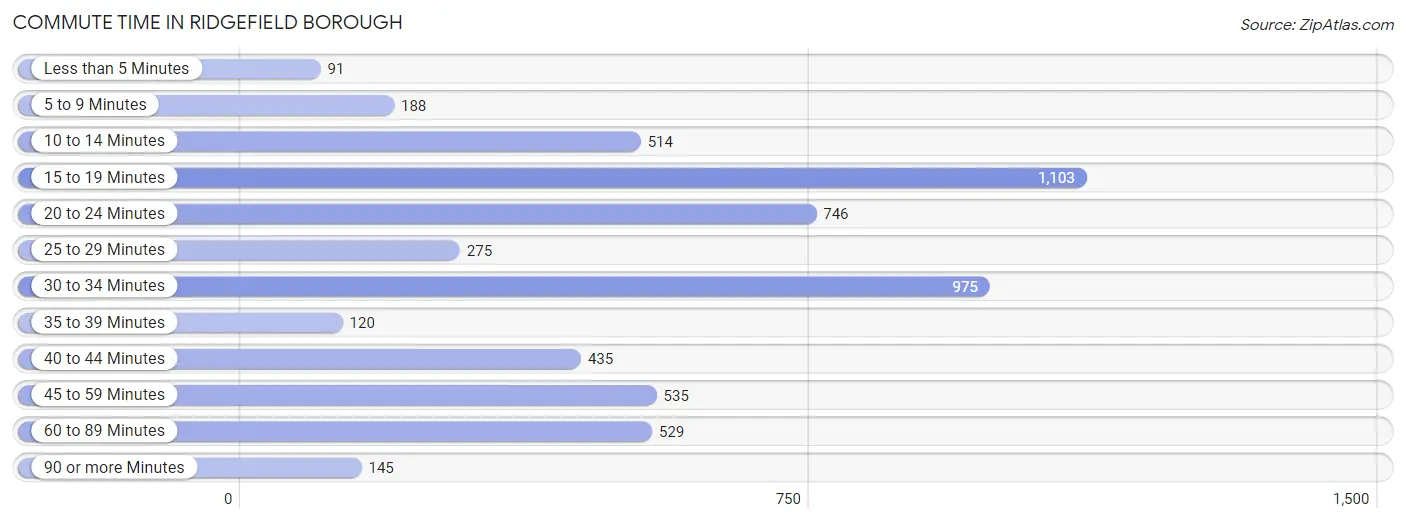
| Commute Time | # Commuters | % Commuters |
| Less than 5 Minutes | 91 | 1.6% |
| 5 to 9 Minutes | 188 | 3.3% |
| 10 to 14 Minutes | 514 | 9.1% |
| 15 to 19 Minutes | 1,103 | 19.5% |
| 20 to 24 Minutes | 746 | 13.2% |
| 25 to 29 Minutes | 275 | 4.9% |
| 30 to 34 Minutes | 975 | 17.2% |
| 35 to 39 Minutes | 120 | 2.1% |
| 40 to 44 Minutes | 435 | 7.7% |
| 45 to 59 Minutes | 535 | 9.5% |
| 60 to 89 Minutes | 529 | 9.3% |
| 90 or more Minutes | 145 | 2.6% |
Commute Time by Sex in Ridgefield borough
The most common commute times in Ridgefield borough are 15 to 19 minutes (570 commuters, 20.1%) for males and 15 to 19 minutes (533 commuters, 18.9%) for females.
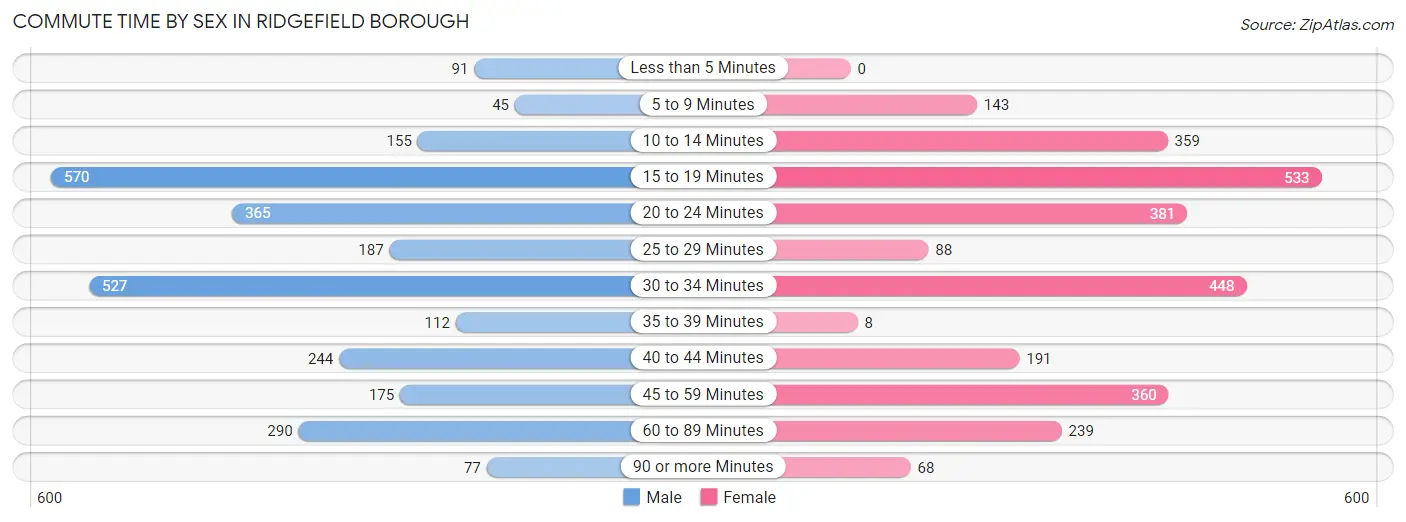
| Commute Time | Male | Female |
| Less than 5 Minutes | 91 (3.2%) | 0 (0.0%) |
| 5 to 9 Minutes | 45 (1.6%) | 143 (5.1%) |
| 10 to 14 Minutes | 155 (5.5%) | 359 (12.7%) |
| 15 to 19 Minutes | 570 (20.1%) | 533 (18.9%) |
| 20 to 24 Minutes | 365 (12.9%) | 381 (13.5%) |
| 25 to 29 Minutes | 187 (6.6%) | 88 (3.1%) |
| 30 to 34 Minutes | 527 (18.6%) | 448 (15.9%) |
| 35 to 39 Minutes | 112 (4.0%) | 8 (0.3%) |
| 40 to 44 Minutes | 244 (8.6%) | 191 (6.8%) |
| 45 to 59 Minutes | 175 (6.2%) | 360 (12.8%) |
| 60 to 89 Minutes | 290 (10.2%) | 239 (8.5%) |
| 90 or more Minutes | 77 (2.7%) | 68 (2.4%) |
Time of Departure to Work by Sex in Ridgefield borough
The most frequent times of departure to work in Ridgefield borough are 8:00 AM to 8:29 AM (502, 17.7%) for males and 8:30 AM to 8:59 AM (565, 20.1%) for females.
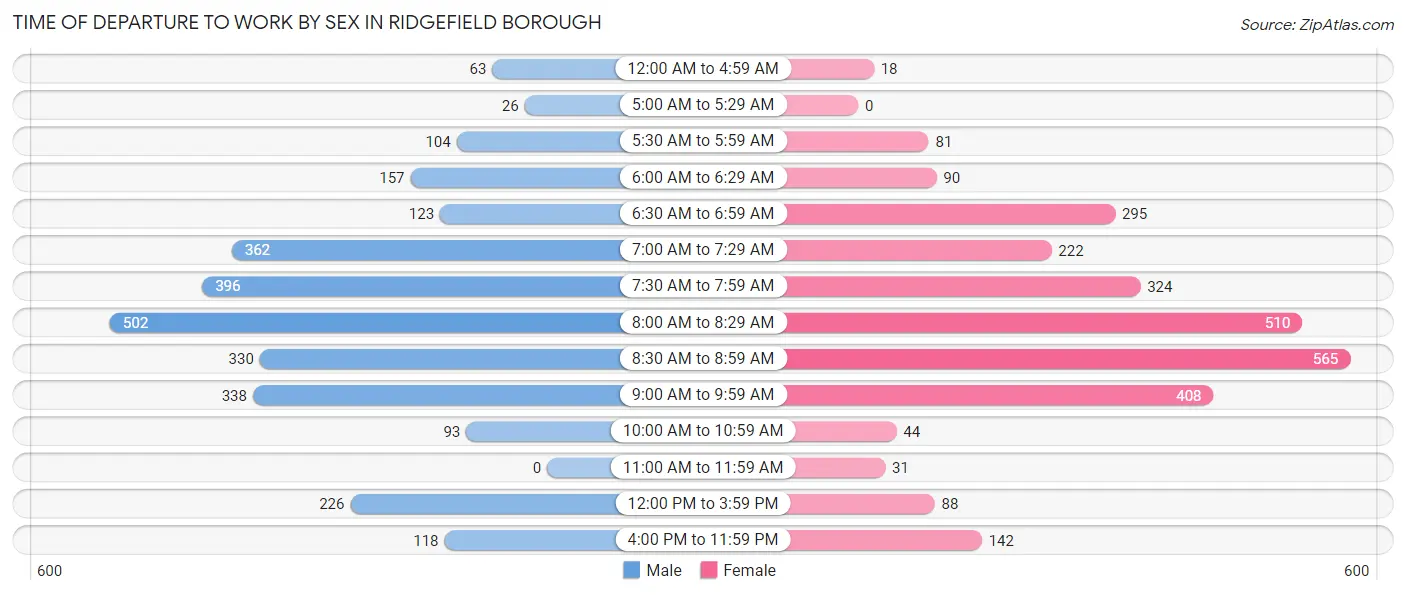
| Time of Departure | Male | Female |
| 12:00 AM to 4:59 AM | 63 (2.2%) | 18 (0.6%) |
| 5:00 AM to 5:29 AM | 26 (0.9%) | 0 (0.0%) |
| 5:30 AM to 5:59 AM | 104 (3.7%) | 81 (2.9%) |
| 6:00 AM to 6:29 AM | 157 (5.5%) | 90 (3.2%) |
| 6:30 AM to 6:59 AM | 123 (4.3%) | 295 (10.5%) |
| 7:00 AM to 7:29 AM | 362 (12.8%) | 222 (7.9%) |
| 7:30 AM to 7:59 AM | 396 (14.0%) | 324 (11.5%) |
| 8:00 AM to 8:29 AM | 502 (17.7%) | 510 (18.1%) |
| 8:30 AM to 8:59 AM | 330 (11.6%) | 565 (20.1%) |
| 9:00 AM to 9:59 AM | 338 (11.9%) | 408 (14.5%) |
| 10:00 AM to 10:59 AM | 93 (3.3%) | 44 (1.6%) |
| 11:00 AM to 11:59 AM | 0 (0.0%) | 31 (1.1%) |
| 12:00 PM to 3:59 PM | 226 (8.0%) | 88 (3.1%) |
| 4:00 PM to 11:59 PM | 118 (4.2%) | 142 (5.0%) |
| Total | 2,838 (100.0%) | 2,818 (100.0%) |
Housing Occupancy in Ridgefield borough
Occupancy by Ownership in Ridgefield borough
Of the total 4,028 dwellings in Ridgefield borough, owner-occupied units account for 1,859 (46.2%), while renter-occupied units make up 2,169 (53.8%).
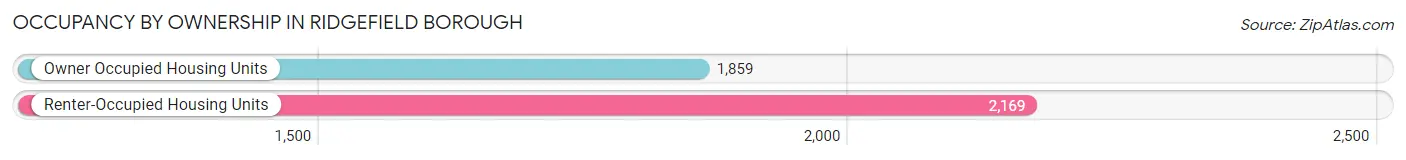
| Occupancy | # Housing Units | % Housing Units |
| Owner Occupied Housing Units | 1,859 | 46.2% |
| Renter-Occupied Housing Units | 2,169 | 53.8% |
| Total Occupied Housing Units | 4,028 | 100.0% |
Occupancy by Household Size in Ridgefield borough
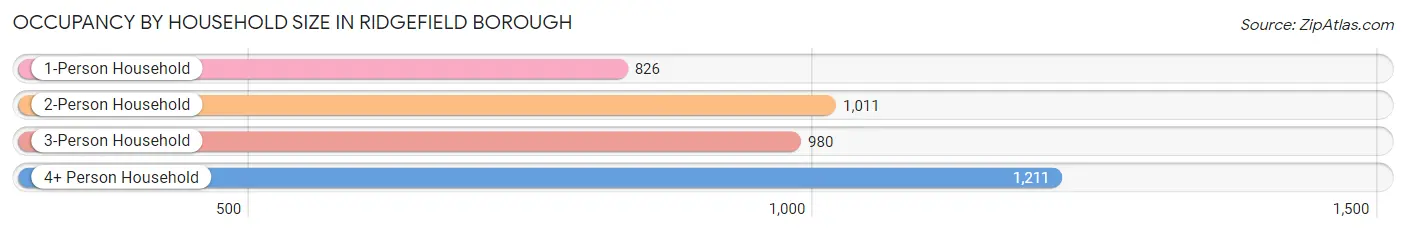
| Household Size | # Housing Units | % Housing Units |
| 1-Person Household | 826 | 20.5% |
| 2-Person Household | 1,011 | 25.1% |
| 3-Person Household | 980 | 24.3% |
| 4+ Person Household | 1,211 | 30.1% |
| Total Housing Units | 4,028 | 100.0% |
Occupancy by Ownership by Household Size in Ridgefield borough
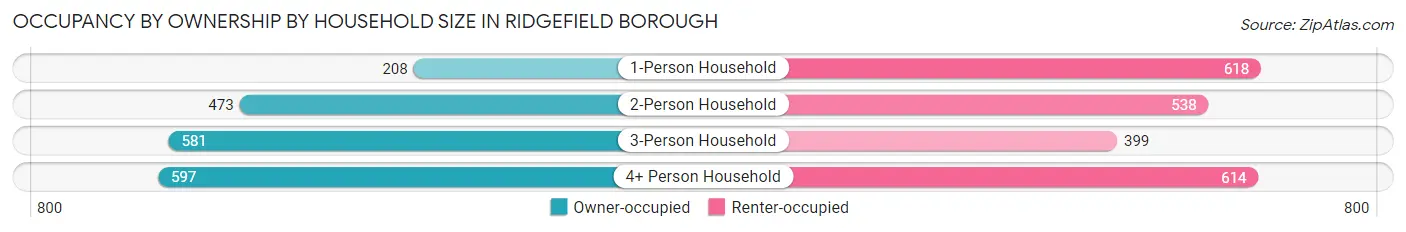
| Household Size | Owner-occupied | Renter-occupied |
| 1-Person Household | 208 (25.2%) | 618 (74.8%) |
| 2-Person Household | 473 (46.8%) | 538 (53.2%) |
| 3-Person Household | 581 (59.3%) | 399 (40.7%) |
| 4+ Person Household | 597 (49.3%) | 614 (50.7%) |
| Total Housing Units | 1,859 (46.2%) | 2,169 (53.8%) |
Occupancy by Educational Attainment in Ridgefield borough
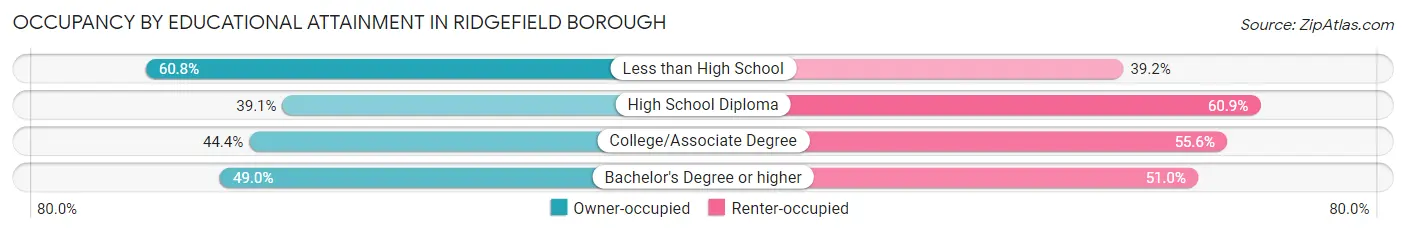
| Household Size | Owner-occupied | Renter-occupied |
| Less than High School | 127 (60.8%) | 82 (39.2%) |
| High School Diploma | 381 (39.1%) | 593 (60.9%) |
| College/Associate Degree | 416 (44.4%) | 521 (55.6%) |
| Bachelor's Degree or higher | 935 (49.0%) | 973 (51.0%) |
Occupancy by Age of Householder in Ridgefield borough
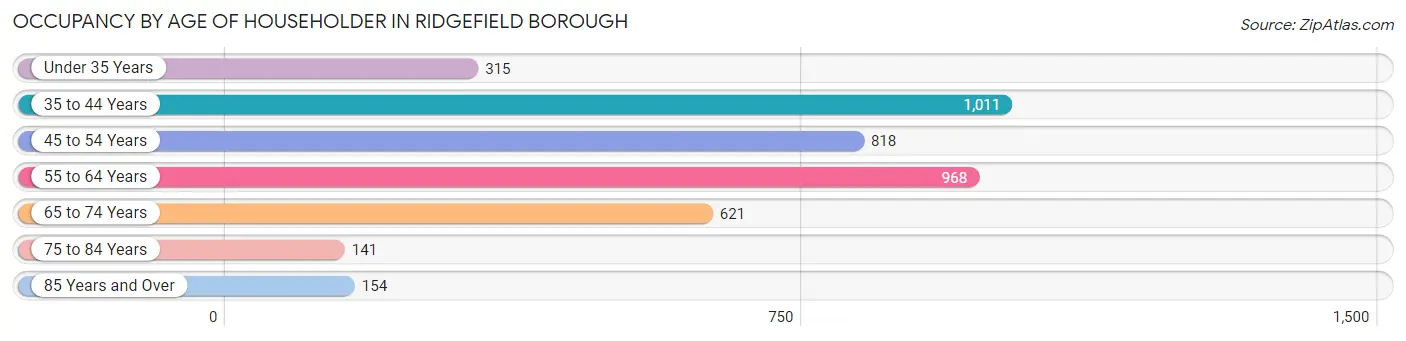
| Age Bracket | # Households | % Households |
| Under 35 Years | 315 | 7.8% |
| 35 to 44 Years | 1,011 | 25.1% |
| 45 to 54 Years | 818 | 20.3% |
| 55 to 64 Years | 968 | 24.0% |
| 65 to 74 Years | 621 | 15.4% |
| 75 to 84 Years | 141 | 3.5% |
| 85 Years and Over | 154 | 3.8% |
| Total | 4,028 | 100.0% |
Housing Finances in Ridgefield borough
Median Income by Occupancy in Ridgefield borough
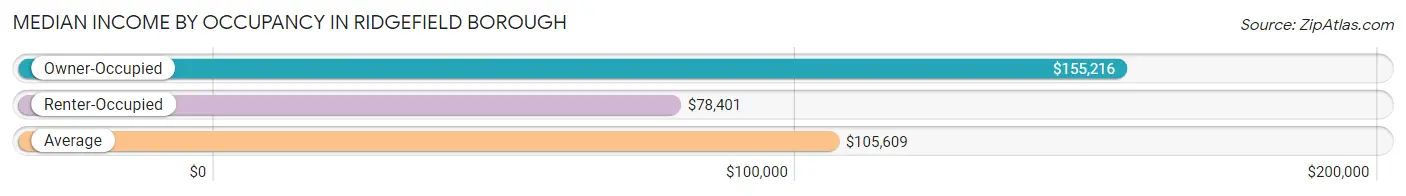
| Occupancy Type | # Households | Median Income |
| Owner-Occupied | 1,859 (46.2%) | $155,216 |
| Renter-Occupied | 2,169 (53.8%) | $78,401 |
| Average | 4,028 (100.0%) | $105,609 |
Occupancy by Householder Income Bracket in Ridgefield borough
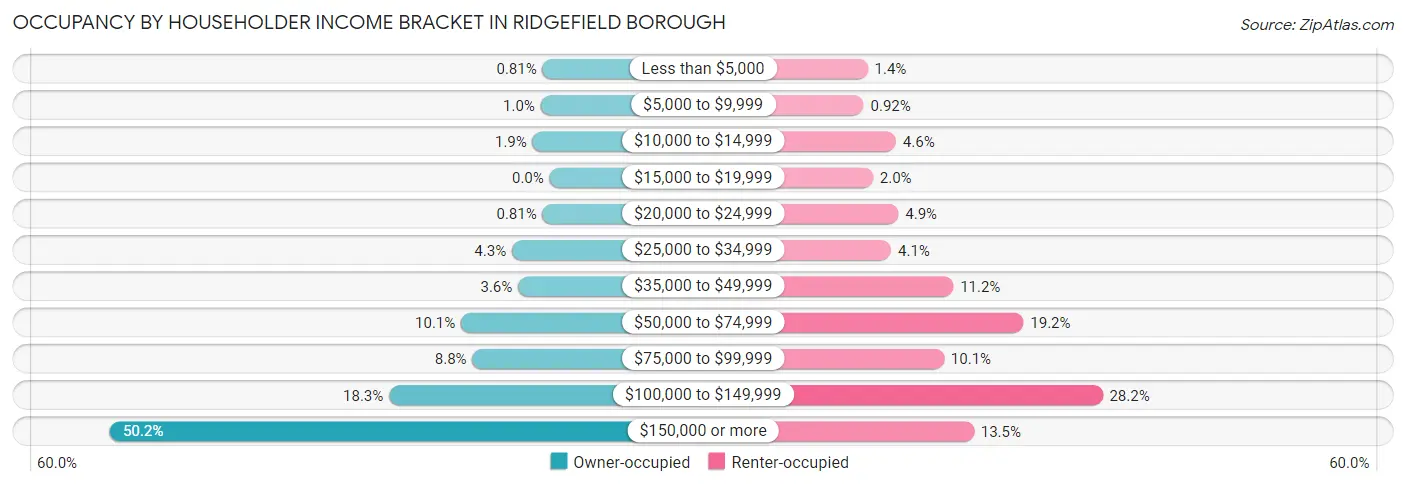
| Income Bracket | Owner-occupied | Renter-occupied |
| Less than $5,000 | 15 (0.8%) | 30 (1.4%) |
| $5,000 to $9,999 | 19 (1.0%) | 20 (0.9%) |
| $10,000 to $14,999 | 36 (1.9%) | 100 (4.6%) |
| $15,000 to $19,999 | 0 (0.0%) | 43 (2.0%) |
| $20,000 to $24,999 | 15 (0.8%) | 106 (4.9%) |
| $25,000 to $34,999 | 80 (4.3%) | 88 (4.1%) |
| $35,000 to $49,999 | 67 (3.6%) | 242 (11.2%) |
| $50,000 to $74,999 | 188 (10.1%) | 416 (19.2%) |
| $75,000 to $99,999 | 164 (8.8%) | 219 (10.1%) |
| $100,000 to $149,999 | 341 (18.3%) | 612 (28.2%) |
| $150,000 or more | 934 (50.2%) | 293 (13.5%) |
| Total | 1,859 (100.0%) | 2,169 (100.0%) |
Monthly Housing Cost Tiers in Ridgefield borough
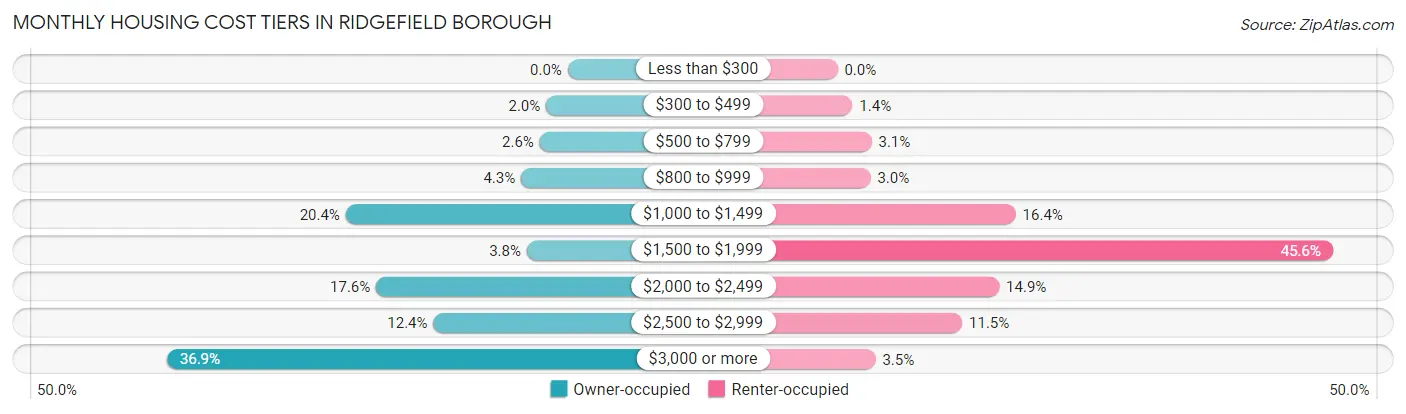
| Monthly Cost | Owner-occupied | Renter-occupied |
| Less than $300 | 0 (0.0%) | 0 (0.0%) |
| $300 to $499 | 37 (2.0%) | 30 (1.4%) |
| $500 to $799 | 48 (2.6%) | 68 (3.1%) |
| $800 to $999 | 80 (4.3%) | 66 (3.0%) |
| $1,000 to $1,499 | 380 (20.4%) | 356 (16.4%) |
| $1,500 to $1,999 | 70 (3.8%) | 989 (45.6%) |
| $2,000 to $2,499 | 328 (17.6%) | 323 (14.9%) |
| $2,500 to $2,999 | 230 (12.4%) | 249 (11.5%) |
| $3,000 or more | 686 (36.9%) | 76 (3.5%) |
| Total | 1,859 (100.0%) | 2,169 (100.0%) |
Physical Housing Characteristics in Ridgefield borough
Housing Structures in Ridgefield borough
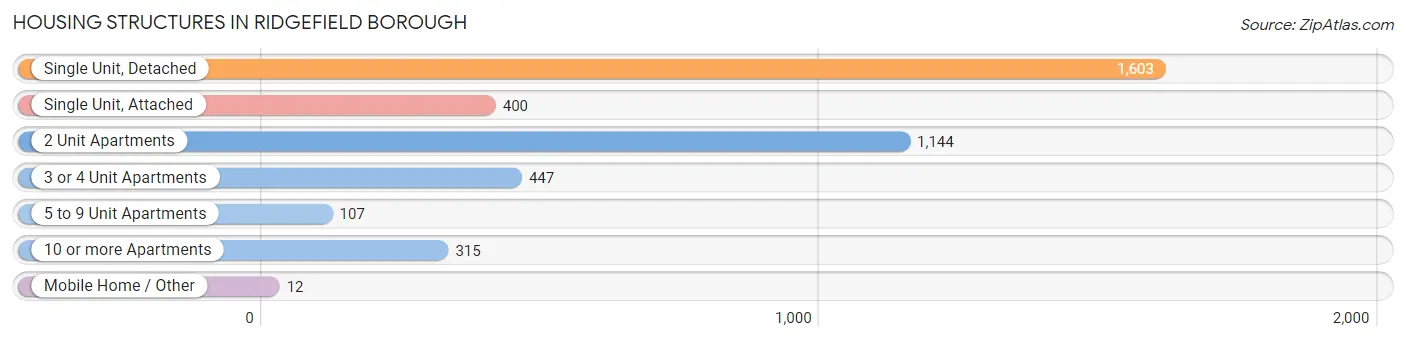
| Structure Type | # Housing Units | % Housing Units |
| Single Unit, Detached | 1,603 | 39.8% |
| Single Unit, Attached | 400 | 9.9% |
| 2 Unit Apartments | 1,144 | 28.4% |
| 3 or 4 Unit Apartments | 447 | 11.1% |
| 5 to 9 Unit Apartments | 107 | 2.7% |
| 10 or more Apartments | 315 | 7.8% |
| Mobile Home / Other | 12 | 0.3% |
| Total | 4,028 | 100.0% |
Housing Structures by Occupancy in Ridgefield borough
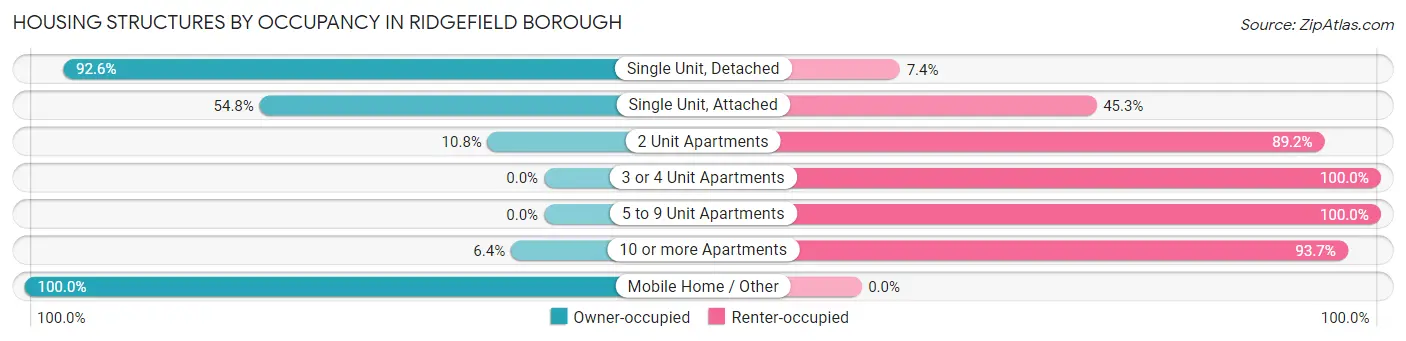
| Structure Type | Owner-occupied | Renter-occupied |
| Single Unit, Detached | 1,484 (92.6%) | 119 (7.4%) |
| Single Unit, Attached | 219 (54.7%) | 181 (45.3%) |
| 2 Unit Apartments | 124 (10.8%) | 1,020 (89.2%) |
| 3 or 4 Unit Apartments | 0 (0.0%) | 447 (100.0%) |
| 5 to 9 Unit Apartments | 0 (0.0%) | 107 (100.0%) |
| 10 or more Apartments | 20 (6.4%) | 295 (93.6%) |
| Mobile Home / Other | 12 (100.0%) | 0 (0.0%) |
| Total | 1,859 (46.2%) | 2,169 (53.8%) |
Housing Structures by Number of Rooms in Ridgefield borough
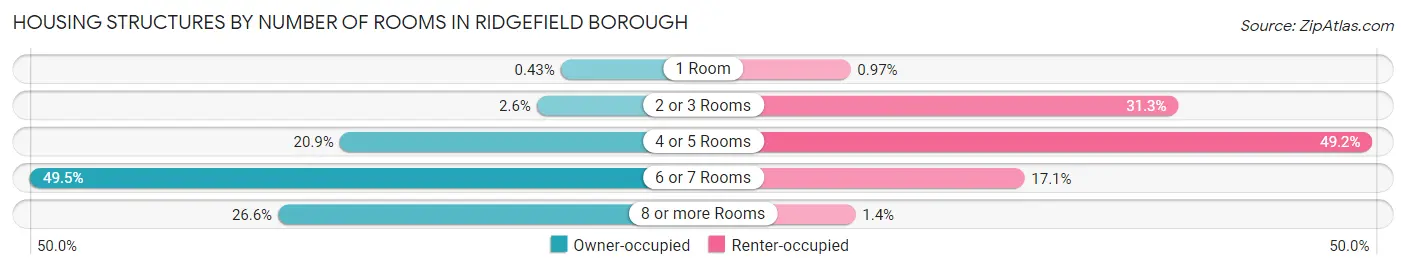
| Number of Rooms | Owner-occupied | Renter-occupied |
| 1 Room | 8 (0.4%) | 21 (1.0%) |
| 2 or 3 Rooms | 49 (2.6%) | 679 (31.3%) |
| 4 or 5 Rooms | 388 (20.9%) | 1,068 (49.2%) |
| 6 or 7 Rooms | 920 (49.5%) | 370 (17.1%) |
| 8 or more Rooms | 494 (26.6%) | 31 (1.4%) |
| Total | 1,859 (100.0%) | 2,169 (100.0%) |
Housing Structure by Heating Type in Ridgefield borough
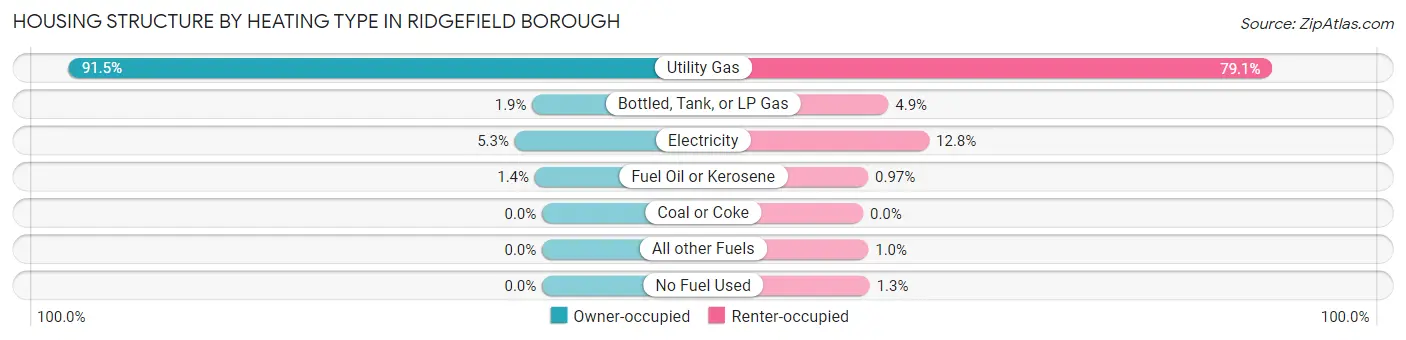
| Heating Type | Owner-occupied | Renter-occupied |
| Utility Gas | 1,700 (91.4%) | 1,715 (79.1%) |
| Bottled, Tank, or LP Gas | 35 (1.9%) | 106 (4.9%) |
| Electricity | 98 (5.3%) | 277 (12.8%) |
| Fuel Oil or Kerosene | 26 (1.4%) | 21 (1.0%) |
| Coal or Coke | 0 (0.0%) | 0 (0.0%) |
| All other Fuels | 0 (0.0%) | 22 (1.0%) |
| No Fuel Used | 0 (0.0%) | 28 (1.3%) |
| Total | 1,859 (100.0%) | 2,169 (100.0%) |
Household Vehicle Usage in Ridgefield borough
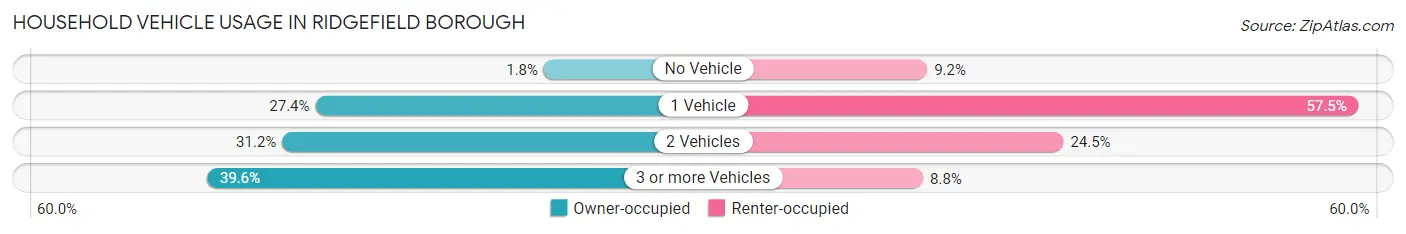
| Vehicles per Household | Owner-occupied | Renter-occupied |
| No Vehicle | 34 (1.8%) | 200 (9.2%) |
| 1 Vehicle | 510 (27.4%) | 1,248 (57.5%) |
| 2 Vehicles | 579 (31.1%) | 531 (24.5%) |
| 3 or more Vehicles | 736 (39.6%) | 190 (8.8%) |
| Total | 1,859 (100.0%) | 2,169 (100.0%) |
Real Estate & Mortgages in Ridgefield borough
Real Estate and Mortgage Overview in Ridgefield borough
| Characteristic | Without Mortgage | With Mortgage |
| Housing Units | 666 | 1,193 |
| Median Property Value | $482,800 | $599,200 |
| Median Household Income | $97,118 | $715 |
| Monthly Housing Costs | $1,225 | $686 |
| Real Estate Taxes | $9,102 | $0 |
Property Value by Mortgage Status in Ridgefield borough
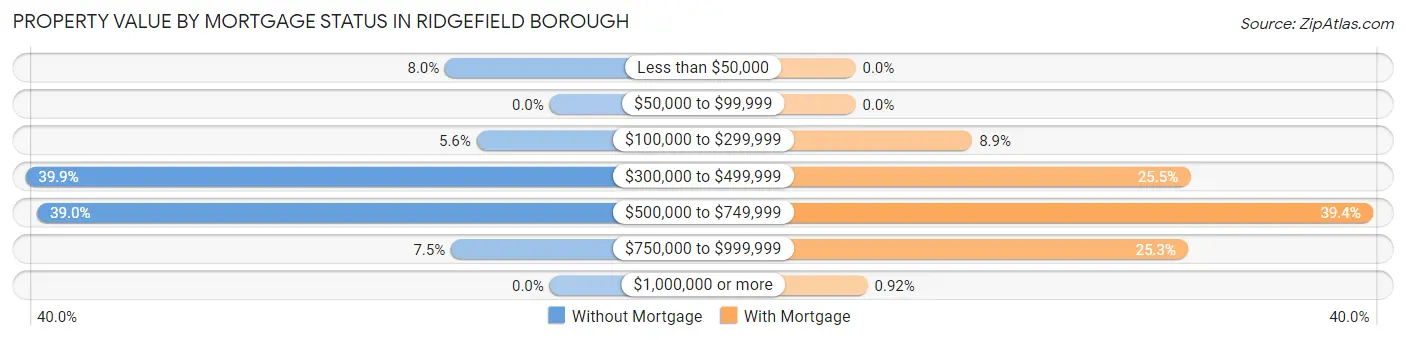
| Property Value | Without Mortgage | With Mortgage |
| Less than $50,000 | 53 (8.0%) | 0 (0.0%) |
| $50,000 to $99,999 | 0 (0.0%) | 0 (0.0%) |
| $100,000 to $299,999 | 37 (5.6%) | 106 (8.9%) |
| $300,000 to $499,999 | 266 (39.9%) | 304 (25.5%) |
| $500,000 to $749,999 | 260 (39.0%) | 470 (39.4%) |
| $750,000 to $999,999 | 50 (7.5%) | 302 (25.3%) |
| $1,000,000 or more | 0 (0.0%) | 11 (0.9%) |
| Total | 666 (100.0%) | 1,193 (100.0%) |
Household Income by Mortgage Status in Ridgefield borough
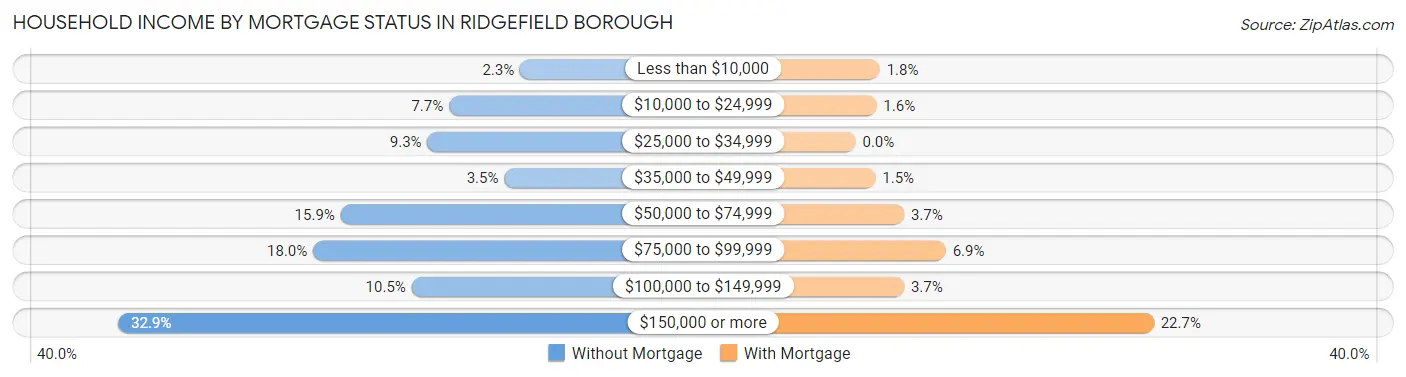
| Household Income | Without Mortgage | With Mortgage |
| Less than $10,000 | 15 (2.2%) | 22 (1.8%) |
| $10,000 to $24,999 | 51 (7.7%) | 19 (1.6%) |
| $25,000 to $34,999 | 62 (9.3%) | 0 (0.0%) |
| $35,000 to $49,999 | 23 (3.5%) | 18 (1.5%) |
| $50,000 to $74,999 | 106 (15.9%) | 44 (3.7%) |
| $75,000 to $99,999 | 120 (18.0%) | 82 (6.9%) |
| $100,000 to $149,999 | 70 (10.5%) | 44 (3.7%) |
| $150,000 or more | 219 (32.9%) | 271 (22.7%) |
| Total | 666 (100.0%) | 1,193 (100.0%) |
Property Value to Household Income Ratio in Ridgefield borough
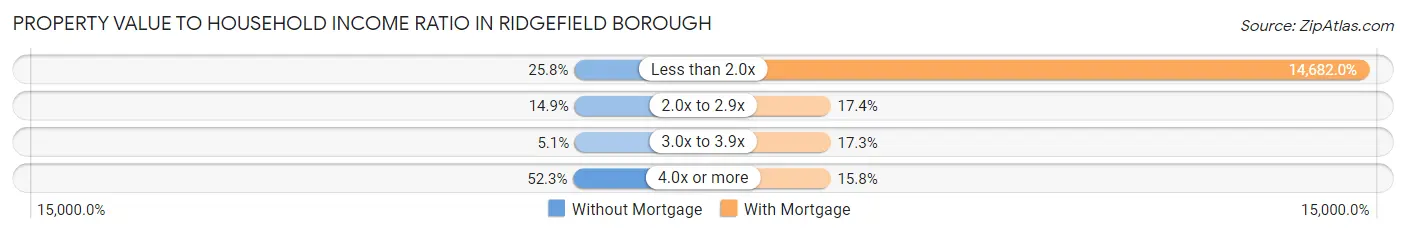
| Value-to-Income Ratio | Without Mortgage | With Mortgage |
| Less than 2.0x | 172 (25.8%) | 175,156 (14,682.0%) |
| 2.0x to 2.9x | 99 (14.9%) | 207 (17.3%) |
| 3.0x to 3.9x | 34 (5.1%) | 206 (17.3%) |
| 4.0x or more | 348 (52.2%) | 189 (15.8%) |
| Total | 666 (100.0%) | 1,193 (100.0%) |
Real Estate Taxes by Mortgage Status in Ridgefield borough
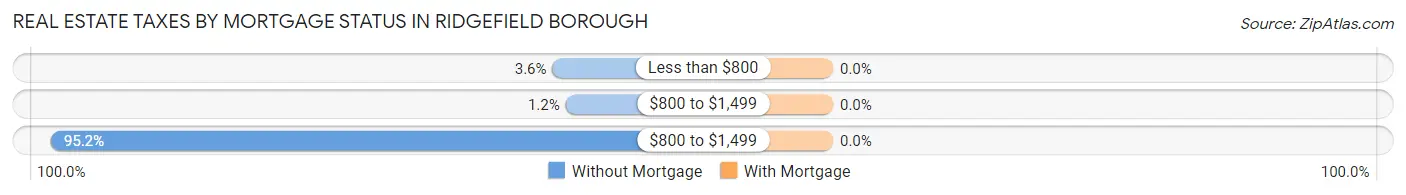
| Property Taxes | Without Mortgage | With Mortgage |
| Less than $800 | 24 (3.6%) | 0 (0.0%) |
| $800 to $1,499 | 8 (1.2%) | 0 (0.0%) |
| $800 to $1,499 | 634 (95.2%) | 0 (0.0%) |
| Total | 666 (100.0%) | 1,193 (100.0%) |
Health & Disability in Ridgefield borough
Health Insurance Coverage by Age in Ridgefield borough
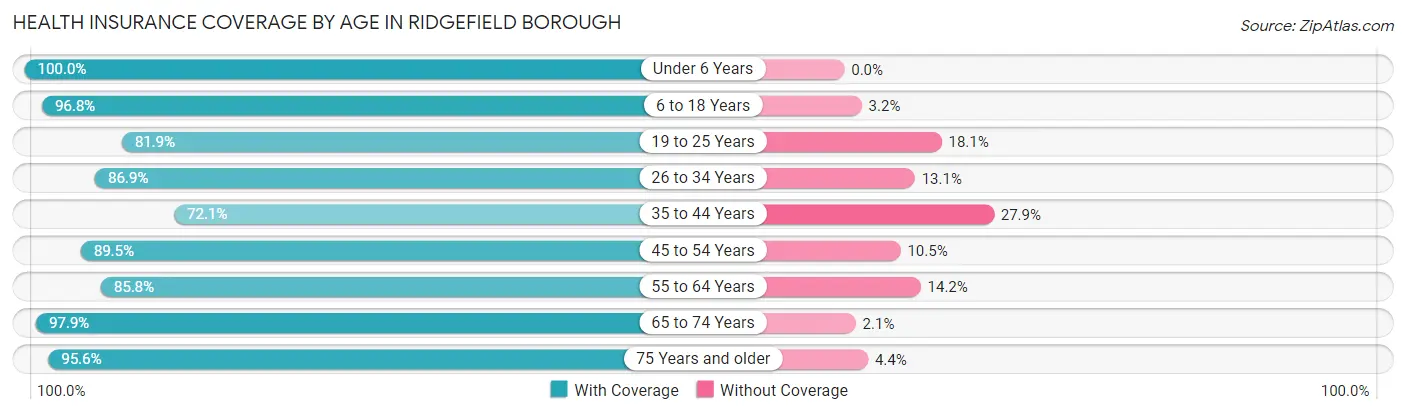
| Age Bracket | With Coverage | Without Coverage |
| Under 6 Years | 333 (100.0%) | 0 (0.0%) |
| 6 to 18 Years | 1,914 (96.8%) | 64 (3.2%) |
| 19 to 25 Years | 804 (81.9%) | 178 (18.1%) |
| 26 to 34 Years | 1,130 (86.9%) | 171 (13.1%) |
| 35 to 44 Years | 1,234 (72.1%) | 477 (27.9%) |
| 45 to 54 Years | 1,315 (89.5%) | 154 (10.5%) |
| 55 to 64 Years | 1,712 (85.8%) | 284 (14.2%) |
| 65 to 74 Years | 1,106 (97.9%) | 24 (2.1%) |
| 75 Years and older | 540 (95.6%) | 25 (4.4%) |
| Total | 10,088 (88.0%) | 1,377 (12.0%) |
Health Insurance Coverage by Citizenship Status in Ridgefield borough
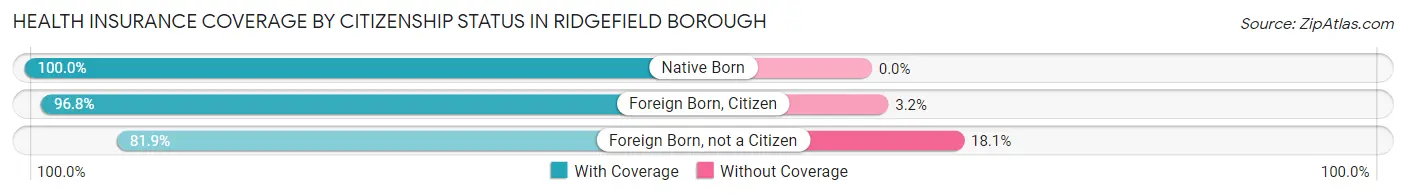
| Citizenship Status | With Coverage | Without Coverage |
| Native Born | 333 (100.0%) | 0 (0.0%) |
| Foreign Born, Citizen | 1,914 (96.8%) | 64 (3.2%) |
| Foreign Born, not a Citizen | 804 (81.9%) | 178 (18.1%) |
Health Insurance Coverage by Household Income in Ridgefield borough
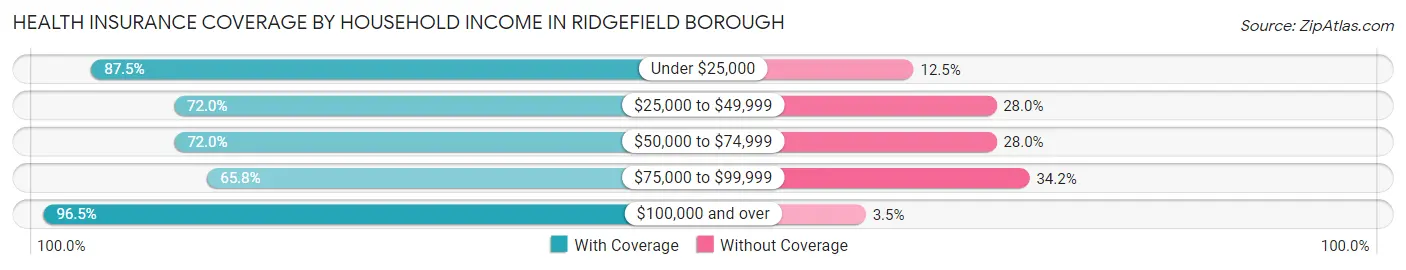
| Household Income | With Coverage | Without Coverage |
| Under $25,000 | 553 (87.5%) | 79 (12.5%) |
| $25,000 to $49,999 | 679 (72.0%) | 264 (28.0%) |
| $50,000 to $74,999 | 1,001 (72.0%) | 390 (28.0%) |
| $75,000 to $99,999 | 732 (65.8%) | 381 (34.2%) |
| $100,000 and over | 7,115 (96.5%) | 261 (3.5%) |
Public vs Private Health Insurance Coverage by Age in Ridgefield borough
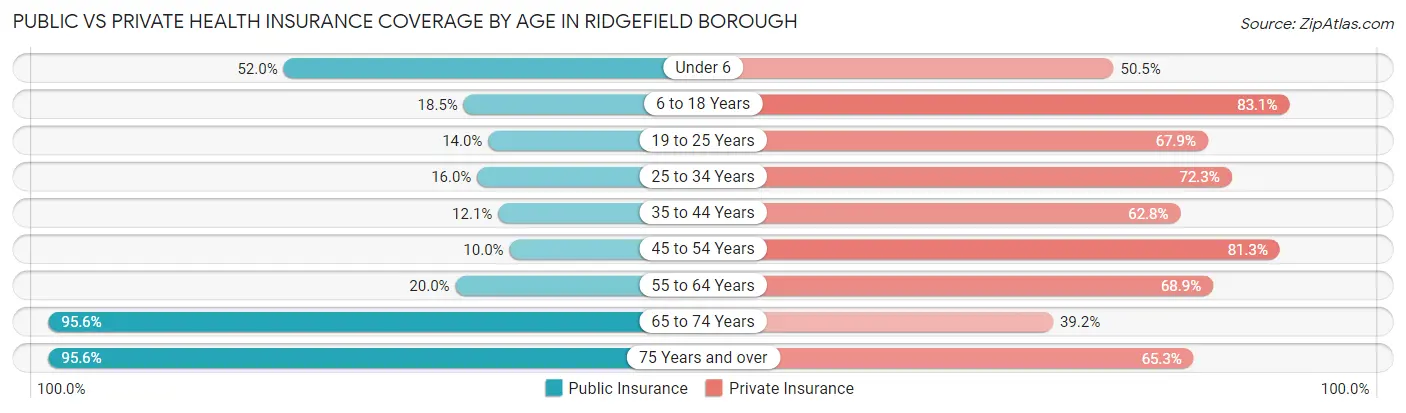
| Age Bracket | Public Insurance | Private Insurance |
| Under 6 | 173 (51.9%) | 168 (50.4%) |
| 6 to 18 Years | 366 (18.5%) | 1,643 (83.1%) |
| 19 to 25 Years | 137 (14.0%) | 667 (67.9%) |
| 25 to 34 Years | 208 (16.0%) | 941 (72.3%) |
| 35 to 44 Years | 207 (12.1%) | 1,075 (62.8%) |
| 45 to 54 Years | 147 (10.0%) | 1,194 (81.3%) |
| 55 to 64 Years | 400 (20.0%) | 1,375 (68.9%) |
| 65 to 74 Years | 1,080 (95.6%) | 443 (39.2%) |
| 75 Years and over | 540 (95.6%) | 369 (65.3%) |
| Total | 3,258 (28.4%) | 7,875 (68.7%) |
Disability Status by Sex by Age in Ridgefield borough
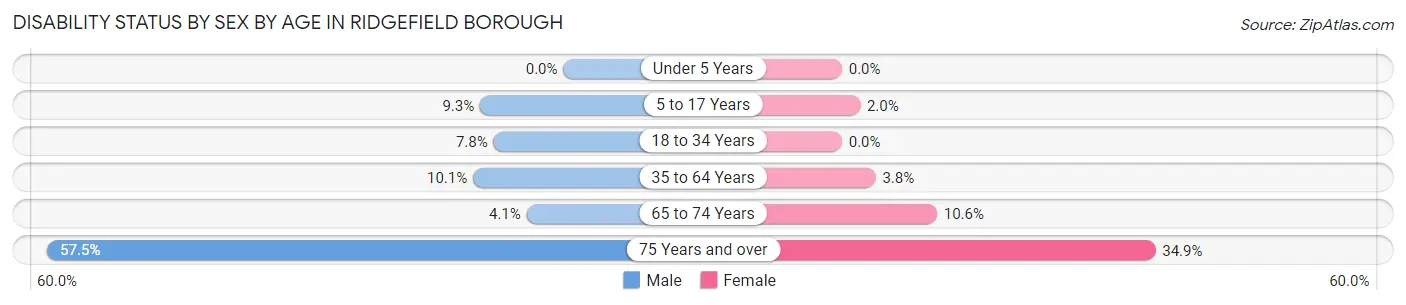
| Age Bracket | Male | Female |
| Under 5 Years | 0 (0.0%) | 0 (0.0%) |
| 5 to 17 Years | 89 (9.3%) | 16 (2.0%) |
| 18 to 34 Years | 102 (7.8%) | 0 (0.0%) |
| 35 to 64 Years | 239 (10.1%) | 105 (3.7%) |
| 65 to 74 Years | 23 (4.1%) | 60 (10.6%) |
| 75 Years and over | 142 (57.5%) | 111 (34.9%) |
Disability Class by Sex by Age in Ridgefield borough
Disability Class: Hearing Difficulty
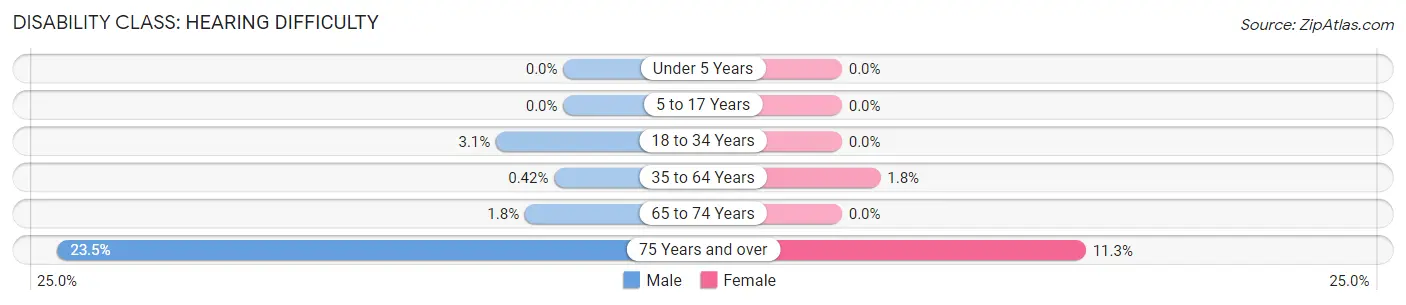
| Age Bracket | Male | Female |
| Under 5 Years | 0 (0.0%) | 0 (0.0%) |
| 5 to 17 Years | 0 (0.0%) | 0 (0.0%) |
| 18 to 34 Years | 41 (3.1%) | 0 (0.0%) |
| 35 to 64 Years | 10 (0.4%) | 50 (1.8%) |
| 65 to 74 Years | 10 (1.8%) | 0 (0.0%) |
| 75 Years and over | 58 (23.5%) | 36 (11.3%) |
Disability Class: Vision Difficulty
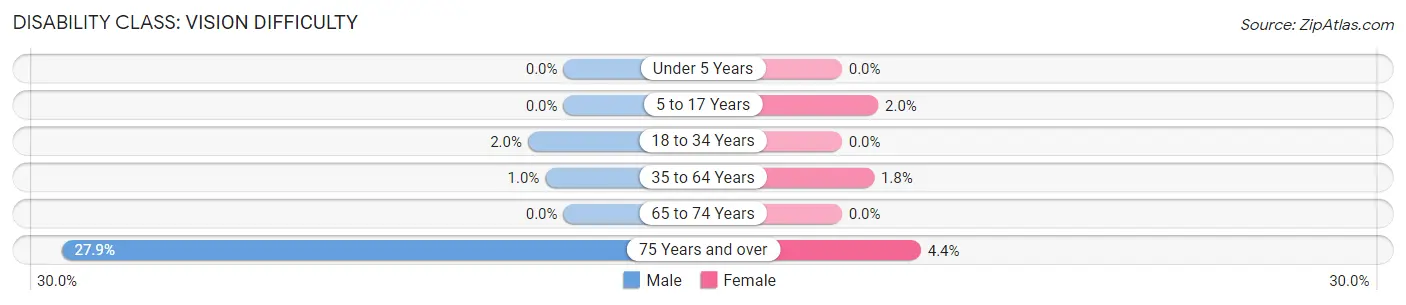
| Age Bracket | Male | Female |
| Under 5 Years | 0 (0.0%) | 0 (0.0%) |
| 5 to 17 Years | 0 (0.0%) | 16 (2.0%) |
| 18 to 34 Years | 26 (2.0%) | 0 (0.0%) |
| 35 to 64 Years | 24 (1.0%) | 50 (1.8%) |
| 65 to 74 Years | 0 (0.0%) | 0 (0.0%) |
| 75 Years and over | 69 (27.9%) | 14 (4.4%) |
Disability Class: Cognitive Difficulty
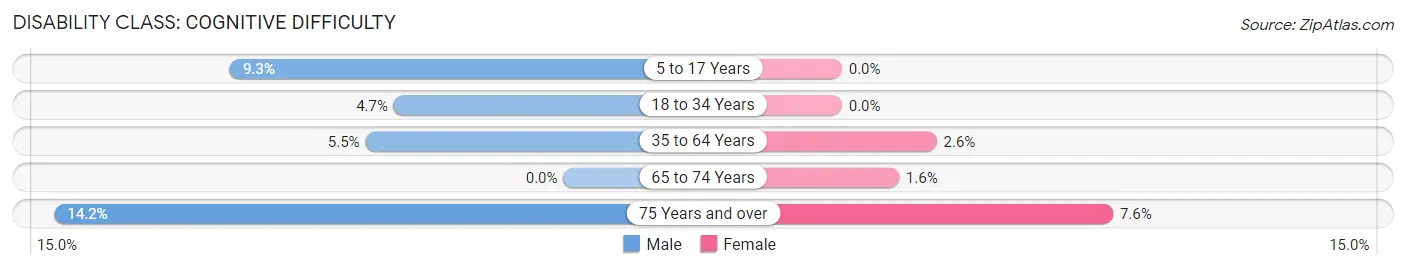
| Age Bracket | Male | Female |
| 5 to 17 Years | 89 (9.3%) | 0 (0.0%) |
| 18 to 34 Years | 62 (4.7%) | 0 (0.0%) |
| 35 to 64 Years | 131 (5.5%) | 74 (2.6%) |
| 65 to 74 Years | 0 (0.0%) | 9 (1.6%) |
| 75 Years and over | 35 (14.2%) | 24 (7.5%) |
Disability Class: Ambulatory Difficulty
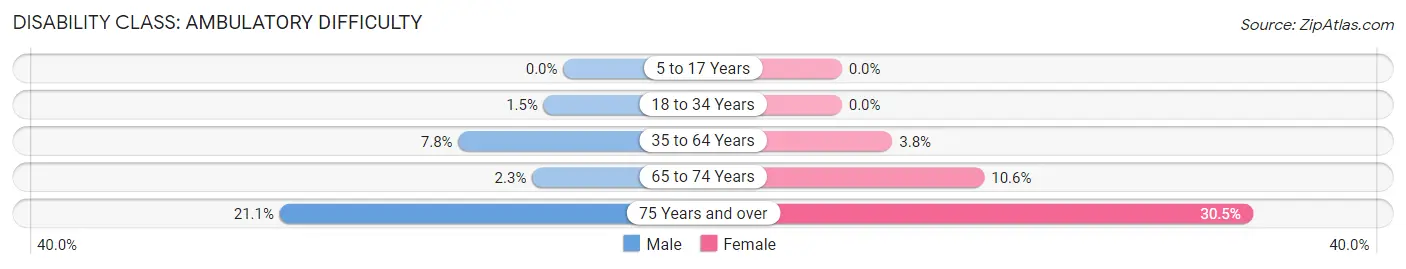
| Age Bracket | Male | Female |
| 5 to 17 Years | 0 (0.0%) | 0 (0.0%) |
| 18 to 34 Years | 19 (1.5%) | 0 (0.0%) |
| 35 to 64 Years | 185 (7.8%) | 105 (3.7%) |
| 65 to 74 Years | 13 (2.3%) | 60 (10.6%) |
| 75 Years and over | 52 (21.0%) | 97 (30.5%) |
Disability Class: Self-Care Difficulty
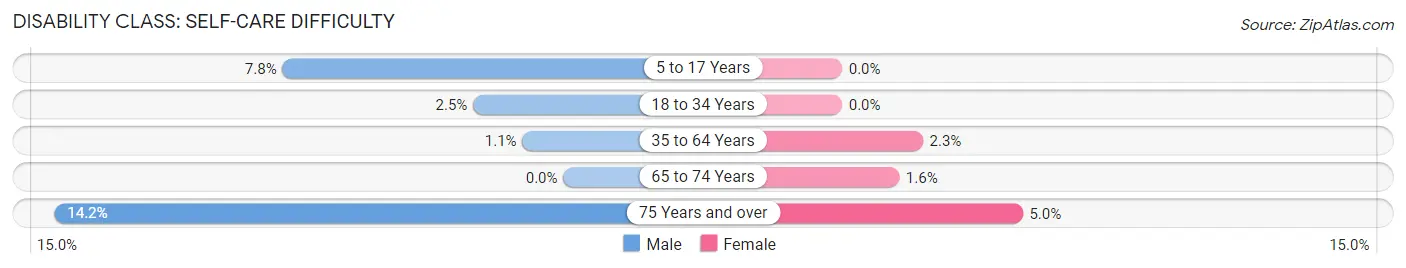
| Age Bracket | Male | Female |
| 5 to 17 Years | 75 (7.8%) | 0 (0.0%) |
| 18 to 34 Years | 33 (2.5%) | 0 (0.0%) |
| 35 to 64 Years | 27 (1.1%) | 63 (2.2%) |
| 65 to 74 Years | 0 (0.0%) | 9 (1.6%) |
| 75 Years and over | 35 (14.2%) | 16 (5.0%) |
Technology Access in Ridgefield borough
Computing Device Access in Ridgefield borough
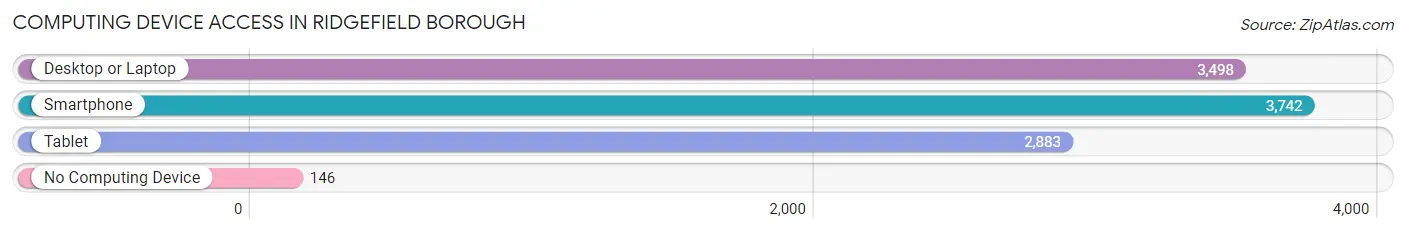
| Device Type | # Households | % Households |
| Desktop or Laptop | 3,498 | 86.8% |
| Smartphone | 3,742 | 92.9% |
| Tablet | 2,883 | 71.6% |
| No Computing Device | 146 | 3.6% |
| Total | 4,028 | 100.0% |
Internet Access in Ridgefield borough
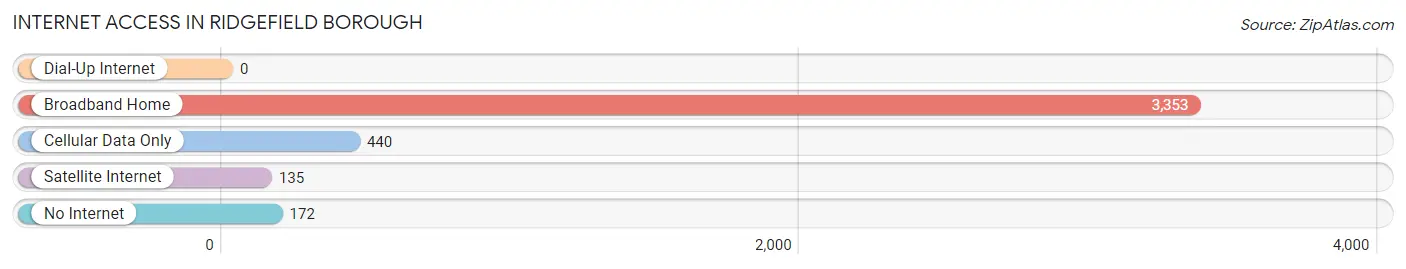
| Internet Type | # Households | % Households |
| Dial-Up Internet | 0 | 0.0% |
| Broadband Home | 3,353 | 83.2% |
| Cellular Data Only | 440 | 10.9% |
| Satellite Internet | 135 | 3.4% |
| No Internet | 172 | 4.3% |
| Total | 4,028 | 100.0% |
Ridgefield borough Summary
Ridgefield Borough is a small borough located in Bergen County, New Jersey. It is situated in the northeastern part of the state, just west of the Hudson River and north of the Hackensack River. The borough is bordered by the towns of Fairview, Palisades Park, Leonia, and Englewood Cliffs. As of the 2010 United States Census, the borough had a population of 11,032.
History
Ridgefield Borough was originally part of the Hackensack Township, which was established in 1693. The area was first settled in the early 1700s by Dutch and English settlers. The area was known as English Neighborhood, and was part of the larger settlement of Bergen. In 1871, the area was incorporated as the Borough of Ridgefield. The name was chosen to honor the Revolutionary War hero, General George Washington, who had a home in the area.
Geography
Ridgefield Borough is located at 40°51'N 74°02'W (40.851, -74.033). According to the United States Census Bureau, the borough has a total area of 1.7 square miles (4.4 km2), all of which is land.
The borough is located in the Hackensack River watershed. The borough is bordered by the towns of Fairview, Palisades Park, Leonia, and Englewood Cliffs.
Economy
Ridgefield Borough is a primarily residential community. The borough has a small commercial district along Grand Avenue, which includes a variety of small businesses, restaurants, and shops. The borough is also home to several industrial parks, which provide employment opportunities for local residents.
Demographics
As of the 2010 United States Census, there were 11,032 people, 4,072 households, and 2,845 families residing in the borough. The population density was 6,521.3 people per square mile (2,521.2/km2). There were 4,272 housing units at an average density of 2,521.2 per square mile (972.2/km2). The racial makeup of the borough was 68.2% White, 4.2% African American, 0.2% Native American, 19.2% Asian, 0.1% Pacific Islander, 4.7% from other races, and 3.0% from two or more races. Hispanic or Latino of any race were 13.7% of the population.
There were 4,072 households, out of which 33.2% had children under the age of 18 living with them, 53.2% were married couples living together, 11.2% had a female householder with no husband present, and 30.7% were non-families. 24.7% of all households were made up of individuals, and 8.3% had someone living alone who was 65 years of age or older. The average household size was 2.71 and the average family size was 3.26.
In the borough, the population was spread out, with 22.7% under the age of 18, 8.2% from 18 to 24, 30.2% from 25 to 44, 27.2% from 45 to 64, and 11.7% who were 65 years of age or older. The median age was 38.2 years. For every 100 females, there were 94.2 males. For every 100 females age 18 and over, there were 91.3 males.
The median income for a household in the borough was $76,945, and the median income for a family was $90,945. Males had a median income of $60,945 versus $45,945 for females. The per capita income for the borough was $35,945. About 4.2% of families and 5.7% of the population were below the poverty line, including 6.7% of those under age 18 and 5.2% of those age 65 or over.
Common Questions
What is Per Capita Income in Ridgefield borough?
Per Capita income in Ridgefield borough is $45,604.
What is the Median Family Income in Ridgefield borough?
Median Family Income in Ridgefield borough is $112,377.
What is the Median Household income in Ridgefield borough?
Median Household Income in Ridgefield borough is $105,609.
What is Income or Wage Gap in Ridgefield borough?
Income or Wage Gap in Ridgefield borough is 30.9%.
Women in Ridgefield borough earn 69.1 cents for every dollar earned by a man.
What is Inequality or Gini Index in Ridgefield borough?
Inequality or Gini Index in Ridgefield borough is 0.42.
What is the Total Population of Ridgefield borough?
Total Population of Ridgefield borough is 11,465.
What is the Total Male Population of Ridgefield borough?
Total Male Population of Ridgefield borough is 5,582.
What is the Total Female Population of Ridgefield borough?
Total Female Population of Ridgefield borough is 5,883.
What is the Ratio of Males per 100 Females in Ridgefield borough?
There are 94.88 Males per 100 Females in Ridgefield borough.
What is the Ratio of Females per 100 Males in Ridgefield borough?
There are 105.39 Females per 100 Males in Ridgefield borough.
What is the Median Population Age in Ridgefield borough?
Median Population Age in Ridgefield borough is 41.2 Years.
What is the Average Family Size in Ridgefield borough
Average Family Size in Ridgefield borough is 3.2 People.
What is the Average Household Size in Ridgefield borough
Average Household Size in Ridgefield borough is 2.8 People.
How Large is the Labor Force in Ridgefield borough?
There are 6,569 People in the Labor Forcein in Ridgefield borough.
What is the Percentage of People in the Labor Force in Ridgefield borough?
67.1% of People are in the Labor Force in Ridgefield borough.
What is the Unemployment Rate in Ridgefield borough?
Unemployment Rate in Ridgefield borough is 6.9%.