Cities with the Highest Percentage of Hispanic or Latino Population in Alabama
RELATED REPORTS & OPTIONS
Hispanic or Latino
Alabama
Compare Cities
Map of Cities with the Highest Percentage of Hispanic or Latino Population in Alabama
0.0%
80.0%
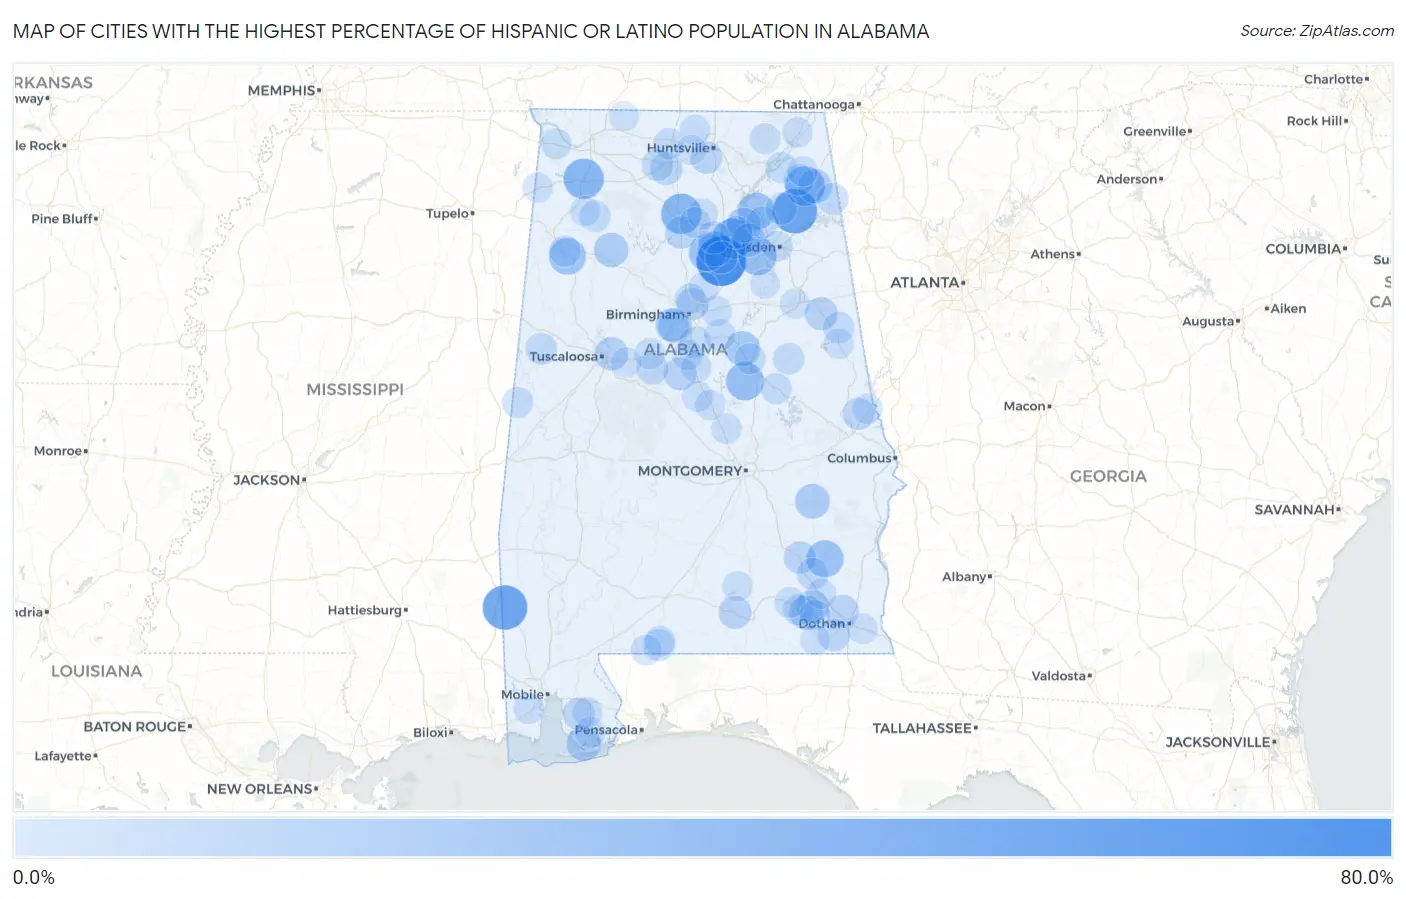
Cities with the Highest Percentage of Hispanic or Latino Population in Alabama
| City | Hispanic or Latino | vs State | vs National | |
| 1. | Allgood | 70.4% | 4.6%(+65.8)#1 | 18.7%(+51.8)#1,245 |
| 2. | Fruitdale | 53.7% | 4.6%(+49.1)#2 | 18.7%(+35.1)#1,797 |
| 3. | Collinsville | 53.4% | 4.6%(+48.8)#3 | 18.7%(+34.8)#1,812 |
| 4. | South Vinemont | 39.8% | 4.6%(+35.1)#4 | 18.7%(+21.1)#2,520 |
| 5. | Susan Moore | 39.6% | 4.6%(+35.0)#5 | 18.7%(+20.9)#2,536 |
| 6. | Russellville | 39.3% | 4.6%(+34.7)#6 | 18.7%(+20.6)#2,552 |
| 7. | Pine Ridge | 37.8% | 4.6%(+33.2)#7 | 18.7%(+19.1)#2,665 |
| 8. | Steele | 32.1% | 4.6%(+27.5)#8 | 18.7%(+13.4)#3,161 |
| 9. | Weogufka | 32.0% | 4.6%(+27.4)#9 | 18.7%(+13.3)#3,172 |
| 10. | Nectar | 30.0% | 4.6%(+25.4)#10 | 18.7%(+11.4)#3,386 |
| 11. | Clio | 28.8% | 4.6%(+24.1)#11 | 18.7%(+10.1)#3,533 |
| 12. | Albertville | 28.7% | 4.6%(+24.1)#12 | 18.7%(+10.1)#3,539 |
| 13. | Gu Win | 28.4% | 4.6%(+23.7)#13 | 18.7%(+9.71)#3,584 |
| 14. | Cleveland | 23.3% | 4.6%(+18.7)#14 | 18.7%(+4.67)#4,309 |
| 15. | Bon Air | 22.4% | 4.6%(+17.8)#15 | 18.7%(+3.76)#4,464 |
| 16. | Union Springs | 21.0% | 4.6%(+16.4)#16 | 18.7%(+2.39)#4,733 |
| 17. | Douglas | 21.0% | 4.6%(+16.4)#17 | 18.7%(+2.33)#4,750 |
| 18. | Bon Secour | 20.5% | 4.6%(+15.9)#18 | 18.7%(+1.84)#4,849 |
| 19. | Nauvoo | 20.2% | 4.6%(+15.6)#19 | 18.7%(+1.59)#4,911 |
| 20. | Fort Payne | 19.6% | 4.6%(+15.0)#20 | 18.7%(+0.970)#5,052 |
| 21. | Level Plains | 18.8% | 4.6%(+14.2)#21 | 18.7%(+0.141)#5,230 |
| 22. | Lipscomb | 18.7% | 4.6%(+14.1)#22 | 18.7%(+0.093)#5,243 |
| 23. | Brighton | 18.1% | 4.6%(+13.5)#23 | 18.7%(-0.549)#5,416 |
| 24. | Holt | 17.4% | 4.6%(+12.8)#24 | 18.7%(-1.27)#5,612 |
| 25. | Pea Ridge | 17.0% | 4.6%(+12.4)#25 | 18.7%(-1.68)#5,743 |
| 26. | Walnut Grove | 16.5% | 4.6%(+11.9)#26 | 18.7%(-2.16)#5,870 |
| 27. | Hollis Crossroads | 15.7% | 4.6%(+11.0)#27 | 18.7%(-3.00)#6,157 |
| 28. | Snead | 15.2% | 4.6%(+10.6)#28 | 18.7%(-3.41)#6,279 |
| 29. | Napier Field | 15.1% | 4.6%(+10.5)#29 | 18.7%(-3.54)#6,314 |
| 30. | Wilton | 15.0% | 4.6%(+10.4)#30 | 18.7%(-3.62)#6,346 |
| 31. | Fort Rucker | 14.8% | 4.6%(+10.2)#31 | 18.7%(-3.86)#6,443 |
| 32. | Sanford | 14.7% | 4.6%(+10.0)#32 | 18.7%(-4.00)#6,499 |
| 33. | Decatur | 14.5% | 4.6%(+9.89)#33 | 18.7%(-4.14)#6,546 |
| 34. | Blountsville | 14.1% | 4.6%(+9.48)#34 | 18.7%(-4.55)#6,689 |
| 35. | Redstone Arsenal | 13.9% | 4.6%(+9.30)#35 | 18.7%(-4.73)#6,749 |
| 36. | Brundidge | 13.9% | 4.6%(+9.24)#36 | 18.7%(-4.79)#6,775 |
| 37. | Malvern | 13.7% | 4.6%(+9.03)#37 | 18.7%(-5.00)#6,844 |
| 38. | Good Hope | 13.6% | 4.6%(+8.97)#38 | 18.7%(-5.06)#6,875 |
| 39. | Tarrant | 13.4% | 4.6%(+8.81)#39 | 18.7%(-5.22)#6,957 |
| 40. | Silverhill | 13.4% | 4.6%(+8.74)#40 | 18.7%(-5.29)#6,985 |
| 41. | Oneonta | 13.3% | 4.6%(+8.68)#41 | 18.7%(-5.35)#7,008 |
| 42. | Cusseta | 12.9% | 4.6%(+8.23)#42 | 18.7%(-5.79)#7,204 |
| 43. | Boaz | 12.4% | 4.6%(+7.78)#43 | 18.7%(-6.25)#7,395 |
| 44. | Carrollton | 11.7% | 4.6%(+7.07)#44 | 18.7%(-6.95)#7,753 |
| 45. | West Blocton | 11.6% | 4.6%(+6.97)#45 | 18.7%(-7.06)#7,808 |
| 46. | Ariton | 11.4% | 4.6%(+6.82)#46 | 18.7%(-7.21)#7,886 |
| 47. | Broomtown | 11.4% | 4.6%(+6.75)#47 | 18.7%(-7.28)#7,923 |
| 48. | Pelham | 11.2% | 4.6%(+6.59)#48 | 18.7%(-7.44)#8,009 |
| 49. | Crossville | 11.2% | 4.6%(+6.54)#49 | 18.7%(-7.49)#8,042 |
| 50. | Trinity | 11.0% | 4.6%(+6.37)#50 | 18.7%(-7.66)#8,123 |
| 51. | Millerville | 11.0% | 4.6%(+6.37)#51 | 18.7%(-7.66)#8,124 |
| 52. | Riverview | 10.7% | 4.6%(+6.04)#52 | 18.7%(-7.99)#8,303 |
| 53. | Morrison Crossroads | 10.7% | 4.6%(+6.03)#53 | 18.7%(-8.00)#8,308 |
| 54. | Haleyville | 10.6% | 4.6%(+6.03)#54 | 18.7%(-8.00)#8,310 |
| 55. | Westover | 10.3% | 4.6%(+5.69)#55 | 18.7%(-8.34)#8,519 |
| 56. | Guin | 10.2% | 4.6%(+5.54)#56 | 18.7%(-8.48)#8,602 |
| 57. | Kellyton | 10.1% | 4.6%(+5.43)#57 | 18.7%(-8.60)#8,673 |
| 58. | Geiger | 9.8% | 4.6%(+5.17)#58 | 18.7%(-8.86)#8,845 |
| 59. | Woodstock | 9.8% | 4.6%(+5.15)#59 | 18.7%(-8.87)#8,854 |
| 60. | Enterprise | 9.7% | 4.6%(+5.06)#60 | 18.7%(-8.97)#8,914 |
| 61. | Section | 9.7% | 4.6%(+5.04)#61 | 18.7%(-8.99)#8,934 |
| 62. | Athens | 9.5% | 4.6%(+4.89)#62 | 18.7%(-9.14)#9,042 |
| 63. | Rainsville | 9.4% | 4.6%(+4.83)#63 | 18.7%(-9.20)#9,092 |
| 64. | Mignon | 9.3% | 4.6%(+4.63)#64 | 18.7%(-9.40)#9,220 |
| 65. | Foley | 9.2% | 4.6%(+4.57)#65 | 18.7%(-9.46)#9,284 |
| 66. | Skyline | 9.2% | 4.6%(+4.53)#66 | 18.7%(-9.50)#9,306 |
| 67. | New Brockton | 9.0% | 4.6%(+4.35)#67 | 18.7%(-9.68)#9,454 |
| 68. | Alabaster | 8.8% | 4.6%(+4.20)#68 | 18.7%(-9.83)#9,561 |
| 69. | Fairview | 8.8% | 4.6%(+4.19)#69 | 18.7%(-9.84)#9,567 |
| 70. | East Brewton | 8.7% | 4.6%(+4.09)#70 | 18.7%(-9.94)#9,664 |
| 71. | Fultondale | 8.7% | 4.6%(+4.05)#71 | 18.7%(-9.98)#9,686 |
| 72. | Berlin | 8.6% | 4.6%(+4.02)#72 | 18.7%(-10.0)#9,707 |
| 73. | Calera | 8.6% | 4.6%(+3.93)#73 | 18.7%(-10.1)#9,770 |
| 74. | Gadsden | 8.5% | 4.6%(+3.85)#74 | 18.7%(-10.2)#9,836 |
| 75. | Thorsby | 8.3% | 4.6%(+3.72)#75 | 18.7%(-10.3)#9,950 |
| 76. | Leeds | 8.2% | 4.6%(+3.59)#76 | 18.7%(-10.4)#10,084 |
| 77. | Cherokee | 8.2% | 4.6%(+3.58)#77 | 18.7%(-10.4)#10,089 |
| 78. | Pollard | 8.2% | 4.6%(+3.56)#78 | 18.7%(-10.5)#10,107 |
| 79. | Harvest | 8.2% | 4.6%(+3.53)#79 | 18.7%(-10.5)#10,130 |
| 80. | Daleville | 8.1% | 4.6%(+3.50)#80 | 18.7%(-10.5)#10,158 |
| 81. | Tillmans Corner | 8.1% | 4.6%(+3.48)#81 | 18.7%(-10.5)#10,179 |
| 82. | Wedowee | 8.1% | 4.6%(+3.44)#82 | 18.7%(-10.6)#10,233 |
| 83. | Avon | 7.8% | 4.6%(+3.16)#83 | 18.7%(-10.9)#10,485 |
| 84. | Bear Creek | 7.7% | 4.6%(+3.12)#84 | 18.7%(-10.9)#10,529 |
| 85. | Lanett | 7.6% | 4.6%(+3.01)#85 | 18.7%(-11.0)#10,640 |
| 86. | Sylvania | 7.6% | 4.6%(+2.99)#86 | 18.7%(-11.0)#10,667 |
| 87. | Pinson | 7.6% | 4.6%(+2.95)#87 | 18.7%(-11.1)#10,703 |
| 88. | Red Bay | 7.4% | 4.6%(+2.79)#88 | 18.7%(-11.2)#10,852 |
| 89. | Stevenson | 7.4% | 4.6%(+2.77)#89 | 18.7%(-11.3)#10,876 |
| 90. | Marbury | 7.4% | 4.6%(+2.76)#90 | 18.7%(-11.3)#10,877 |
| 91. | Dozier | 7.4% | 4.6%(+2.75)#91 | 18.7%(-11.3)#10,885 |
| 92. | Clanton | 7.3% | 4.6%(+2.67)#92 | 18.7%(-11.4)#10,958 |
| 93. | Ozark | 7.2% | 4.6%(+2.61)#93 | 18.7%(-11.4)#11,014 |
| 94. | Robertsdale | 7.2% | 4.6%(+2.59)#94 | 18.7%(-11.4)#11,038 |
| 95. | Coaling | 7.0% | 4.6%(+2.41)#95 | 18.7%(-11.6)#11,204 |
| 96. | Ragland | 6.7% | 4.6%(+2.08)#96 | 18.7%(-12.0)#11,560 |
| 97. | Oxford | 6.6% | 4.6%(+1.98)#97 | 18.7%(-12.1)#11,673 |
| 98. | Lexington | 6.6% | 4.6%(+1.95)#98 | 18.7%(-12.1)#11,709 |
| 99. | Hartford | 6.5% | 4.6%(+1.92)#99 | 18.7%(-12.1)#11,733 |
| 100. | Madison | 6.5% | 4.6%(+1.92)#100 | 18.7%(-12.1)#11,736 |
Common Questions
What are the Top 10 Cities with the Highest Percentage of Hispanic or Latino Population in Alabama?
Top 10 Cities with the Highest Percentage of Hispanic or Latino Population in Alabama are:
#1
70.4%
#2
53.7%
#3
53.4%
#4
39.8%
#5
39.6%
#6
39.3%
#7
37.8%
#8
32.1%
#9
32.0%
#10
30.0%
What city has the Highest Percentage of Hispanic or Latino Population in Alabama?
Allgood has the Highest Percentage of Hispanic or Latino Population in Alabama with 70.4%.
What is the Percentage of Hispanic or Latino Population in the State of Alabama?
Percentage of Hispanic or Latino Population in Alabama is 4.6%.
What is the Percentage of Hispanic or Latino Population in the United States?
Percentage of Hispanic or Latino Population in the United States is 18.7%.