Twin Rivers, NJ Map & Demographics
Twin Rivers Map
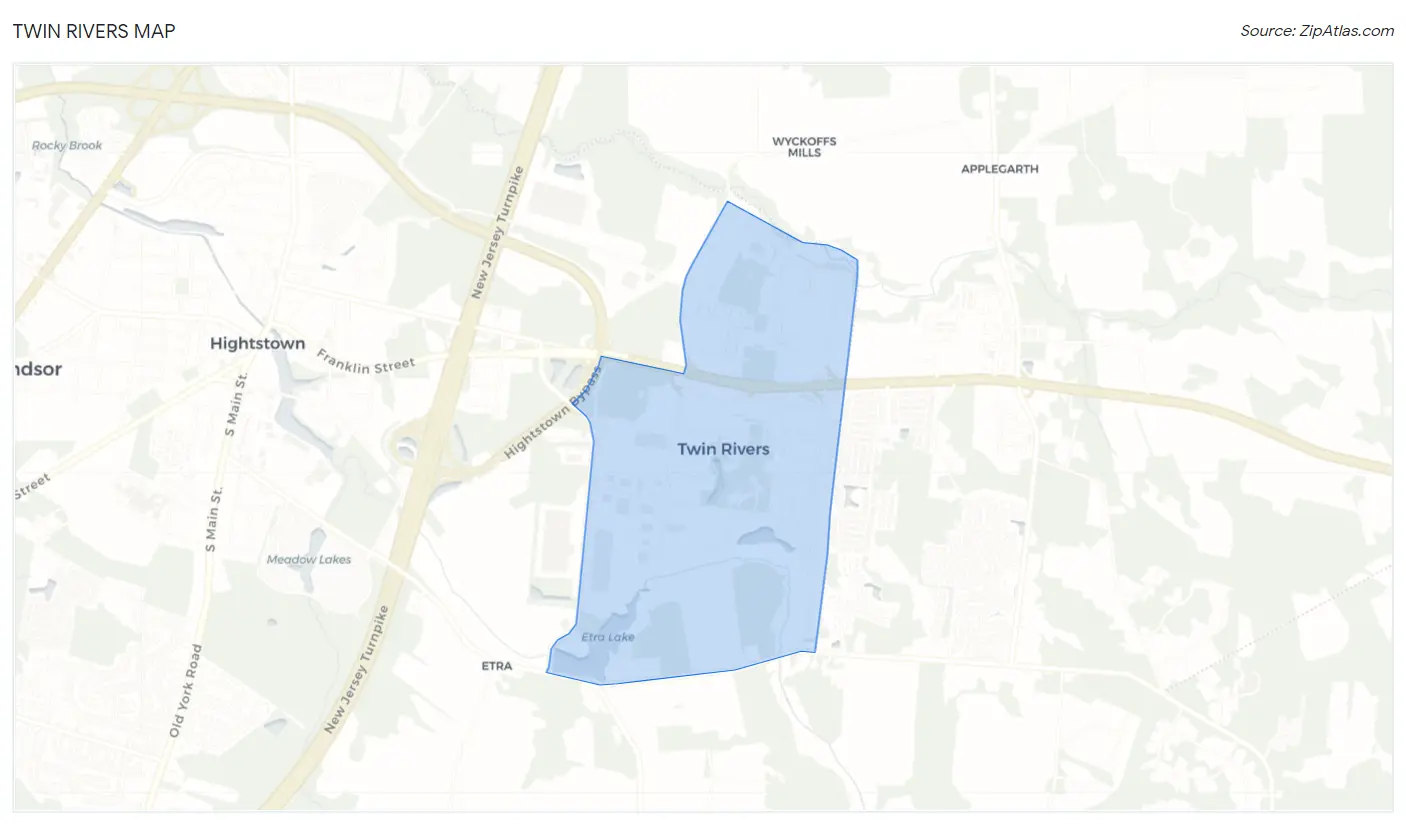
Twin Rivers Overview
$39,227
PER CAPITA INCOME
$130,000
AVG FAMILY INCOME
$110,750
AVG HOUSEHOLD INCOME
25.8%
WAGE / INCOME GAP [ % ]
74.2¢/ $1
WAGE / INCOME GAP [ $ ]
0.34
INEQUALITY / GINI INDEX
8,144
TOTAL POPULATION
4,341
MALE POPULATION
3,803
FEMALE POPULATION
114.15
MALES / 100 FEMALES
87.61
FEMALES / 100 MALES
32.4
MEDIAN AGE
3.4
AVG FAMILY SIZE
3.0
AVG HOUSEHOLD SIZE
4,976
LABOR FORCE [ PEOPLE ]
77.2%
PERCENT IN LABOR FORCE
1.6%
UNEMPLOYMENT RATE
Income in Twin Rivers
Income Overview in Twin Rivers
Per Capita Income in Twin Rivers is $39,227, while median incomes of families and households are $130,000 and $110,750 respectively.
| Characteristic | Number | Measure |
| Per Capita Income | 8,144 | $39,227 |
| Median Family Income | 2,148 | $130,000 |
| Mean Family Income | 2,148 | $130,995 |
| Median Household Income | 2,744 | $110,750 |
| Mean Household Income | 2,744 | $116,820 |
| Income Deficit | 2,148 | $0 |
| Wage / Income Gap (%) | 8,144 | 25.83% |
| Wage / Income Gap ($) | 8,144 | 74.17¢ per $1 |
| Gini / Inequality Index | 8,144 | 0.34 |
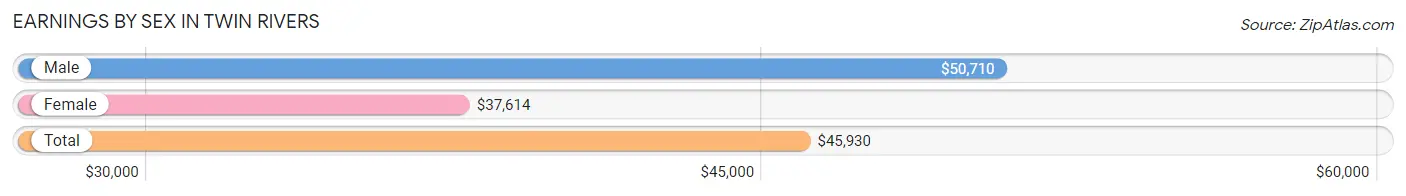
Earnings by Sex in Twin Rivers
Average Earnings in Twin Rivers are $45,930, $50,710 for men and $37,614 for women, a difference of 25.8%.
| Sex | Number | Average Earnings |
| Male | 3,021 (58.8%) | $50,710 |
| Female | 2,121 (41.2%) | $37,614 |
| Total | 5,142 (100.0%) | $45,930 |
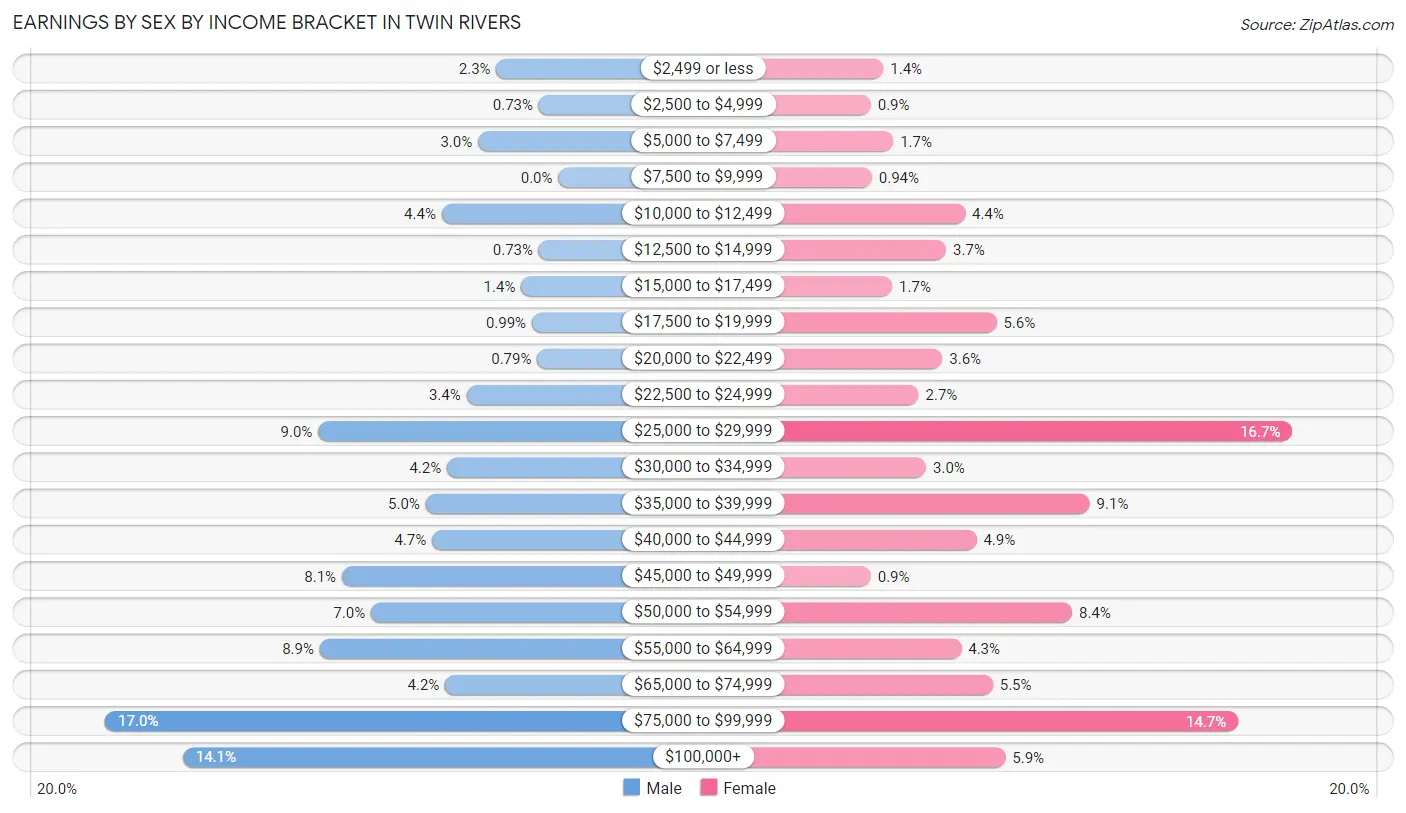
Earnings by Sex by Income Bracket in Twin Rivers
The most common earnings brackets in Twin Rivers are $75,000 to $99,999 for men (513 | 17.0%) and $25,000 to $29,999 for women (354 | 16.7%).
| Income | Male | Female |
| $2,499 or less | 70 (2.3%) | 29 (1.4%) |
| $2,500 to $4,999 | 22 (0.7%) | 19 (0.9%) |
| $5,000 to $7,499 | 91 (3.0%) | 37 (1.7%) |
| $7,500 to $9,999 | 0 (0.0%) | 20 (0.9%) |
| $10,000 to $12,499 | 132 (4.4%) | 94 (4.4%) |
| $12,500 to $14,999 | 22 (0.7%) | 79 (3.7%) |
| $15,000 to $17,499 | 42 (1.4%) | 36 (1.7%) |
| $17,500 to $19,999 | 30 (1.0%) | 119 (5.6%) |
| $20,000 to $22,499 | 24 (0.8%) | 76 (3.6%) |
| $22,500 to $24,999 | 104 (3.4%) | 57 (2.7%) |
| $25,000 to $29,999 | 272 (9.0%) | 354 (16.7%) |
| $30,000 to $34,999 | 126 (4.2%) | 63 (3.0%) |
| $35,000 to $39,999 | 150 (5.0%) | 193 (9.1%) |
| $40,000 to $44,999 | 143 (4.7%) | 103 (4.9%) |
| $45,000 to $49,999 | 245 (8.1%) | 19 (0.9%) |
| $50,000 to $54,999 | 212 (7.0%) | 179 (8.4%) |
| $55,000 to $64,999 | 270 (8.9%) | 91 (4.3%) |
| $65,000 to $74,999 | 128 (4.2%) | 116 (5.5%) |
| $75,000 to $99,999 | 513 (17.0%) | 311 (14.7%) |
| $100,000+ | 425 (14.1%) | 126 (5.9%) |
| Total | 3,021 (100.0%) | 2,121 (100.0%) |
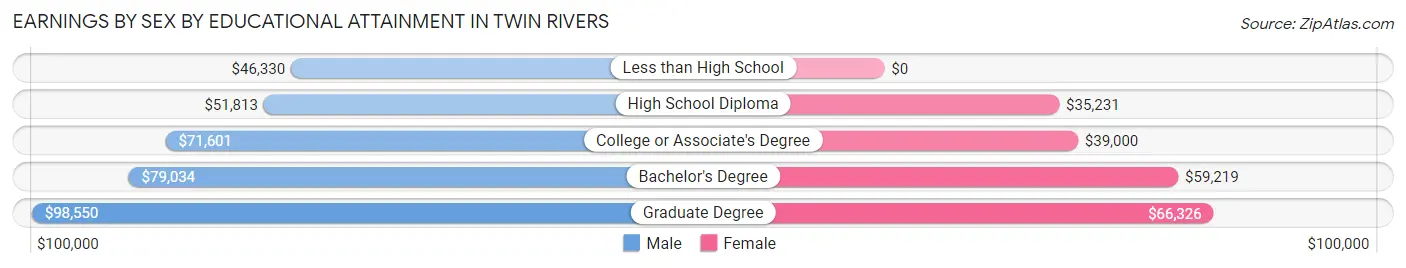
Earnings by Sex by Educational Attainment in Twin Rivers
Average earnings in Twin Rivers are $55,938 for men and $43,591 for women, a difference of 22.1%. Men with an educational attainment of graduate degree enjoy the highest average annual earnings of $98,550, while those with less than high school education earn the least with $46,330. Women with an educational attainment of graduate degree earn the most with the average annual earnings of $66,326, while those with high school diploma education have the smallest earnings of $35,231.
| Educational Attainment | Male Income | Female Income |
| Less than High School | $46,330 | $0 |
| High School Diploma | $51,813 | $35,231 |
| College or Associate's Degree | $71,601 | $39,000 |
| Bachelor's Degree | $79,034 | $59,219 |
| Graduate Degree | $98,550 | $66,326 |
| Total | $55,938 | $43,591 |
Family Income in Twin Rivers
Family Income Brackets in Twin Rivers
According to the Twin Rivers family income data, there are 692 families falling into the $100,000 to $149,999 income range, which is the most common income bracket and makes up 32.2% of all families.
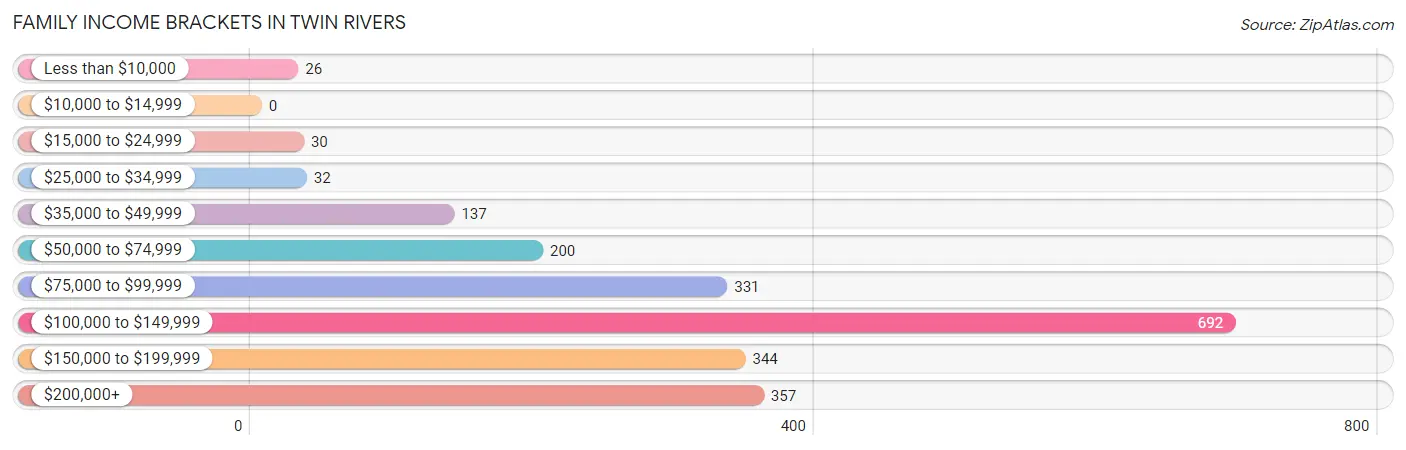
| Income Bracket | # Families | % Families |
| Less than $10,000 | 26 | 1.2% |
| $10,000 to $14,999 | 0 | 0.0% |
| $15,000 to $24,999 | 30 | 1.4% |
| $25,000 to $34,999 | 32 | 1.5% |
| $35,000 to $49,999 | 137 | 6.4% |
| $50,000 to $74,999 | 200 | 9.3% |
| $75,000 to $99,999 | 331 | 15.4% |
| $100,000 to $149,999 | 692 | 32.2% |
| $150,000 to $199,999 | 344 | 16.0% |
| $200,000+ | 357 | 16.6% |
Family Income by Famaliy Size in Twin Rivers
3-person families (516 | 24.0%) account for the highest median family income in Twin Rivers with $152,822 per family, while 2-person families (724 | 33.7%) have the highest median income of $56,900 per family member.
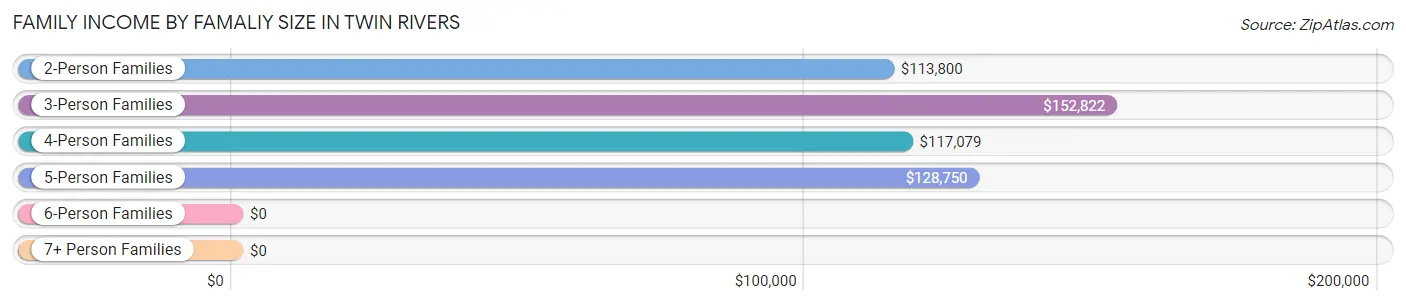
| Income Bracket | # Families | Median Income |
| 2-Person Families | 724 (33.7%) | $113,800 |
| 3-Person Families | 516 (24.0%) | $152,822 |
| 4-Person Families | 391 (18.2%) | $117,079 |
| 5-Person Families | 478 (22.3%) | $128,750 |
| 6-Person Families | 30 (1.4%) | $0 |
| 7+ Person Families | 9 (0.4%) | $0 |
| Total | 2,148 (100.0%) | $130,000 |
Family Income by Number of Earners in Twin Rivers
The median family income in Twin Rivers is $130,000, with families comprising 3+ earners (599) having the highest median family income of $153,297, while families with 1 earner (281) have the lowest median family income of $57,034, accounting for 27.9% and 13.1% of families, respectively.
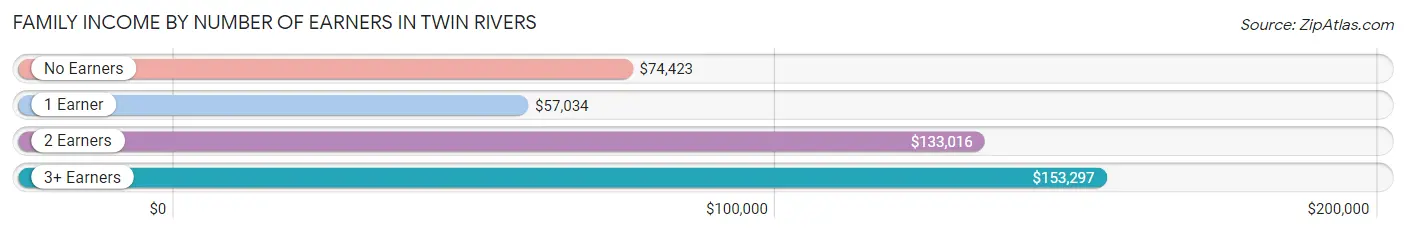
| Number of Earners | # Families | Median Income |
| No Earners | 256 (11.9%) | $74,423 |
| 1 Earner | 281 (13.1%) | $57,034 |
| 2 Earners | 1,012 (47.1%) | $133,016 |
| 3+ Earners | 599 (27.9%) | $153,297 |
| Total | 2,148 (100.0%) | $130,000 |
Household Income in Twin Rivers
Household Income Brackets in Twin Rivers
With 678 households falling in the category, the $100,000 to $149,999 income range is the most frequent in Twin Rivers, accounting for 24.7% of all households. In contrast, only 47 households (1.7%) fall into the less than $10,000 income bracket, making it the least populous group.
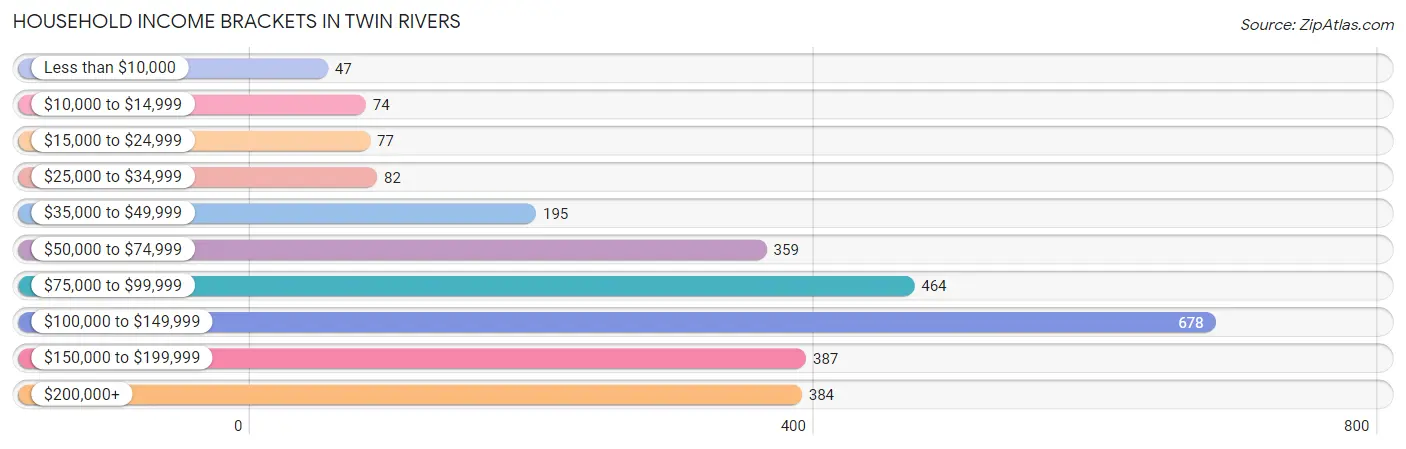
| Income Bracket | # Households | % Households |
| Less than $10,000 | 47 | 1.7% |
| $10,000 to $14,999 | 74 | 2.7% |
| $15,000 to $24,999 | 77 | 2.8% |
| $25,000 to $34,999 | 82 | 3.0% |
| $35,000 to $49,999 | 195 | 7.1% |
| $50,000 to $74,999 | 359 | 13.1% |
| $75,000 to $99,999 | 464 | 16.9% |
| $100,000 to $149,999 | 678 | 24.7% |
| $150,000 to $199,999 | 387 | 14.1% |
| $200,000+ | 384 | 14.0% |
Household Income by Householder Age in Twin Rivers
The median household income in Twin Rivers is $110,750, with the highest median household income of $131,988 found in the 45 to 64 years age bracket for the primary householder. A total of 883 households (32.2%) fall into this category. Meanwhile, the 15 to 24 years age bracket for the primary householder has the lowest median household income of $60,213, with 185 households (6.7%) in this group.
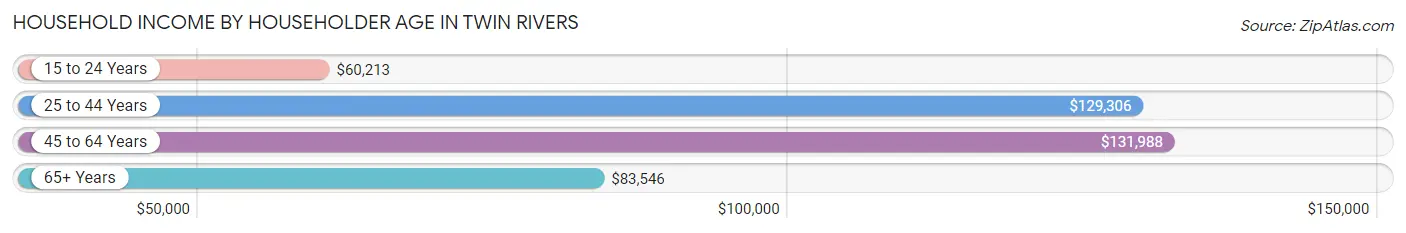
| Income Bracket | # Households | Median Income |
| 15 to 24 Years | 185 (6.7%) | $60,213 |
| 25 to 44 Years | 1,078 (39.3%) | $129,306 |
| 45 to 64 Years | 883 (32.2%) | $131,988 |
| 65+ Years | 598 (21.8%) | $83,546 |
| Total | 2,744 (100.0%) | $110,750 |
Poverty in Twin Rivers
Income Below Poverty by Sex and Age in Twin Rivers
With 5.2% poverty level for males and 2.6% for females among the residents of Twin Rivers, under 5 year old males and 25 to 34 year old females are the most vulnerable to poverty, with 105 males (29.2%) and 48 females (7.3%) in their respective age groups living below the poverty level.
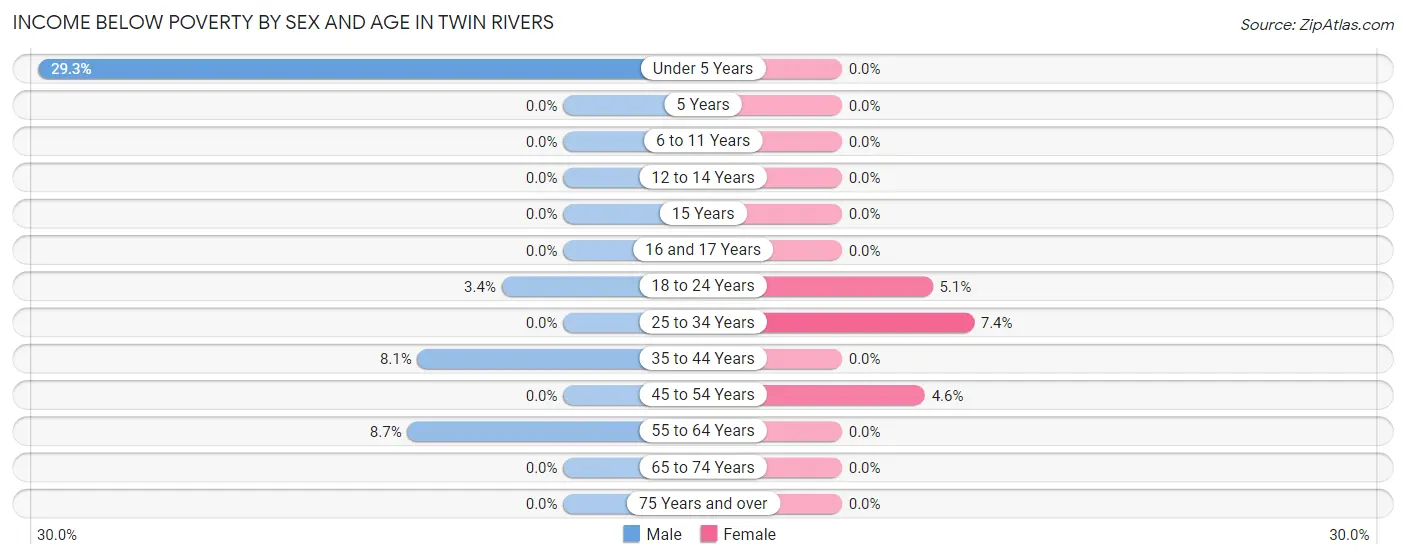
| Age Bracket | Male | Female |
| Under 5 Years | 105 (29.2%) | 0 (0.0%) |
| 5 Years | 0 (0.0%) | 0 (0.0%) |
| 6 to 11 Years | 0 (0.0%) | 0 (0.0%) |
| 12 to 14 Years | 0 (0.0%) | 0 (0.0%) |
| 15 Years | 0 (0.0%) | 0 (0.0%) |
| 16 and 17 Years | 0 (0.0%) | 0 (0.0%) |
| 18 to 24 Years | 22 (3.4%) | 25 (5.1%) |
| 25 to 34 Years | 0 (0.0%) | 48 (7.3%) |
| 35 to 44 Years | 52 (8.1%) | 0 (0.0%) |
| 45 to 54 Years | 0 (0.0%) | 26 (4.6%) |
| 55 to 64 Years | 46 (8.7%) | 0 (0.0%) |
| 65 to 74 Years | 0 (0.0%) | 0 (0.0%) |
| 75 Years and over | 0 (0.0%) | 0 (0.0%) |
| Total | 225 (5.2%) | 99 (2.6%) |
Income Above Poverty by Sex and Age in Twin Rivers
According to the poverty statistics in Twin Rivers, males aged 5 years and females aged under 5 years are the age groups that are most secure financially, with 100.0% of males and 100.0% of females in these age groups living above the poverty line.
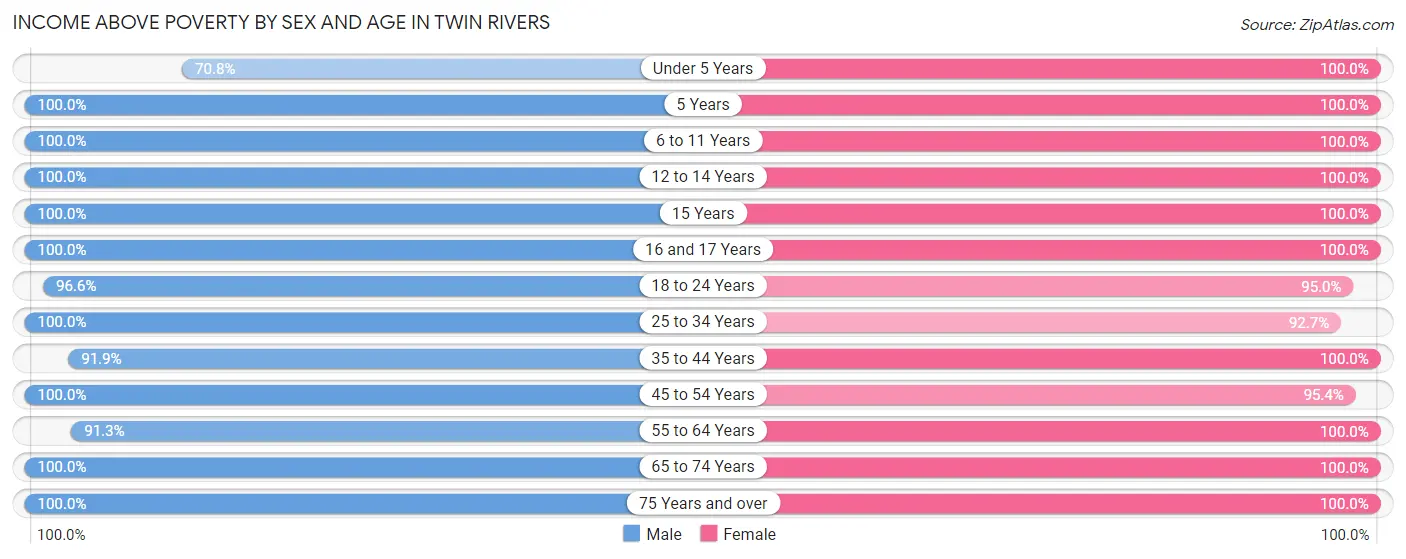
| Age Bracket | Male | Female |
| Under 5 Years | 254 (70.8%) | 440 (100.0%) |
| 5 Years | 60 (100.0%) | 48 (100.0%) |
| 6 to 11 Years | 171 (100.0%) | 177 (100.0%) |
| 12 to 14 Years | 147 (100.0%) | 133 (100.0%) |
| 15 Years | 54 (100.0%) | 109 (100.0%) |
| 16 and 17 Years | 104 (100.0%) | 48 (100.0%) |
| 18 to 24 Years | 620 (96.6%) | 470 (95.0%) |
| 25 to 34 Years | 654 (100.0%) | 605 (92.6%) |
| 35 to 44 Years | 588 (91.9%) | 285 (100.0%) |
| 45 to 54 Years | 533 (100.0%) | 537 (95.4%) |
| 55 to 64 Years | 484 (91.3%) | 398 (100.0%) |
| 65 to 74 Years | 250 (100.0%) | 256 (100.0%) |
| 75 Years and over | 197 (100.0%) | 198 (100.0%) |
| Total | 4,116 (94.8%) | 3,704 (97.4%) |
Income Below Poverty Among Married-Couple Families in Twin Rivers
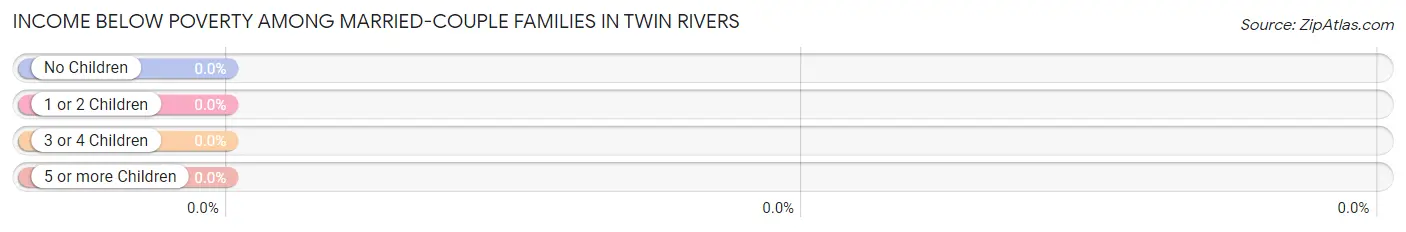
| Children | Above Poverty | Below Poverty |
| No Children | 899 (100.0%) | 0 (0.0%) |
| 1 or 2 Children | 659 (100.0%) | 0 (0.0%) |
| 3 or 4 Children | 168 (100.0%) | 0 (0.0%) |
| 5 or more Children | 0 (0.0%) | 0 (0.0%) |
| Total | 1,726 (100.0%) | 0 (0.0%) |
Income Below Poverty Among Single-Parent Households in Twin Rivers
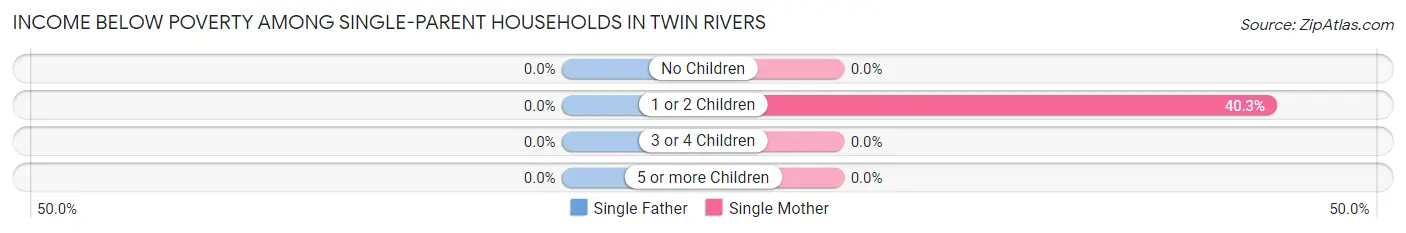
| Children | Single Father | Single Mother |
| No Children | 0 (0.0%) | 0 (0.0%) |
| 1 or 2 Children | 0 (0.0%) | 48 (40.3%) |
| 3 or 4 Children | 0 (0.0%) | 0 (0.0%) |
| 5 or more Children | 0 (0.0%) | 0 (0.0%) |
| Total | 0 (0.0%) | 48 (17.8%) |
Income Below Poverty Among Married-Couple vs Single-Parent Households in Twin Rivers
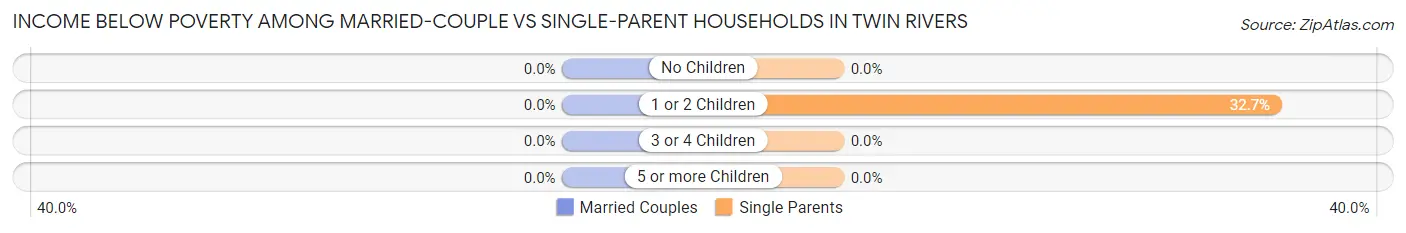
| Children | Married-Couple Families | Single-Parent Households |
| No Children | 0 (0.0%) | 0 (0.0%) |
| 1 or 2 Children | 0 (0.0%) | 48 (32.7%) |
| 3 or 4 Children | 0 (0.0%) | 0 (0.0%) |
| 5 or more Children | 0 (0.0%) | 0 (0.0%) |
| Total | 0 (0.0%) | 48 (11.4%) |
Race in Twin Rivers
The most populous races in Twin Rivers are White / Caucasian (5,377 | 66.0%), Hispanic or Latino (3,340 | 41.0%), and Two or more Races (924 | 11.4%).
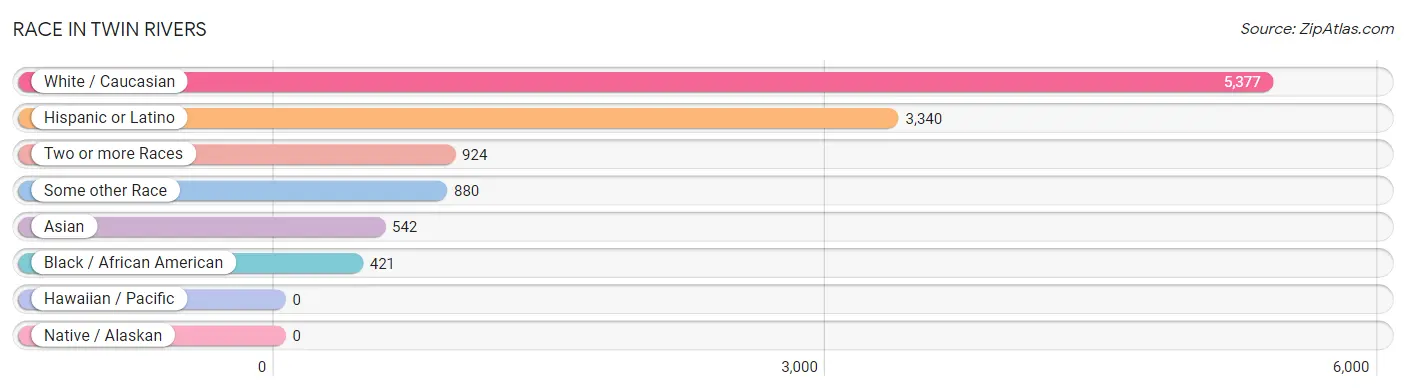
| Race | # Population | % Population |
| Asian | 542 | 6.7% |
| Black / African American | 421 | 5.2% |
| Hawaiian / Pacific | 0 | 0.0% |
| Hispanic or Latino | 3,340 | 41.0% |
| Native / Alaskan | 0 | 0.0% |
| White / Caucasian | 5,377 | 66.0% |
| Two or more Races | 924 | 11.4% |
| Some other Race | 880 | 10.8% |
| Total | 8,144 | 100.0% |
Ancestry in Twin Rivers
The most populous ancestries reported in Twin Rivers are South American (1,242 | 15.2%), Central American (901 | 11.1%), Italian (875 | 10.7%), Guatemalan (845 | 10.4%), and Ecuadorian (695 | 8.5%), together accounting for 56.0% of all Twin Rivers residents.
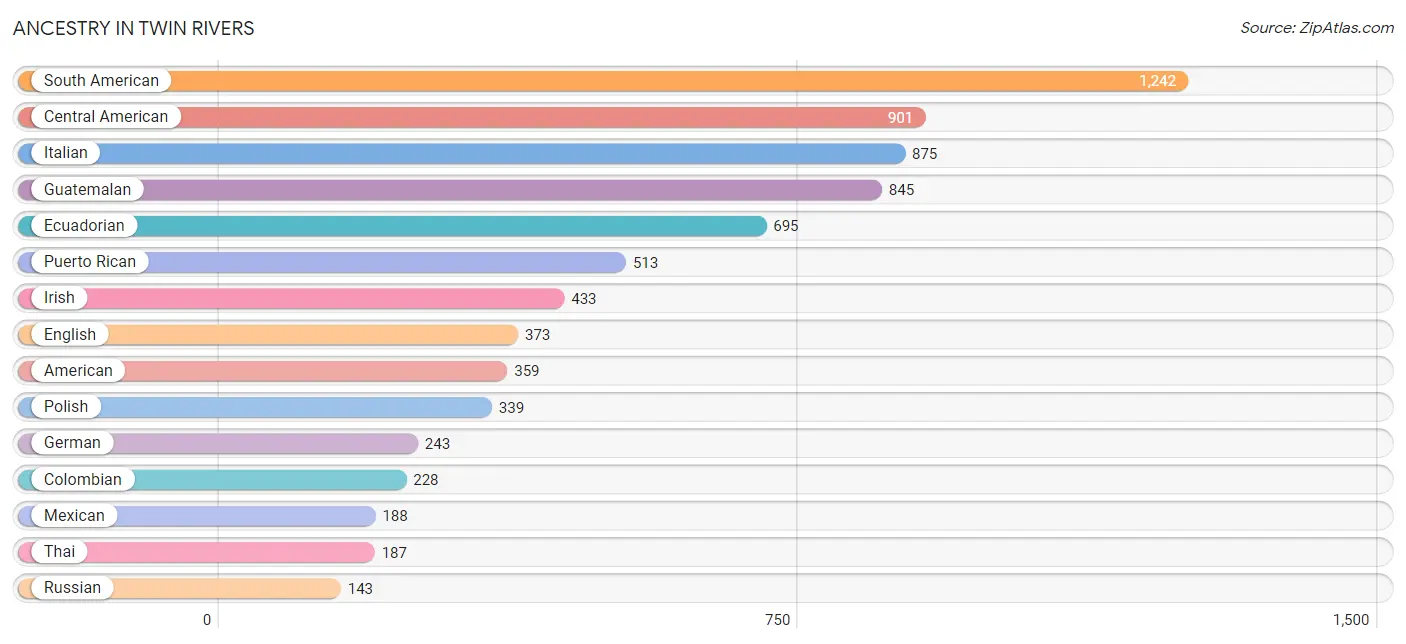
| Ancestry | # Population | % Population |
| American | 359 | 4.4% |
| Arab | 60 | 0.7% |
| Australian | 35 | 0.4% |
| Brazilian | 41 | 0.5% |
| British West Indian | 20 | 0.3% |
| Central American | 901 | 11.1% |
| Colombian | 228 | 2.8% |
| Dominican | 138 | 1.7% |
| Dutch | 17 | 0.2% |
| Ecuadorian | 695 | 8.5% |
| Egyptian | 17 | 0.2% |
| English | 373 | 4.6% |
| European | 42 | 0.5% |
| French Canadian | 34 | 0.4% |
| German | 243 | 3.0% |
| Greek | 14 | 0.2% |
| Guatemalan | 845 | 10.4% |
| Indian (Asian) | 75 | 0.9% |
| Irish | 433 | 5.3% |
| Israeli | 30 | 0.4% |
| Italian | 875 | 10.7% |
| Korean | 11 | 0.1% |
| Lithuanian | 13 | 0.2% |
| Mexican | 188 | 2.3% |
| Moroccan | 26 | 0.3% |
| Norwegian | 28 | 0.3% |
| Palestinian | 17 | 0.2% |
| Peruvian | 88 | 1.1% |
| Polish | 339 | 4.2% |
| Portuguese | 18 | 0.2% |
| Puerto Rican | 513 | 6.3% |
| Russian | 143 | 1.8% |
| Salvadoran | 56 | 0.7% |
| Scottish | 136 | 1.7% |
| Slavic | 42 | 0.5% |
| South American | 1,242 | 15.2% |
| Spanish | 74 | 0.9% |
| Sri Lankan | 121 | 1.5% |
| Swedish | 23 | 0.3% |
| Thai | 187 | 2.3% |
| Ukrainian | 31 | 0.4% |
| West Indian | 126 | 1.5% | View All 42 Rows |
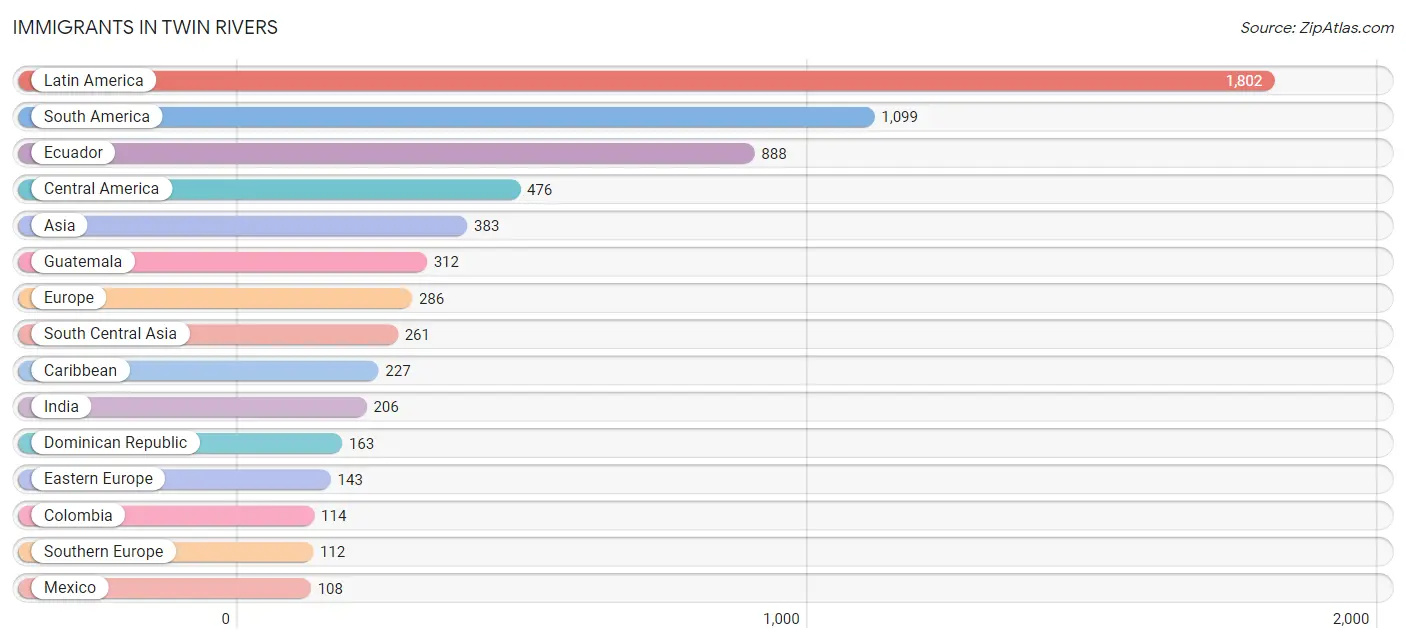
Immigrants in Twin Rivers
The most numerous immigrant groups reported in Twin Rivers came from Latin America (1,802 | 22.1%), South America (1,099 | 13.5%), Ecuador (888 | 10.9%), Central America (476 | 5.8%), and Asia (383 | 4.7%), together accounting for 57.1% of all Twin Rivers residents.
| Immigration Origin | # Population | % Population |
| Africa | 42 | 0.5% |
| Asia | 383 | 4.7% |
| Canada | 50 | 0.6% |
| Caribbean | 227 | 2.8% |
| Central America | 476 | 5.8% |
| Colombia | 114 | 1.4% |
| Dominican Republic | 163 | 2.0% |
| Eastern Europe | 143 | 1.8% |
| Ecuador | 888 | 10.9% |
| El Salvador | 56 | 0.7% |
| England | 14 | 0.2% |
| Europe | 286 | 3.5% |
| Germany | 17 | 0.2% |
| Grenada | 23 | 0.3% |
| Guatemala | 312 | 3.8% |
| India | 206 | 2.5% |
| Israel | 14 | 0.2% |
| Italy | 94 | 1.1% |
| Latin America | 1,802 | 22.1% |
| Mexico | 108 | 1.3% |
| Morocco | 26 | 0.3% |
| Northern Africa | 42 | 0.5% |
| Northern Europe | 14 | 0.2% |
| Pakistan | 55 | 0.7% |
| Peru | 97 | 1.2% |
| Poland | 40 | 0.5% |
| Portugal | 18 | 0.2% |
| Russia | 51 | 0.6% |
| South America | 1,099 | 13.5% |
| South Central Asia | 261 | 3.2% |
| South Eastern Asia | 108 | 1.3% |
| Southern Europe | 112 | 1.4% |
| St. Vincent and the Grenadines | 20 | 0.3% |
| Ukraine | 52 | 0.6% |
| Vietnam | 108 | 1.3% |
| Western Asia | 14 | 0.2% |
| Western Europe | 17 | 0.2% | View All 37 Rows |
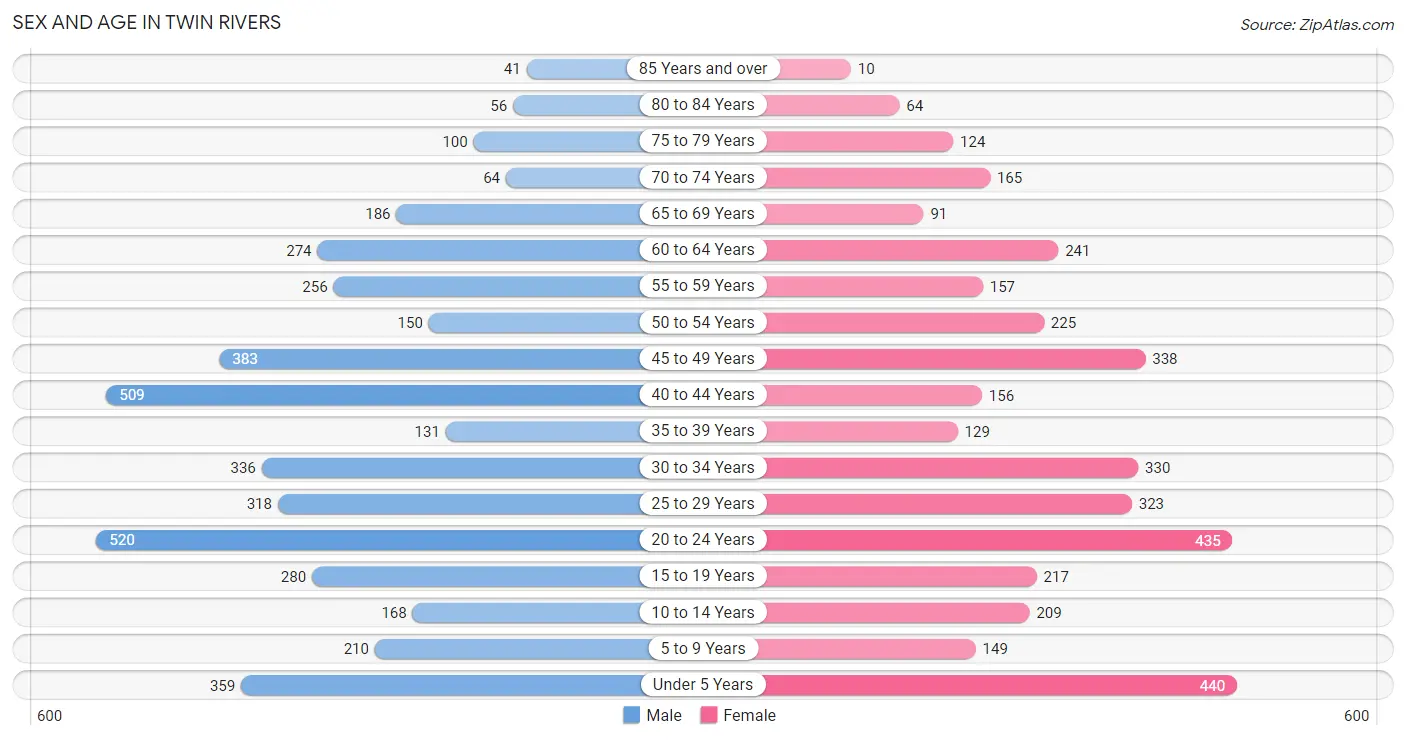
Sex and Age in Twin Rivers
Sex and Age in Twin Rivers
The most populous age groups in Twin Rivers are 20 to 24 Years (520 | 12.0%) for men and Under 5 Years (440 | 11.6%) for women.
| Age Bracket | Male | Female |
| Under 5 Years | 359 (8.3%) | 440 (11.6%) |
| 5 to 9 Years | 210 (4.8%) | 149 (3.9%) |
| 10 to 14 Years | 168 (3.9%) | 209 (5.5%) |
| 15 to 19 Years | 280 (6.5%) | 217 (5.7%) |
| 20 to 24 Years | 520 (12.0%) | 435 (11.4%) |
| 25 to 29 Years | 318 (7.3%) | 323 (8.5%) |
| 30 to 34 Years | 336 (7.7%) | 330 (8.7%) |
| 35 to 39 Years | 131 (3.0%) | 129 (3.4%) |
| 40 to 44 Years | 509 (11.7%) | 156 (4.1%) |
| 45 to 49 Years | 383 (8.8%) | 338 (8.9%) |
| 50 to 54 Years | 150 (3.5%) | 225 (5.9%) |
| 55 to 59 Years | 256 (5.9%) | 157 (4.1%) |
| 60 to 64 Years | 274 (6.3%) | 241 (6.3%) |
| 65 to 69 Years | 186 (4.3%) | 91 (2.4%) |
| 70 to 74 Years | 64 (1.5%) | 165 (4.3%) |
| 75 to 79 Years | 100 (2.3%) | 124 (3.3%) |
| 80 to 84 Years | 56 (1.3%) | 64 (1.7%) |
| 85 Years and over | 41 (0.9%) | 10 (0.3%) |
| Total | 4,341 (100.0%) | 3,803 (100.0%) |
Families and Households in Twin Rivers
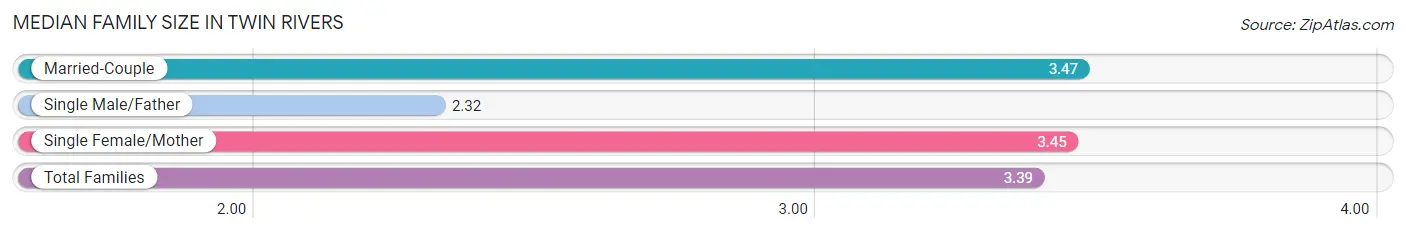
Median Family Size in Twin Rivers
The median family size in Twin Rivers is 3.39 persons per family, with married-couple families (1,726 | 80.3%) accounting for the largest median family size of 3.47 persons per family. On the other hand, single male/father families (152 | 7.1%) represent the smallest median family size with 2.32 persons per family.
| Family Type | # Families | Family Size |
| Married-Couple | 1,726 (80.3%) | 3.47 |
| Single Male/Father | 152 (7.1%) | 2.32 |
| Single Female/Mother | 270 (12.6%) | 3.45 |
| Total Families | 2,148 (100.0%) | 3.39 |
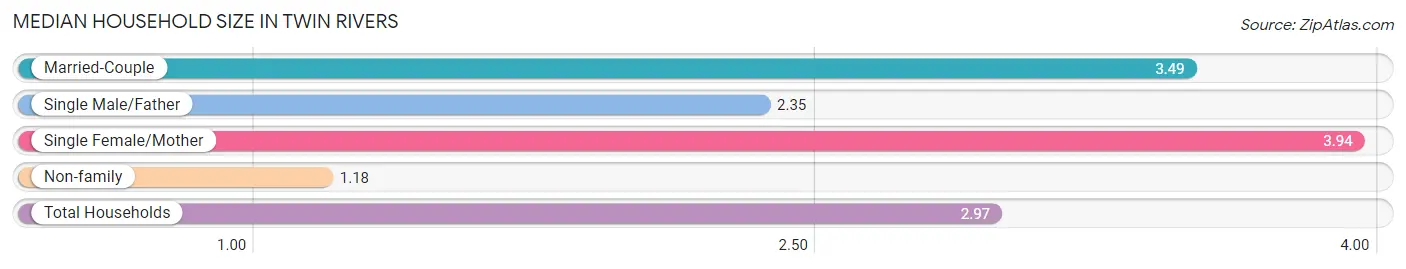
Median Household Size in Twin Rivers
The median household size in Twin Rivers is 2.97 persons per household, with single female/mother households (270 | 9.8%) accounting for the largest median household size of 3.94 persons per household. non-family households (596 | 21.7%) represent the smallest median household size with 1.18 persons per household.
| Household Type | # Households | Household Size |
| Married-Couple | 1,726 (62.9%) | 3.49 |
| Single Male/Father | 152 (5.5%) | 2.35 |
| Single Female/Mother | 270 (9.8%) | 3.94 |
| Non-family | 596 (21.7%) | 1.18 |
| Total Households | 2,744 (100.0%) | 2.97 |
Household Size by Marriage Status in Twin Rivers
Out of a total of 2,744 households in Twin Rivers, 2,148 (78.3%) are family households, while 596 (21.7%) are nonfamily households. The most numerous type of family households are 2-person households, comprising 660, and the most common type of nonfamily households are 1-person households, comprising 513.
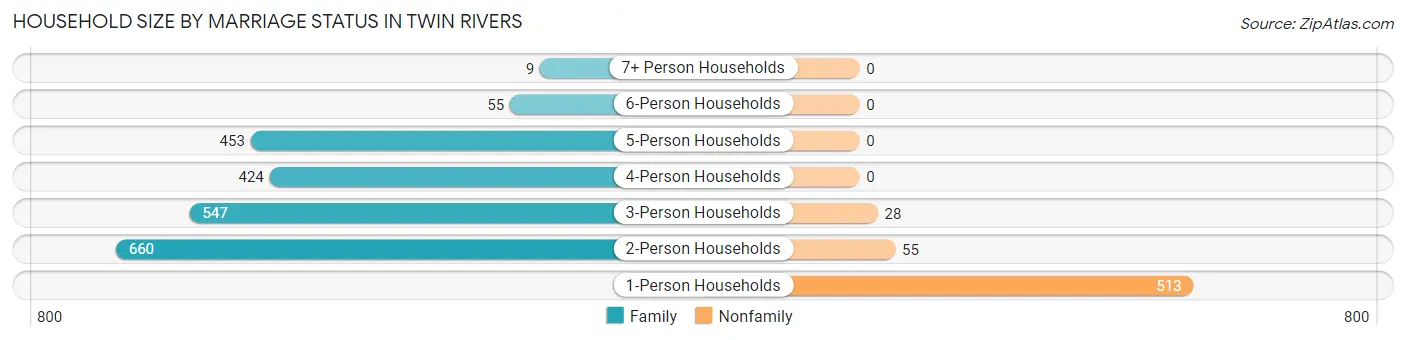
| Household Size | Family Households | Nonfamily Households |
| 1-Person Households | - | 513 (18.7%) |
| 2-Person Households | 660 (24.0%) | 55 (2.0%) |
| 3-Person Households | 547 (19.9%) | 28 (1.0%) |
| 4-Person Households | 424 (15.4%) | 0 (0.0%) |
| 5-Person Households | 453 (16.5%) | 0 (0.0%) |
| 6-Person Households | 55 (2.0%) | 0 (0.0%) |
| 7+ Person Households | 9 (0.3%) | 0 (0.0%) |
| Total | 2,148 (78.3%) | 596 (21.7%) |
Female Fertility in Twin Rivers
Fertility by Age in Twin Rivers
Average fertility rate in Twin Rivers is 34.0 births per 1,000 women. Women in the age bracket of 20 to 34 years have the highest fertility rate with 41.0 births per 1,000 women. Women in the age bracket of 20 to 34 years acount for 67.2% of all women with births.
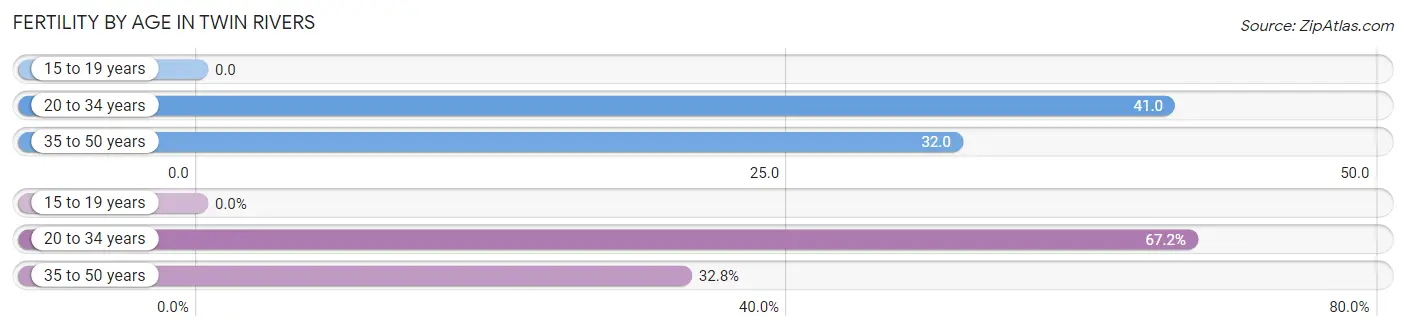
| Age Bracket | Women with Births | Births / 1,000 Women |
| 15 to 19 years | 0 (0.0%) | 0.0 |
| 20 to 34 years | 45 (67.2%) | 41.0 |
| 35 to 50 years | 22 (32.8%) | 32.0 |
| Total | 67 (100.0%) | 34.0 |
Fertility by Age by Marriage Status in Twin Rivers
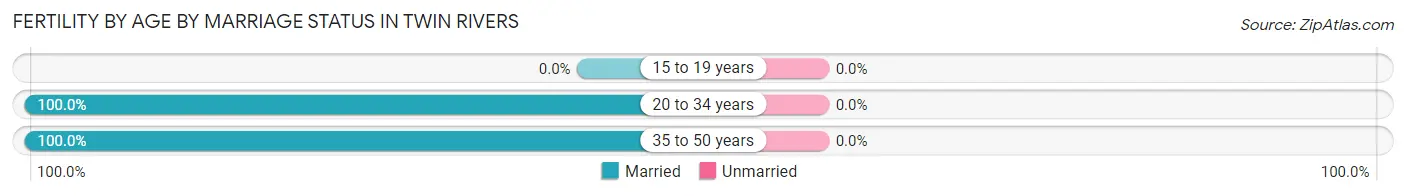
| Age Bracket | Married | Unmarried |
| 15 to 19 years | 0 (0.0%) | 0 (0.0%) |
| 20 to 34 years | 45 (100.0%) | 0 (0.0%) |
| 35 to 50 years | 22 (100.0%) | 0 (0.0%) |
| Total | 67 (100.0%) | 0 (0.0%) |
Fertility by Education in Twin Rivers
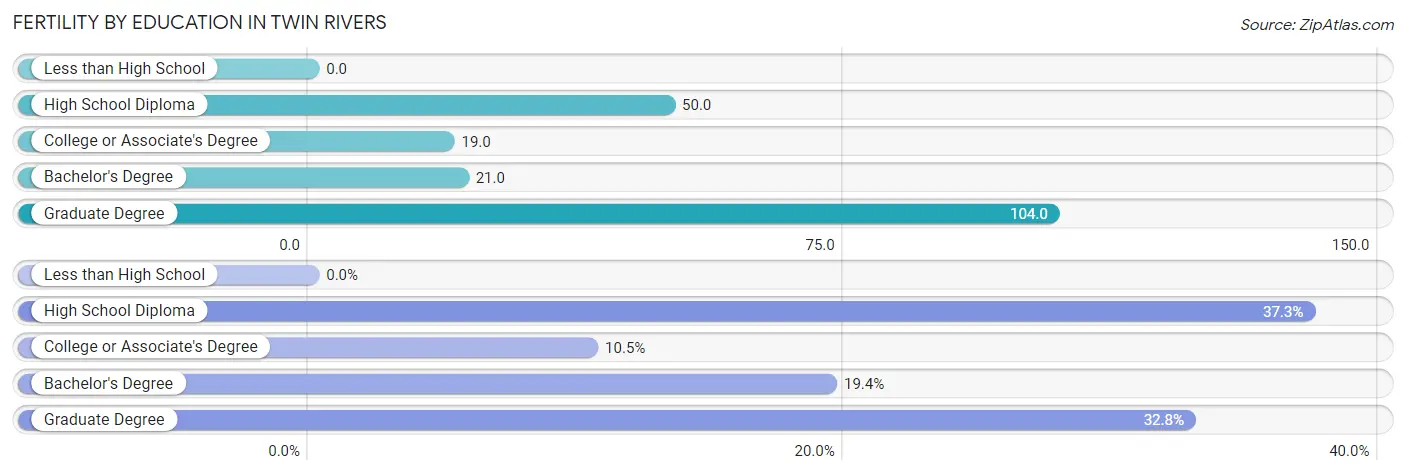
| Educational Attainment | Women with Births | Births / 1,000 Women |
| Less than High School | 0 (0.0%) | 0.0 |
| High School Diploma | 25 (37.3%) | 50.0 |
| College or Associate's Degree | 7 (10.4%) | 19.0 |
| Bachelor's Degree | 13 (19.4%) | 21.0 |
| Graduate Degree | 22 (32.8%) | 104.0 |
| Total | 67 (100.0%) | 34.0 |
Fertility by Education by Marriage Status in Twin Rivers
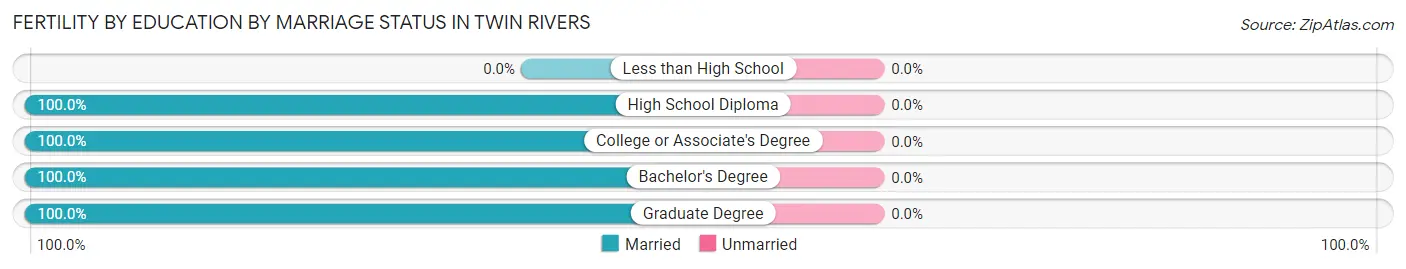
| Educational Attainment | Married | Unmarried |
| Less than High School | 0 (0.0%) | 0 (0.0%) |
| High School Diploma | 25 (100.0%) | 0 (0.0%) |
| College or Associate's Degree | 7 (100.0%) | 0 (0.0%) |
| Bachelor's Degree | 13 (100.0%) | 0 (0.0%) |
| Graduate Degree | 22 (100.0%) | 0 (0.0%) |
| Total | 67 (100.0%) | 0 (0.0%) |
Employment Characteristics in Twin Rivers
Employment by Class of Employer in Twin Rivers
Among the 4,704 employed individuals in Twin Rivers, private company employees (3,796 | 80.7%), not-for-profit organizations (314 | 6.7%), and local government employees (225 | 4.8%) make up the most common classes of employment.
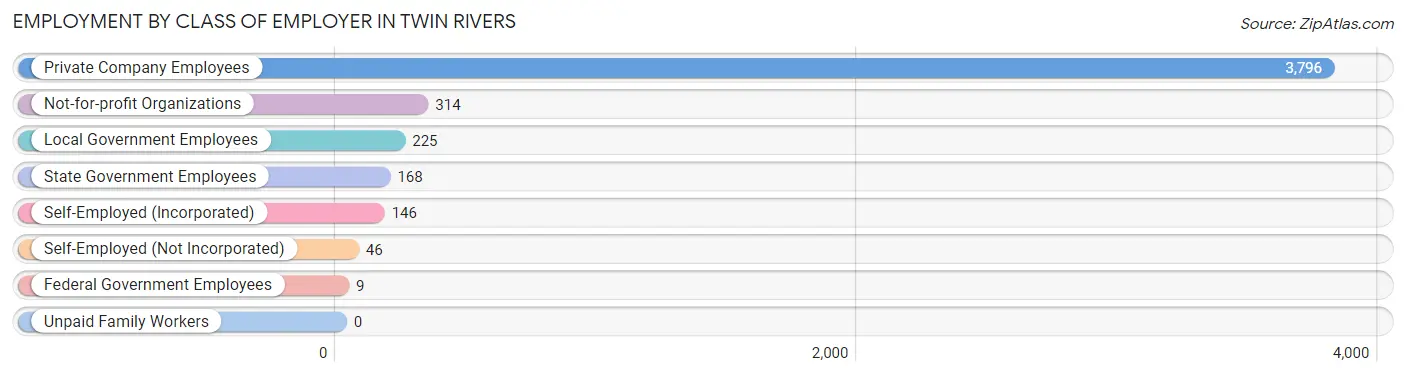
| Employer Class | # Employees | % Employees |
| Private Company Employees | 3,796 | 80.7% |
| Self-Employed (Incorporated) | 146 | 3.1% |
| Self-Employed (Not Incorporated) | 46 | 1.0% |
| Not-for-profit Organizations | 314 | 6.7% |
| Local Government Employees | 225 | 4.8% |
| State Government Employees | 168 | 3.6% |
| Federal Government Employees | 9 | 0.2% |
| Unpaid Family Workers | 0 | 0.0% |
| Total | 4,704 | 100.0% |
Employment Status by Age in Twin Rivers
According to the labor force statistics for Twin Rivers, out of the total population over 16 years of age (6,446), 77.2% or 4,976 individuals are in the labor force, with 1.6% or 80 of them unemployed. The age group with the highest labor force participation rate is 45 to 54 years, with 95.9% or 1,051 individuals in the labor force. Within the labor force, the 75 years and over age range has the highest percentage of unemployed individuals, with 100.0% or 12 of them being unemployed.
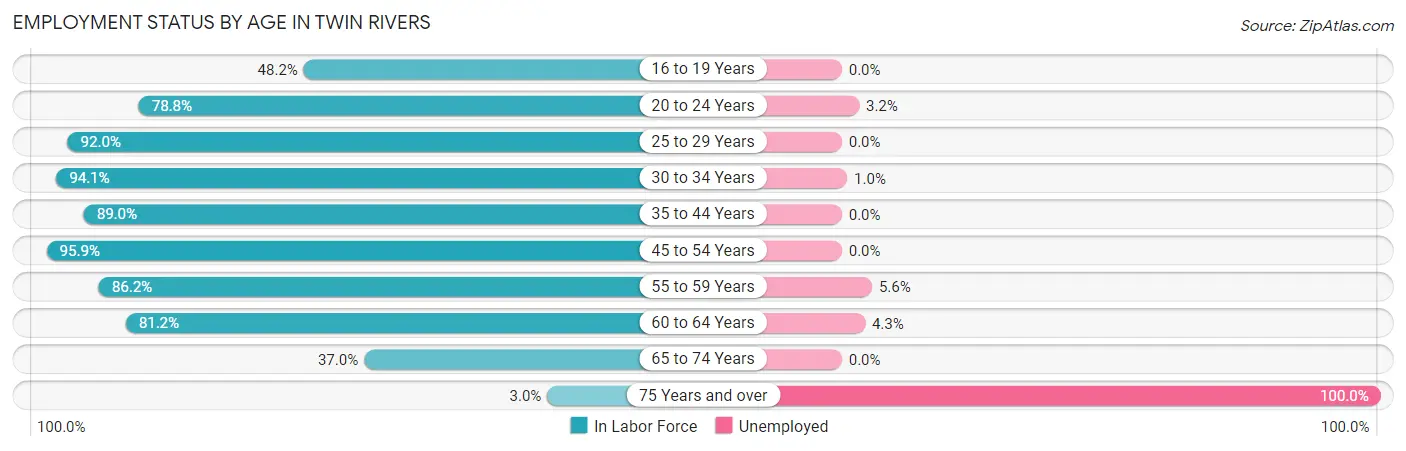
| Age Bracket | In Labor Force | Unemployed |
| 16 to 19 Years | 161 (48.2%) | 0 (0.0%) |
| 20 to 24 Years | 753 (78.8%) | 24 (3.2%) |
| 25 to 29 Years | 590 (92.0%) | 0 (0.0%) |
| 30 to 34 Years | 627 (94.1%) | 6 (1.0%) |
| 35 to 44 Years | 823 (89.0%) | 0 (0.0%) |
| 45 to 54 Years | 1,051 (95.9%) | 0 (0.0%) |
| 55 to 59 Years | 356 (86.2%) | 20 (5.6%) |
| 60 to 64 Years | 418 (81.2%) | 18 (4.3%) |
| 65 to 74 Years | 187 (37.0%) | 0 (0.0%) |
| 75 Years and over | 12 (3.0%) | 12 (100.0%) |
| Total | 4,976 (77.2%) | 80 (1.6%) |
Employment Status by Educational Attainment in Twin Rivers
According to labor force statistics for Twin Rivers, 90.8% of individuals (3,864) out of the total population between 25 and 64 years of age (4,256) are in the labor force, with 1.1% or 43 of them being unemployed. The group with the highest labor force participation rate are those with the educational attainment of high school diploma, with 95.1% or 1,214 individuals in the labor force. Within the labor force, individuals with college / associate degree education have the highest percentage of unemployment, with 2.5% or 20 of them being unemployed.
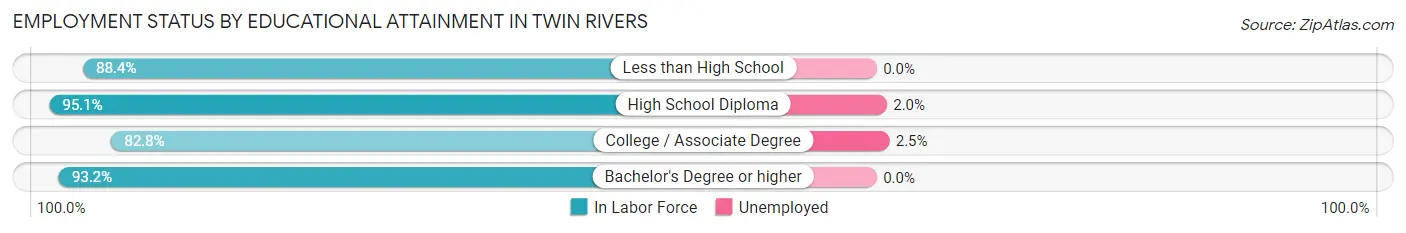
| Educational Attainment | In Labor Force | Unemployed |
| Less than High School | 487 (88.4%) | 0 (0.0%) |
| High School Diploma | 1,214 (95.1%) | 26 (2.0%) |
| College / Associate Degree | 787 (82.8%) | 24 (2.5%) |
| Bachelor's Degree or higher | 1,377 (93.2%) | 0 (0.0%) |
| Total | 3,864 (90.8%) | 47 (1.1%) |
Employment Occupations by Sex in Twin Rivers
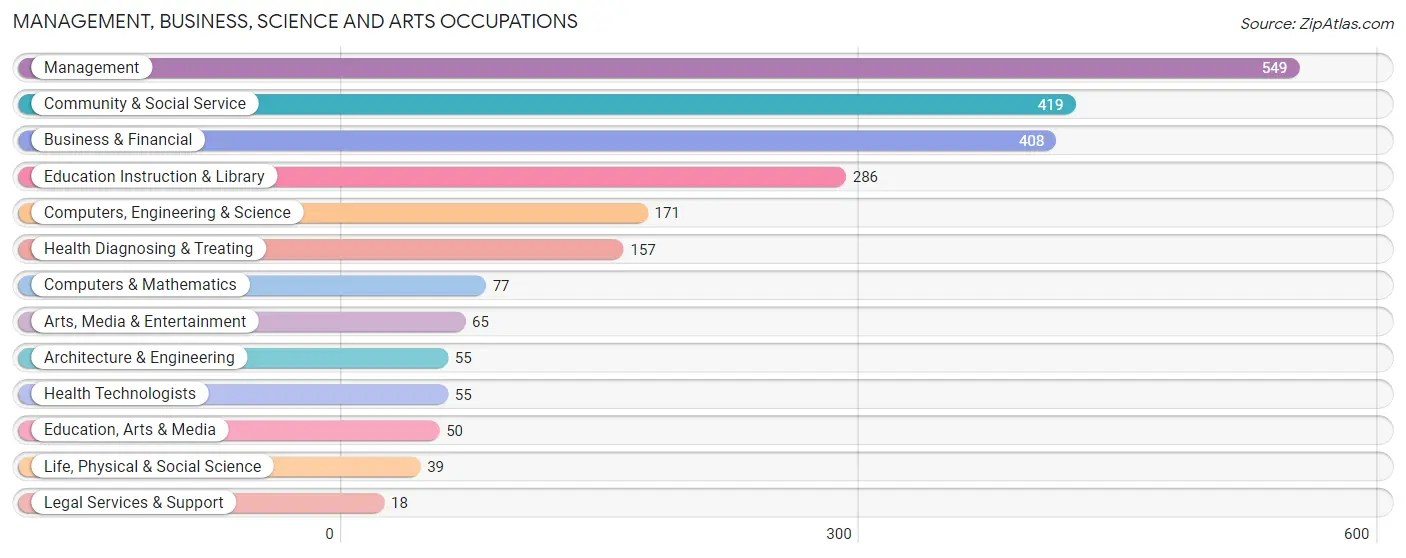
Management, Business, Science and Arts Occupations
The most common Management, Business, Science and Arts occupations in Twin Rivers are Management (549 | 11.2%), Community & Social Service (419 | 8.6%), Business & Financial (408 | 8.3%), Education Instruction & Library (286 | 5.8%), and Computers, Engineering & Science (171 | 3.5%).
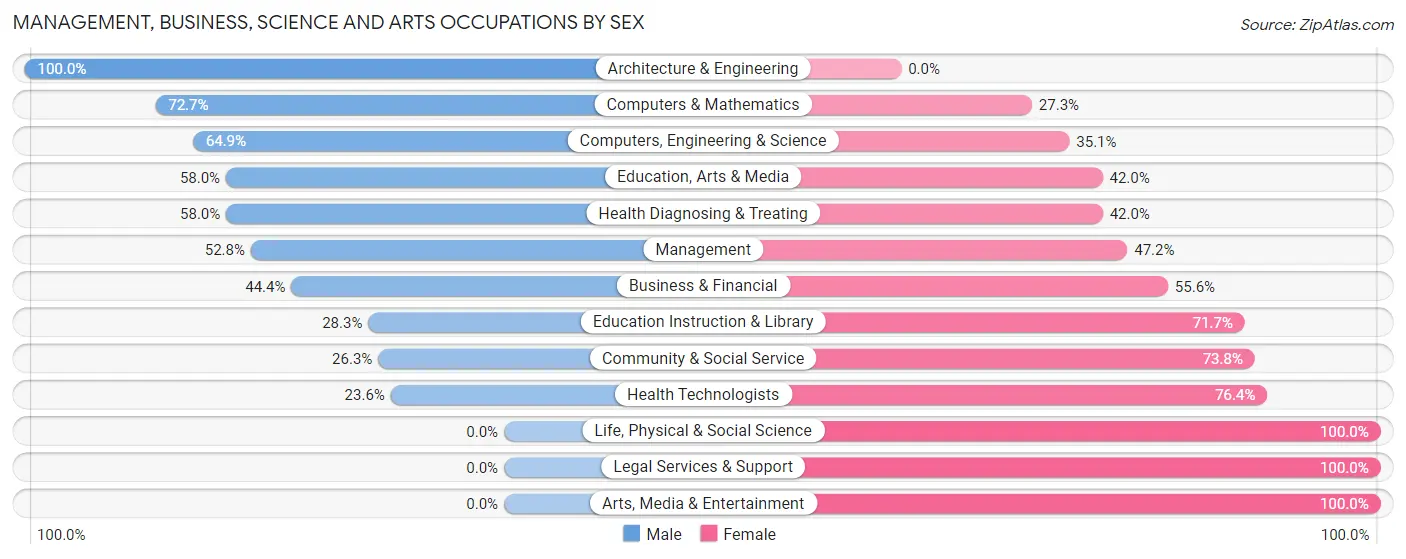
Management, Business, Science and Arts Occupations by Sex
Within the Management, Business, Science and Arts occupations in Twin Rivers, the most male-oriented occupations are Architecture & Engineering (100.0%), Computers & Mathematics (72.7%), and Computers, Engineering & Science (64.9%), while the most female-oriented occupations are Life, Physical & Social Science (100.0%), Legal Services & Support (100.0%), and Arts, Media & Entertainment (100.0%).
| Occupation | Male | Female |
| Management | 290 (52.8%) | 259 (47.2%) |
| Business & Financial | 181 (44.4%) | 227 (55.6%) |
| Computers, Engineering & Science | 111 (64.9%) | 60 (35.1%) |
| Computers & Mathematics | 56 (72.7%) | 21 (27.3%) |
| Architecture & Engineering | 55 (100.0%) | 0 (0.0%) |
| Life, Physical & Social Science | 0 (0.0%) | 39 (100.0%) |
| Community & Social Service | 110 (26.3%) | 309 (73.8%) |
| Education, Arts & Media | 29 (58.0%) | 21 (42.0%) |
| Legal Services & Support | 0 (0.0%) | 18 (100.0%) |
| Education Instruction & Library | 81 (28.3%) | 205 (71.7%) |
| Arts, Media & Entertainment | 0 (0.0%) | 65 (100.0%) |
| Health Diagnosing & Treating | 91 (58.0%) | 66 (42.0%) |
| Health Technologists | 13 (23.6%) | 42 (76.4%) |
| Total (Category) | 783 (46.0%) | 921 (54.0%) |
| Total (Overall) | 2,903 (59.3%) | 1,995 (40.7%) |
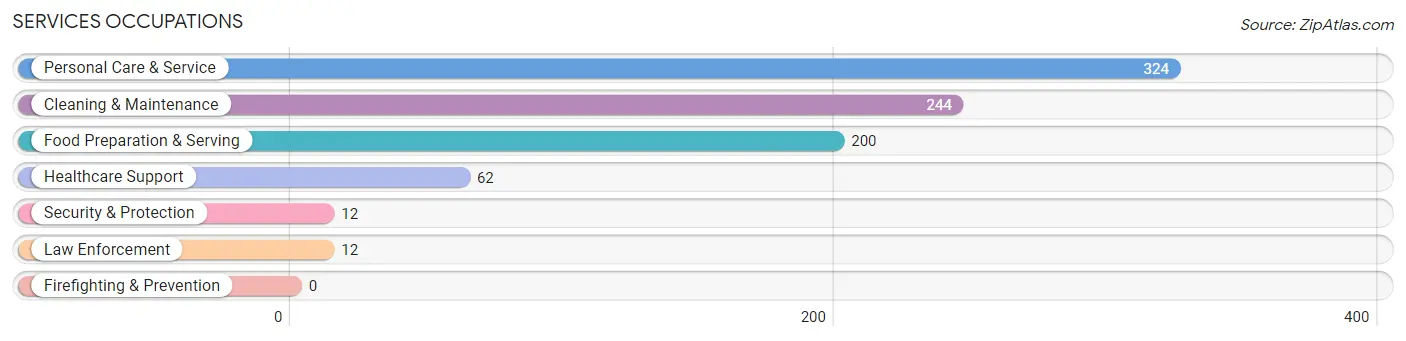
Services Occupations
The most common Services occupations in Twin Rivers are Personal Care & Service (324 | 6.6%), Cleaning & Maintenance (244 | 5.0%), Food Preparation & Serving (200 | 4.1%), Healthcare Support (62 | 1.3%), and Security & Protection (12 | 0.2%).
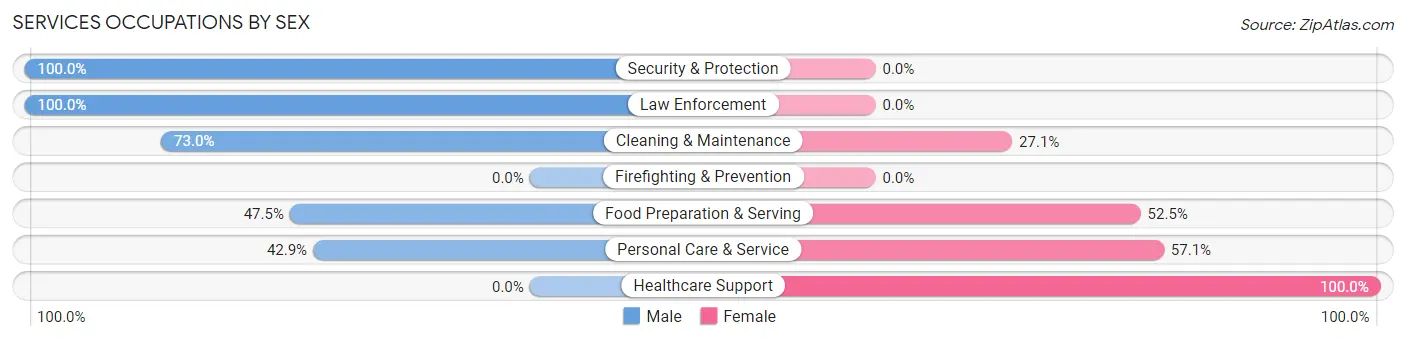
Services Occupations by Sex
Within the Services occupations in Twin Rivers, the most male-oriented occupations are Security & Protection (100.0%), Law Enforcement (100.0%), and Cleaning & Maintenance (73.0%), while the most female-oriented occupations are Healthcare Support (100.0%), Personal Care & Service (57.1%), and Food Preparation & Serving (52.5%).
| Occupation | Male | Female |
| Healthcare Support | 0 (0.0%) | 62 (100.0%) |
| Security & Protection | 12 (100.0%) | 0 (0.0%) |
| Firefighting & Prevention | 0 (0.0%) | 0 (0.0%) |
| Law Enforcement | 12 (100.0%) | 0 (0.0%) |
| Food Preparation & Serving | 95 (47.5%) | 105 (52.5%) |
| Cleaning & Maintenance | 178 (73.0%) | 66 (27.1%) |
| Personal Care & Service | 139 (42.9%) | 185 (57.1%) |
| Total (Category) | 424 (50.4%) | 418 (49.6%) |
| Total (Overall) | 2,903 (59.3%) | 1,995 (40.7%) |
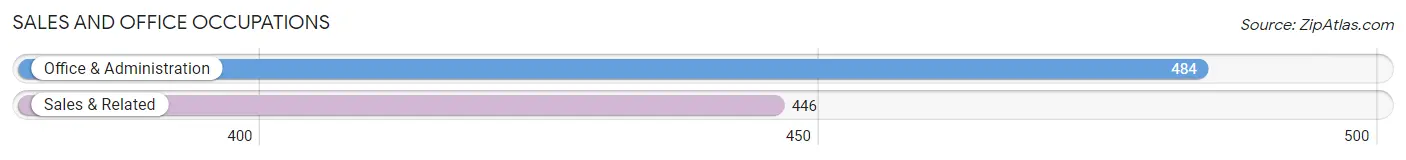
Sales and Office Occupations
The most common Sales and Office occupations in Twin Rivers are Office & Administration (484 | 9.9%), and Sales & Related (446 | 9.1%).
Sales and Office Occupations by Sex
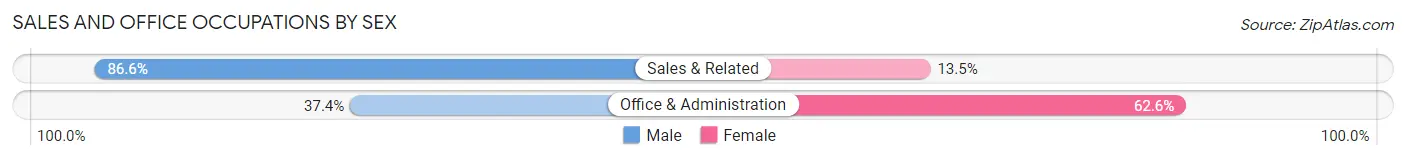
| Occupation | Male | Female |
| Sales & Related | 386 (86.6%) | 60 (13.5%) |
| Office & Administration | 181 (37.4%) | 303 (62.6%) |
| Total (Category) | 567 (61.0%) | 363 (39.0%) |
| Total (Overall) | 2,903 (59.3%) | 1,995 (40.7%) |
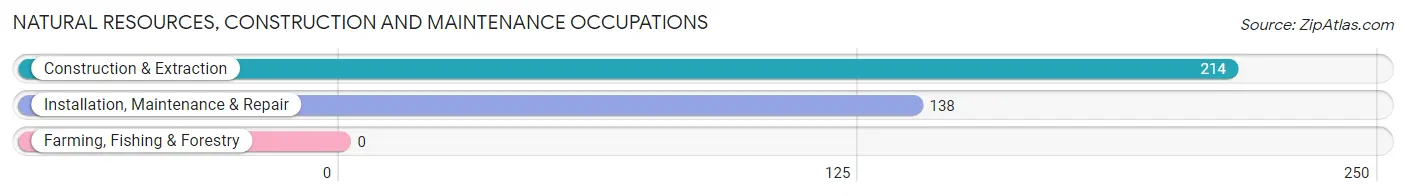
Natural Resources, Construction and Maintenance Occupations
The most common Natural Resources, Construction and Maintenance occupations in Twin Rivers are Construction & Extraction (214 | 4.4%), and Installation, Maintenance & Repair (138 | 2.8%).
Natural Resources, Construction and Maintenance Occupations by Sex
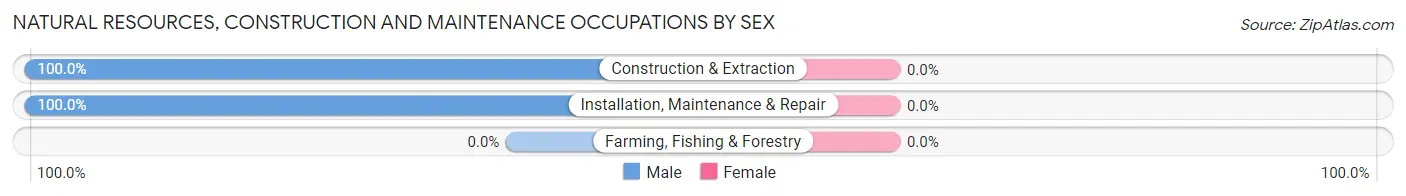
| Occupation | Male | Female |
| Farming, Fishing & Forestry | 0 (0.0%) | 0 (0.0%) |
| Construction & Extraction | 214 (100.0%) | 0 (0.0%) |
| Installation, Maintenance & Repair | 138 (100.0%) | 0 (0.0%) |
| Total (Category) | 352 (100.0%) | 0 (0.0%) |
| Total (Overall) | 2,903 (59.3%) | 1,995 (40.7%) |
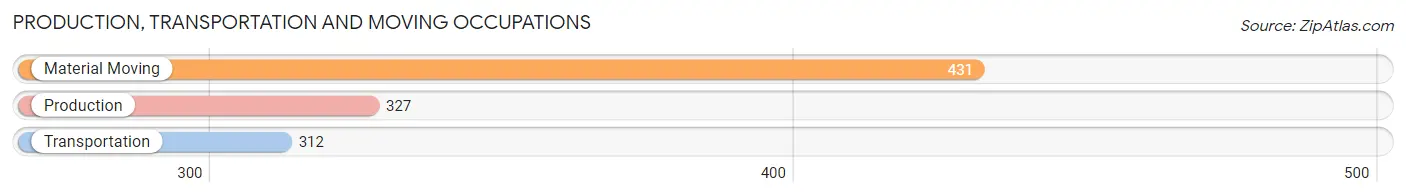
Production, Transportation and Moving Occupations
The most common Production, Transportation and Moving occupations in Twin Rivers are Material Moving (431 | 8.8%), Production (327 | 6.7%), and Transportation (312 | 6.4%).
Production, Transportation and Moving Occupations by Sex
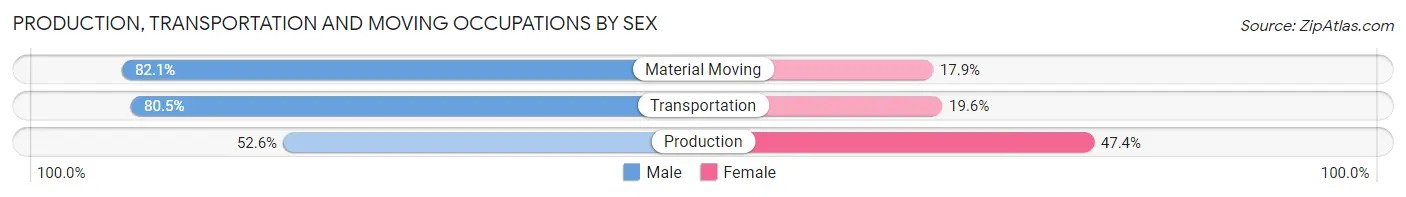
| Occupation | Male | Female |
| Production | 172 (52.6%) | 155 (47.4%) |
| Transportation | 251 (80.4%) | 61 (19.6%) |
| Material Moving | 354 (82.1%) | 77 (17.9%) |
| Total (Category) | 777 (72.6%) | 293 (27.4%) |
| Total (Overall) | 2,903 (59.3%) | 1,995 (40.7%) |
Employment Industries by Sex in Twin Rivers
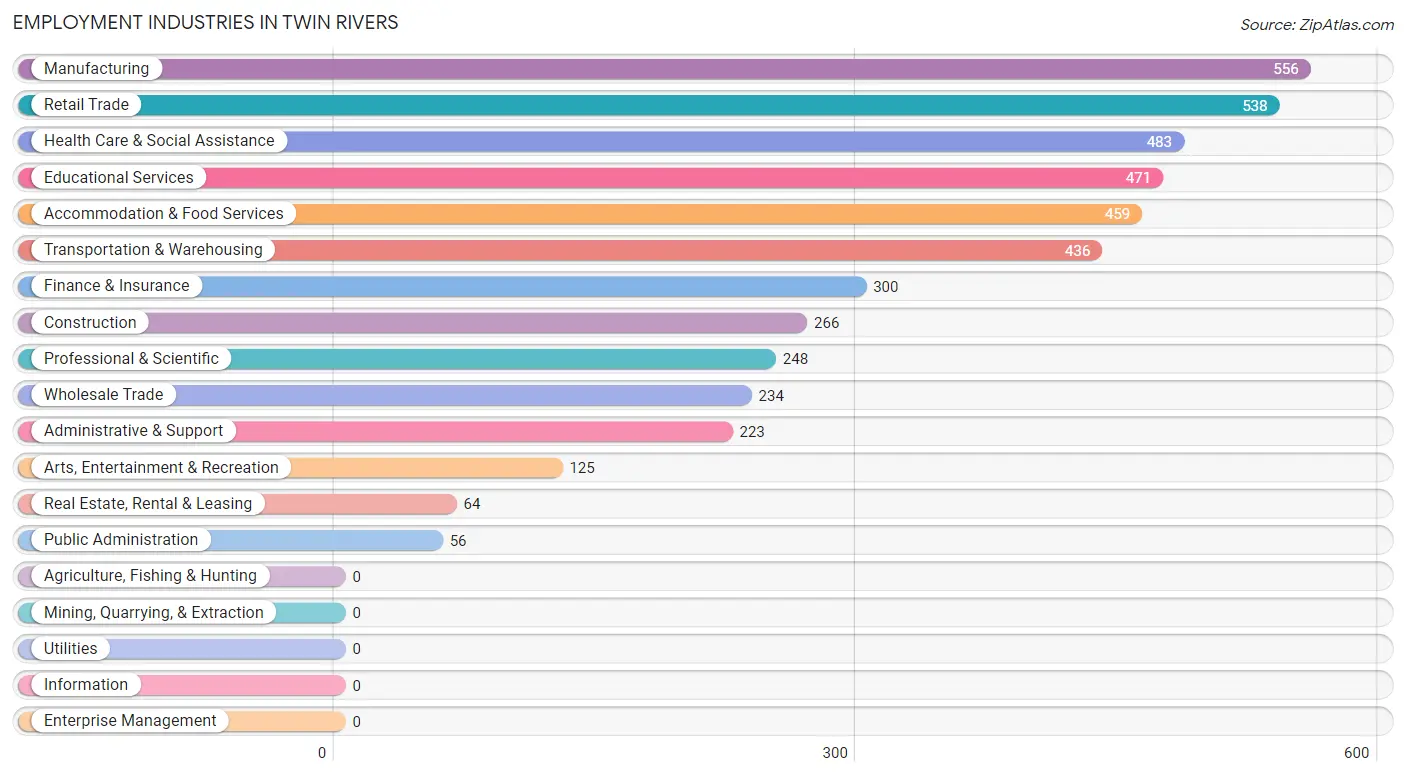
Employment Industries in Twin Rivers
The major employment industries in Twin Rivers include Manufacturing (556 | 11.4%), Retail Trade (538 | 11.0%), Health Care & Social Assistance (483 | 9.9%), Educational Services (471 | 9.6%), and Accommodation & Food Services (459 | 9.4%).
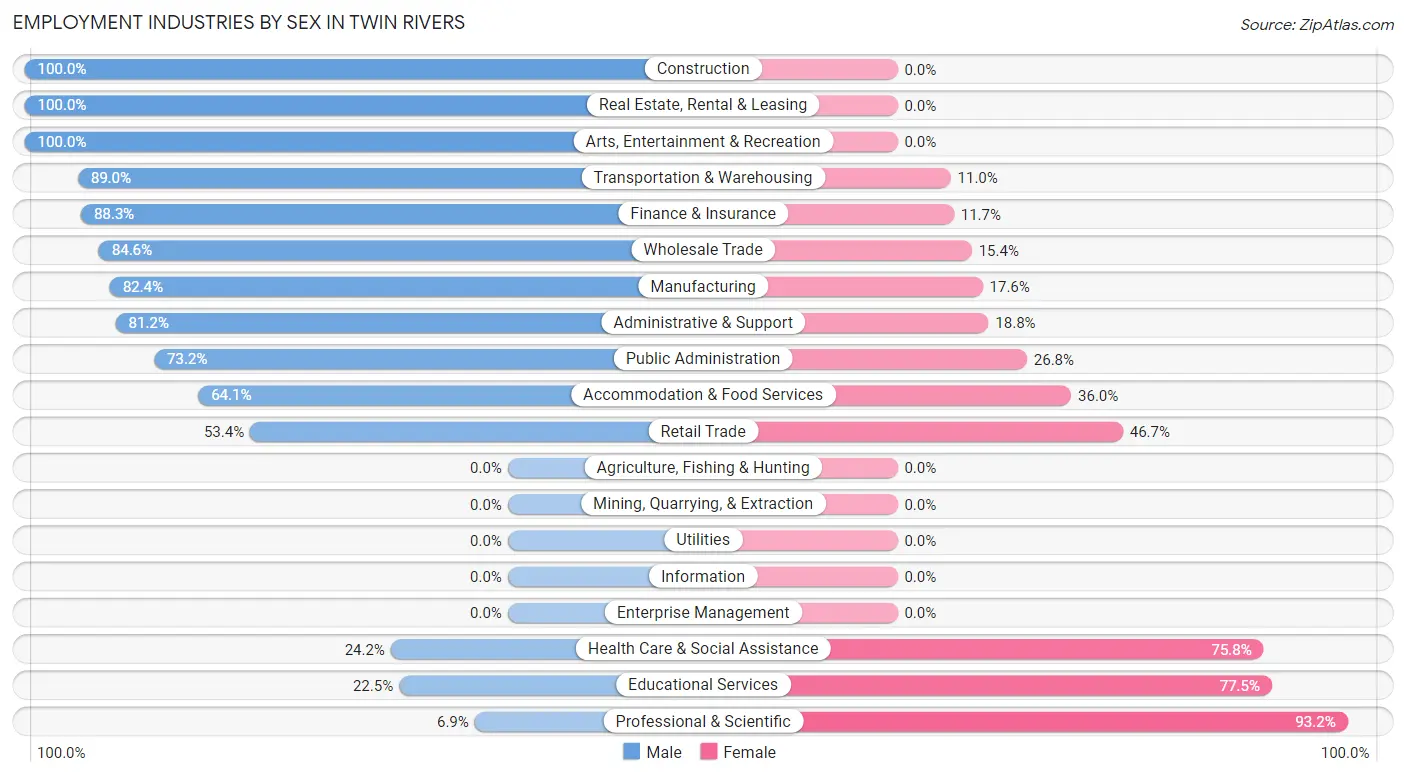
Employment Industries by Sex in Twin Rivers
The Twin Rivers industries that see more men than women are Construction (100.0%), Real Estate, Rental & Leasing (100.0%), and Arts, Entertainment & Recreation (100.0%), whereas the industries that tend to have a higher number of women are Professional & Scientific (93.1%), Educational Services (77.5%), and Health Care & Social Assistance (75.8%).
| Industry | Male | Female |
| Agriculture, Fishing & Hunting | 0 (0.0%) | 0 (0.0%) |
| Mining, Quarrying, & Extraction | 0 (0.0%) | 0 (0.0%) |
| Construction | 266 (100.0%) | 0 (0.0%) |
| Manufacturing | 458 (82.4%) | 98 (17.6%) |
| Wholesale Trade | 198 (84.6%) | 36 (15.4%) |
| Retail Trade | 287 (53.3%) | 251 (46.7%) |
| Transportation & Warehousing | 388 (89.0%) | 48 (11.0%) |
| Utilities | 0 (0.0%) | 0 (0.0%) |
| Information | 0 (0.0%) | 0 (0.0%) |
| Finance & Insurance | 265 (88.3%) | 35 (11.7%) |
| Real Estate, Rental & Leasing | 64 (100.0%) | 0 (0.0%) |
| Professional & Scientific | 17 (6.9%) | 231 (93.1%) |
| Enterprise Management | 0 (0.0%) | 0 (0.0%) |
| Administrative & Support | 181 (81.2%) | 42 (18.8%) |
| Educational Services | 106 (22.5%) | 365 (77.5%) |
| Health Care & Social Assistance | 117 (24.2%) | 366 (75.8%) |
| Arts, Entertainment & Recreation | 125 (100.0%) | 0 (0.0%) |
| Accommodation & Food Services | 294 (64.0%) | 165 (35.9%) |
| Public Administration | 41 (73.2%) | 15 (26.8%) |
| Total | 2,903 (59.3%) | 1,995 (40.7%) |
Education in Twin Rivers
School Enrollment in Twin Rivers
The most common levels of schooling among the 1,646 students in Twin Rivers are college / undergraduate (413 | 25.1%), high school (344 | 20.9%), and middle school (326 | 19.8%).
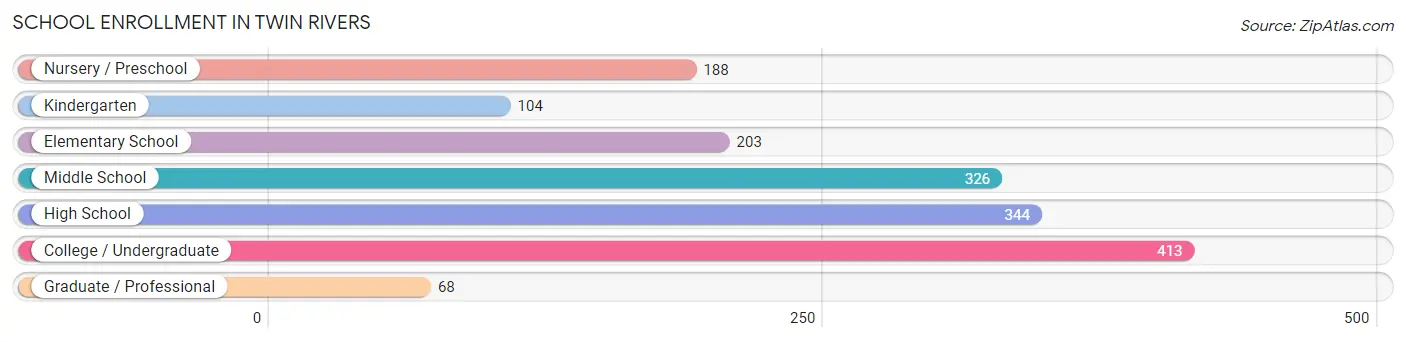
| School Level | # Students | % Students |
| Nursery / Preschool | 188 | 11.4% |
| Kindergarten | 104 | 6.3% |
| Elementary School | 203 | 12.3% |
| Middle School | 326 | 19.8% |
| High School | 344 | 20.9% |
| College / Undergraduate | 413 | 25.1% |
| Graduate / Professional | 68 | 4.1% |
| Total | 1,646 | 100.0% |
School Enrollment by Age by Funding Source in Twin Rivers
Out of a total of 1,646 students who are enrolled in schools in Twin Rivers, 201 (12.2%) attend a private institution, while the remaining 1,445 (87.8%) are enrolled in public schools. The age group of 3 to 4 year olds has the highest likelihood of being enrolled in private schools, with 64 (45.4% in the age bracket) enrolled. Conversely, the age group of 15 to 17 year olds has the lowest likelihood of being enrolled in a private school, with 315 (100.0% in the age bracket) attending a public institution.
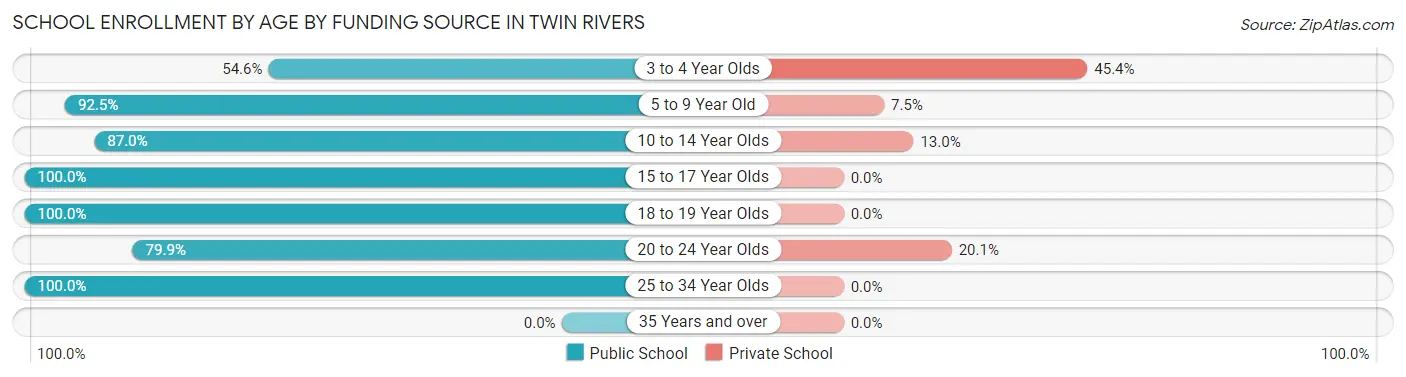
| Age Bracket | Public School | Private School |
| 3 to 4 Year Olds | 77 (54.6%) | 64 (45.4%) |
| 5 to 9 Year Old | 307 (92.5%) | 25 (7.5%) |
| 10 to 14 Year Olds | 328 (87.0%) | 49 (13.0%) |
| 15 to 17 Year Olds | 315 (100.0%) | 0 (0.0%) |
| 18 to 19 Year Olds | 48 (100.0%) | 0 (0.0%) |
| 20 to 24 Year Olds | 250 (79.9%) | 63 (20.1%) |
| 25 to 34 Year Olds | 120 (100.0%) | 0 (0.0%) |
| 35 Years and over | 0 (0.0%) | 0 (0.0%) |
| Total | 1,445 (87.8%) | 201 (12.2%) |
Educational Attainment by Field of Study in Twin Rivers
Business (440 | 20.4%), education (258 | 12.0%), social sciences (226 | 10.5%), engineering (221 | 10.3%), and psychology (152 | 7.1%) are the most common fields of study among 2,153 individuals in Twin Rivers who have obtained a bachelor's degree or higher.
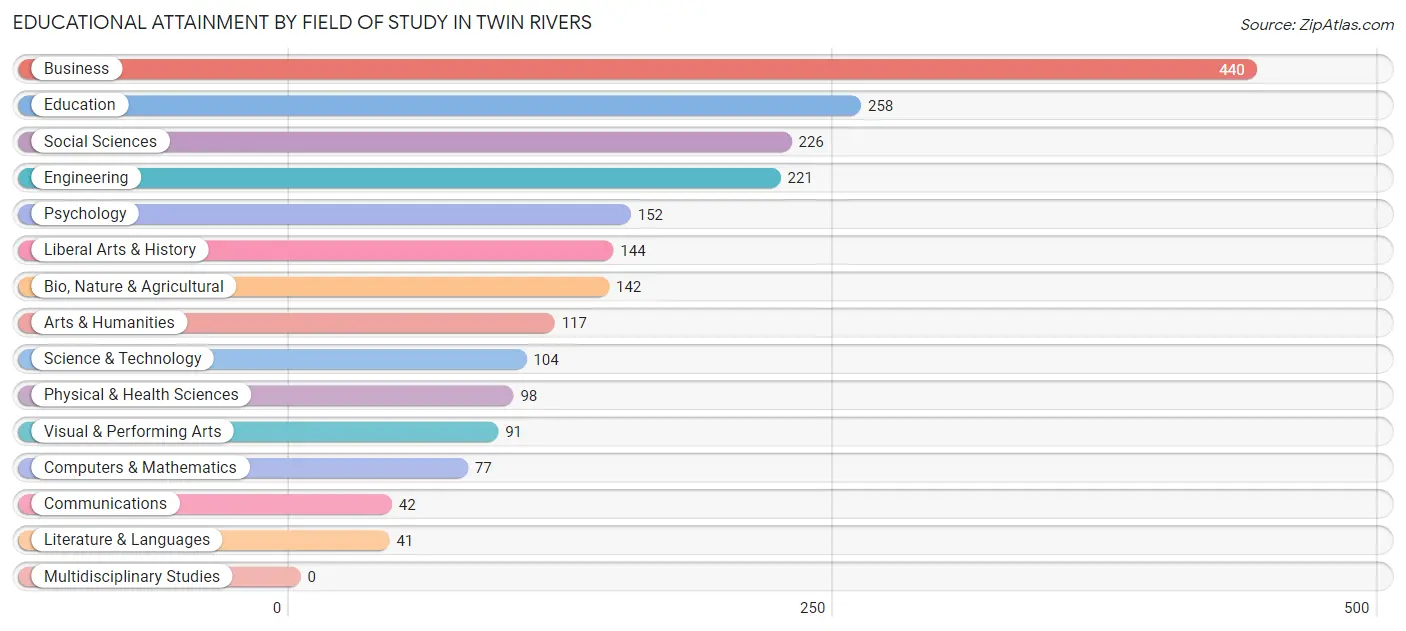
| Field of Study | # Graduates | % Graduates |
| Computers & Mathematics | 77 | 3.6% |
| Bio, Nature & Agricultural | 142 | 6.6% |
| Physical & Health Sciences | 98 | 4.5% |
| Psychology | 152 | 7.1% |
| Social Sciences | 226 | 10.5% |
| Engineering | 221 | 10.3% |
| Multidisciplinary Studies | 0 | 0.0% |
| Science & Technology | 104 | 4.8% |
| Business | 440 | 20.4% |
| Education | 258 | 12.0% |
| Literature & Languages | 41 | 1.9% |
| Liberal Arts & History | 144 | 6.7% |
| Visual & Performing Arts | 91 | 4.2% |
| Communications | 42 | 1.9% |
| Arts & Humanities | 117 | 5.4% |
| Total | 2,153 | 100.0% |
Transportation & Commute in Twin Rivers
Vehicle Availability by Sex in Twin Rivers
The most prevalent vehicle ownership categories in Twin Rivers are males with 2 vehicles (962, accounting for 34.2%) and females with 2 vehicles (801, making up 50.8%).
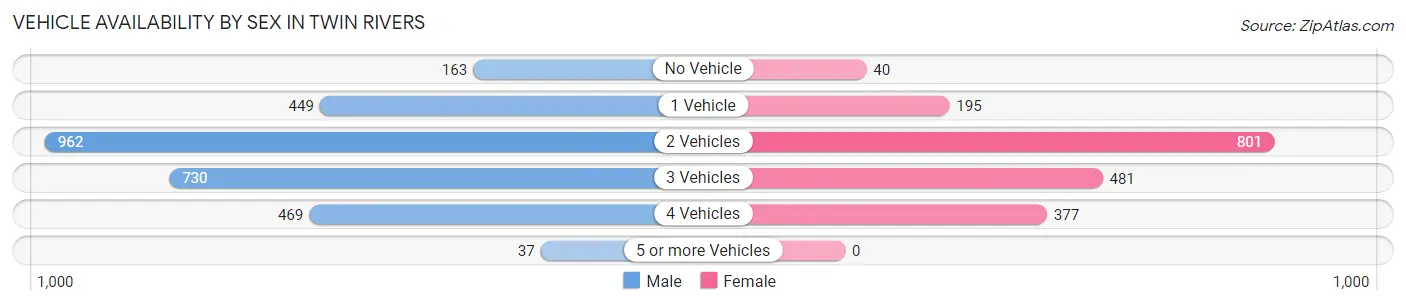
| Vehicles Available | Male | Female |
| No Vehicle | 163 (5.8%) | 40 (2.1%) |
| 1 Vehicle | 449 (16.0%) | 195 (10.3%) |
| 2 Vehicles | 962 (34.2%) | 801 (42.3%) |
| 3 Vehicles | 730 (26.0%) | 481 (25.4%) |
| 4 Vehicles | 469 (16.7%) | 377 (19.9%) |
| 5 or more Vehicles | 37 (1.3%) | 0 (0.0%) |
| Total | 2,810 (100.0%) | 1,894 (100.0%) |
Commute Time in Twin Rivers
The most frequently occuring commute durations in Twin Rivers are 10 to 14 minutes (671 commuters, 16.4%), 30 to 34 minutes (634 commuters, 15.5%), and 20 to 24 minutes (548 commuters, 13.4%).
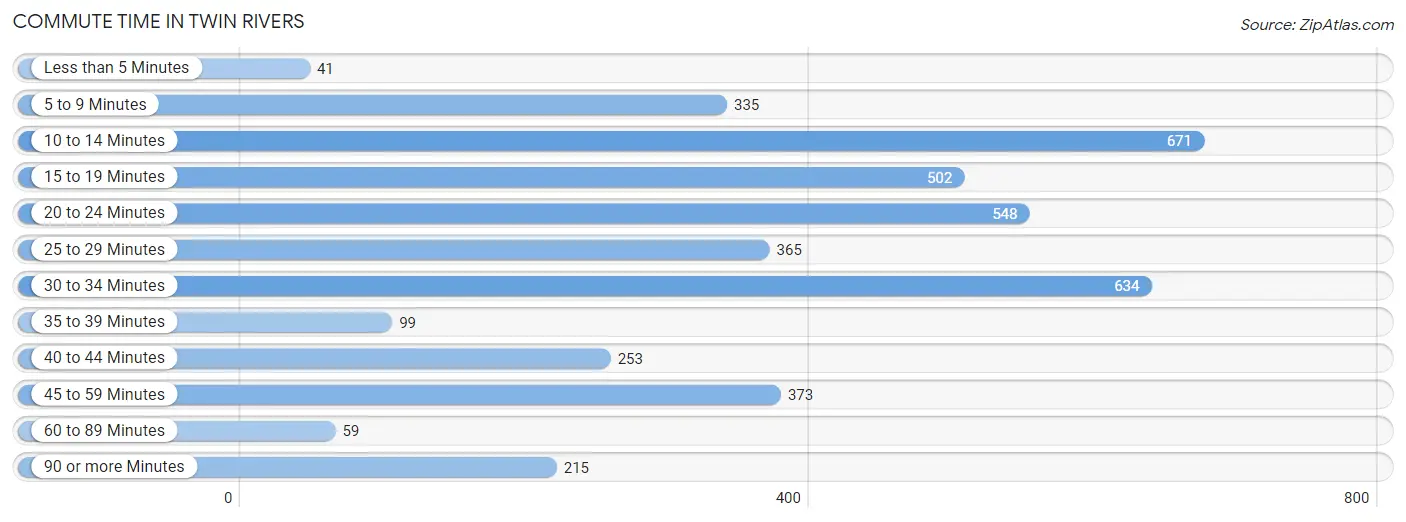
| Commute Time | # Commuters | % Commuters |
| Less than 5 Minutes | 41 | 1.0% |
| 5 to 9 Minutes | 335 | 8.2% |
| 10 to 14 Minutes | 671 | 16.4% |
| 15 to 19 Minutes | 502 | 12.3% |
| 20 to 24 Minutes | 548 | 13.4% |
| 25 to 29 Minutes | 365 | 8.9% |
| 30 to 34 Minutes | 634 | 15.5% |
| 35 to 39 Minutes | 99 | 2.4% |
| 40 to 44 Minutes | 253 | 6.2% |
| 45 to 59 Minutes | 373 | 9.1% |
| 60 to 89 Minutes | 59 | 1.4% |
| 90 or more Minutes | 215 | 5.2% |
Commute Time by Sex in Twin Rivers
The most common commute times in Twin Rivers are 30 to 34 minutes (349 commuters, 14.8%) for males and 10 to 14 minutes (421 commuters, 24.3%) for females.
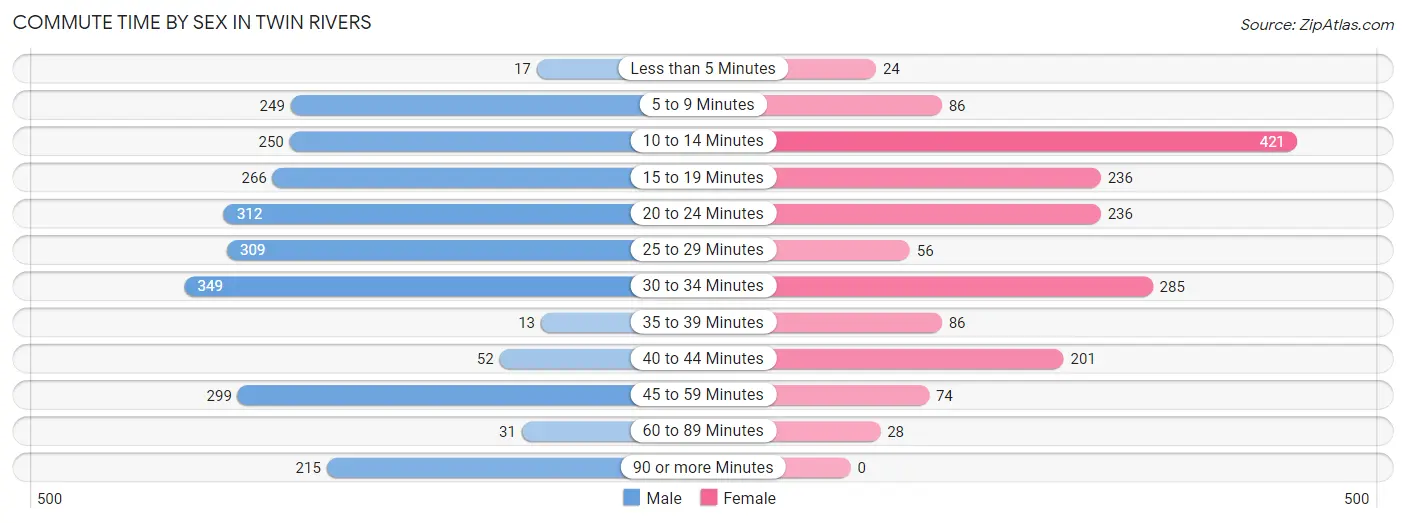
| Commute Time | Male | Female |
| Less than 5 Minutes | 17 (0.7%) | 24 (1.4%) |
| 5 to 9 Minutes | 249 (10.5%) | 86 (5.0%) |
| 10 to 14 Minutes | 250 (10.6%) | 421 (24.3%) |
| 15 to 19 Minutes | 266 (11.3%) | 236 (13.6%) |
| 20 to 24 Minutes | 312 (13.2%) | 236 (13.6%) |
| 25 to 29 Minutes | 309 (13.1%) | 56 (3.2%) |
| 30 to 34 Minutes | 349 (14.8%) | 285 (16.5%) |
| 35 to 39 Minutes | 13 (0.5%) | 86 (5.0%) |
| 40 to 44 Minutes | 52 (2.2%) | 201 (11.6%) |
| 45 to 59 Minutes | 299 (12.7%) | 74 (4.3%) |
| 60 to 89 Minutes | 31 (1.3%) | 28 (1.6%) |
| 90 or more Minutes | 215 (9.1%) | 0 (0.0%) |
Time of Departure to Work by Sex in Twin Rivers
The most frequent times of departure to work in Twin Rivers are 7:00 AM to 7:29 AM (564, 23.9%) for males and 8:00 AM to 8:29 AM (388, 22.4%) for females.
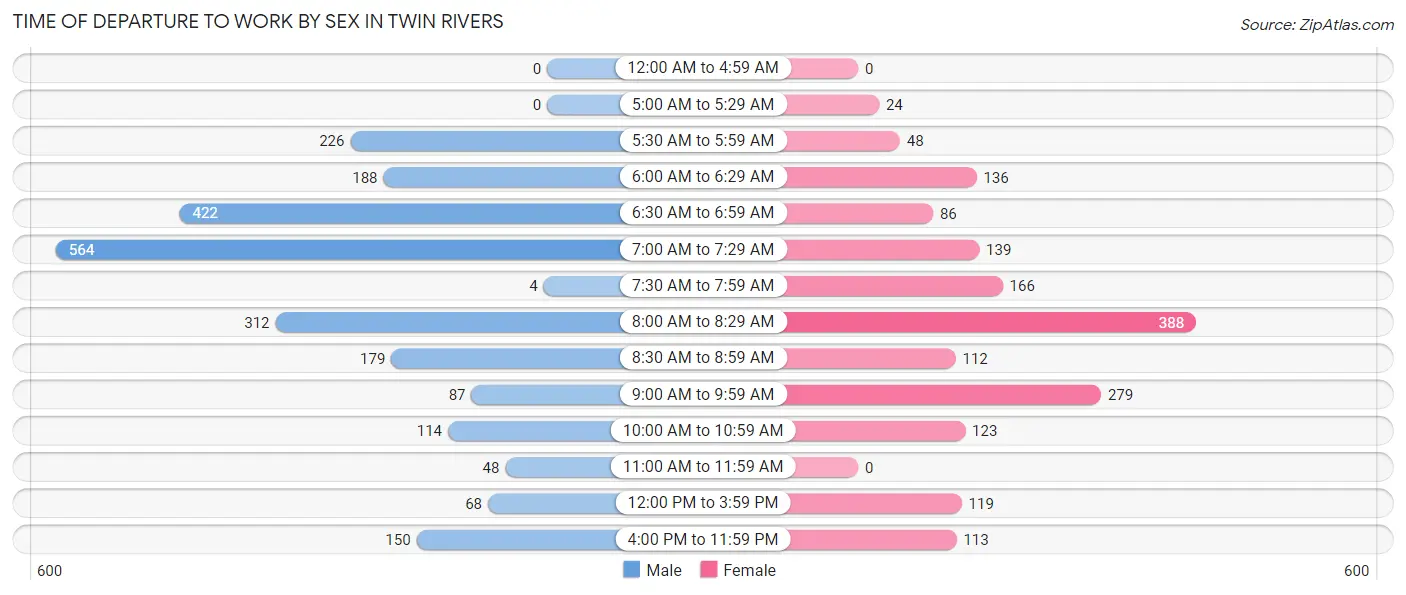
| Time of Departure | Male | Female |
| 12:00 AM to 4:59 AM | 0 (0.0%) | 0 (0.0%) |
| 5:00 AM to 5:29 AM | 0 (0.0%) | 24 (1.4%) |
| 5:30 AM to 5:59 AM | 226 (9.6%) | 48 (2.8%) |
| 6:00 AM to 6:29 AM | 188 (8.0%) | 136 (7.9%) |
| 6:30 AM to 6:59 AM | 422 (17.9%) | 86 (5.0%) |
| 7:00 AM to 7:29 AM | 564 (23.9%) | 139 (8.0%) |
| 7:30 AM to 7:59 AM | 4 (0.2%) | 166 (9.6%) |
| 8:00 AM to 8:29 AM | 312 (13.2%) | 388 (22.4%) |
| 8:30 AM to 8:59 AM | 179 (7.6%) | 112 (6.5%) |
| 9:00 AM to 9:59 AM | 87 (3.7%) | 279 (16.1%) |
| 10:00 AM to 10:59 AM | 114 (4.8%) | 123 (7.1%) |
| 11:00 AM to 11:59 AM | 48 (2.0%) | 0 (0.0%) |
| 12:00 PM to 3:59 PM | 68 (2.9%) | 119 (6.9%) |
| 4:00 PM to 11:59 PM | 150 (6.4%) | 113 (6.5%) |
| Total | 2,362 (100.0%) | 1,733 (100.0%) |
Housing Occupancy in Twin Rivers
Occupancy by Ownership in Twin Rivers
Of the total 2,744 dwellings in Twin Rivers, owner-occupied units account for 1,951 (71.1%), while renter-occupied units make up 793 (28.9%).
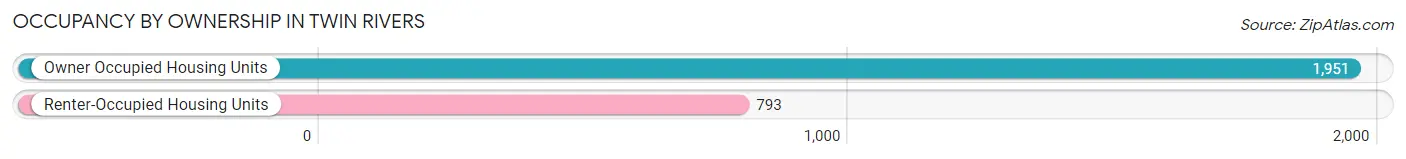
| Occupancy | # Housing Units | % Housing Units |
| Owner Occupied Housing Units | 1,951 | 71.1% |
| Renter-Occupied Housing Units | 793 | 28.9% |
| Total Occupied Housing Units | 2,744 | 100.0% |
Occupancy by Household Size in Twin Rivers
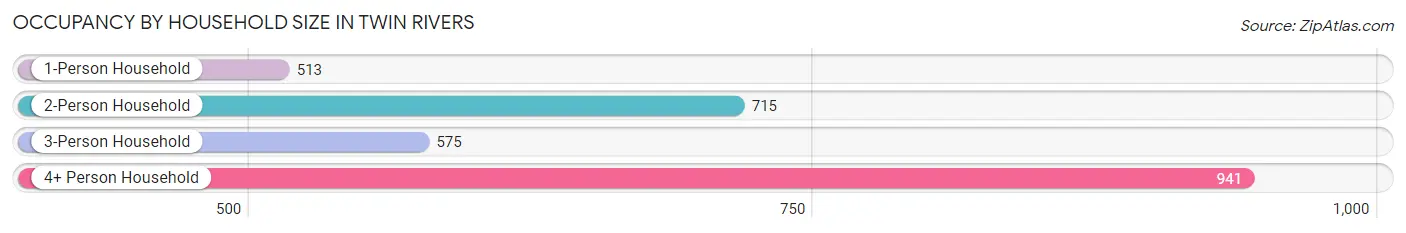
| Household Size | # Housing Units | % Housing Units |
| 1-Person Household | 513 | 18.7% |
| 2-Person Household | 715 | 26.1% |
| 3-Person Household | 575 | 20.9% |
| 4+ Person Household | 941 | 34.3% |
| Total Housing Units | 2,744 | 100.0% |
Occupancy by Ownership by Household Size in Twin Rivers
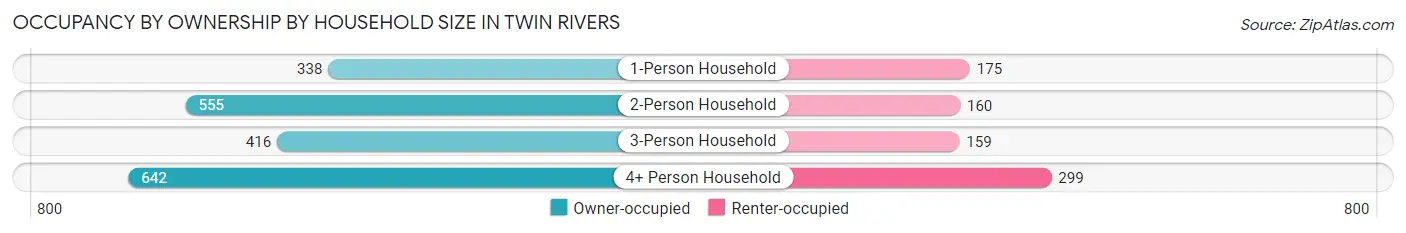
| Household Size | Owner-occupied | Renter-occupied |
| 1-Person Household | 338 (65.9%) | 175 (34.1%) |
| 2-Person Household | 555 (77.6%) | 160 (22.4%) |
| 3-Person Household | 416 (72.4%) | 159 (27.7%) |
| 4+ Person Household | 642 (68.2%) | 299 (31.8%) |
| Total Housing Units | 1,951 (71.1%) | 793 (28.9%) |
Occupancy by Educational Attainment in Twin Rivers
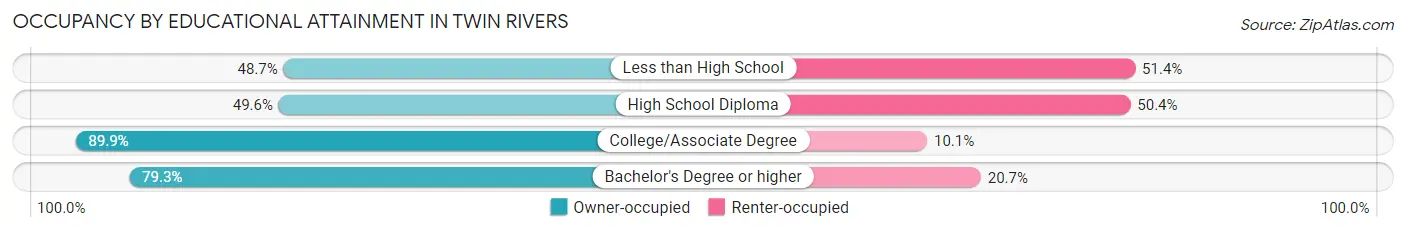
| Household Size | Owner-occupied | Renter-occupied |
| Less than High School | 162 (48.6%) | 171 (51.3%) |
| High School Diploma | 310 (49.6%) | 315 (50.4%) |
| College/Associate Degree | 535 (89.9%) | 60 (10.1%) |
| Bachelor's Degree or higher | 944 (79.3%) | 247 (20.7%) |
Occupancy by Age of Householder in Twin Rivers
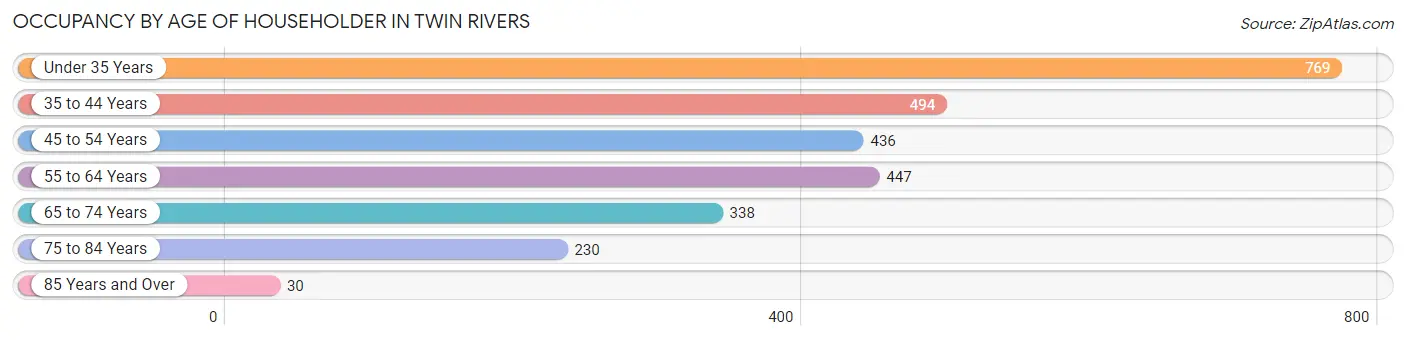
| Age Bracket | # Households | % Households |
| Under 35 Years | 769 | 28.0% |
| 35 to 44 Years | 494 | 18.0% |
| 45 to 54 Years | 436 | 15.9% |
| 55 to 64 Years | 447 | 16.3% |
| 65 to 74 Years | 338 | 12.3% |
| 75 to 84 Years | 230 | 8.4% |
| 85 Years and Over | 30 | 1.1% |
| Total | 2,744 | 100.0% |
Housing Finances in Twin Rivers
Median Income by Occupancy in Twin Rivers
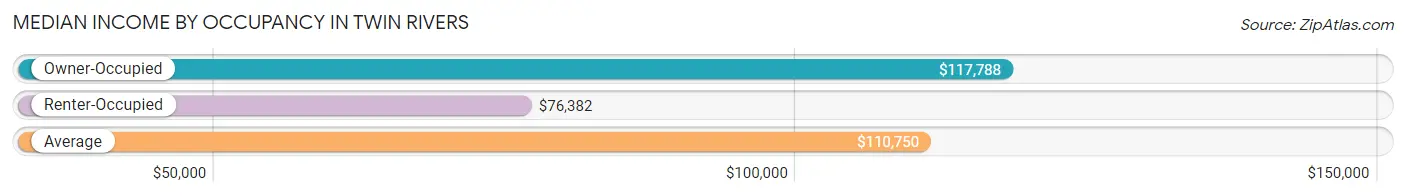
| Occupancy Type | # Households | Median Income |
| Owner-Occupied | 1,951 (71.1%) | $117,788 |
| Renter-Occupied | 793 (28.9%) | $76,382 |
| Average | 2,744 (100.0%) | $110,750 |
Occupancy by Householder Income Bracket in Twin Rivers
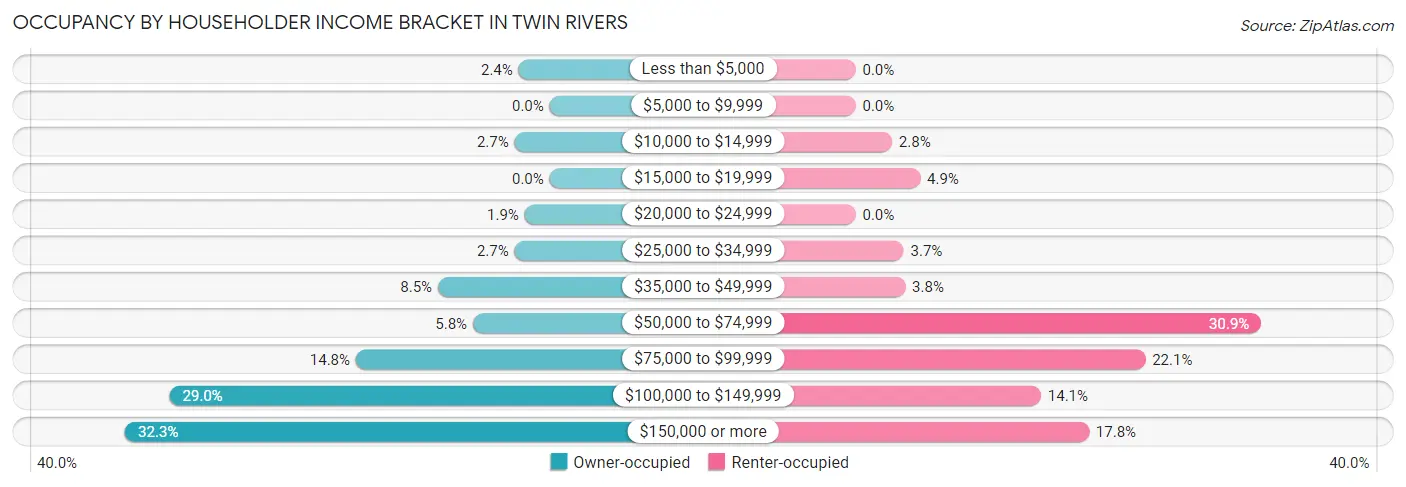
| Income Bracket | Owner-occupied | Renter-occupied |
| Less than $5,000 | 46 (2.4%) | 0 (0.0%) |
| $5,000 to $9,999 | 0 (0.0%) | 0 (0.0%) |
| $10,000 to $14,999 | 52 (2.7%) | 22 (2.8%) |
| $15,000 to $19,999 | 0 (0.0%) | 39 (4.9%) |
| $20,000 to $24,999 | 37 (1.9%) | 0 (0.0%) |
| $25,000 to $34,999 | 52 (2.7%) | 29 (3.7%) |
| $35,000 to $49,999 | 166 (8.5%) | 30 (3.8%) |
| $50,000 to $74,999 | 114 (5.8%) | 245 (30.9%) |
| $75,000 to $99,999 | 288 (14.8%) | 175 (22.1%) |
| $100,000 to $149,999 | 565 (29.0%) | 112 (14.1%) |
| $150,000 or more | 631 (32.3%) | 141 (17.8%) |
| Total | 1,951 (100.0%) | 793 (100.0%) |
Monthly Housing Cost Tiers in Twin Rivers
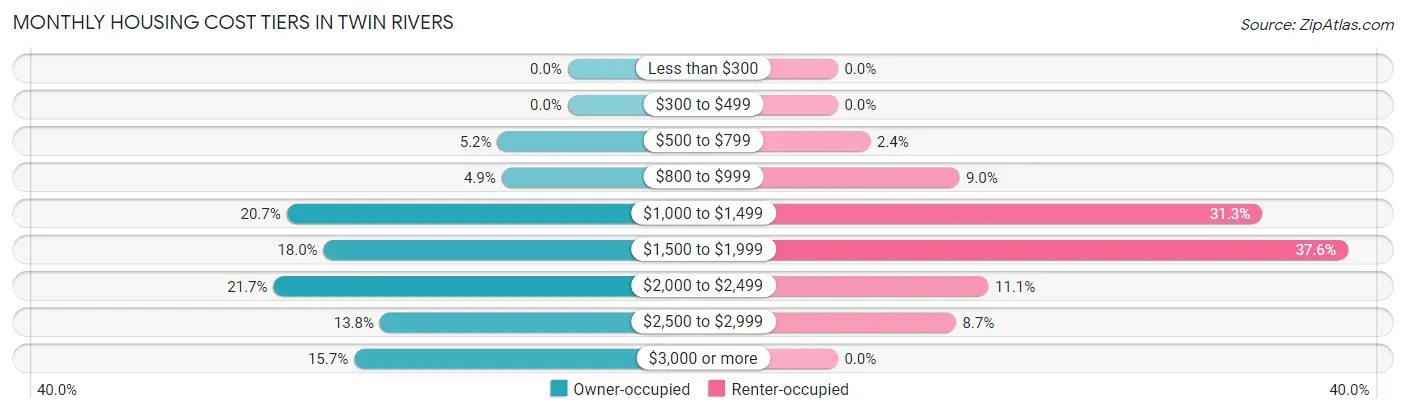
| Monthly Cost | Owner-occupied | Renter-occupied |
| Less than $300 | 0 (0.0%) | 0 (0.0%) |
| $300 to $499 | 0 (0.0%) | 0 (0.0%) |
| $500 to $799 | 101 (5.2%) | 19 (2.4%) |
| $800 to $999 | 95 (4.9%) | 71 (8.9%) |
| $1,000 to $1,499 | 404 (20.7%) | 248 (31.3%) |
| $1,500 to $1,999 | 351 (18.0%) | 298 (37.6%) |
| $2,000 to $2,499 | 423 (21.7%) | 88 (11.1%) |
| $2,500 to $2,999 | 270 (13.8%) | 69 (8.7%) |
| $3,000 or more | 307 (15.7%) | 0 (0.0%) |
| Total | 1,951 (100.0%) | 793 (100.0%) |
Physical Housing Characteristics in Twin Rivers
Housing Structures in Twin Rivers
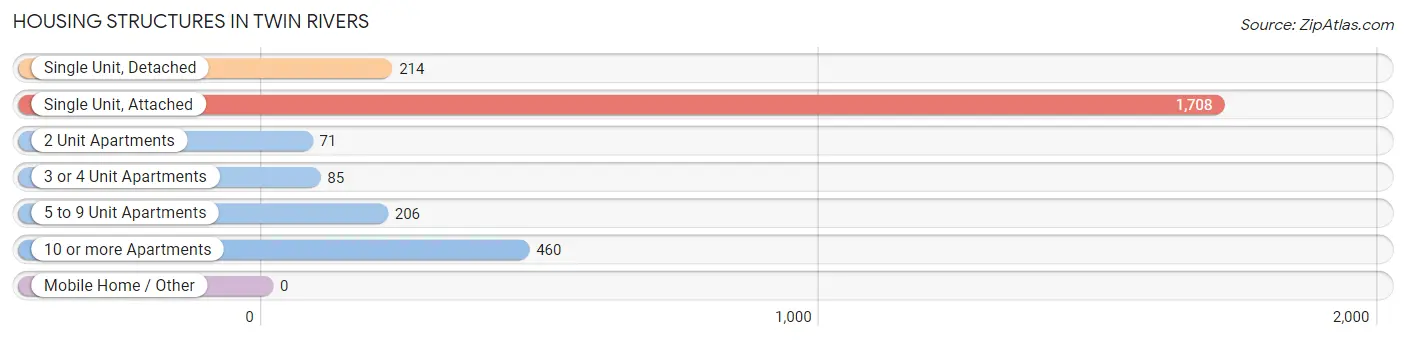
| Structure Type | # Housing Units | % Housing Units |
| Single Unit, Detached | 214 | 7.8% |
| Single Unit, Attached | 1,708 | 62.2% |
| 2 Unit Apartments | 71 | 2.6% |
| 3 or 4 Unit Apartments | 85 | 3.1% |
| 5 to 9 Unit Apartments | 206 | 7.5% |
| 10 or more Apartments | 460 | 16.8% |
| Mobile Home / Other | 0 | 0.0% |
| Total | 2,744 | 100.0% |
Housing Structures by Occupancy in Twin Rivers
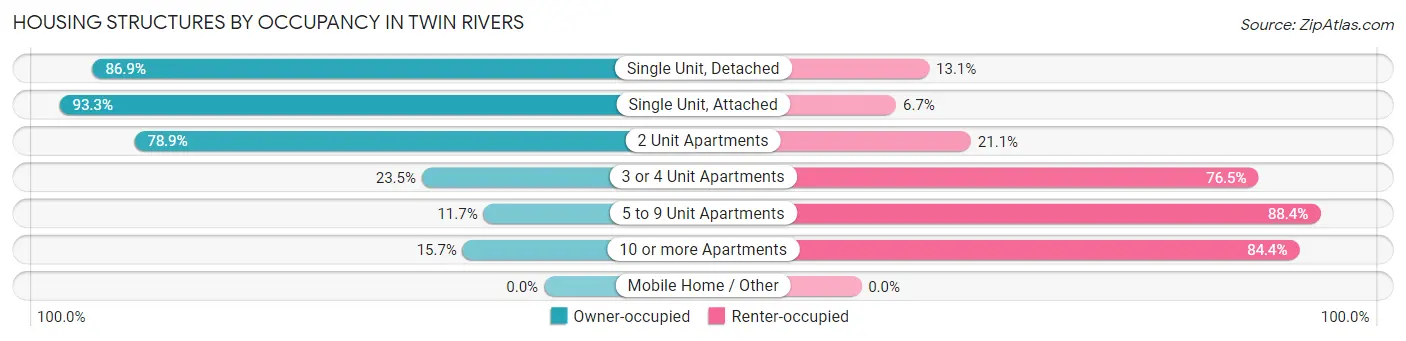
| Structure Type | Owner-occupied | Renter-occupied |
| Single Unit, Detached | 186 (86.9%) | 28 (13.1%) |
| Single Unit, Attached | 1,593 (93.3%) | 115 (6.7%) |
| 2 Unit Apartments | 56 (78.9%) | 15 (21.1%) |
| 3 or 4 Unit Apartments | 20 (23.5%) | 65 (76.5%) |
| 5 to 9 Unit Apartments | 24 (11.7%) | 182 (88.3%) |
| 10 or more Apartments | 72 (15.7%) | 388 (84.4%) |
| Mobile Home / Other | 0 (0.0%) | 0 (0.0%) |
| Total | 1,951 (71.1%) | 793 (28.9%) |
Housing Structures by Number of Rooms in Twin Rivers
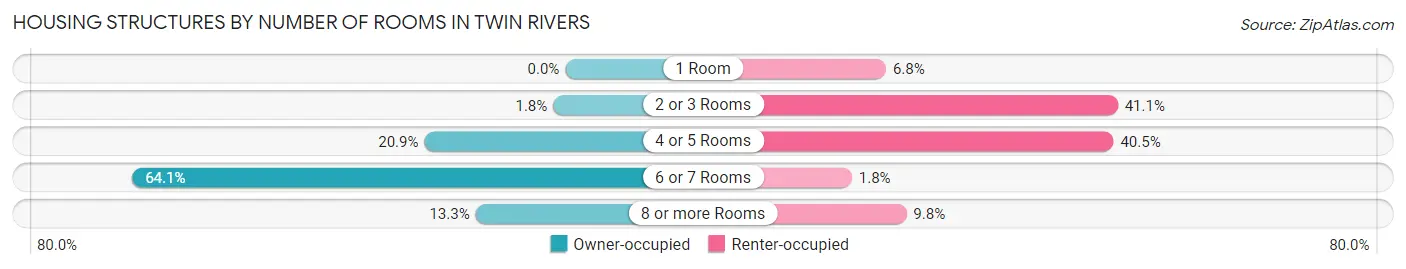
| Number of Rooms | Owner-occupied | Renter-occupied |
| 1 Room | 0 (0.0%) | 54 (6.8%) |
| 2 or 3 Rooms | 35 (1.8%) | 326 (41.1%) |
| 4 or 5 Rooms | 407 (20.9%) | 321 (40.5%) |
| 6 or 7 Rooms | 1,250 (64.1%) | 14 (1.8%) |
| 8 or more Rooms | 259 (13.3%) | 78 (9.8%) |
| Total | 1,951 (100.0%) | 793 (100.0%) |
Housing Structure by Heating Type in Twin Rivers
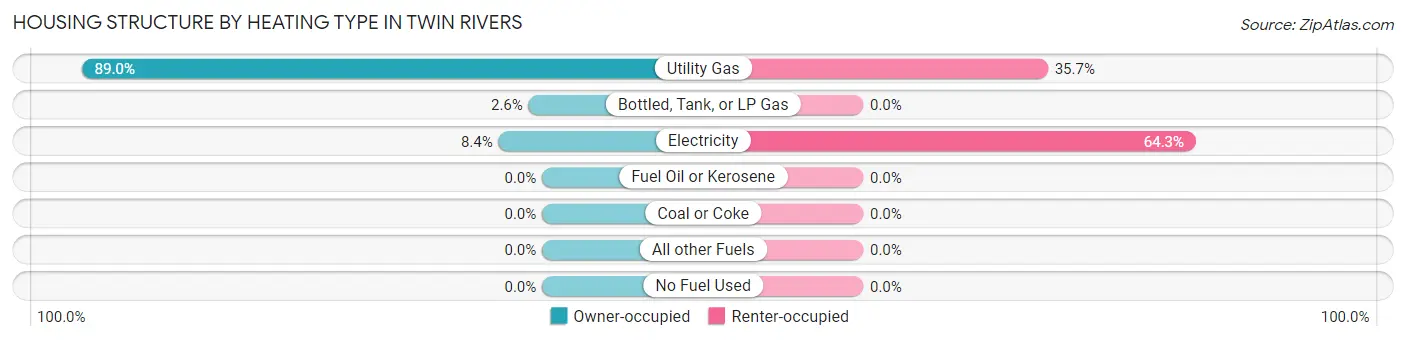
| Heating Type | Owner-occupied | Renter-occupied |
| Utility Gas | 1,736 (89.0%) | 283 (35.7%) |
| Bottled, Tank, or LP Gas | 51 (2.6%) | 0 (0.0%) |
| Electricity | 164 (8.4%) | 510 (64.3%) |
| Fuel Oil or Kerosene | 0 (0.0%) | 0 (0.0%) |
| Coal or Coke | 0 (0.0%) | 0 (0.0%) |
| All other Fuels | 0 (0.0%) | 0 (0.0%) |
| No Fuel Used | 0 (0.0%) | 0 (0.0%) |
| Total | 1,951 (100.0%) | 793 (100.0%) |
Household Vehicle Usage in Twin Rivers
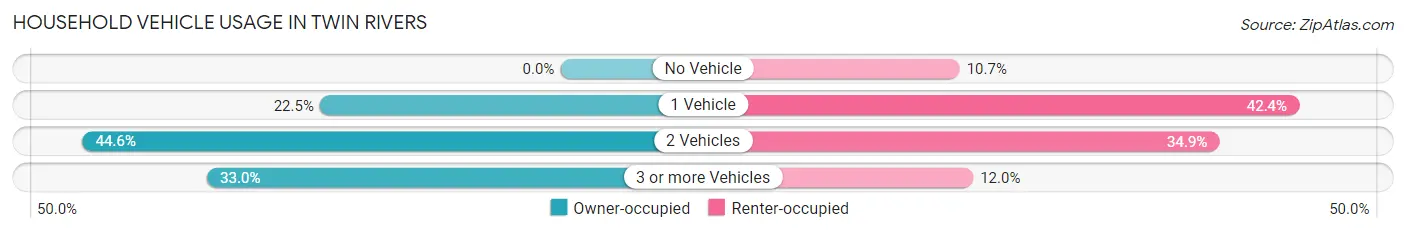
| Vehicles per Household | Owner-occupied | Renter-occupied |
| No Vehicle | 0 (0.0%) | 85 (10.7%) |
| 1 Vehicle | 438 (22.5%) | 336 (42.4%) |
| 2 Vehicles | 870 (44.6%) | 277 (34.9%) |
| 3 or more Vehicles | 643 (33.0%) | 95 (12.0%) |
| Total | 1,951 (100.0%) | 793 (100.0%) |
Real Estate & Mortgages in Twin Rivers
Real Estate and Mortgage Overview in Twin Rivers
| Characteristic | Without Mortgage | With Mortgage |
| Housing Units | 390 | 1,561 |
| Median Property Value | $267,300 | $259,100 |
| Median Household Income | $92,976 | $520 |
| Monthly Housing Costs | $1,020 | $307 |
| Real Estate Taxes | $5,908 | $0 |
Property Value by Mortgage Status in Twin Rivers
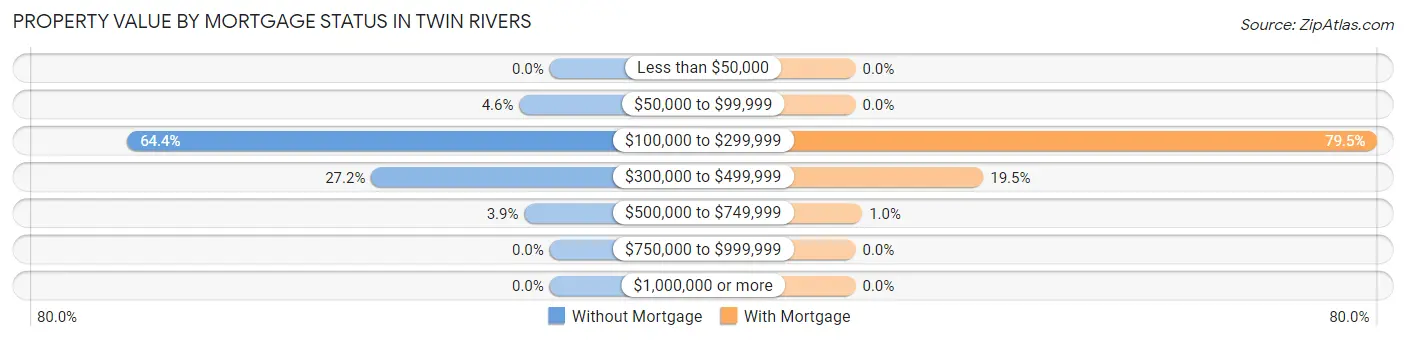
| Property Value | Without Mortgage | With Mortgage |
| Less than $50,000 | 0 (0.0%) | 0 (0.0%) |
| $50,000 to $99,999 | 18 (4.6%) | 0 (0.0%) |
| $100,000 to $299,999 | 251 (64.4%) | 1,241 (79.5%) |
| $300,000 to $499,999 | 106 (27.2%) | 304 (19.5%) |
| $500,000 to $749,999 | 15 (3.8%) | 16 (1.0%) |
| $750,000 to $999,999 | 0 (0.0%) | 0 (0.0%) |
| $1,000,000 or more | 0 (0.0%) | 0 (0.0%) |
| Total | 390 (100.0%) | 1,561 (100.0%) |
Household Income by Mortgage Status in Twin Rivers
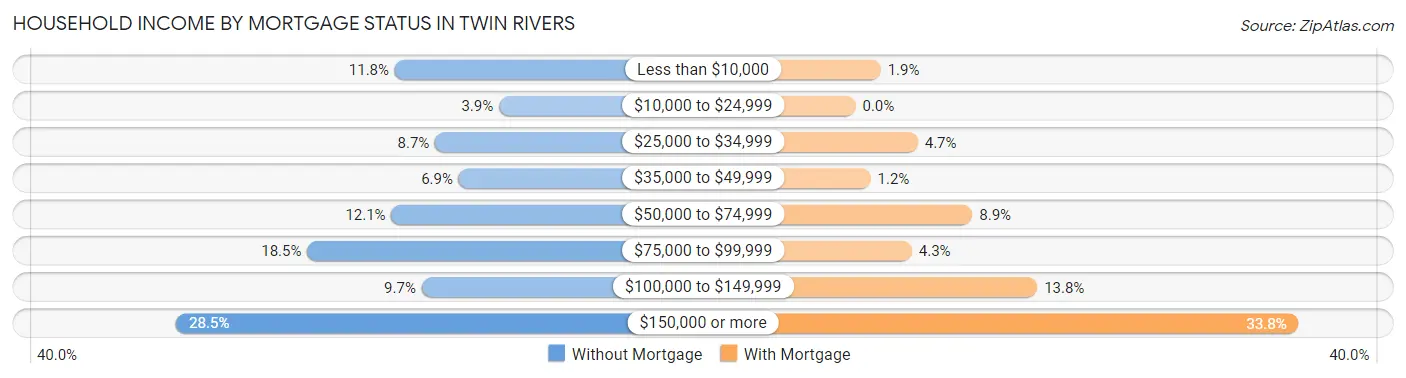
| Household Income | Without Mortgage | With Mortgage |
| Less than $10,000 | 46 (11.8%) | 30 (1.9%) |
| $10,000 to $24,999 | 15 (3.8%) | 0 (0.0%) |
| $25,000 to $34,999 | 34 (8.7%) | 74 (4.7%) |
| $35,000 to $49,999 | 27 (6.9%) | 18 (1.1%) |
| $50,000 to $74,999 | 47 (12.0%) | 139 (8.9%) |
| $75,000 to $99,999 | 72 (18.5%) | 67 (4.3%) |
| $100,000 to $149,999 | 38 (9.7%) | 216 (13.8%) |
| $150,000 or more | 111 (28.5%) | 527 (33.8%) |
| Total | 390 (100.0%) | 1,561 (100.0%) |
Property Value to Household Income Ratio in Twin Rivers
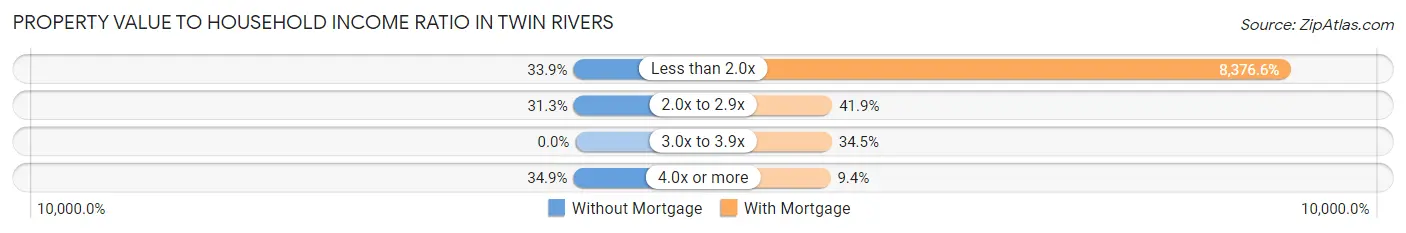
| Value-to-Income Ratio | Without Mortgage | With Mortgage |
| Less than 2.0x | 132 (33.9%) | 130,758 (8,376.6%) |
| 2.0x to 2.9x | 122 (31.3%) | 654 (41.9%) |
| 3.0x to 3.9x | 0 (0.0%) | 539 (34.5%) |
| 4.0x or more | 136 (34.9%) | 146 (9.3%) |
| Total | 390 (100.0%) | 1,561 (100.0%) |
Real Estate Taxes by Mortgage Status in Twin Rivers
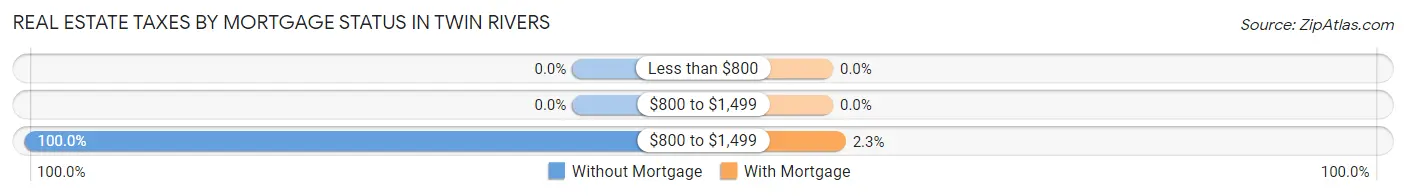
| Property Taxes | Without Mortgage | With Mortgage |
| Less than $800 | 0 (0.0%) | 0 (0.0%) |
| $800 to $1,499 | 0 (0.0%) | 0 (0.0%) |
| $800 to $1,499 | 390 (100.0%) | 36 (2.3%) |
| Total | 390 (100.0%) | 1,561 (100.0%) |
Health & Disability in Twin Rivers
Health Insurance Coverage by Age in Twin Rivers
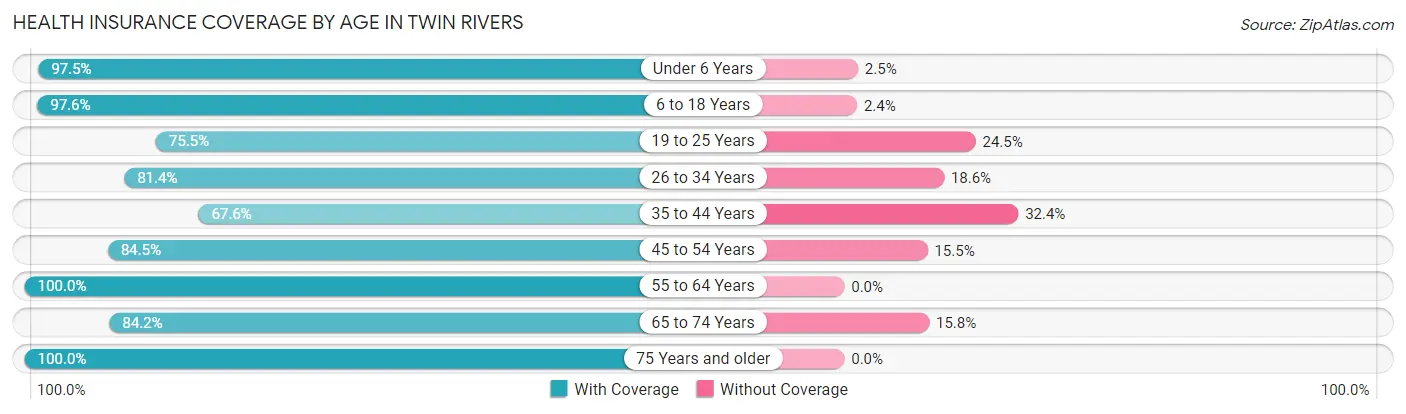
| Age Bracket | With Coverage | Without Coverage |
| Under 6 Years | 884 (97.5%) | 23 (2.5%) |
| 6 to 18 Years | 987 (97.6%) | 24 (2.4%) |
| 19 to 25 Years | 839 (75.5%) | 272 (24.5%) |
| 26 to 34 Years | 1,030 (81.4%) | 235 (18.6%) |
| 35 to 44 Years | 625 (67.6%) | 300 (32.4%) |
| 45 to 54 Years | 926 (84.5%) | 170 (15.5%) |
| 55 to 64 Years | 928 (100.0%) | 0 (0.0%) |
| 65 to 74 Years | 426 (84.2%) | 80 (15.8%) |
| 75 Years and older | 395 (100.0%) | 0 (0.0%) |
| Total | 7,040 (86.4%) | 1,104 (13.6%) |
Health Insurance Coverage by Citizenship Status in Twin Rivers
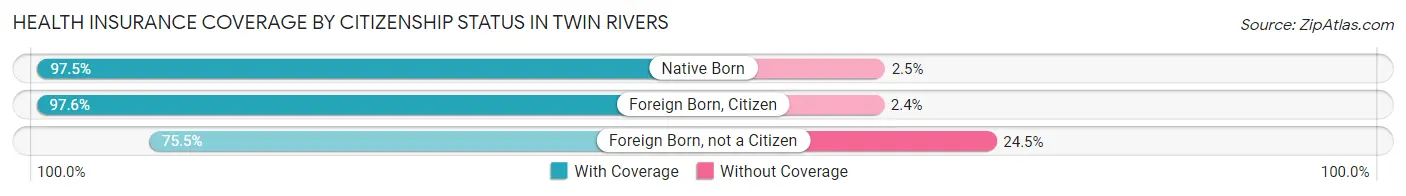
| Citizenship Status | With Coverage | Without Coverage |
| Native Born | 884 (97.5%) | 23 (2.5%) |
| Foreign Born, Citizen | 987 (97.6%) | 24 (2.4%) |
| Foreign Born, not a Citizen | 839 (75.5%) | 272 (24.5%) |
Health Insurance Coverage by Household Income in Twin Rivers
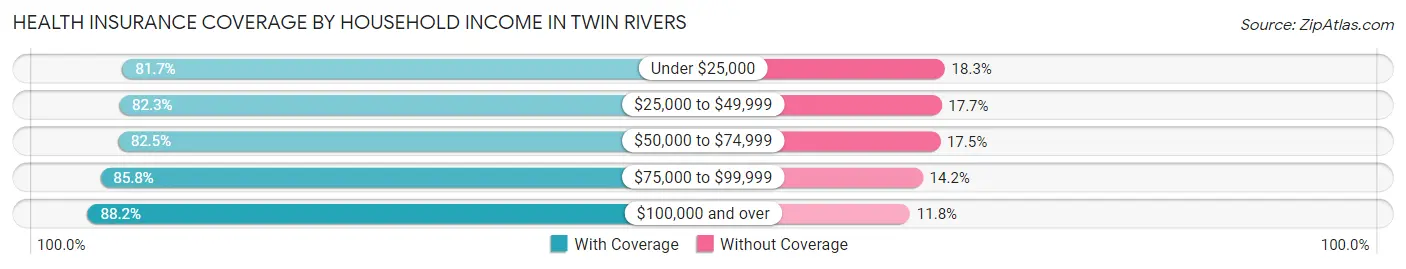
| Household Income | With Coverage | Without Coverage |
| Under $25,000 | 245 (81.7%) | 55 (18.3%) |
| $25,000 to $49,999 | 441 (82.3%) | 95 (17.7%) |
| $50,000 to $74,999 | 884 (82.5%) | 187 (17.5%) |
| $75,000 to $99,999 | 1,075 (85.8%) | 178 (14.2%) |
| $100,000 and over | 4,395 (88.2%) | 589 (11.8%) |
Public vs Private Health Insurance Coverage by Age in Twin Rivers
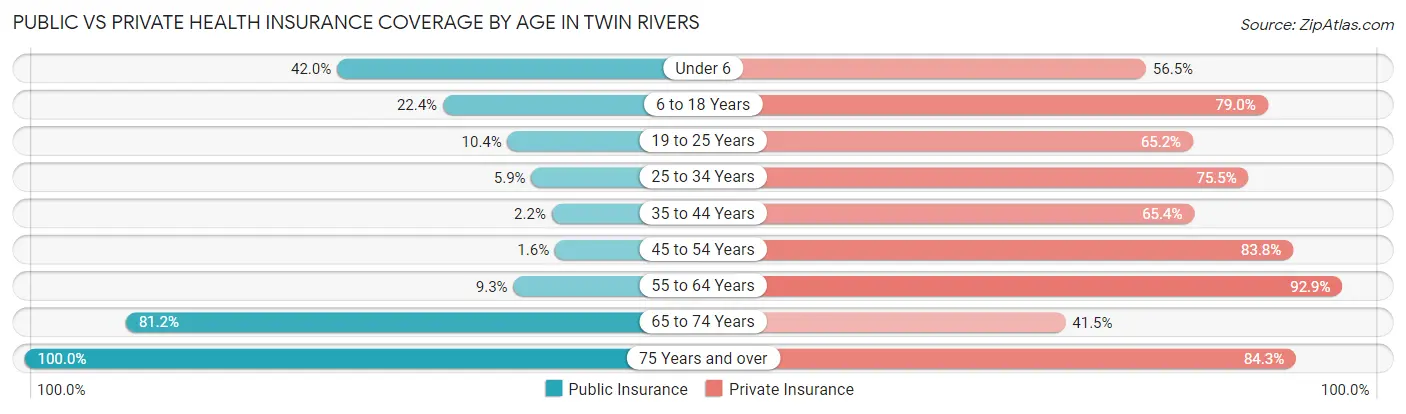
| Age Bracket | Public Insurance | Private Insurance |
| Under 6 | 381 (42.0%) | 512 (56.5%) |
| 6 to 18 Years | 226 (22.4%) | 799 (79.0%) |
| 19 to 25 Years | 115 (10.3%) | 724 (65.2%) |
| 25 to 34 Years | 75 (5.9%) | 955 (75.5%) |
| 35 to 44 Years | 20 (2.2%) | 605 (65.4%) |
| 45 to 54 Years | 17 (1.5%) | 918 (83.8%) |
| 55 to 64 Years | 86 (9.3%) | 862 (92.9%) |
| 65 to 74 Years | 411 (81.2%) | 210 (41.5%) |
| 75 Years and over | 395 (100.0%) | 333 (84.3%) |
| Total | 1,726 (21.2%) | 5,918 (72.7%) |
Disability Status by Sex by Age in Twin Rivers
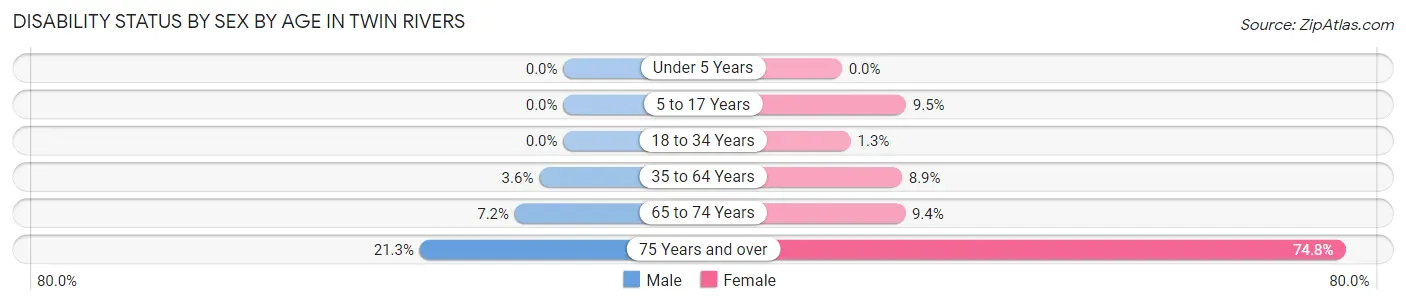
| Age Bracket | Male | Female |
| Under 5 Years | 0 (0.0%) | 0 (0.0%) |
| 5 to 17 Years | 0 (0.0%) | 49 (9.5%) |
| 18 to 34 Years | 0 (0.0%) | 15 (1.3%) |
| 35 to 64 Years | 61 (3.6%) | 111 (8.9%) |
| 65 to 74 Years | 18 (7.2%) | 24 (9.4%) |
| 75 Years and over | 42 (21.3%) | 148 (74.8%) |
Disability Class by Sex by Age in Twin Rivers
Disability Class: Hearing Difficulty
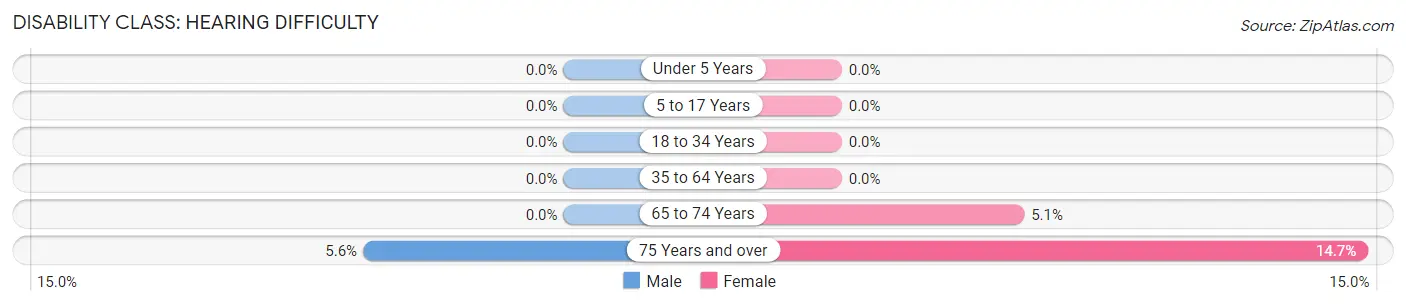
| Age Bracket | Male | Female |
| Under 5 Years | 0 (0.0%) | 0 (0.0%) |
| 5 to 17 Years | 0 (0.0%) | 0 (0.0%) |
| 18 to 34 Years | 0 (0.0%) | 0 (0.0%) |
| 35 to 64 Years | 0 (0.0%) | 0 (0.0%) |
| 65 to 74 Years | 0 (0.0%) | 13 (5.1%) |
| 75 Years and over | 11 (5.6%) | 29 (14.6%) |
Disability Class: Vision Difficulty
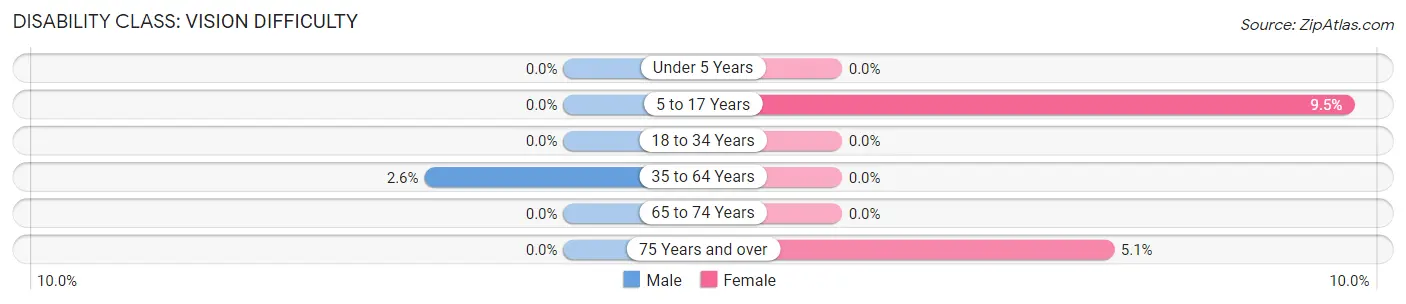
| Age Bracket | Male | Female |
| Under 5 Years | 0 (0.0%) | 0 (0.0%) |
| 5 to 17 Years | 0 (0.0%) | 49 (9.5%) |
| 18 to 34 Years | 0 (0.0%) | 0 (0.0%) |
| 35 to 64 Years | 44 (2.6%) | 0 (0.0%) |
| 65 to 74 Years | 0 (0.0%) | 0 (0.0%) |
| 75 Years and over | 0 (0.0%) | 10 (5.1%) |
Disability Class: Cognitive Difficulty
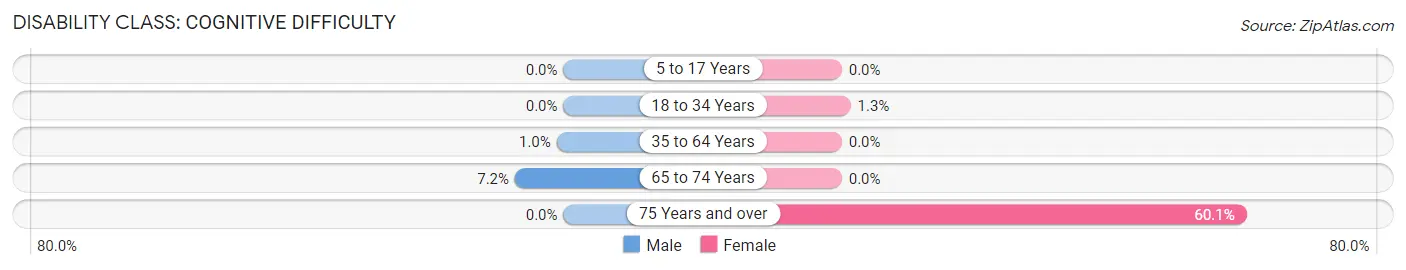
| Age Bracket | Male | Female |
| 5 to 17 Years | 0 (0.0%) | 0 (0.0%) |
| 18 to 34 Years | 0 (0.0%) | 15 (1.3%) |
| 35 to 64 Years | 17 (1.0%) | 0 (0.0%) |
| 65 to 74 Years | 18 (7.2%) | 0 (0.0%) |
| 75 Years and over | 0 (0.0%) | 119 (60.1%) |
Disability Class: Ambulatory Difficulty
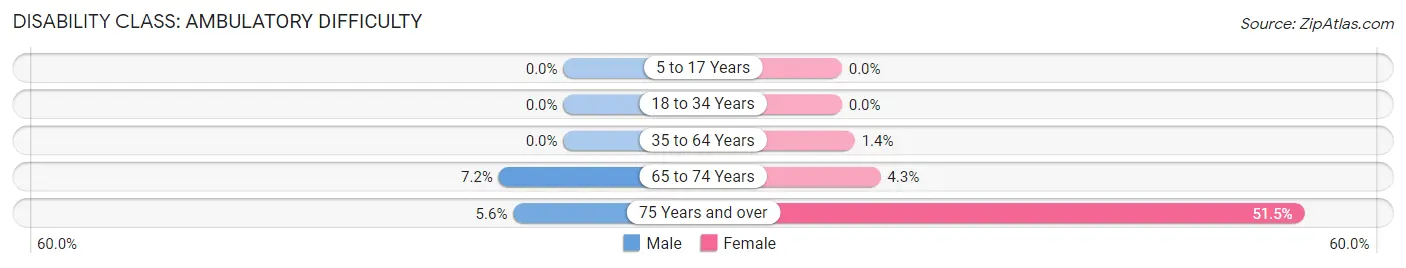
| Age Bracket | Male | Female |
| 5 to 17 Years | 0 (0.0%) | 0 (0.0%) |
| 18 to 34 Years | 0 (0.0%) | 0 (0.0%) |
| 35 to 64 Years | 0 (0.0%) | 18 (1.4%) |
| 65 to 74 Years | 18 (7.2%) | 11 (4.3%) |
| 75 Years and over | 11 (5.6%) | 102 (51.5%) |
Disability Class: Self-Care Difficulty
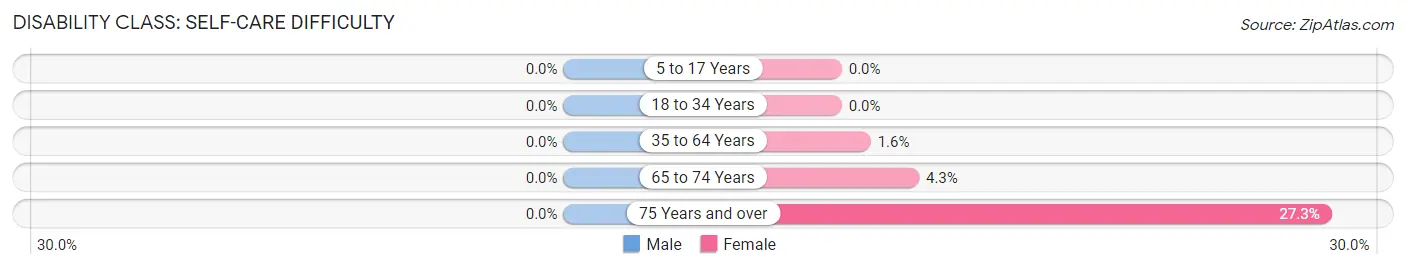
| Age Bracket | Male | Female |
| 5 to 17 Years | 0 (0.0%) | 0 (0.0%) |
| 18 to 34 Years | 0 (0.0%) | 0 (0.0%) |
| 35 to 64 Years | 0 (0.0%) | 20 (1.6%) |
| 65 to 74 Years | 0 (0.0%) | 11 (4.3%) |
| 75 Years and over | 0 (0.0%) | 54 (27.3%) |
Technology Access in Twin Rivers
Computing Device Access in Twin Rivers
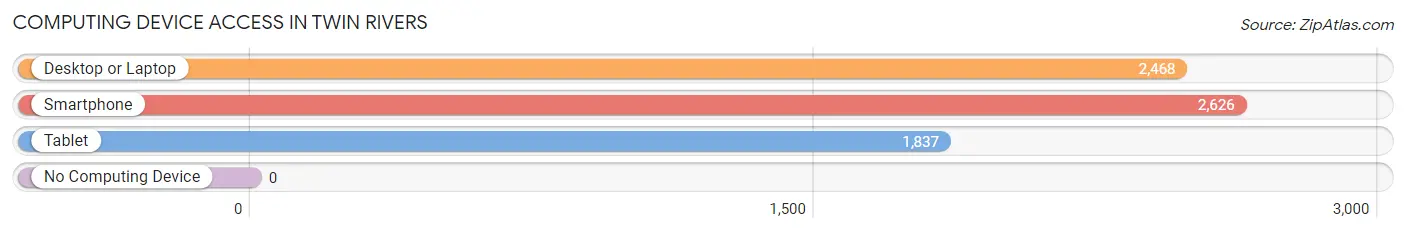
| Device Type | # Households | % Households |
| Desktop or Laptop | 2,468 | 89.9% |
| Smartphone | 2,626 | 95.7% |
| Tablet | 1,837 | 66.9% |
| No Computing Device | 0 | 0.0% |
| Total | 2,744 | 100.0% |
Internet Access in Twin Rivers
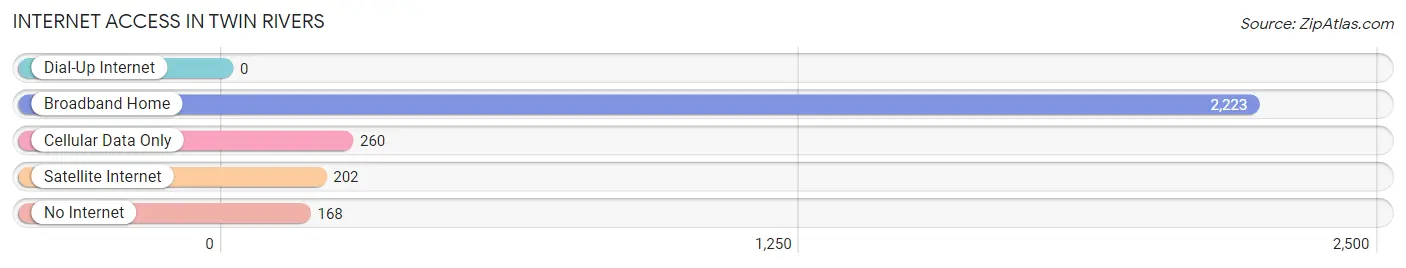
| Internet Type | # Households | % Households |
| Dial-Up Internet | 0 | 0.0% |
| Broadband Home | 2,223 | 81.0% |
| Cellular Data Only | 260 | 9.5% |
| Satellite Internet | 202 | 7.4% |
| No Internet | 168 | 6.1% |
| Total | 2,744 | 100.0% |
Twin Rivers Summary
Twin Rivers is a small borough located in Monmouth County, New Jersey. It is situated on the banks of the Navesink and Shrewsbury Rivers, which give the borough its name. The borough was incorporated in 1925 and has a population of approximately 5,000 people.
Geography
Twin Rivers is located in the northern part of Monmouth County, New Jersey. It is bordered by the boroughs of Red Bank, Shrewsbury, and Middletown. The borough is situated on the banks of the Navesink and Shrewsbury Rivers, which give the borough its name. The borough is approximately 2.5 square miles in size and is located in the Raritan Valley region of New Jersey. The terrain is mostly flat, with some rolling hills in the northern part of the borough.
Climate
Twin Rivers has a humid subtropical climate, with hot, humid summers and cold, wet winters. The average temperature in the summer is around 80 degrees Fahrenheit, while the average temperature in the winter is around 40 degrees Fahrenheit. The average annual precipitation is around 45 inches.
Demographics
As of the 2010 census, the population of Twin Rivers was 5,039. The racial makeup of the borough was 79.3% White, 11.2% African American, 0.3% Native American, 4.2% Asian, and 4.9% from other races. Hispanic or Latino of any race were 8.7% of the population.
The median household income in Twin Rivers was $68,958, and the median family income was $77,917. The per capita income was $30,945. About 4.3% of families and 5.7% of the population were below the poverty line, including 6.7% of those under age 18 and 5.2% of those age 65 or over.
Economy
Twin Rivers is primarily a residential community, with most of its residents commuting to nearby cities for work. The borough does have some small businesses, including restaurants, retail stores, and professional services. The largest employer in the borough is the Twin Rivers Board of Education, which employs over 500 people.
The borough also has a number of recreational facilities, including a public golf course, a public pool, and several parks. The borough also has a number of cultural attractions, including the Twin Rivers Historical Society and the Twin Rivers Arts Council.
Conclusion
Twin Rivers is a small borough located in Monmouth County, New Jersey. It is situated on the banks of the Navesink and Shrewsbury Rivers, which give the borough its name. The borough was incorporated in 1925 and has a population of approximately 5,000 people. Twin Rivers has a humid subtropical climate, with hot, humid summers and cold, wet winters. The racial makeup of the borough is 79.3% White, 11.2% African American, 0.3% Native American, 4.2% Asian, and 4.9% from other races. The median household income in Twin Rivers was $68,958, and the median family income was $77,917. The borough is primarily a residential community, with most of its residents commuting to nearby cities for work. The largest employer in the borough is the Twin Rivers Board of Education, which employs over 500 people. Twin Rivers also has a number of recreational facilities, including a public golf course, a public pool, and several parks. The borough also has a number of cultural attractions, including the Twin Rivers Historical Society and the Twin Rivers Arts Council.
Common Questions
What is Per Capita Income in Twin Rivers?
Per Capita income in Twin Rivers is $39,227.
What is the Median Family Income in Twin Rivers?
Median Family Income in Twin Rivers is $130,000.
What is the Median Household income in Twin Rivers?
Median Household Income in Twin Rivers is $110,750.
What is Income or Wage Gap in Twin Rivers?
Income or Wage Gap in Twin Rivers is 25.8%.
Women in Twin Rivers earn 74.2 cents for every dollar earned by a man.
What is Inequality or Gini Index in Twin Rivers?
Inequality or Gini Index in Twin Rivers is 0.34.
What is the Total Population of Twin Rivers?
Total Population of Twin Rivers is 8,144.
What is the Total Male Population of Twin Rivers?
Total Male Population of Twin Rivers is 4,341.
What is the Total Female Population of Twin Rivers?
Total Female Population of Twin Rivers is 3,803.
What is the Ratio of Males per 100 Females in Twin Rivers?
There are 114.15 Males per 100 Females in Twin Rivers.
What is the Ratio of Females per 100 Males in Twin Rivers?
There are 87.61 Females per 100 Males in Twin Rivers.
What is the Median Population Age in Twin Rivers?
Median Population Age in Twin Rivers is 32.4 Years.
What is the Average Family Size in Twin Rivers
Average Family Size in Twin Rivers is 3.4 People.
What is the Average Household Size in Twin Rivers
Average Household Size in Twin Rivers is 3.0 People.
How Large is the Labor Force in Twin Rivers?
There are 4,976 People in the Labor Forcein in Twin Rivers.
What is the Percentage of People in the Labor Force in Twin Rivers?
77.2% of People are in the Labor Force in Twin Rivers.
What is the Unemployment Rate in Twin Rivers?
Unemployment Rate in Twin Rivers is 1.6%.