Fords, NJ Map & Demographics
Fords Map
Fords Overview
$45,315
PER CAPITA INCOME
$127,528
AVG FAMILY INCOME
$110,643
AVG HOUSEHOLD INCOME
27.3%
WAGE / INCOME GAP [ % ]
72.7¢/ $1
WAGE / INCOME GAP [ $ ]
0.40
INEQUALITY / GINI INDEX
12,663
TOTAL POPULATION
6,576
MALE POPULATION
6,087
FEMALE POPULATION
108.03
MALES / 100 FEMALES
92.56
FEMALES / 100 MALES
39.3
MEDIAN AGE
3.6
AVG FAMILY SIZE
2.9
AVG HOUSEHOLD SIZE
6,830
LABOR FORCE [ PEOPLE ]
65.1%
PERCENT IN LABOR FORCE
5.0%
UNEMPLOYMENT RATE
Fords Zip Codes
Income in Fords
Income Overview in Fords
Per Capita Income in Fords is $45,315, while median incomes of families and households are $127,528 and $110,643 respectively.
| Characteristic | Number | Measure |
| Per Capita Income | 12,663 | $45,315 |
| Median Family Income | 2,985 | $127,528 |
| Mean Family Income | 2,985 | $144,652 |
| Median Household Income | 4,438 | $110,643 |
| Mean Household Income | 4,438 | $127,645 |
| Income Deficit | 2,985 | $0 |
| Wage / Income Gap (%) | 12,663 | 27.34% |
| Wage / Income Gap ($) | 12,663 | 72.66¢ per $1 |
| Gini / Inequality Index | 12,663 | 0.40 |
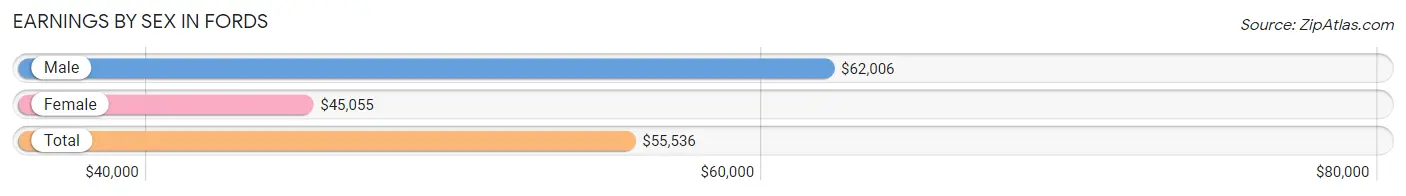
Earnings by Sex in Fords
Average Earnings in Fords are $55,536, $62,006 for men and $45,055 for women, a difference of 27.3%.
| Sex | Number | Average Earnings |
| Male | 3,947 (54.7%) | $62,006 |
| Female | 3,272 (45.3%) | $45,055 |
| Total | 7,219 (100.0%) | $55,536 |
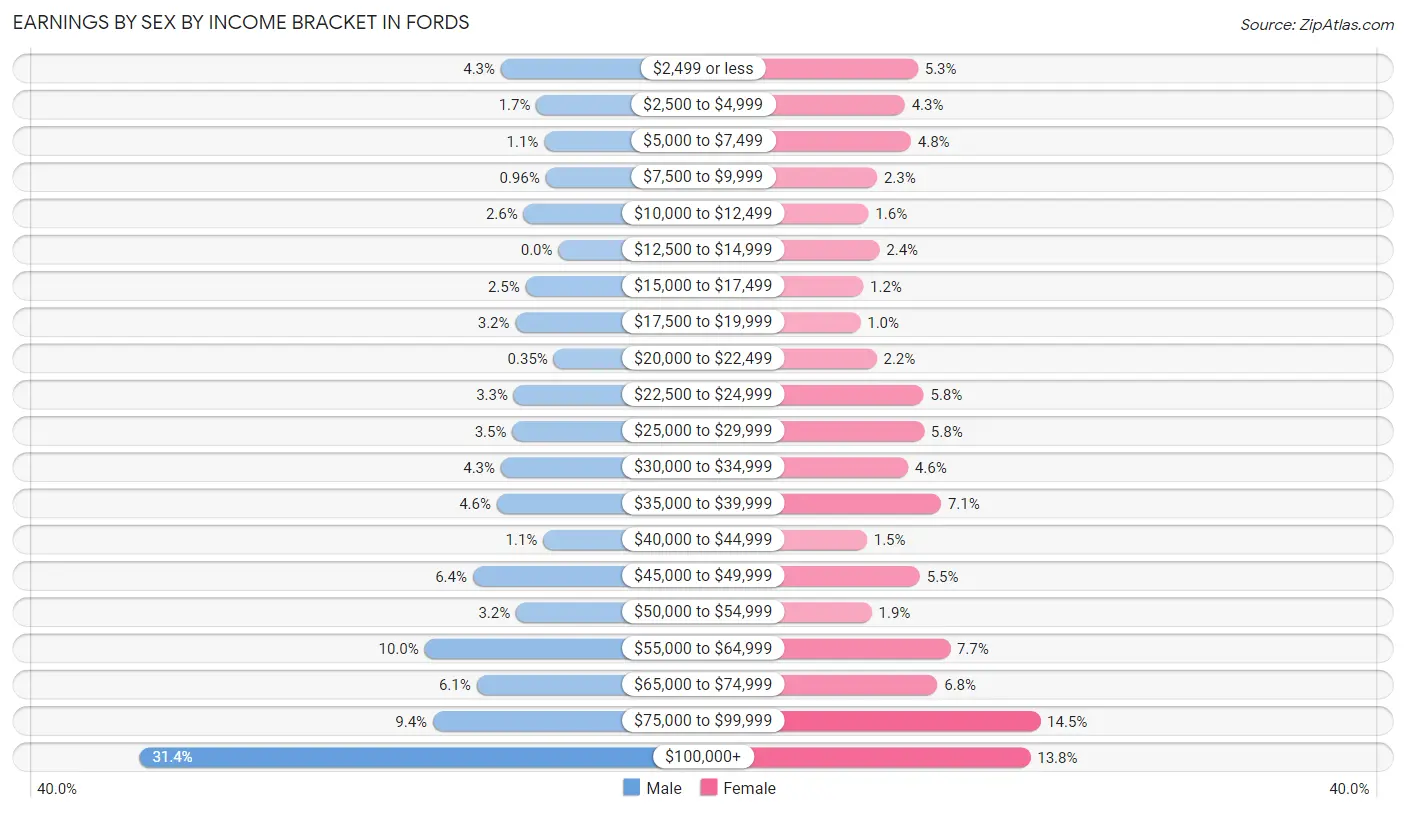
Earnings by Sex by Income Bracket in Fords
The most common earnings brackets in Fords are $100,000+ for men (1,239 | 31.4%) and $75,000 to $99,999 for women (474 | 14.5%).
| Income | Male | Female |
| $2,499 or less | 170 (4.3%) | 174 (5.3%) |
| $2,500 to $4,999 | 65 (1.7%) | 142 (4.3%) |
| $5,000 to $7,499 | 42 (1.1%) | 157 (4.8%) |
| $7,500 to $9,999 | 38 (1.0%) | 74 (2.3%) |
| $10,000 to $12,499 | 103 (2.6%) | 53 (1.6%) |
| $12,500 to $14,999 | 0 (0.0%) | 80 (2.4%) |
| $15,000 to $17,499 | 97 (2.5%) | 40 (1.2%) |
| $17,500 to $19,999 | 127 (3.2%) | 33 (1.0%) |
| $20,000 to $22,499 | 14 (0.4%) | 73 (2.2%) |
| $22,500 to $24,999 | 132 (3.3%) | 188 (5.8%) |
| $25,000 to $29,999 | 136 (3.5%) | 189 (5.8%) |
| $30,000 to $34,999 | 170 (4.3%) | 150 (4.6%) |
| $35,000 to $39,999 | 182 (4.6%) | 231 (7.1%) |
| $40,000 to $44,999 | 45 (1.1%) | 49 (1.5%) |
| $45,000 to $49,999 | 253 (6.4%) | 179 (5.5%) |
| $50,000 to $54,999 | 125 (3.2%) | 61 (1.9%) |
| $55,000 to $64,999 | 396 (10.0%) | 253 (7.7%) |
| $65,000 to $74,999 | 242 (6.1%) | 222 (6.8%) |
| $75,000 to $99,999 | 371 (9.4%) | 474 (14.5%) |
| $100,000+ | 1,239 (31.4%) | 450 (13.8%) |
| Total | 3,947 (100.0%) | 3,272 (100.0%) |
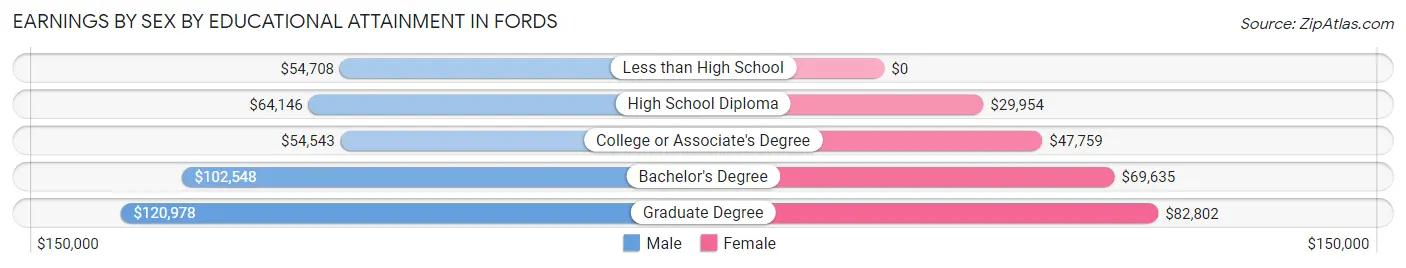
Earnings by Sex by Educational Attainment in Fords
Average earnings in Fords are $68,324 for men and $48,482 for women, a difference of 29.0%. Men with an educational attainment of graduate degree enjoy the highest average annual earnings of $120,978, while those with college or associate's degree education earn the least with $54,543. Women with an educational attainment of graduate degree earn the most with the average annual earnings of $82,802, while those with high school diploma education have the smallest earnings of $29,954.
| Educational Attainment | Male Income | Female Income |
| Less than High School | $54,708 | $0 |
| High School Diploma | $64,146 | $29,954 |
| College or Associate's Degree | $54,543 | $47,759 |
| Bachelor's Degree | $102,548 | $69,635 |
| Graduate Degree | $120,978 | $82,802 |
| Total | $68,324 | $48,482 |
Family Income in Fords
Family Income Brackets in Fords
According to the Fords family income data, there are 767 families falling into the $100,000 to $149,999 income range, which is the most common income bracket and makes up 25.7% of all families.
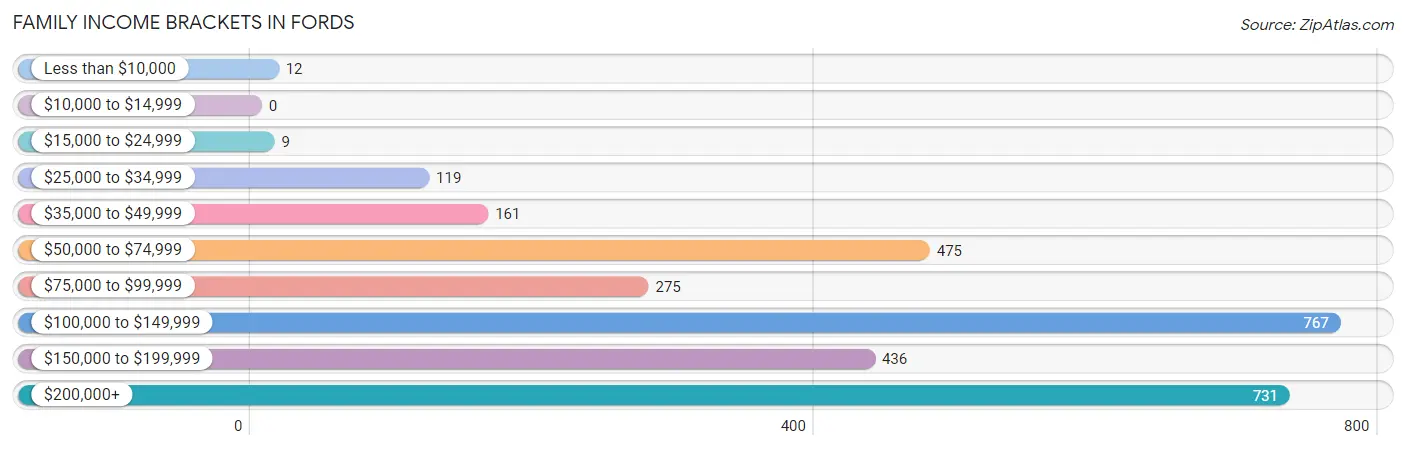
| Income Bracket | # Families | % Families |
| Less than $10,000 | 12 | 0.4% |
| $10,000 to $14,999 | 0 | 0.0% |
| $15,000 to $24,999 | 9 | 0.3% |
| $25,000 to $34,999 | 119 | 4.0% |
| $35,000 to $49,999 | 161 | 5.4% |
| $50,000 to $74,999 | 475 | 15.9% |
| $75,000 to $99,999 | 275 | 9.2% |
| $100,000 to $149,999 | 767 | 25.7% |
| $150,000 to $199,999 | 436 | 14.6% |
| $200,000+ | 731 | 24.5% |
Family Income by Famaliy Size in Fords
7+ person families (72 | 2.4%) account for the highest median family income in Fords with $215,484 per family, while 2-person families (884 | 29.6%) have the highest median income of $50,000 per family member.
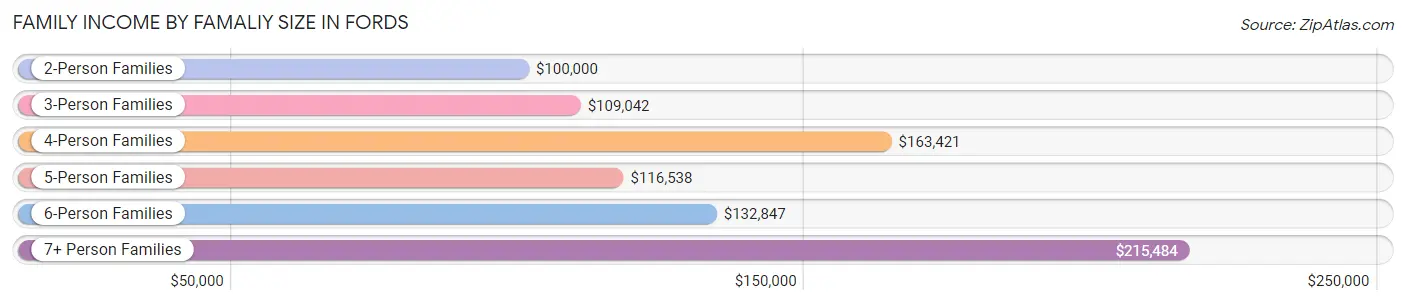
| Income Bracket | # Families | Median Income |
| 2-Person Families | 884 (29.6%) | $100,000 |
| 3-Person Families | 756 (25.3%) | $109,042 |
| 4-Person Families | 688 (23.1%) | $163,421 |
| 5-Person Families | 354 (11.9%) | $116,538 |
| 6-Person Families | 231 (7.7%) | $132,847 |
| 7+ Person Families | 72 (2.4%) | $215,484 |
| Total | 2,985 (100.0%) | $127,528 |
Family Income by Number of Earners in Fords
The median family income in Fords is $127,528, with families comprising 3+ earners (648) having the highest median family income of $188,056, while families with no earners (153) have the lowest median family income of $51,875, accounting for 21.7% and 5.1% of families, respectively.
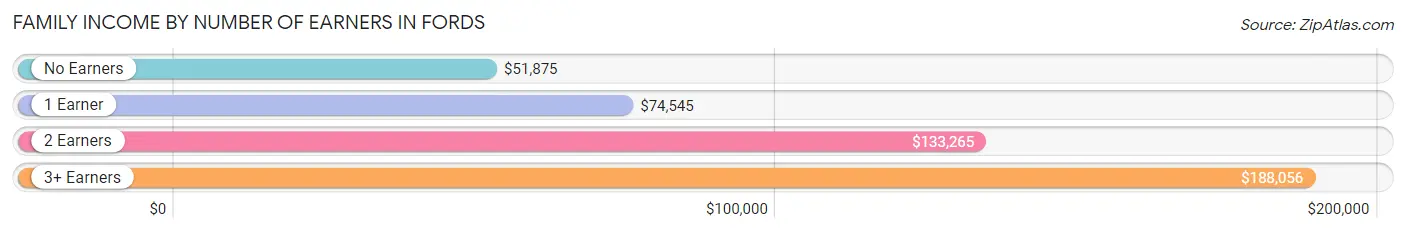
| Number of Earners | # Families | Median Income |
| No Earners | 153 (5.1%) | $51,875 |
| 1 Earner | 812 (27.2%) | $74,545 |
| 2 Earners | 1,372 (46.0%) | $133,265 |
| 3+ Earners | 648 (21.7%) | $188,056 |
| Total | 2,985 (100.0%) | $127,528 |
Household Income in Fords
Household Income Brackets in Fords
With 1,083 households falling in the category, the $100,000 to $149,999 income range is the most frequent in Fords, accounting for 24.4% of all households. In contrast, only 53 households (1.2%) fall into the $10,000 to $14,999 income bracket, making it the least populous group.
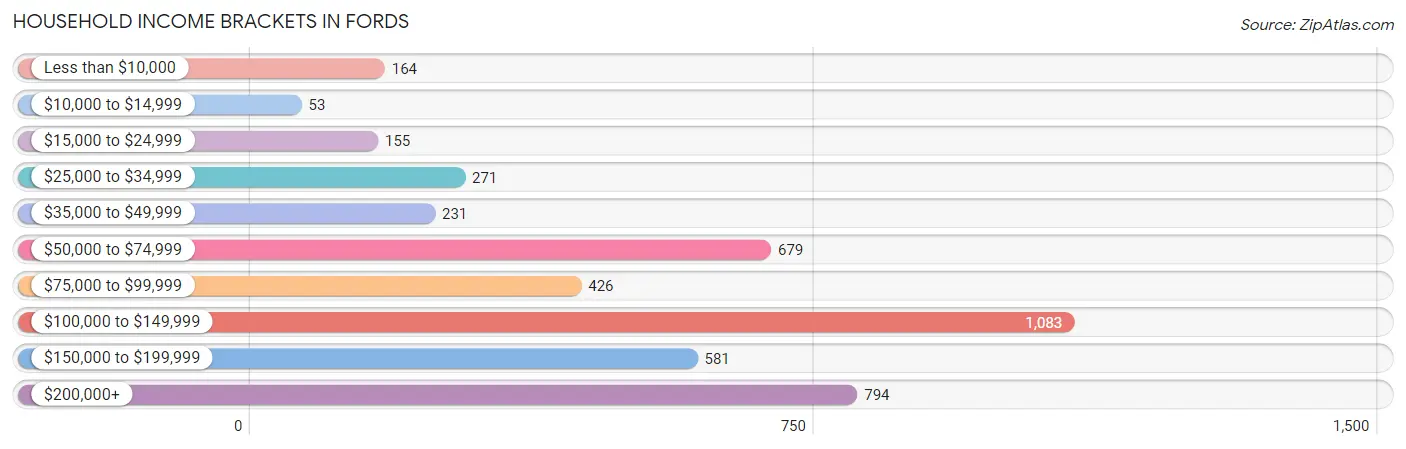
| Income Bracket | # Households | % Households |
| Less than $10,000 | 164 | 3.7% |
| $10,000 to $14,999 | 53 | 1.2% |
| $15,000 to $24,999 | 155 | 3.5% |
| $25,000 to $34,999 | 271 | 6.1% |
| $35,000 to $49,999 | 231 | 5.2% |
| $50,000 to $74,999 | 679 | 15.3% |
| $75,000 to $99,999 | 426 | 9.6% |
| $100,000 to $149,999 | 1,083 | 24.4% |
| $150,000 to $199,999 | 581 | 13.1% |
| $200,000+ | 794 | 17.9% |
Household Income by Householder Age in Fords
The median household income in Fords is $110,643, with the highest median household income of $121,485 found in the 45 to 64 years age bracket for the primary householder. A total of 1,867 households (42.1%) fall into this category. Meanwhile, the 15 to 24 years age bracket for the primary householder has the lowest median household income of $0, with 18 households (0.4%) in this group.
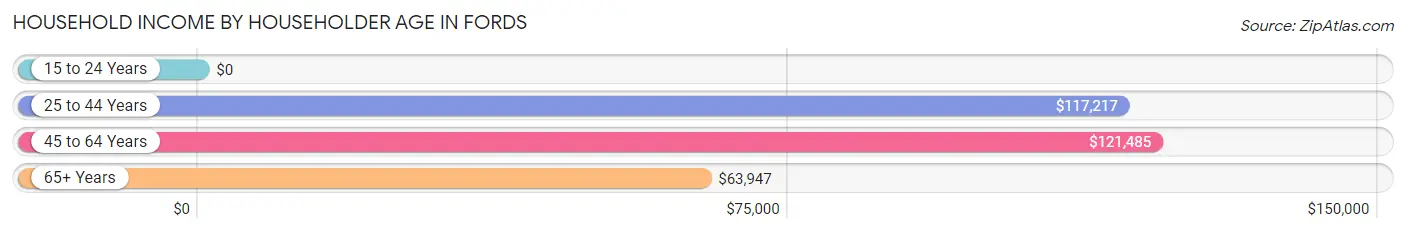
| Income Bracket | # Households | Median Income |
| 15 to 24 Years | 18 (0.4%) | $0 |
| 25 to 44 Years | 1,613 (36.3%) | $117,217 |
| 45 to 64 Years | 1,867 (42.1%) | $121,485 |
| 65+ Years | 940 (21.2%) | $63,947 |
| Total | 4,438 (100.0%) | $110,643 |
Poverty in Fords
Income Below Poverty by Sex and Age in Fords
With 2.6% poverty level for males and 5.1% for females among the residents of Fords, 6 to 11 year old males and 12 to 14 year old females are the most vulnerable to poverty, with 32 males (8.9%) and 14 females (25.9%) in their respective age groups living below the poverty level.
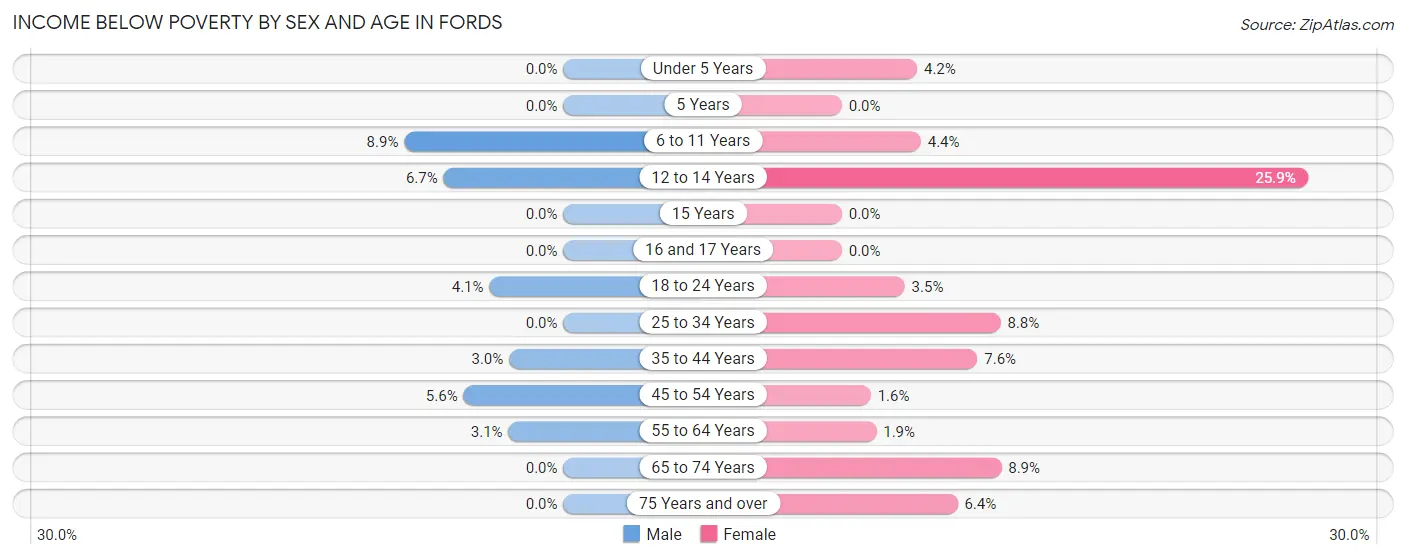
| Age Bracket | Male | Female |
| Under 5 Years | 0 (0.0%) | 19 (4.2%) |
| 5 Years | 0 (0.0%) | 0 (0.0%) |
| 6 to 11 Years | 32 (8.9%) | 15 (4.4%) |
| 12 to 14 Years | 13 (6.7%) | 14 (25.9%) |
| 15 Years | 0 (0.0%) | 0 (0.0%) |
| 16 and 17 Years | 0 (0.0%) | 0 (0.0%) |
| 18 to 24 Years | 27 (4.1%) | 14 (3.5%) |
| 25 to 34 Years | 0 (0.0%) | 79 (8.8%) |
| 35 to 44 Years | 30 (3.0%) | 67 (7.5%) |
| 45 to 54 Years | 46 (5.6%) | 12 (1.6%) |
| 55 to 64 Years | 25 (3.1%) | 21 (1.9%) |
| 65 to 74 Years | 0 (0.0%) | 45 (8.9%) |
| 75 Years and over | 0 (0.0%) | 25 (6.4%) |
| Total | 173 (2.6%) | 311 (5.1%) |
Income Above Poverty by Sex and Age in Fords
According to the poverty statistics in Fords, males aged under 5 years and females aged 5 years are the age groups that are most secure financially, with 100.0% of males and 100.0% of females in these age groups living above the poverty line.
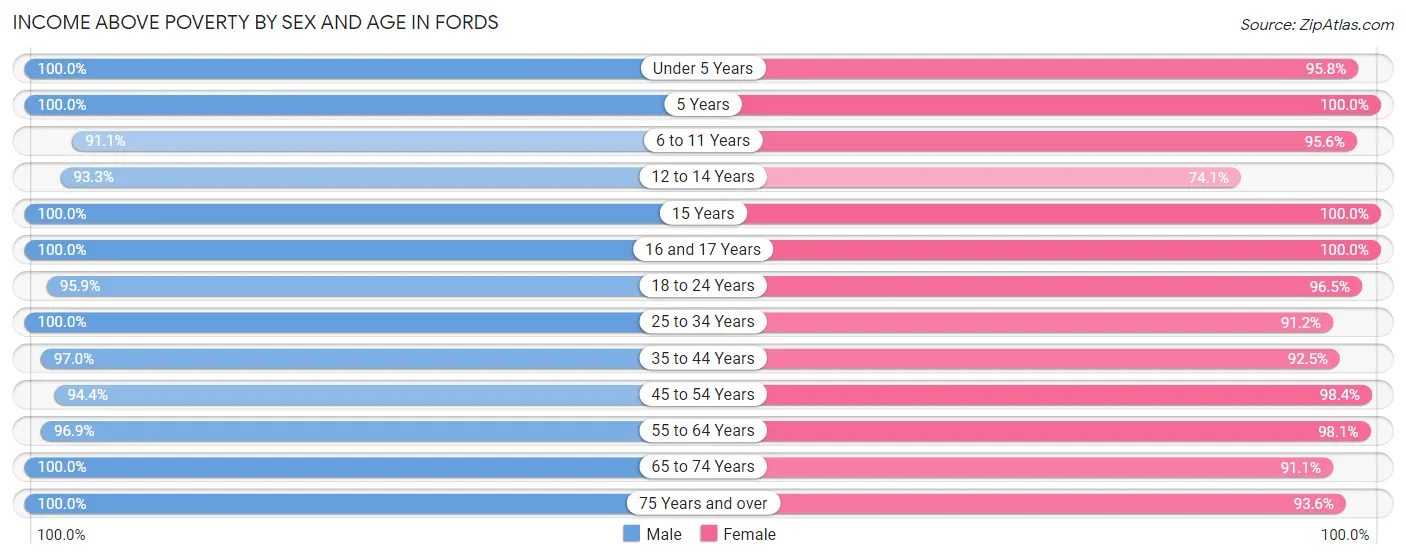
| Age Bracket | Male | Female |
| Under 5 Years | 480 (100.0%) | 434 (95.8%) |
| 5 Years | 66 (100.0%) | 99 (100.0%) |
| 6 to 11 Years | 329 (91.1%) | 326 (95.6%) |
| 12 to 14 Years | 182 (93.3%) | 40 (74.1%) |
| 15 Years | 51 (100.0%) | 71 (100.0%) |
| 16 and 17 Years | 398 (100.0%) | 158 (100.0%) |
| 18 to 24 Years | 629 (95.9%) | 386 (96.5%) |
| 25 to 34 Years | 970 (100.0%) | 815 (91.2%) |
| 35 to 44 Years | 963 (97.0%) | 820 (92.4%) |
| 45 to 54 Years | 782 (94.4%) | 732 (98.4%) |
| 55 to 64 Years | 793 (96.9%) | 1,070 (98.1%) |
| 65 to 74 Years | 496 (100.0%) | 462 (91.1%) |
| 75 Years and over | 264 (100.0%) | 363 (93.6%) |
| Total | 6,403 (97.4%) | 5,776 (94.9%) |
Income Below Poverty Among Married-Couple Families in Fords
The poverty statistics for married-couple families in Fords show that 1.3% or 30 of the total 2,319 families live below the poverty line. Families with 3 or 4 children have the highest poverty rate of 15.8%, comprising of 30 families. On the other hand, families with no children have the lowest poverty rate of 0.0%, which includes 0 families.
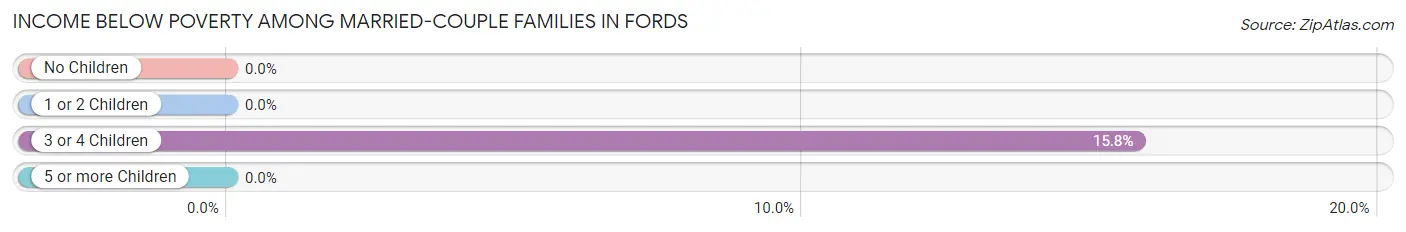
| Children | Above Poverty | Below Poverty |
| No Children | 1,163 (100.0%) | 0 (0.0%) |
| 1 or 2 Children | 966 (100.0%) | 0 (0.0%) |
| 3 or 4 Children | 160 (84.2%) | 30 (15.8%) |
| 5 or more Children | 0 (0.0%) | 0 (0.0%) |
| Total | 2,289 (98.7%) | 30 (1.3%) |
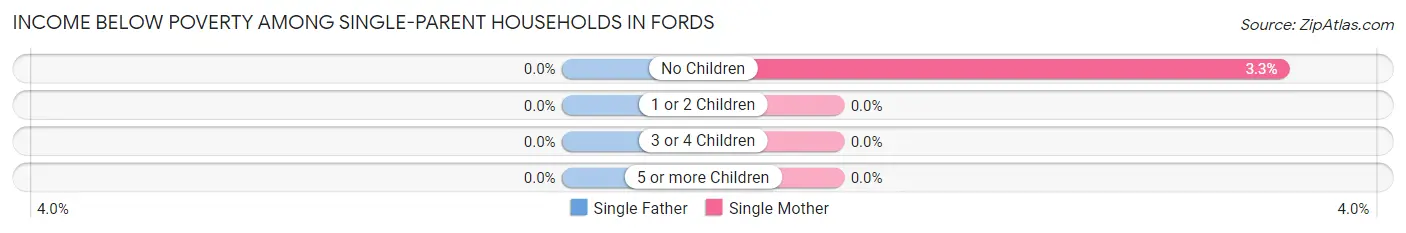
Income Below Poverty Among Single-Parent Households in Fords
| Children | Single Father | Single Mother |
| No Children | 0 (0.0%) | 12 (3.3%) |
| 1 or 2 Children | 0 (0.0%) | 0 (0.0%) |
| 3 or 4 Children | 0 (0.0%) | 0 (0.0%) |
| 5 or more Children | 0 (0.0%) | 0 (0.0%) |
| Total | 0 (0.0%) | 12 (2.8%) |
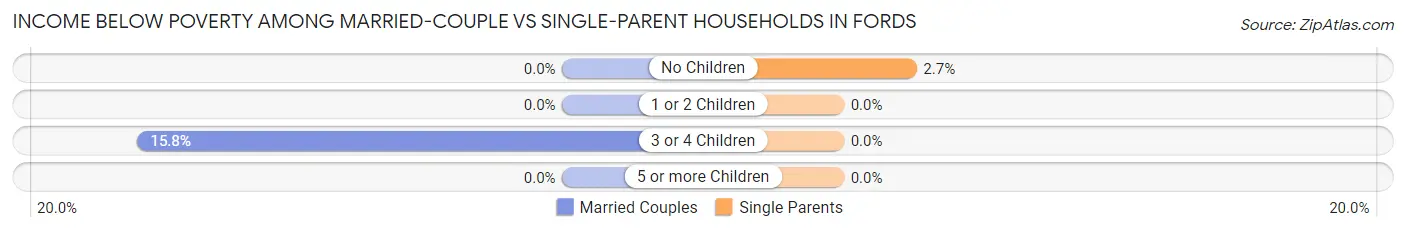
Income Below Poverty Among Married-Couple vs Single-Parent Households in Fords
The poverty data for Fords shows that 30 of the married-couple family households (1.3%) and 12 of the single-parent households (1.8%) are living below the poverty level. Within the married-couple family households, those with 3 or 4 children have the highest poverty rate, with 30 households (15.8%) falling below the poverty line. Among the single-parent households, those with no children have the highest poverty rate, with 12 household (2.7%) living below poverty.
| Children | Married-Couple Families | Single-Parent Households |
| No Children | 0 (0.0%) | 12 (2.7%) |
| 1 or 2 Children | 0 (0.0%) | 0 (0.0%) |
| 3 or 4 Children | 30 (15.8%) | 0 (0.0%) |
| 5 or more Children | 0 (0.0%) | 0 (0.0%) |
| Total | 30 (1.3%) | 12 (1.8%) |
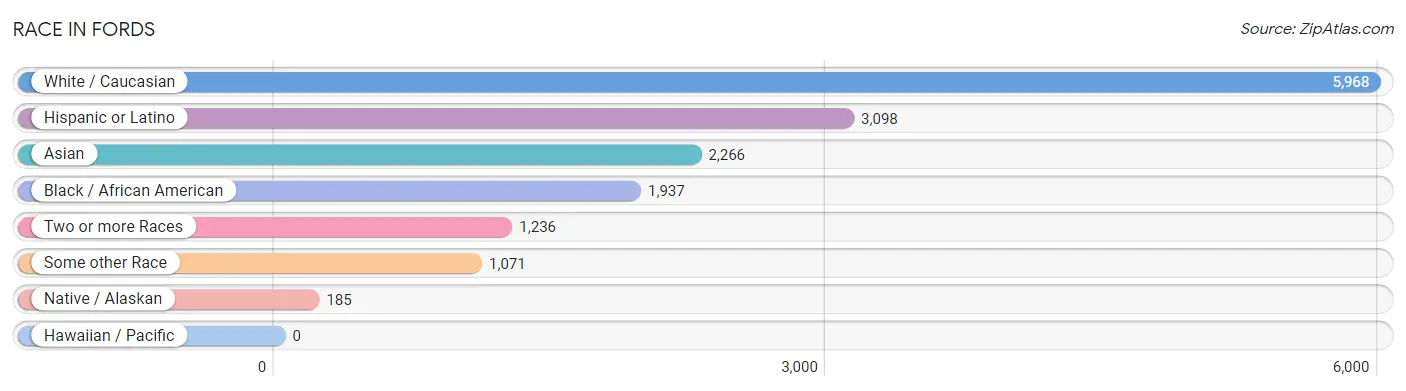
Race in Fords
The most populous races in Fords are White / Caucasian (5,968 | 47.1%), Hispanic or Latino (3,098 | 24.5%), and Asian (2,266 | 17.9%).
| Race | # Population | % Population |
| Asian | 2,266 | 17.9% |
| Black / African American | 1,937 | 15.3% |
| Hawaiian / Pacific | 0 | 0.0% |
| Hispanic or Latino | 3,098 | 24.5% |
| Native / Alaskan | 185 | 1.5% |
| White / Caucasian | 5,968 | 47.1% |
| Two or more Races | 1,236 | 9.8% |
| Some other Race | 1,071 | 8.5% |
| Total | 12,663 | 100.0% |
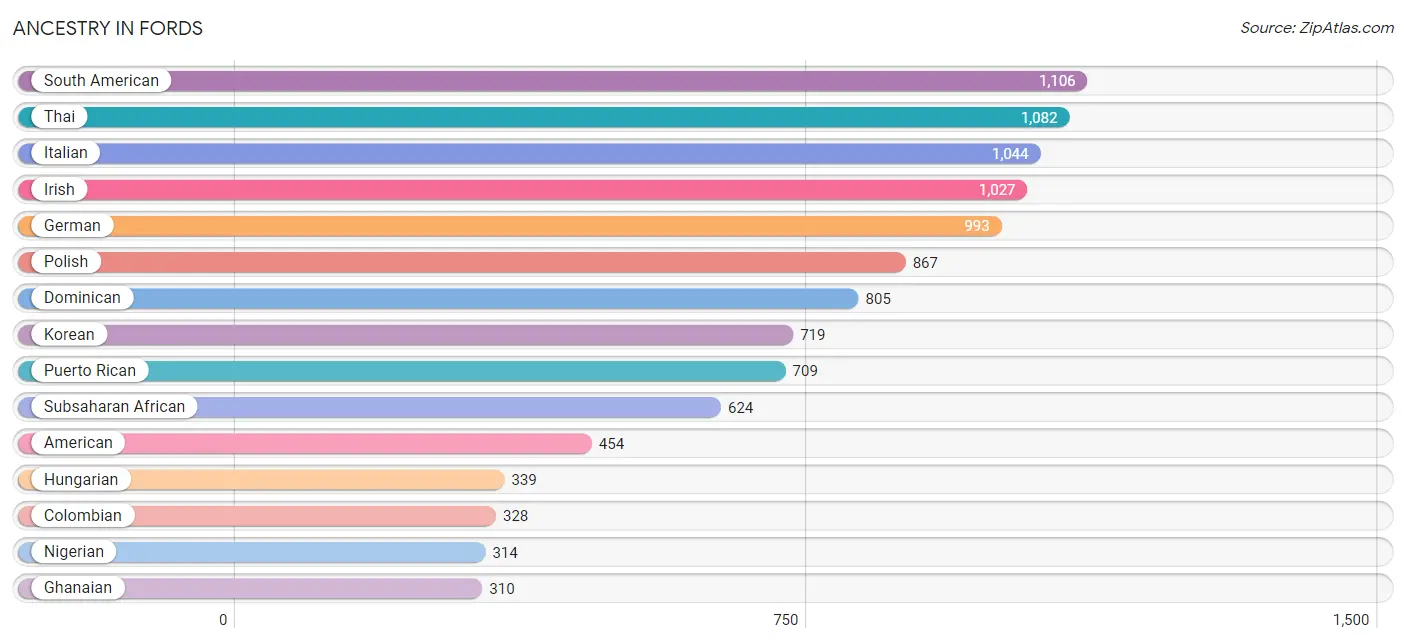
Ancestry in Fords
The most populous ancestries reported in Fords are South American (1,106 | 8.7%), Thai (1,082 | 8.5%), Italian (1,044 | 8.2%), Irish (1,027 | 8.1%), and German (993 | 7.8%), together accounting for 41.5% of all Fords residents.
| Ancestry | # Population | % Population |
| American | 454 | 3.6% |
| Arab | 221 | 1.8% |
| Argentinean | 184 | 1.5% |
| Armenian | 58 | 0.5% |
| Assyrian / Chaldean / Syriac | 38 | 0.3% |
| Barbadian | 54 | 0.4% |
| Brazilian | 7 | 0.1% |
| British | 10 | 0.1% |
| Bulgarian | 12 | 0.1% |
| Burmese | 112 | 0.9% |
| Carpatho Rusyn | 14 | 0.1% |
| Central American | 130 | 1.0% |
| Central American Indian | 228 | 1.8% |
| Colombian | 328 | 2.6% |
| Costa Rican | 31 | 0.2% |
| Cuban | 104 | 0.8% |
| Czech | 18 | 0.1% |
| Czechoslovakian | 18 | 0.1% |
| Danish | 56 | 0.4% |
| Delaware | 207 | 1.6% |
| Dominican | 805 | 6.4% |
| Dutch | 25 | 0.2% |
| Eastern European | 12 | 0.1% |
| Ecuadorian | 140 | 1.1% |
| Egyptian | 204 | 1.6% |
| English | 272 | 2.1% |
| European | 112 | 0.9% |
| Finnish | 26 | 0.2% |
| French | 96 | 0.8% |
| French Canadian | 8 | 0.1% |
| German | 993 | 7.8% |
| Ghanaian | 310 | 2.5% |
| Greek | 37 | 0.3% |
| Guatemalan | 42 | 0.3% |
| Honduran | 43 | 0.3% |
| Hungarian | 339 | 2.7% |
| Indian (Asian) | 201 | 1.6% |
| Irish | 1,027 | 8.1% |
| Iroquois | 36 | 0.3% |
| Italian | 1,044 | 8.2% |
| Jamaican | 37 | 0.3% |
| Korean | 719 | 5.7% |
| Mexican | 74 | 0.6% |
| Nigerian | 314 | 2.5% |
| Northern European | 21 | 0.2% |
| Norwegian | 31 | 0.2% |
| Pakistani | 20 | 0.2% |
| Peruvian | 225 | 1.8% |
| Polish | 867 | 6.9% |
| Portuguese | 170 | 1.3% |
| Puerto Rican | 709 | 5.6% |
| Romanian | 10 | 0.1% |
| Russian | 62 | 0.5% |
| Salvadoran | 14 | 0.1% |
| Scotch-Irish | 100 | 0.8% |
| Scottish | 21 | 0.2% |
| Slavic | 117 | 0.9% |
| Slovak | 170 | 1.3% |
| South American | 1,106 | 8.7% |
| Spaniard | 115 | 0.9% |
| Sri Lankan | 11 | 0.1% |
| Subsaharan African | 624 | 4.9% |
| Swedish | 7 | 0.1% |
| Thai | 1,082 | 8.5% |
| Trinidadian and Tobagonian | 25 | 0.2% |
| Ukrainian | 57 | 0.4% |
| Venezuelan | 229 | 1.8% |
| Vietnamese | 137 | 1.1% |
| West Indian | 8 | 0.1% | View All 69 Rows |
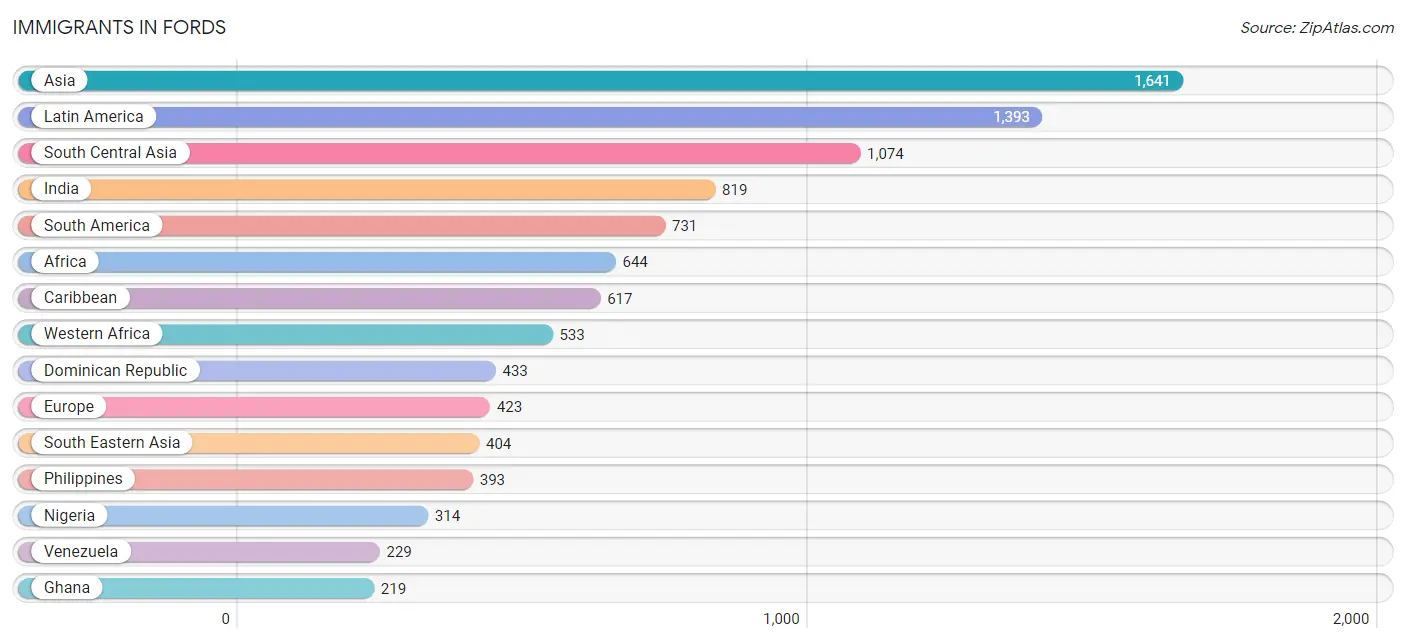
Immigrants in Fords
The most numerous immigrant groups reported in Fords came from Asia (1,641 | 13.0%), Latin America (1,393 | 11.0%), South Central Asia (1,074 | 8.5%), India (819 | 6.5%), and South America (731 | 5.8%), together accounting for 44.7% of all Fords residents.
| Immigration Origin | # Population | % Population |
| Africa | 644 | 5.1% |
| Argentina | 197 | 1.6% |
| Asia | 1,641 | 13.0% |
| Bangladesh | 113 | 0.9% |
| Barbados | 26 | 0.2% |
| Brazil | 19 | 0.2% |
| Bulgaria | 12 | 0.1% |
| Caribbean | 617 | 4.9% |
| Central America | 45 | 0.4% |
| China | 41 | 0.3% |
| Colombia | 110 | 0.9% |
| Costa Rica | 31 | 0.2% |
| Cuba | 68 | 0.5% |
| Czechoslovakia | 17 | 0.1% |
| Dominican Republic | 433 | 3.4% |
| Eastern Africa | 11 | 0.1% |
| Eastern Asia | 153 | 1.2% |
| Eastern Europe | 197 | 1.6% |
| Ecuador | 54 | 0.4% |
| Egypt | 100 | 0.8% |
| Europe | 423 | 3.3% |
| Germany | 10 | 0.1% |
| Ghana | 219 | 1.7% |
| Greece | 15 | 0.1% |
| India | 819 | 6.5% |
| Ireland | 14 | 0.1% |
| Italy | 94 | 0.7% |
| Jamaica | 49 | 0.4% |
| Korea | 112 | 0.9% |
| Kuwait | 10 | 0.1% |
| Latin America | 1,393 | 11.0% |
| Mexico | 14 | 0.1% |
| Nigeria | 314 | 2.5% |
| Northern Africa | 100 | 0.8% |
| Northern Europe | 32 | 0.3% |
| Pakistan | 130 | 1.0% |
| Peru | 122 | 1.0% |
| Philippines | 393 | 3.1% |
| Poland | 134 | 1.1% |
| Portugal | 49 | 0.4% |
| Russia | 14 | 0.1% |
| South America | 731 | 5.8% |
| South Central Asia | 1,074 | 8.5% |
| South Eastern Asia | 404 | 3.2% |
| Southern Europe | 167 | 1.3% |
| Spain | 9 | 0.1% |
| Switzerland | 17 | 0.1% |
| Taiwan | 12 | 0.1% |
| Trinidad and Tobago | 41 | 0.3% |
| Uzbekistan | 12 | 0.1% |
| Venezuela | 229 | 1.8% |
| Vietnam | 11 | 0.1% |
| Western Africa | 533 | 4.2% |
| Western Asia | 10 | 0.1% |
| Western Europe | 27 | 0.2% | View All 55 Rows |
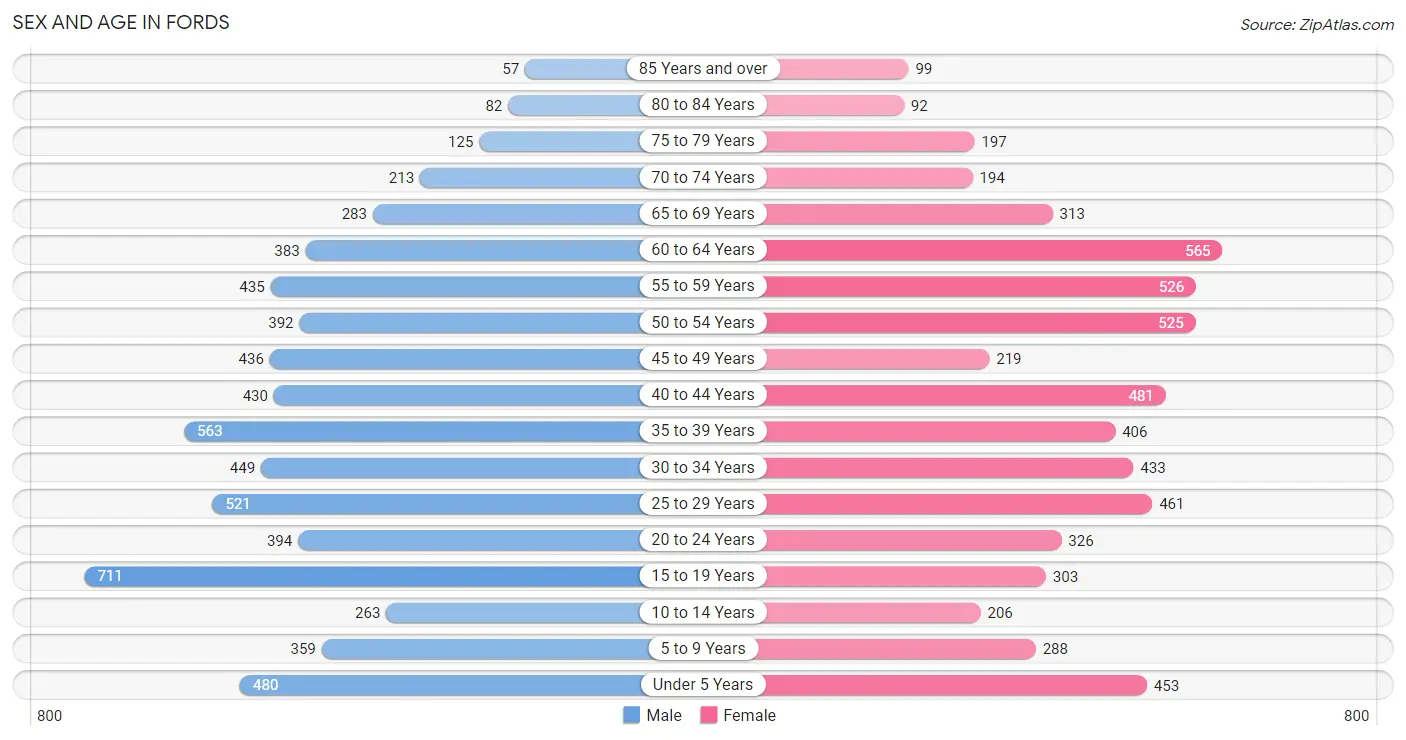
Sex and Age in Fords
Sex and Age in Fords
The most populous age groups in Fords are 15 to 19 Years (711 | 10.8%) for men and 60 to 64 Years (565 | 9.3%) for women.
| Age Bracket | Male | Female |
| Under 5 Years | 480 (7.3%) | 453 (7.4%) |
| 5 to 9 Years | 359 (5.5%) | 288 (4.7%) |
| 10 to 14 Years | 263 (4.0%) | 206 (3.4%) |
| 15 to 19 Years | 711 (10.8%) | 303 (5.0%) |
| 20 to 24 Years | 394 (6.0%) | 326 (5.4%) |
| 25 to 29 Years | 521 (7.9%) | 461 (7.6%) |
| 30 to 34 Years | 449 (6.8%) | 433 (7.1%) |
| 35 to 39 Years | 563 (8.6%) | 406 (6.7%) |
| 40 to 44 Years | 430 (6.5%) | 481 (7.9%) |
| 45 to 49 Years | 436 (6.6%) | 219 (3.6%) |
| 50 to 54 Years | 392 (6.0%) | 525 (8.6%) |
| 55 to 59 Years | 435 (6.6%) | 526 (8.6%) |
| 60 to 64 Years | 383 (5.8%) | 565 (9.3%) |
| 65 to 69 Years | 283 (4.3%) | 313 (5.1%) |
| 70 to 74 Years | 213 (3.2%) | 194 (3.2%) |
| 75 to 79 Years | 125 (1.9%) | 197 (3.2%) |
| 80 to 84 Years | 82 (1.3%) | 92 (1.5%) |
| 85 Years and over | 57 (0.9%) | 99 (1.6%) |
| Total | 6,576 (100.0%) | 6,087 (100.0%) |
Families and Households in Fords
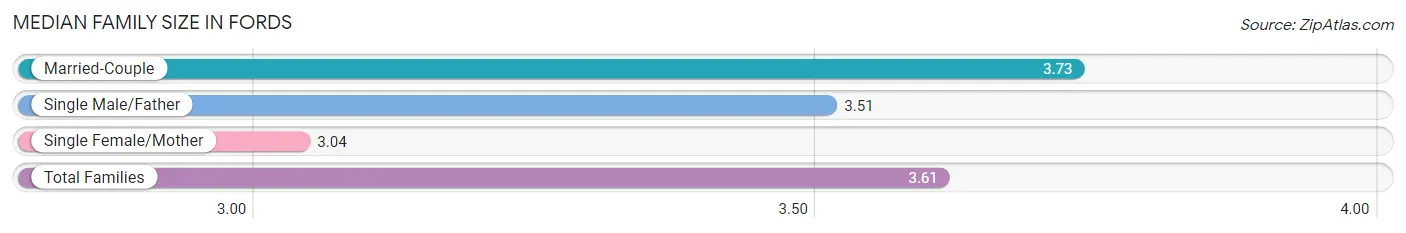
Median Family Size in Fords
The median family size in Fords is 3.61 persons per family, with married-couple families (2,319 | 77.7%) accounting for the largest median family size of 3.73 persons per family. On the other hand, single female/mother families (431 | 14.4%) represent the smallest median family size with 3.04 persons per family.
| Family Type | # Families | Family Size |
| Married-Couple | 2,319 (77.7%) | 3.73 |
| Single Male/Father | 235 (7.9%) | 3.51 |
| Single Female/Mother | 431 (14.4%) | 3.04 |
| Total Families | 2,985 (100.0%) | 3.61 |
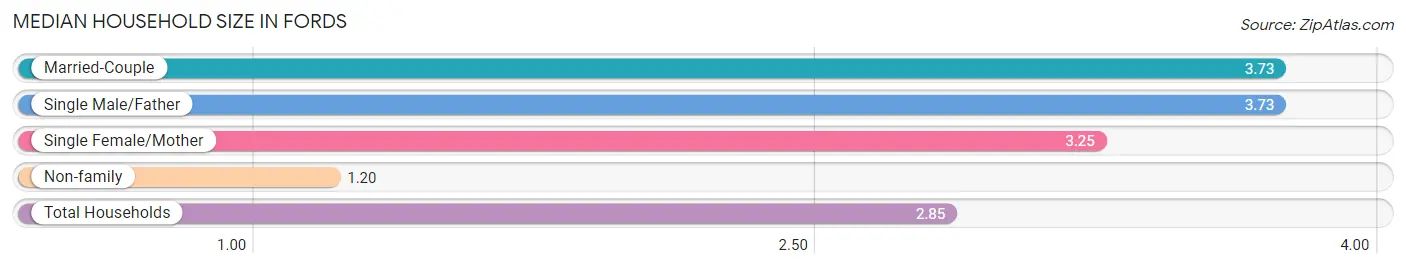
Median Household Size in Fords
The median household size in Fords is 2.85 persons per household, with married-couple households (2,319 | 52.2%) accounting for the largest median household size of 3.73 persons per household. non-family households (1,453 | 32.7%) represent the smallest median household size with 1.20 persons per household.
| Household Type | # Households | Household Size |
| Married-Couple | 2,319 (52.2%) | 3.73 |
| Single Male/Father | 235 (5.3%) | 3.73 |
| Single Female/Mother | 431 (9.7%) | 3.25 |
| Non-family | 1,453 (32.7%) | 1.20 |
| Total Households | 4,438 (100.0%) | 2.85 |
Household Size by Marriage Status in Fords
Out of a total of 4,438 households in Fords, 2,985 (67.3%) are family households, while 1,453 (32.7%) are nonfamily households. The most numerous type of family households are 2-person households, comprising 859, and the most common type of nonfamily households are 1-person households, comprising 1,137.
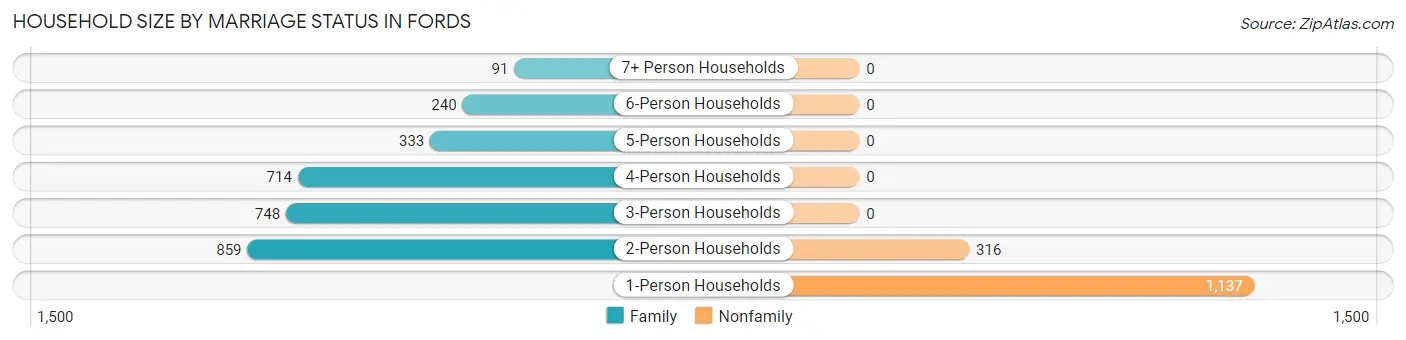
| Household Size | Family Households | Nonfamily Households |
| 1-Person Households | - | 1,137 (25.6%) |
| 2-Person Households | 859 (19.4%) | 316 (7.1%) |
| 3-Person Households | 748 (16.9%) | 0 (0.0%) |
| 4-Person Households | 714 (16.1%) | 0 (0.0%) |
| 5-Person Households | 333 (7.5%) | 0 (0.0%) |
| 6-Person Households | 240 (5.4%) | 0 (0.0%) |
| 7+ Person Households | 91 (2.1%) | 0 (0.0%) |
| Total | 2,985 (67.3%) | 1,453 (32.7%) |
Female Fertility in Fords
Fertility by Age in Fords
Average fertility rate in Fords is 69.0 births per 1,000 women. Women in the age bracket of 35 to 50 years have the highest fertility rate with 120.0 births per 1,000 women. Women in the age bracket of 35 to 50 years acount for 77.5% of all women with births.
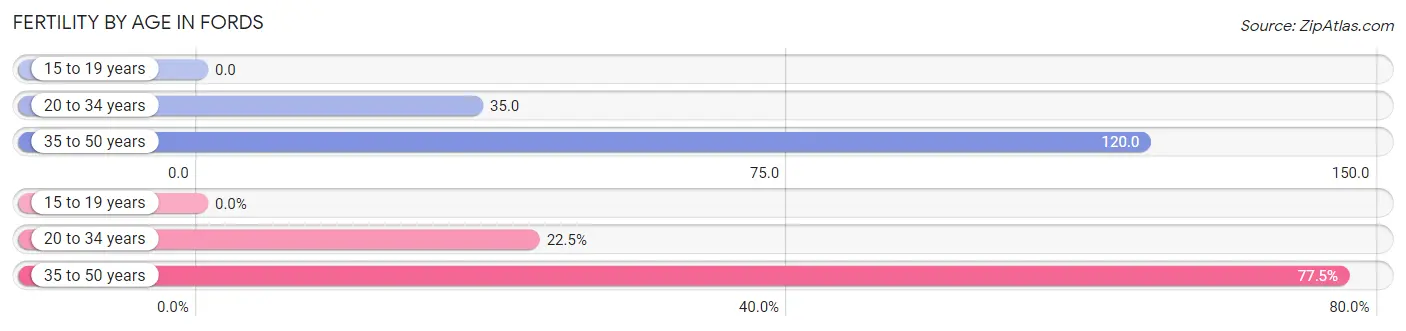
| Age Bracket | Women with Births | Births / 1,000 Women |
| 15 to 19 years | 0 (0.0%) | 0.0 |
| 20 to 34 years | 43 (22.5%) | 35.0 |
| 35 to 50 years | 148 (77.5%) | 120.0 |
| Total | 191 (100.0%) | 69.0 |
Fertility by Age by Marriage Status in Fords
94.2% of women with births (191) in Fords are married. The highest percentage of unmarried women with births falls into 20 to 34 years age bracket with 25.6% of them unmarried at the time of birth, while the lowest percentage of unmarried women with births belong to 35 to 50 years age bracket with 0.0% of them unmarried.
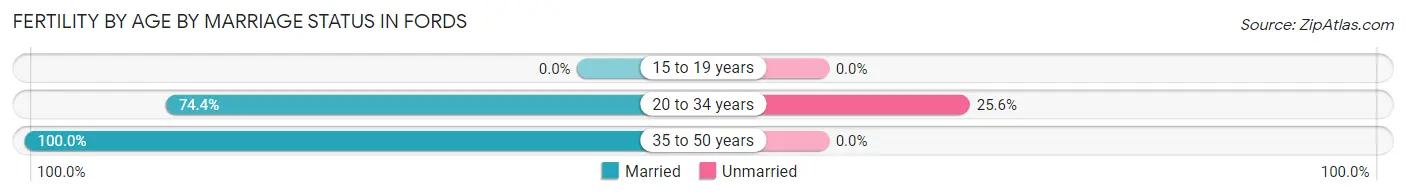
| Age Bracket | Married | Unmarried |
| 15 to 19 years | 0 (0.0%) | 0 (0.0%) |
| 20 to 34 years | 32 (74.4%) | 11 (25.6%) |
| 35 to 50 years | 148 (100.0%) | 0 (0.0%) |
| Total | 180 (94.2%) | 11 (5.8%) |
Fertility by Education in Fords
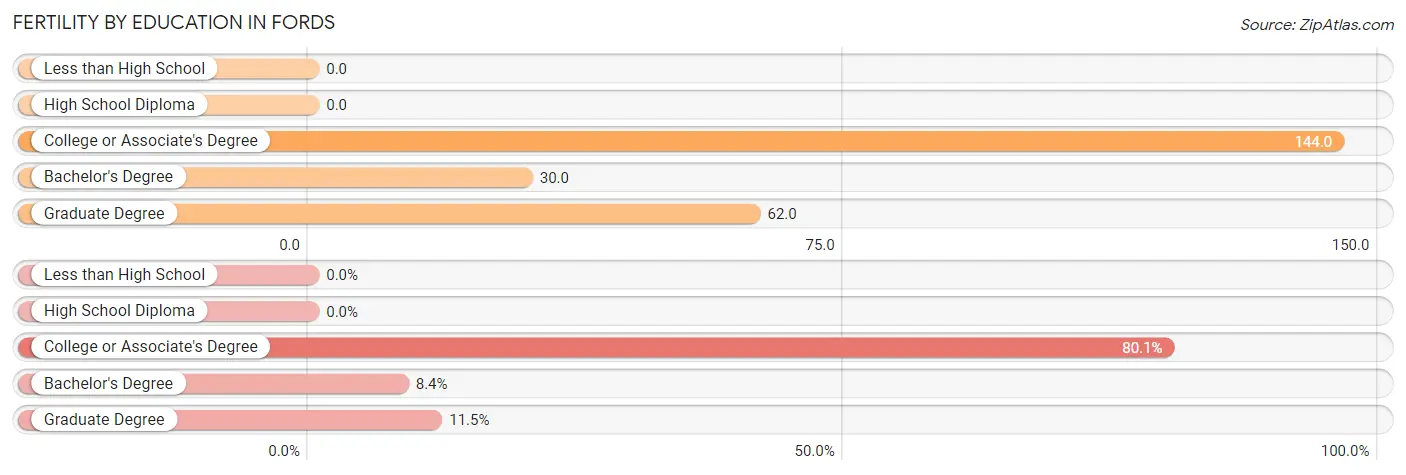
| Educational Attainment | Women with Births | Births / 1,000 Women |
| Less than High School | 0 (0.0%) | 0.0 |
| High School Diploma | 0 (0.0%) | 0.0 |
| College or Associate's Degree | 153 (80.1%) | 144.0 |
| Bachelor's Degree | 16 (8.4%) | 30.0 |
| Graduate Degree | 22 (11.5%) | 62.0 |
| Total | 191 (100.0%) | 69.0 |
Fertility by Education by Marriage Status in Fords
5.8% of women with births in Fords are unmarried. Women with the educational attainment of bachelor's degree are most likely to be married with 100.0% of them married at childbirth, while women with the educational attainment of college or associate's degree are least likely to be married with 7.2% of them unmarried at childbirth.
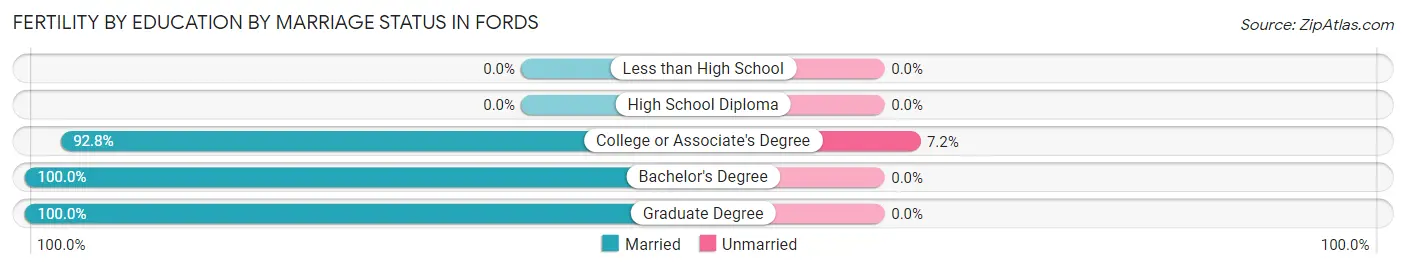
| Educational Attainment | Married | Unmarried |
| Less than High School | 0 (0.0%) | 0 (0.0%) |
| High School Diploma | 0 (0.0%) | 0 (0.0%) |
| College or Associate's Degree | 142 (92.8%) | 11 (7.2%) |
| Bachelor's Degree | 16 (100.0%) | 0 (0.0%) |
| Graduate Degree | 22 (100.0%) | 0 (0.0%) |
| Total | 180 (94.2%) | 11 (5.8%) |
Employment Characteristics in Fords
Employment by Class of Employer in Fords
Among the 6,381 employed individuals in Fords, private company employees (4,580 | 71.8%), not-for-profit organizations (433 | 6.8%), and local government employees (422 | 6.6%) make up the most common classes of employment.
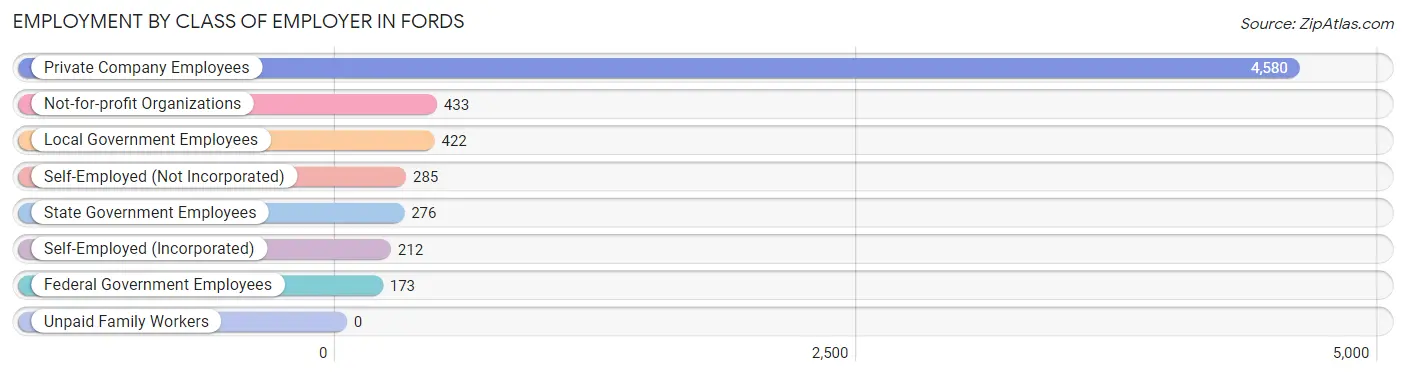
| Employer Class | # Employees | % Employees |
| Private Company Employees | 4,580 | 71.8% |
| Self-Employed (Incorporated) | 212 | 3.3% |
| Self-Employed (Not Incorporated) | 285 | 4.5% |
| Not-for-profit Organizations | 433 | 6.8% |
| Local Government Employees | 422 | 6.6% |
| State Government Employees | 276 | 4.3% |
| Federal Government Employees | 173 | 2.7% |
| Unpaid Family Workers | 0 | 0.0% |
| Total | 6,381 | 100.0% |
Employment Status by Age in Fords
According to the labor force statistics for Fords, out of the total population over 16 years of age (10,492), 65.1% or 6,830 individuals are in the labor force, with 5.0% or 342 of them unemployed. The age group with the highest labor force participation rate is 30 to 34 years, with 96.8% or 854 individuals in the labor force. Within the labor force, the 65 to 74 years age range has the highest percentage of unemployed individuals, with 13.7% or 40 of them being unemployed.
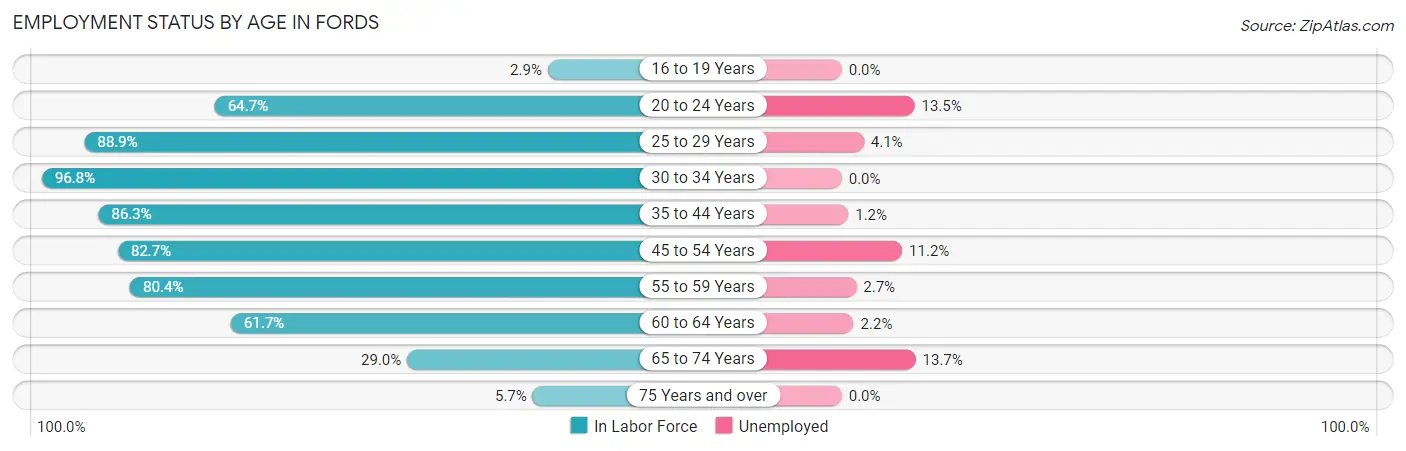
| Age Bracket | In Labor Force | Unemployed |
| 16 to 19 Years | 26 (2.9%) | 0 (0.0%) |
| 20 to 24 Years | 466 (64.7%) | 63 (13.5%) |
| 25 to 29 Years | 873 (88.9%) | 36 (4.1%) |
| 30 to 34 Years | 854 (96.8%) | 0 (0.0%) |
| 35 to 44 Years | 1,622 (86.3%) | 19 (1.2%) |
| 45 to 54 Years | 1,300 (82.7%) | 146 (11.2%) |
| 55 to 59 Years | 773 (80.4%) | 21 (2.7%) |
| 60 to 64 Years | 585 (61.7%) | 13 (2.2%) |
| 65 to 74 Years | 291 (29.0%) | 40 (13.7%) |
| 75 Years and over | 37 (5.7%) | 0 (0.0%) |
| Total | 6,830 (65.1%) | 342 (5.0%) |
Employment Status by Educational Attainment in Fords
According to labor force statistics for Fords, 83.1% of individuals (6,004) out of the total population between 25 and 64 years of age (7,225) are in the labor force, with 3.9% or 234 of them being unemployed. The group with the highest labor force participation rate are those with the educational attainment of college / associate degree, with 90.6% or 1,952 individuals in the labor force. Within the labor force, individuals with high school diploma education have the highest percentage of unemployment, with 7.1% or 83 of them being unemployed.
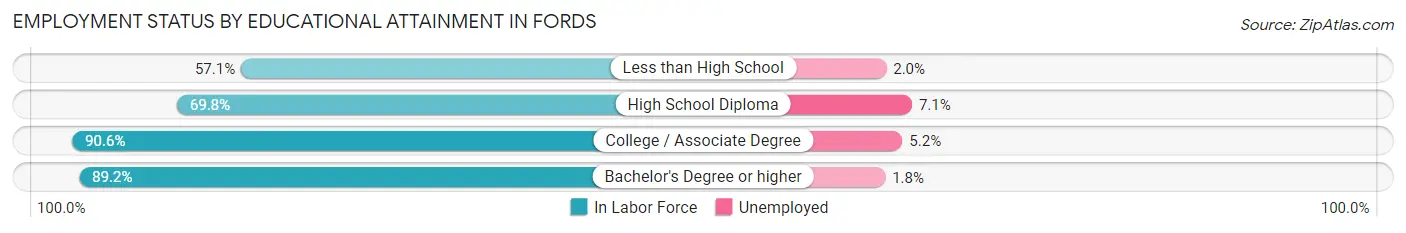
| Educational Attainment | In Labor Force | Unemployed |
| Less than High School | 254 (57.1%) | 9 (2.0%) |
| High School Diploma | 1,163 (69.8%) | 118 (7.1%) |
| College / Associate Degree | 1,952 (90.6%) | 112 (5.2%) |
| Bachelor's Degree or higher | 2,639 (89.2%) | 53 (1.8%) |
| Total | 6,004 (83.1%) | 282 (3.9%) |
Employment Occupations by Sex in Fords
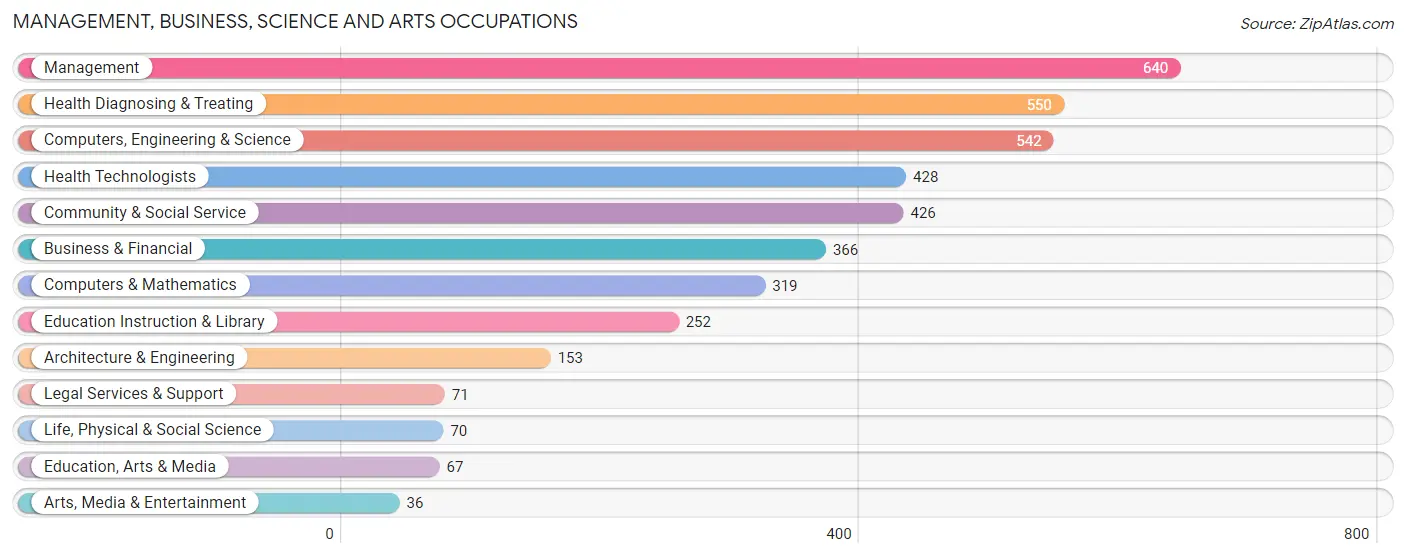
Management, Business, Science and Arts Occupations
The most common Management, Business, Science and Arts occupations in Fords are Management (640 | 9.9%), Health Diagnosing & Treating (550 | 8.5%), Computers, Engineering & Science (542 | 8.4%), Health Technologists (428 | 6.6%), and Community & Social Service (426 | 6.6%).
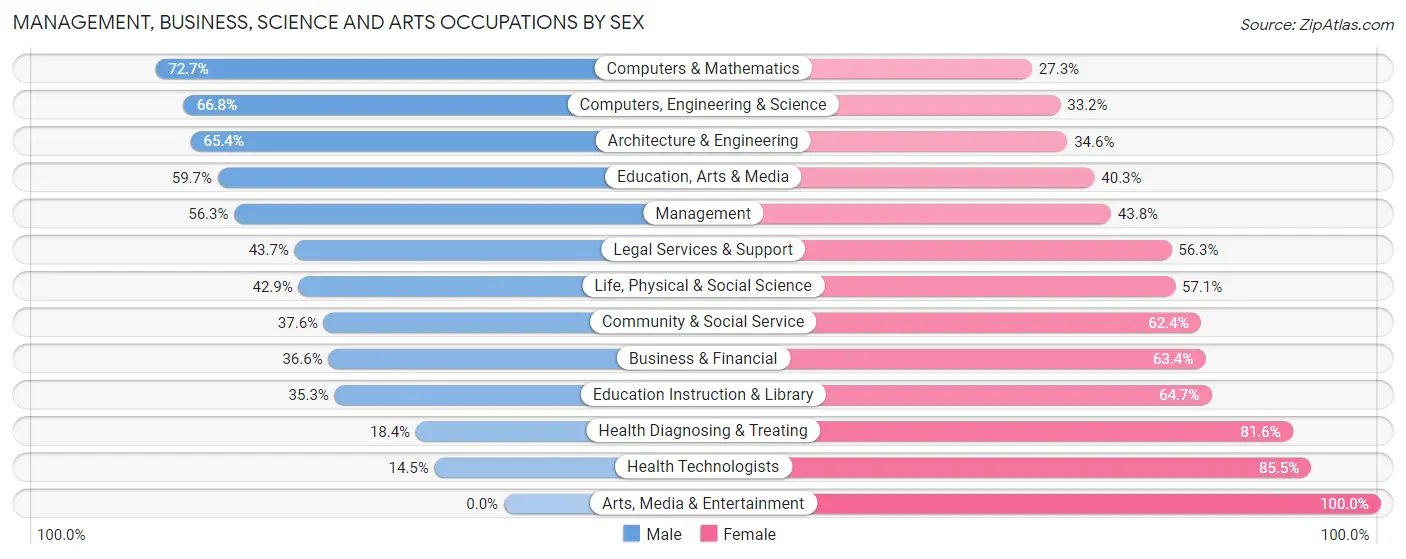
Management, Business, Science and Arts Occupations by Sex
Within the Management, Business, Science and Arts occupations in Fords, the most male-oriented occupations are Computers & Mathematics (72.7%), Computers, Engineering & Science (66.8%), and Architecture & Engineering (65.4%), while the most female-oriented occupations are Arts, Media & Entertainment (100.0%), Health Technologists (85.5%), and Health Diagnosing & Treating (81.6%).
| Occupation | Male | Female |
| Management | 360 (56.2%) | 280 (43.8%) |
| Business & Financial | 134 (36.6%) | 232 (63.4%) |
| Computers, Engineering & Science | 362 (66.8%) | 180 (33.2%) |
| Computers & Mathematics | 232 (72.7%) | 87 (27.3%) |
| Architecture & Engineering | 100 (65.4%) | 53 (34.6%) |
| Life, Physical & Social Science | 30 (42.9%) | 40 (57.1%) |
| Community & Social Service | 160 (37.6%) | 266 (62.4%) |
| Education, Arts & Media | 40 (59.7%) | 27 (40.3%) |
| Legal Services & Support | 31 (43.7%) | 40 (56.3%) |
| Education Instruction & Library | 89 (35.3%) | 163 (64.7%) |
| Arts, Media & Entertainment | 0 (0.0%) | 36 (100.0%) |
| Health Diagnosing & Treating | 101 (18.4%) | 449 (81.6%) |
| Health Technologists | 62 (14.5%) | 366 (85.5%) |
| Total (Category) | 1,117 (44.3%) | 1,407 (55.7%) |
| Total (Overall) | 3,561 (54.9%) | 2,928 (45.1%) |
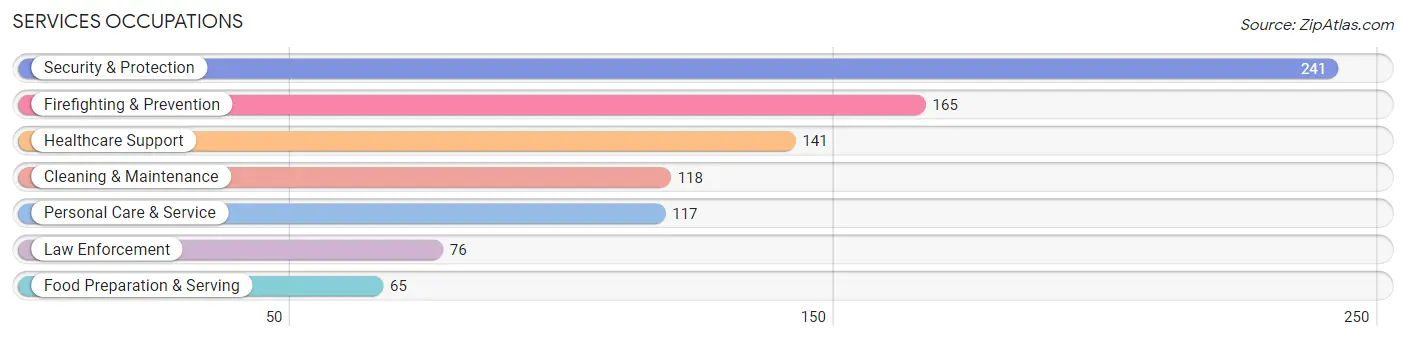
Services Occupations
The most common Services occupations in Fords are Security & Protection (241 | 3.7%), Firefighting & Prevention (165 | 2.5%), Healthcare Support (141 | 2.2%), Cleaning & Maintenance (118 | 1.8%), and Personal Care & Service (117 | 1.8%).
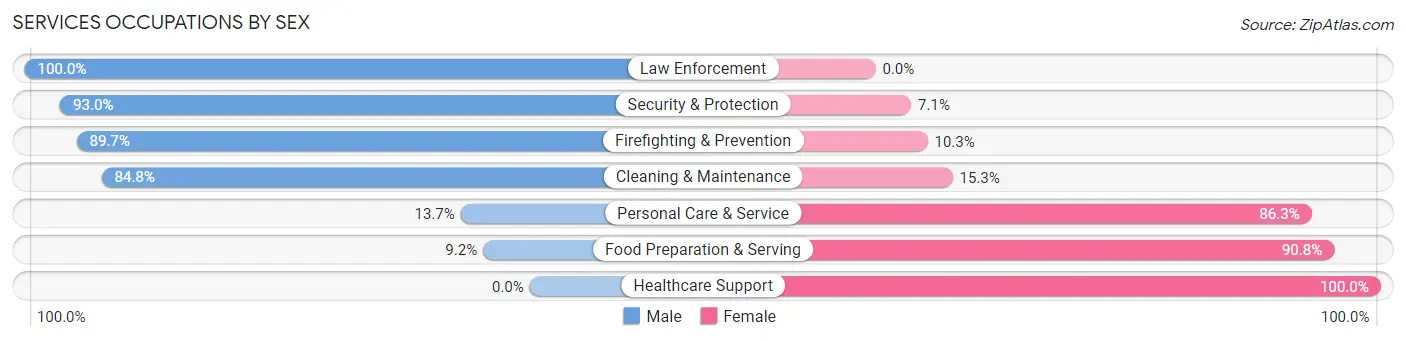
Services Occupations by Sex
Within the Services occupations in Fords, the most male-oriented occupations are Law Enforcement (100.0%), Security & Protection (92.9%), and Firefighting & Prevention (89.7%), while the most female-oriented occupations are Healthcare Support (100.0%), Food Preparation & Serving (90.8%), and Personal Care & Service (86.3%).
| Occupation | Male | Female |
| Healthcare Support | 0 (0.0%) | 141 (100.0%) |
| Security & Protection | 224 (92.9%) | 17 (7.0%) |
| Firefighting & Prevention | 148 (89.7%) | 17 (10.3%) |
| Law Enforcement | 76 (100.0%) | 0 (0.0%) |
| Food Preparation & Serving | 6 (9.2%) | 59 (90.8%) |
| Cleaning & Maintenance | 100 (84.8%) | 18 (15.2%) |
| Personal Care & Service | 16 (13.7%) | 101 (86.3%) |
| Total (Category) | 346 (50.7%) | 336 (49.3%) |
| Total (Overall) | 3,561 (54.9%) | 2,928 (45.1%) |
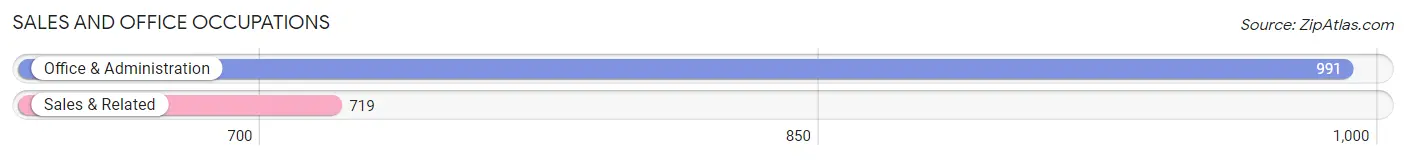
Sales and Office Occupations
The most common Sales and Office occupations in Fords are Office & Administration (991 | 15.3%), and Sales & Related (719 | 11.1%).
Sales and Office Occupations by Sex
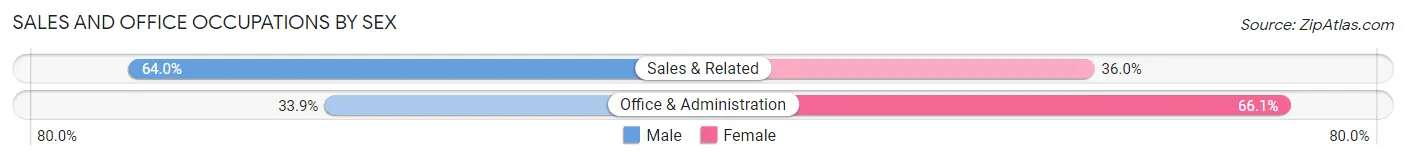
| Occupation | Male | Female |
| Sales & Related | 460 (64.0%) | 259 (36.0%) |
| Office & Administration | 336 (33.9%) | 655 (66.1%) |
| Total (Category) | 796 (46.6%) | 914 (53.4%) |
| Total (Overall) | 3,561 (54.9%) | 2,928 (45.1%) |
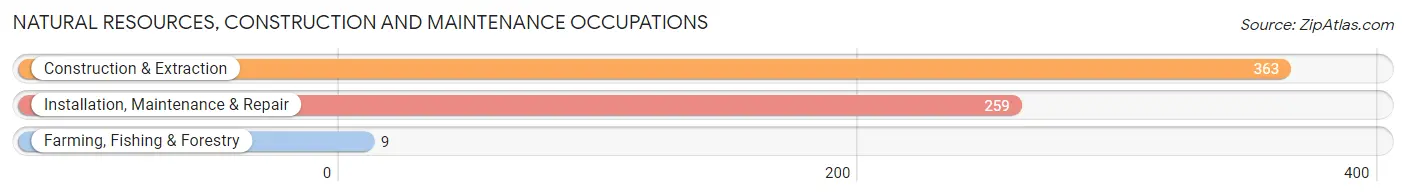
Natural Resources, Construction and Maintenance Occupations
The most common Natural Resources, Construction and Maintenance occupations in Fords are Construction & Extraction (363 | 5.6%), Installation, Maintenance & Repair (259 | 4.0%), and Farming, Fishing & Forestry (9 | 0.1%).
Natural Resources, Construction and Maintenance Occupations by Sex
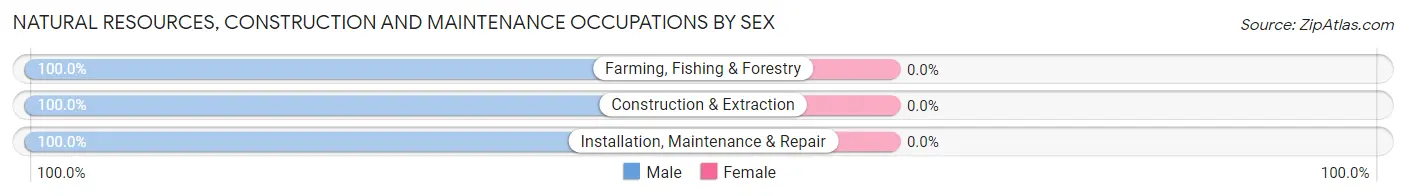
| Occupation | Male | Female |
| Farming, Fishing & Forestry | 9 (100.0%) | 0 (0.0%) |
| Construction & Extraction | 363 (100.0%) | 0 (0.0%) |
| Installation, Maintenance & Repair | 259 (100.0%) | 0 (0.0%) |
| Total (Category) | 631 (100.0%) | 0 (0.0%) |
| Total (Overall) | 3,561 (54.9%) | 2,928 (45.1%) |
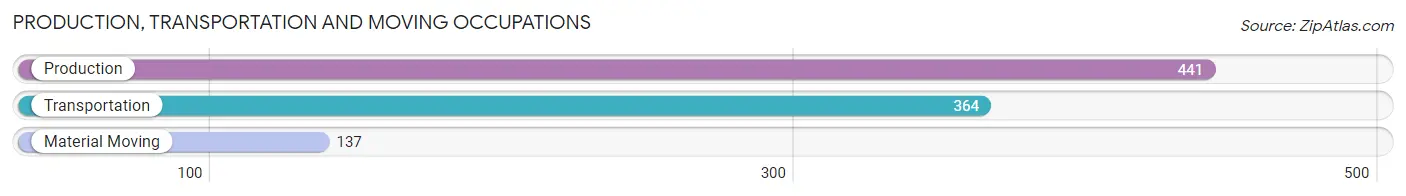
Production, Transportation and Moving Occupations
The most common Production, Transportation and Moving occupations in Fords are Production (441 | 6.8%), Transportation (364 | 5.6%), and Material Moving (137 | 2.1%).
Production, Transportation and Moving Occupations by Sex
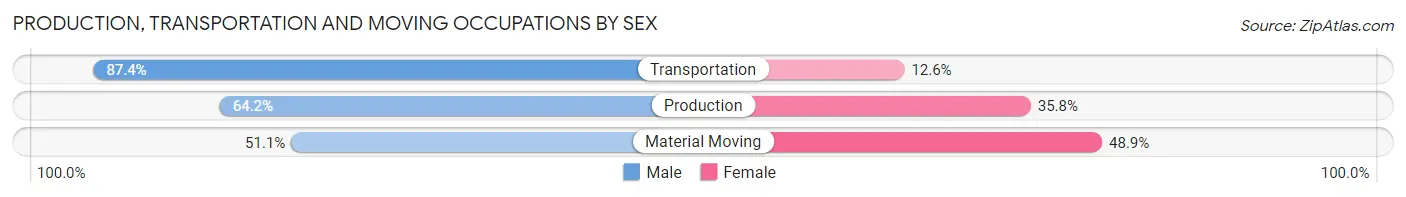
| Occupation | Male | Female |
| Production | 283 (64.2%) | 158 (35.8%) |
| Transportation | 318 (87.4%) | 46 (12.6%) |
| Material Moving | 70 (51.1%) | 67 (48.9%) |
| Total (Category) | 671 (71.2%) | 271 (28.8%) |
| Total (Overall) | 3,561 (54.9%) | 2,928 (45.1%) |
Employment Industries by Sex in Fords
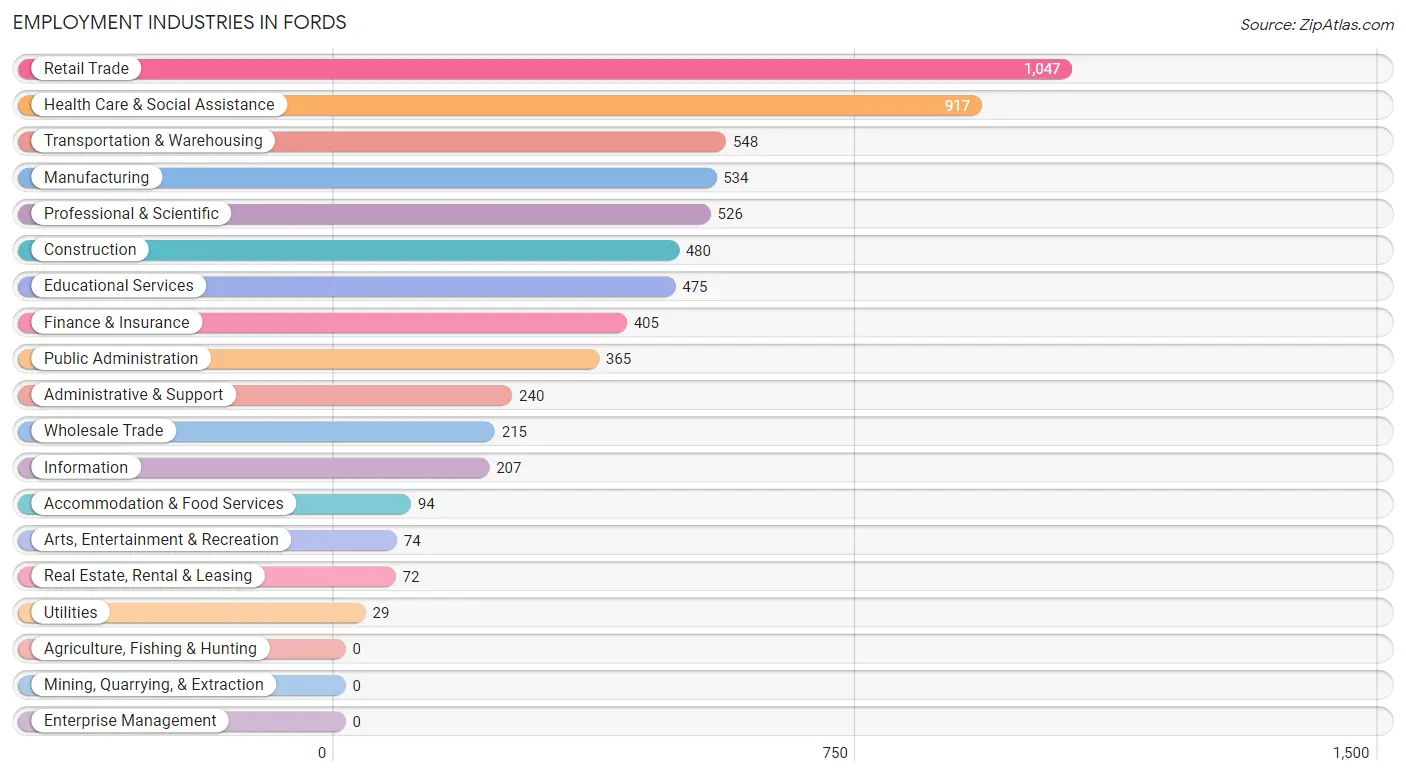
Employment Industries in Fords
The major employment industries in Fords include Retail Trade (1,047 | 16.1%), Health Care & Social Assistance (917 | 14.1%), Transportation & Warehousing (548 | 8.5%), Manufacturing (534 | 8.2%), and Professional & Scientific (526 | 8.1%).
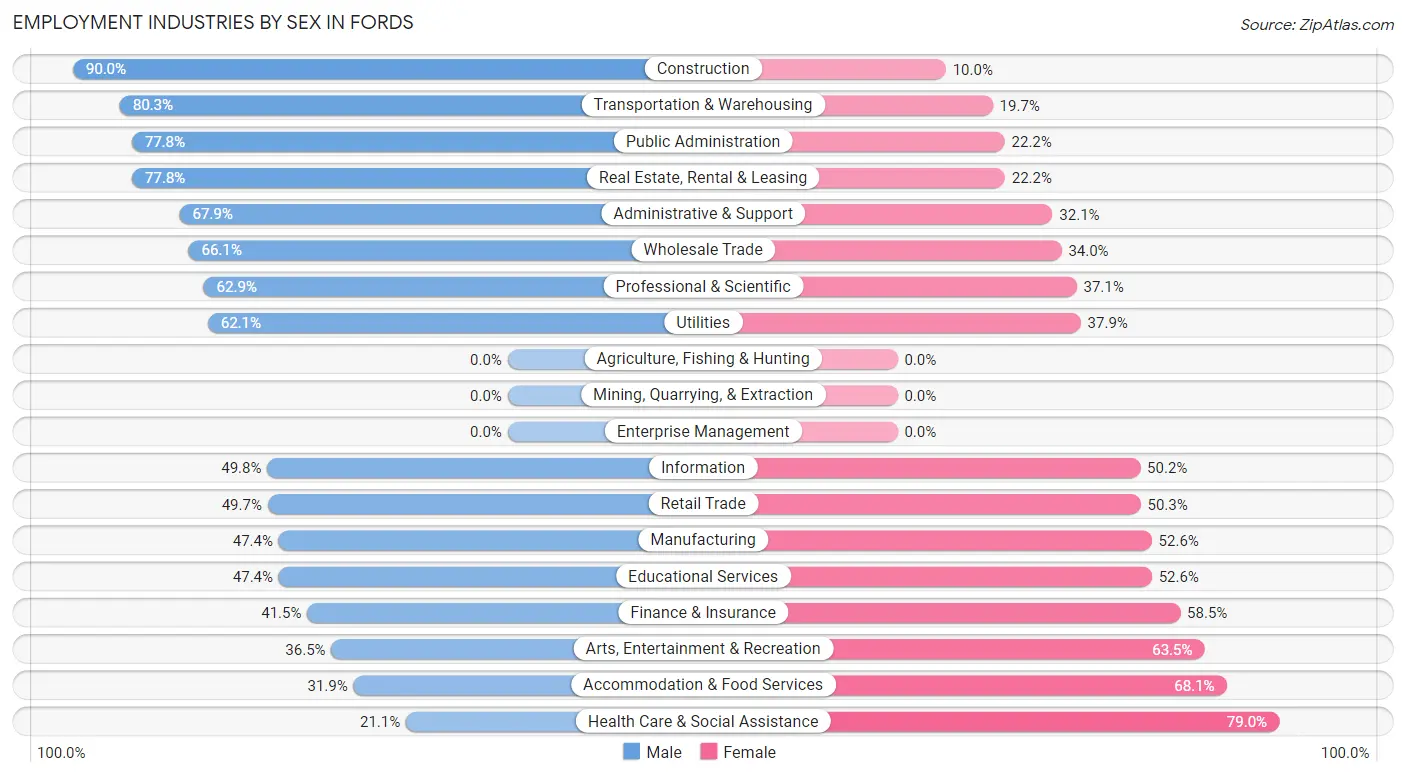
Employment Industries by Sex in Fords
The Fords industries that see more men than women are Construction (90.0%), Transportation & Warehousing (80.3%), and Public Administration (77.8%), whereas the industries that tend to have a higher number of women are Health Care & Social Assistance (78.9%), Accommodation & Food Services (68.1%), and Arts, Entertainment & Recreation (63.5%).
| Industry | Male | Female |
| Agriculture, Fishing & Hunting | 0 (0.0%) | 0 (0.0%) |
| Mining, Quarrying, & Extraction | 0 (0.0%) | 0 (0.0%) |
| Construction | 432 (90.0%) | 48 (10.0%) |
| Manufacturing | 253 (47.4%) | 281 (52.6%) |
| Wholesale Trade | 142 (66.0%) | 73 (34.0%) |
| Retail Trade | 520 (49.7%) | 527 (50.3%) |
| Transportation & Warehousing | 440 (80.3%) | 108 (19.7%) |
| Utilities | 18 (62.1%) | 11 (37.9%) |
| Information | 103 (49.8%) | 104 (50.2%) |
| Finance & Insurance | 168 (41.5%) | 237 (58.5%) |
| Real Estate, Rental & Leasing | 56 (77.8%) | 16 (22.2%) |
| Professional & Scientific | 331 (62.9%) | 195 (37.1%) |
| Enterprise Management | 0 (0.0%) | 0 (0.0%) |
| Administrative & Support | 163 (67.9%) | 77 (32.1%) |
| Educational Services | 225 (47.4%) | 250 (52.6%) |
| Health Care & Social Assistance | 193 (21.0%) | 724 (78.9%) |
| Arts, Entertainment & Recreation | 27 (36.5%) | 47 (63.5%) |
| Accommodation & Food Services | 30 (31.9%) | 64 (68.1%) |
| Public Administration | 284 (77.8%) | 81 (22.2%) |
| Total | 3,561 (54.9%) | 2,928 (45.1%) |
Education in Fords
School Enrollment in Fords
The most common levels of schooling among the 3,074 students in Fords are college / undergraduate (847 | 27.6%), high school (768 | 25.0%), and elementary school (457 | 14.9%).
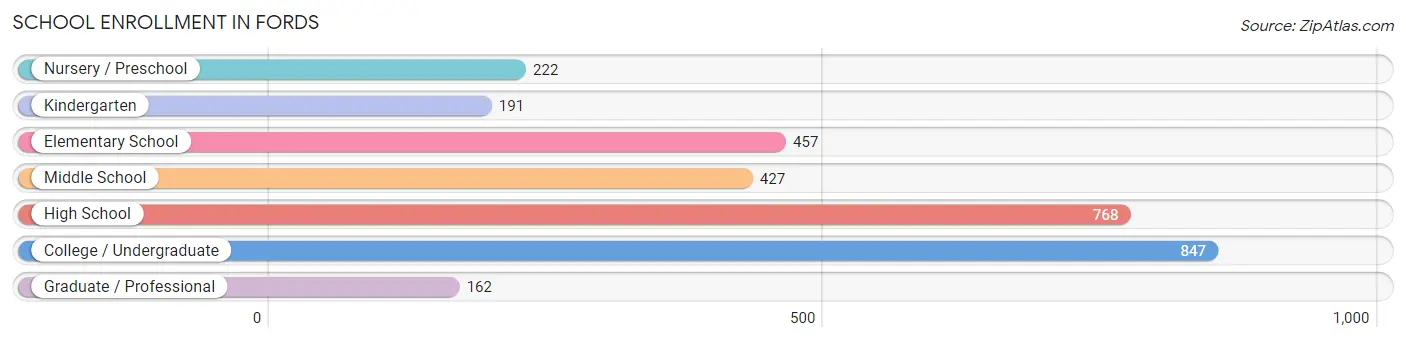
| School Level | # Students | % Students |
| Nursery / Preschool | 222 | 7.2% |
| Kindergarten | 191 | 6.2% |
| Elementary School | 457 | 14.9% |
| Middle School | 427 | 13.9% |
| High School | 768 | 25.0% |
| College / Undergraduate | 847 | 27.6% |
| Graduate / Professional | 162 | 5.3% |
| Total | 3,074 | 100.0% |
School Enrollment by Age by Funding Source in Fords
Out of a total of 3,074 students who are enrolled in schools in Fords, 621 (20.2%) attend a private institution, while the remaining 2,453 (79.8%) are enrolled in public schools. The age group of 3 to 4 year olds has the highest likelihood of being enrolled in private schools, with 149 (72.3% in the age bracket) enrolled. Conversely, the age group of 10 to 14 year olds has the lowest likelihood of being enrolled in a private school, with 450 (96.0% in the age bracket) attending a public institution.
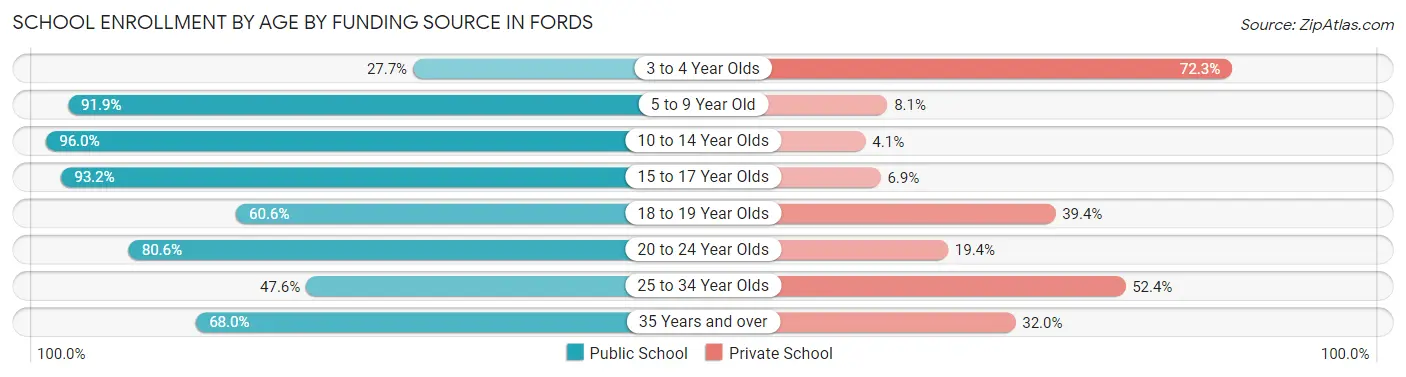
| Age Bracket | Public School | Private School |
| 3 to 4 Year Olds | 57 (27.7%) | 149 (72.3%) |
| 5 to 9 Year Old | 589 (91.9%) | 52 (8.1%) |
| 10 to 14 Year Olds | 450 (96.0%) | 19 (4.1%) |
| 15 to 17 Year Olds | 626 (93.1%) | 46 (6.9%) |
| 18 to 19 Year Olds | 183 (60.6%) | 119 (39.4%) |
| 20 to 24 Year Olds | 303 (80.6%) | 73 (19.4%) |
| 25 to 34 Year Olds | 78 (47.6%) | 86 (52.4%) |
| 35 Years and over | 166 (68.0%) | 78 (32.0%) |
| Total | 2,453 (79.8%) | 621 (20.2%) |
Educational Attainment by Field of Study in Fords
Business (1,000 | 28.5%), engineering (546 | 15.5%), education (303 | 8.6%), computers & mathematics (289 | 8.2%), and social sciences (231 | 6.6%) are the most common fields of study among 3,513 individuals in Fords who have obtained a bachelor's degree or higher.
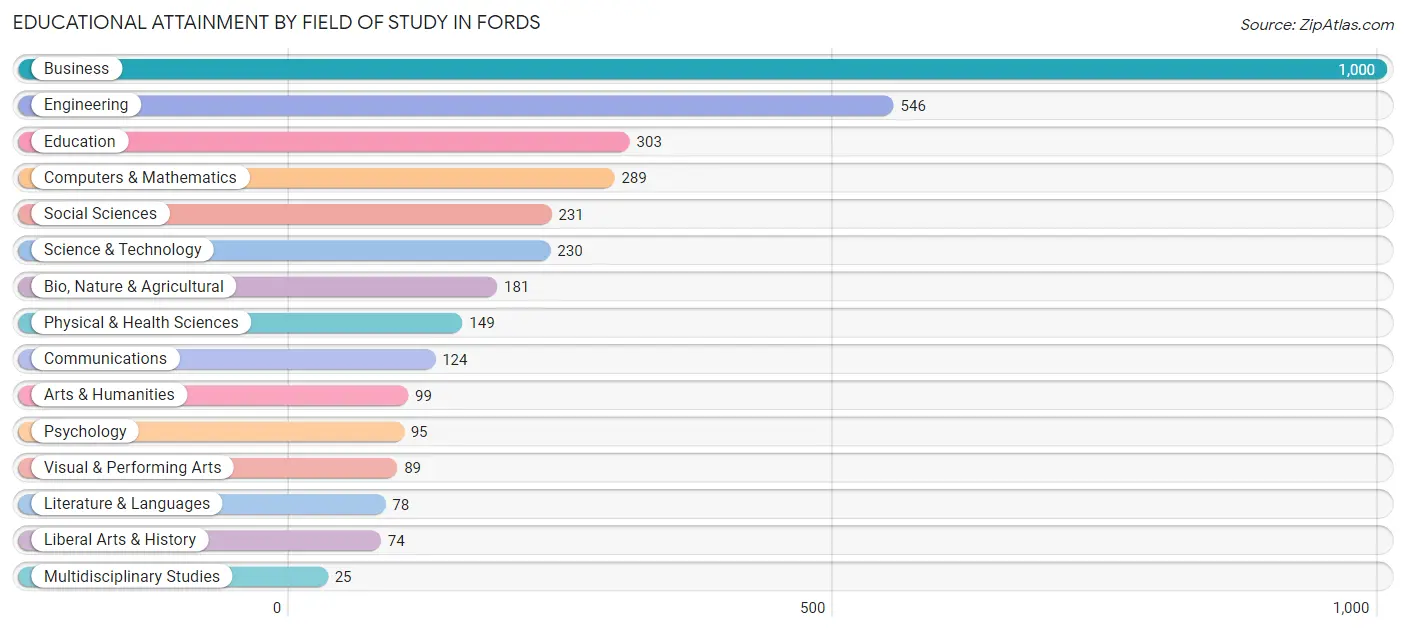
| Field of Study | # Graduates | % Graduates |
| Computers & Mathematics | 289 | 8.2% |
| Bio, Nature & Agricultural | 181 | 5.1% |
| Physical & Health Sciences | 149 | 4.2% |
| Psychology | 95 | 2.7% |
| Social Sciences | 231 | 6.6% |
| Engineering | 546 | 15.5% |
| Multidisciplinary Studies | 25 | 0.7% |
| Science & Technology | 230 | 6.6% |
| Business | 1,000 | 28.5% |
| Education | 303 | 8.6% |
| Literature & Languages | 78 | 2.2% |
| Liberal Arts & History | 74 | 2.1% |
| Visual & Performing Arts | 89 | 2.5% |
| Communications | 124 | 3.5% |
| Arts & Humanities | 99 | 2.8% |
| Total | 3,513 | 100.0% |
Transportation & Commute in Fords
Vehicle Availability by Sex in Fords
The most prevalent vehicle ownership categories in Fords are males with 2 vehicles (1,705, accounting for 48.1%) and females with 2 vehicles (1,462, making up 60.1%).
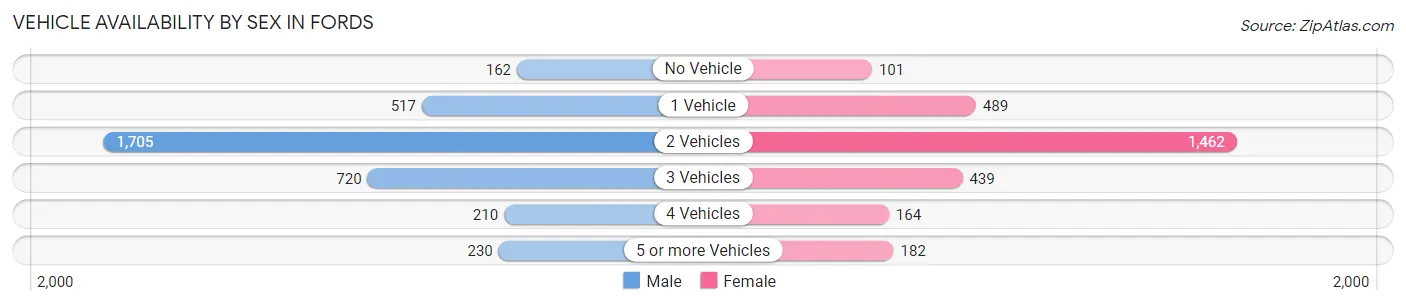
| Vehicles Available | Male | Female |
| No Vehicle | 162 (4.6%) | 101 (3.6%) |
| 1 Vehicle | 517 (14.6%) | 489 (17.2%) |
| 2 Vehicles | 1,705 (48.1%) | 1,462 (51.5%) |
| 3 Vehicles | 720 (20.3%) | 439 (15.5%) |
| 4 Vehicles | 210 (5.9%) | 164 (5.8%) |
| 5 or more Vehicles | 230 (6.5%) | 182 (6.4%) |
| Total | 3,544 (100.0%) | 2,837 (100.0%) |
Commute Time in Fords
The most frequently occuring commute durations in Fords are 15 to 19 minutes (1,056 commuters, 17.7%), 60 to 89 minutes (728 commuters, 12.2%), and 10 to 14 minutes (716 commuters, 12.0%).
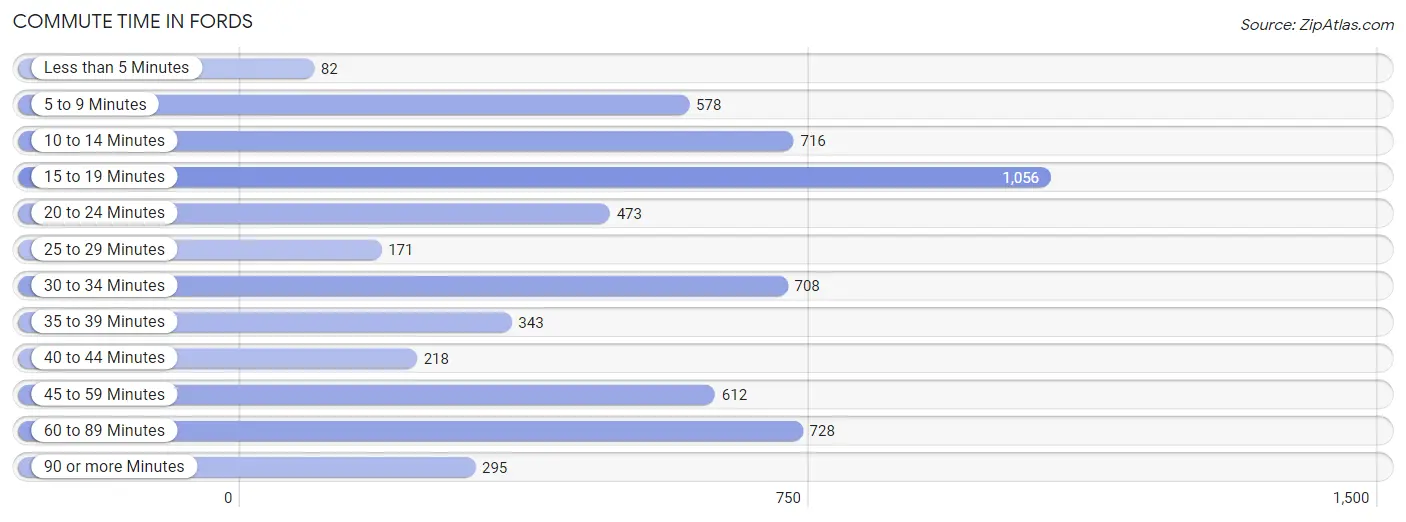
| Commute Time | # Commuters | % Commuters |
| Less than 5 Minutes | 82 | 1.4% |
| 5 to 9 Minutes | 578 | 9.7% |
| 10 to 14 Minutes | 716 | 12.0% |
| 15 to 19 Minutes | 1,056 | 17.7% |
| 20 to 24 Minutes | 473 | 7.9% |
| 25 to 29 Minutes | 171 | 2.9% |
| 30 to 34 Minutes | 708 | 11.8% |
| 35 to 39 Minutes | 343 | 5.7% |
| 40 to 44 Minutes | 218 | 3.6% |
| 45 to 59 Minutes | 612 | 10.2% |
| 60 to 89 Minutes | 728 | 12.2% |
| 90 or more Minutes | 295 | 4.9% |
Commute Time by Sex in Fords
The most common commute times in Fords are 60 to 89 minutes (436 commuters, 13.0%) for males and 15 to 19 minutes (632 commuters, 24.0%) for females.
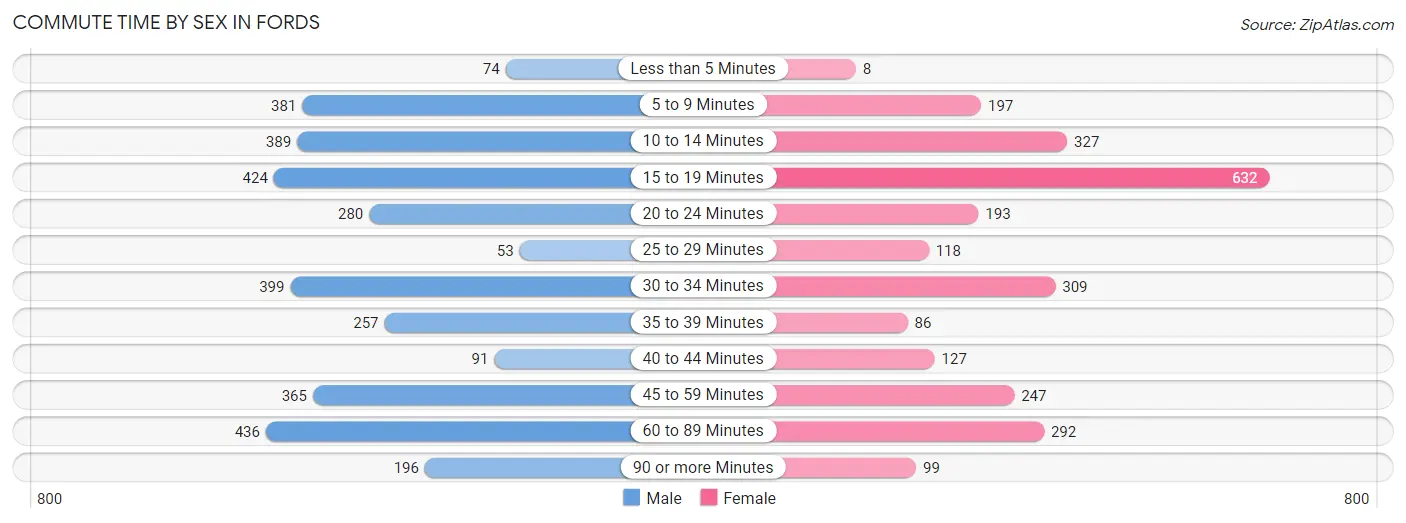
| Commute Time | Male | Female |
| Less than 5 Minutes | 74 (2.2%) | 8 (0.3%) |
| 5 to 9 Minutes | 381 (11.4%) | 197 (7.5%) |
| 10 to 14 Minutes | 389 (11.6%) | 327 (12.4%) |
| 15 to 19 Minutes | 424 (12.7%) | 632 (24.0%) |
| 20 to 24 Minutes | 280 (8.4%) | 193 (7.3%) |
| 25 to 29 Minutes | 53 (1.6%) | 118 (4.5%) |
| 30 to 34 Minutes | 399 (11.9%) | 309 (11.7%) |
| 35 to 39 Minutes | 257 (7.7%) | 86 (3.3%) |
| 40 to 44 Minutes | 91 (2.7%) | 127 (4.8%) |
| 45 to 59 Minutes | 365 (10.9%) | 247 (9.4%) |
| 60 to 89 Minutes | 436 (13.0%) | 292 (11.1%) |
| 90 or more Minutes | 196 (5.9%) | 99 (3.8%) |
Time of Departure to Work by Sex in Fords
The most frequent times of departure to work in Fords are 7:00 AM to 7:29 AM (490, 14.6%) for males and 6:30 AM to 6:59 AM (427, 16.2%) for females.
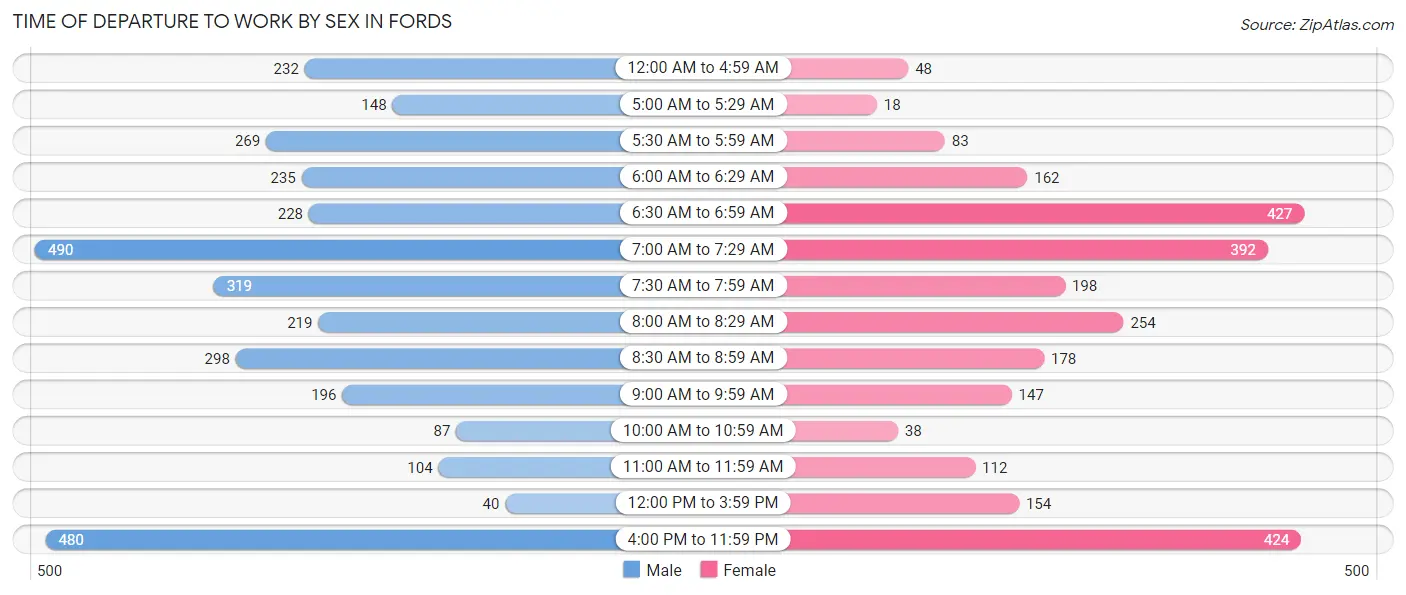
| Time of Departure | Male | Female |
| 12:00 AM to 4:59 AM | 232 (6.9%) | 48 (1.8%) |
| 5:00 AM to 5:29 AM | 148 (4.4%) | 18 (0.7%) |
| 5:30 AM to 5:59 AM | 269 (8.0%) | 83 (3.2%) |
| 6:00 AM to 6:29 AM | 235 (7.0%) | 162 (6.1%) |
| 6:30 AM to 6:59 AM | 228 (6.8%) | 427 (16.2%) |
| 7:00 AM to 7:29 AM | 490 (14.6%) | 392 (14.9%) |
| 7:30 AM to 7:59 AM | 319 (9.5%) | 198 (7.5%) |
| 8:00 AM to 8:29 AM | 219 (6.6%) | 254 (9.6%) |
| 8:30 AM to 8:59 AM | 298 (8.9%) | 178 (6.8%) |
| 9:00 AM to 9:59 AM | 196 (5.9%) | 147 (5.6%) |
| 10:00 AM to 10:59 AM | 87 (2.6%) | 38 (1.4%) |
| 11:00 AM to 11:59 AM | 104 (3.1%) | 112 (4.3%) |
| 12:00 PM to 3:59 PM | 40 (1.2%) | 154 (5.8%) |
| 4:00 PM to 11:59 PM | 480 (14.3%) | 424 (16.1%) |
| Total | 3,345 (100.0%) | 2,635 (100.0%) |
Housing Occupancy in Fords
Occupancy by Ownership in Fords
Of the total 4,438 dwellings in Fords, owner-occupied units account for 3,073 (69.2%), while renter-occupied units make up 1,365 (30.8%).
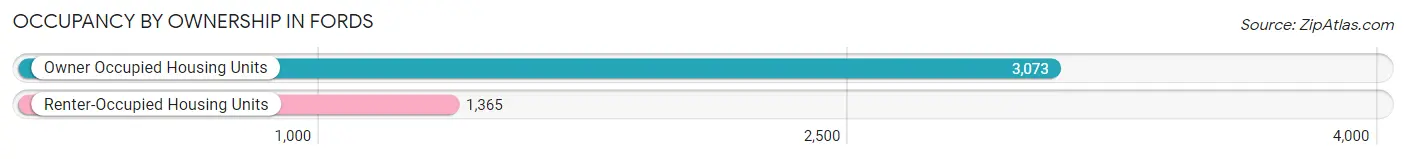
| Occupancy | # Housing Units | % Housing Units |
| Owner Occupied Housing Units | 3,073 | 69.2% |
| Renter-Occupied Housing Units | 1,365 | 30.8% |
| Total Occupied Housing Units | 4,438 | 100.0% |
Occupancy by Household Size in Fords
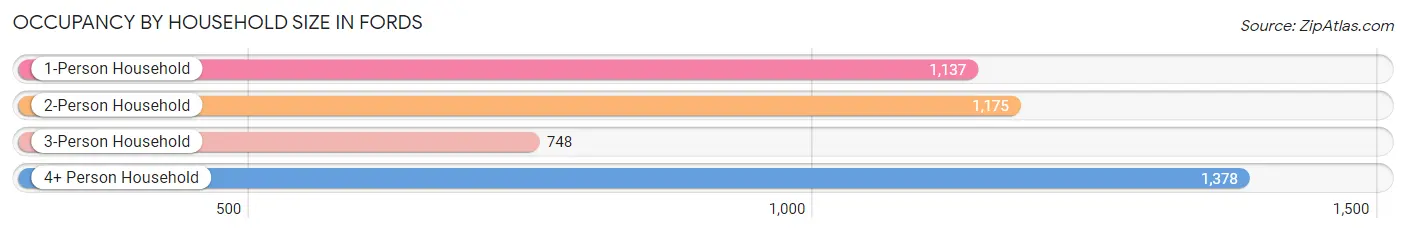
| Household Size | # Housing Units | % Housing Units |
| 1-Person Household | 1,137 | 25.6% |
| 2-Person Household | 1,175 | 26.5% |
| 3-Person Household | 748 | 16.9% |
| 4+ Person Household | 1,378 | 31.0% |
| Total Housing Units | 4,438 | 100.0% |
Occupancy by Ownership by Household Size in Fords
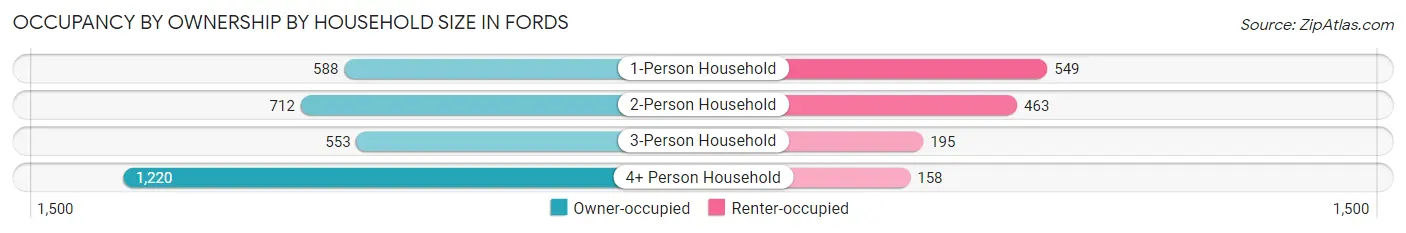
| Household Size | Owner-occupied | Renter-occupied |
| 1-Person Household | 588 (51.7%) | 549 (48.3%) |
| 2-Person Household | 712 (60.6%) | 463 (39.4%) |
| 3-Person Household | 553 (73.9%) | 195 (26.1%) |
| 4+ Person Household | 1,220 (88.5%) | 158 (11.5%) |
| Total Housing Units | 3,073 (69.2%) | 1,365 (30.8%) |
Occupancy by Educational Attainment in Fords
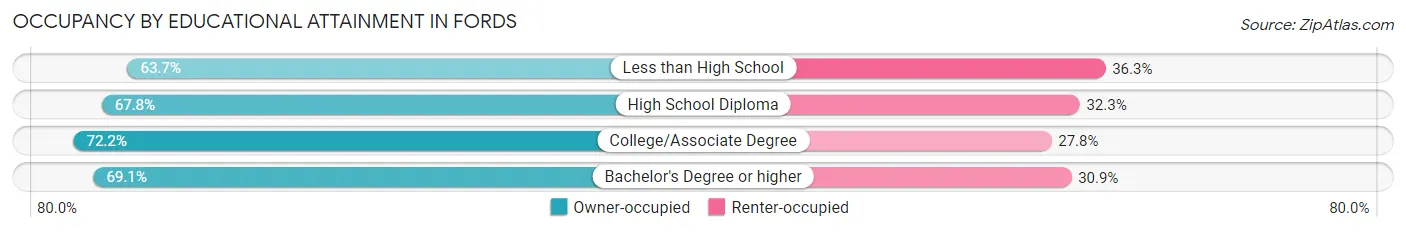
| Household Size | Owner-occupied | Renter-occupied |
| Less than High School | 191 (63.7%) | 109 (36.3%) |
| High School Diploma | 708 (67.7%) | 337 (32.3%) |
| College/Associate Degree | 861 (72.2%) | 331 (27.8%) |
| Bachelor's Degree or higher | 1,313 (69.1%) | 588 (30.9%) |
Occupancy by Age of Householder in Fords
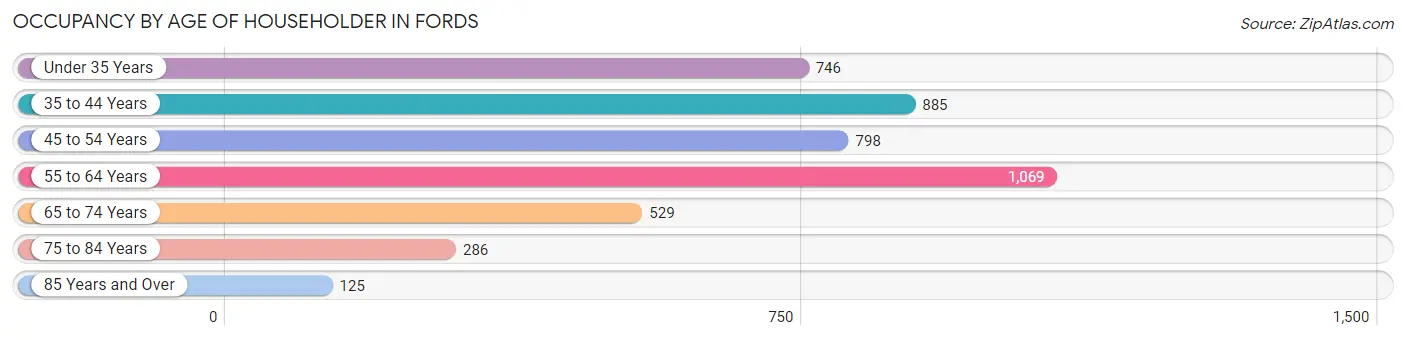
| Age Bracket | # Households | % Households |
| Under 35 Years | 746 | 16.8% |
| 35 to 44 Years | 885 | 19.9% |
| 45 to 54 Years | 798 | 18.0% |
| 55 to 64 Years | 1,069 | 24.1% |
| 65 to 74 Years | 529 | 11.9% |
| 75 to 84 Years | 286 | 6.4% |
| 85 Years and Over | 125 | 2.8% |
| Total | 4,438 | 100.0% |
Housing Finances in Fords
Median Income by Occupancy in Fords
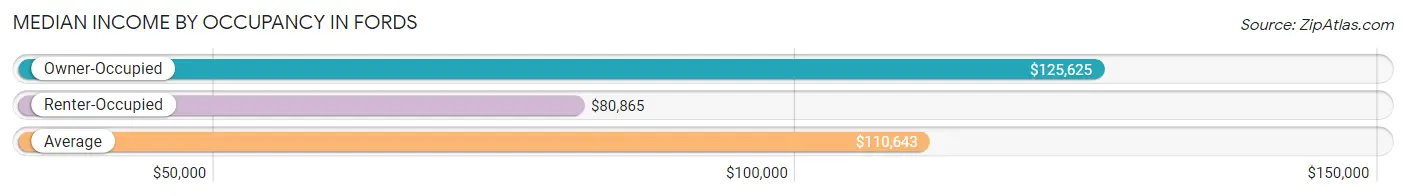
| Occupancy Type | # Households | Median Income |
| Owner-Occupied | 3,073 (69.2%) | $125,625 |
| Renter-Occupied | 1,365 (30.8%) | $80,865 |
| Average | 4,438 (100.0%) | $110,643 |
Occupancy by Householder Income Bracket in Fords
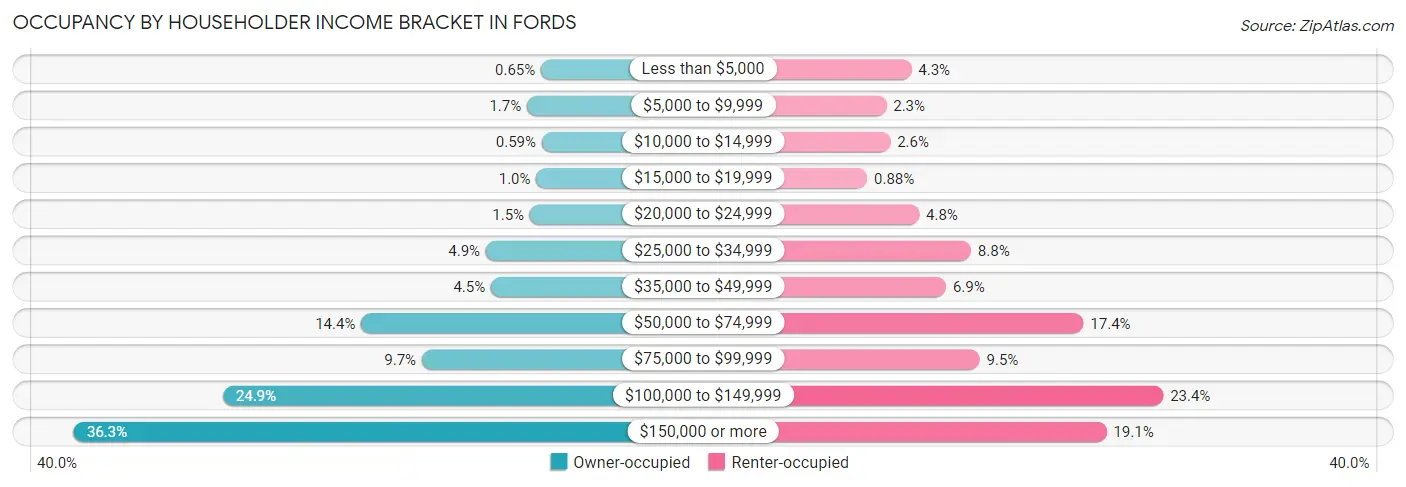
| Income Bracket | Owner-occupied | Renter-occupied |
| Less than $5,000 | 20 (0.6%) | 58 (4.3%) |
| $5,000 to $9,999 | 53 (1.7%) | 32 (2.3%) |
| $10,000 to $14,999 | 18 (0.6%) | 36 (2.6%) |
| $15,000 to $19,999 | 31 (1.0%) | 12 (0.9%) |
| $20,000 to $24,999 | 46 (1.5%) | 66 (4.8%) |
| $25,000 to $34,999 | 149 (4.9%) | 120 (8.8%) |
| $35,000 to $49,999 | 137 (4.5%) | 94 (6.9%) |
| $50,000 to $74,999 | 441 (14.3%) | 237 (17.4%) |
| $75,000 to $99,999 | 299 (9.7%) | 129 (9.5%) |
| $100,000 to $149,999 | 765 (24.9%) | 320 (23.4%) |
| $150,000 or more | 1,114 (36.2%) | 261 (19.1%) |
| Total | 3,073 (100.0%) | 1,365 (100.0%) |
Monthly Housing Cost Tiers in Fords
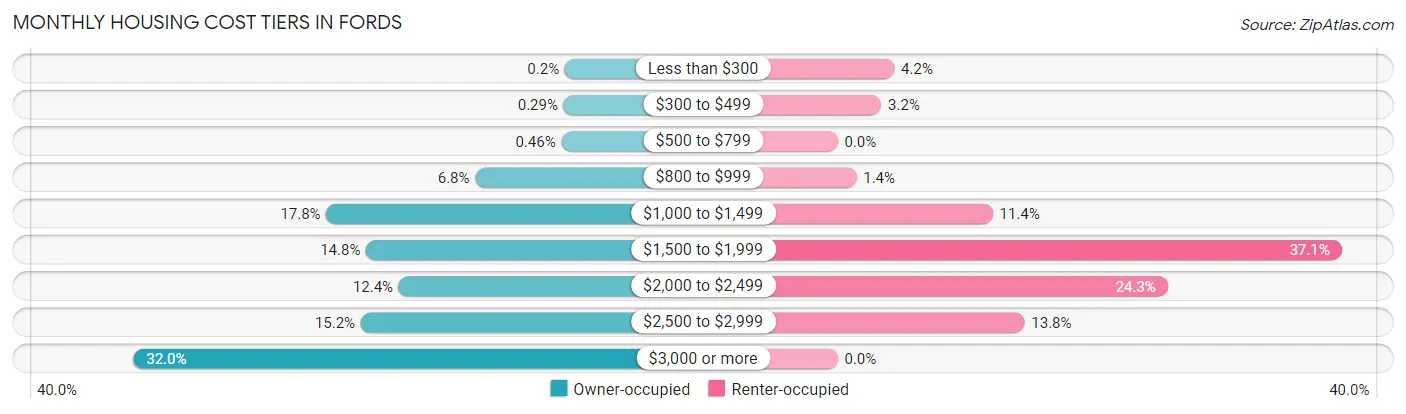
| Monthly Cost | Owner-occupied | Renter-occupied |
| Less than $300 | 6 (0.2%) | 57 (4.2%) |
| $300 to $499 | 9 (0.3%) | 44 (3.2%) |
| $500 to $799 | 14 (0.5%) | 0 (0.0%) |
| $800 to $999 | 209 (6.8%) | 19 (1.4%) |
| $1,000 to $1,499 | 546 (17.8%) | 156 (11.4%) |
| $1,500 to $1,999 | 456 (14.8%) | 507 (37.1%) |
| $2,000 to $2,499 | 382 (12.4%) | 332 (24.3%) |
| $2,500 to $2,999 | 468 (15.2%) | 188 (13.8%) |
| $3,000 or more | 983 (32.0%) | 0 (0.0%) |
| Total | 3,073 (100.0%) | 1,365 (100.0%) |
Physical Housing Characteristics in Fords
Housing Structures in Fords
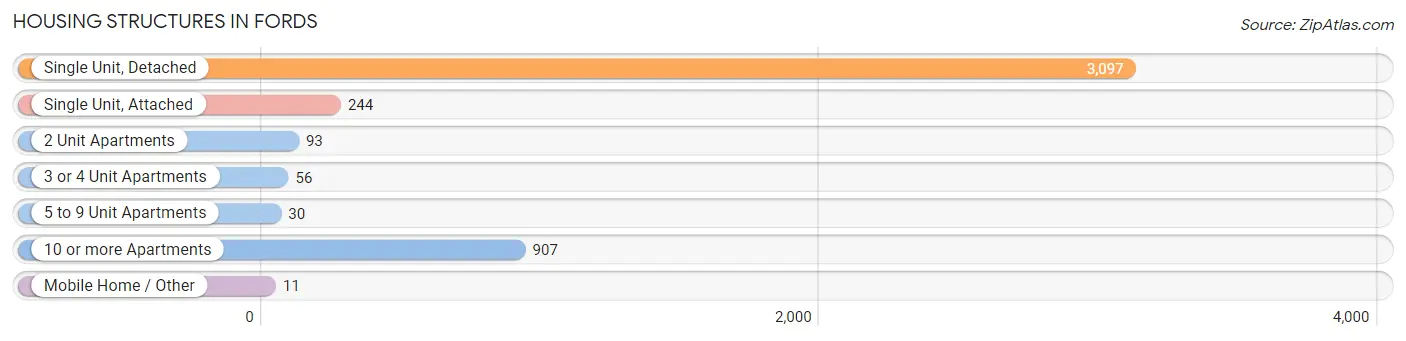
| Structure Type | # Housing Units | % Housing Units |
| Single Unit, Detached | 3,097 | 69.8% |
| Single Unit, Attached | 244 | 5.5% |
| 2 Unit Apartments | 93 | 2.1% |
| 3 or 4 Unit Apartments | 56 | 1.3% |
| 5 to 9 Unit Apartments | 30 | 0.7% |
| 10 or more Apartments | 907 | 20.4% |
| Mobile Home / Other | 11 | 0.3% |
| Total | 4,438 | 100.0% |
Housing Structures by Occupancy in Fords
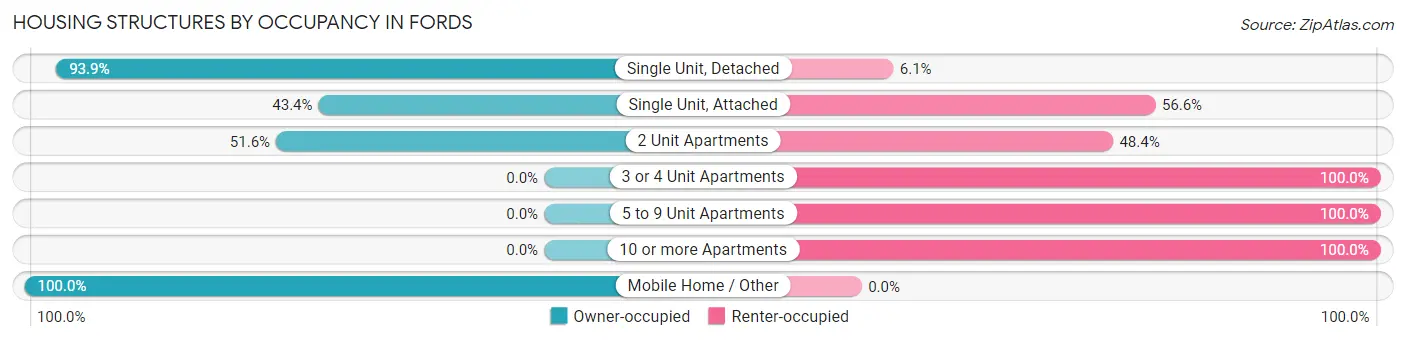
| Structure Type | Owner-occupied | Renter-occupied |
| Single Unit, Detached | 2,908 (93.9%) | 189 (6.1%) |
| Single Unit, Attached | 106 (43.4%) | 138 (56.6%) |
| 2 Unit Apartments | 48 (51.6%) | 45 (48.4%) |
| 3 or 4 Unit Apartments | 0 (0.0%) | 56 (100.0%) |
| 5 to 9 Unit Apartments | 0 (0.0%) | 30 (100.0%) |
| 10 or more Apartments | 0 (0.0%) | 907 (100.0%) |
| Mobile Home / Other | 11 (100.0%) | 0 (0.0%) |
| Total | 3,073 (69.2%) | 1,365 (30.8%) |
Housing Structures by Number of Rooms in Fords
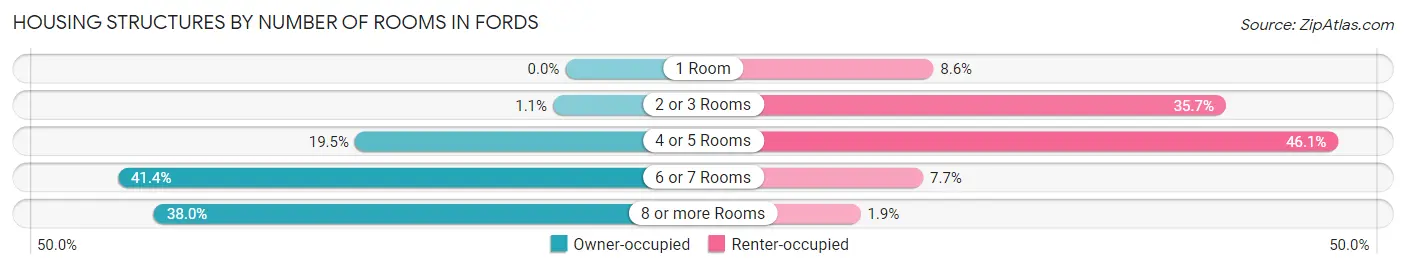
| Number of Rooms | Owner-occupied | Renter-occupied |
| 1 Room | 0 (0.0%) | 118 (8.6%) |
| 2 or 3 Rooms | 35 (1.1%) | 487 (35.7%) |
| 4 or 5 Rooms | 598 (19.5%) | 629 (46.1%) |
| 6 or 7 Rooms | 1,271 (41.4%) | 105 (7.7%) |
| 8 or more Rooms | 1,169 (38.0%) | 26 (1.9%) |
| Total | 3,073 (100.0%) | 1,365 (100.0%) |
Housing Structure by Heating Type in Fords
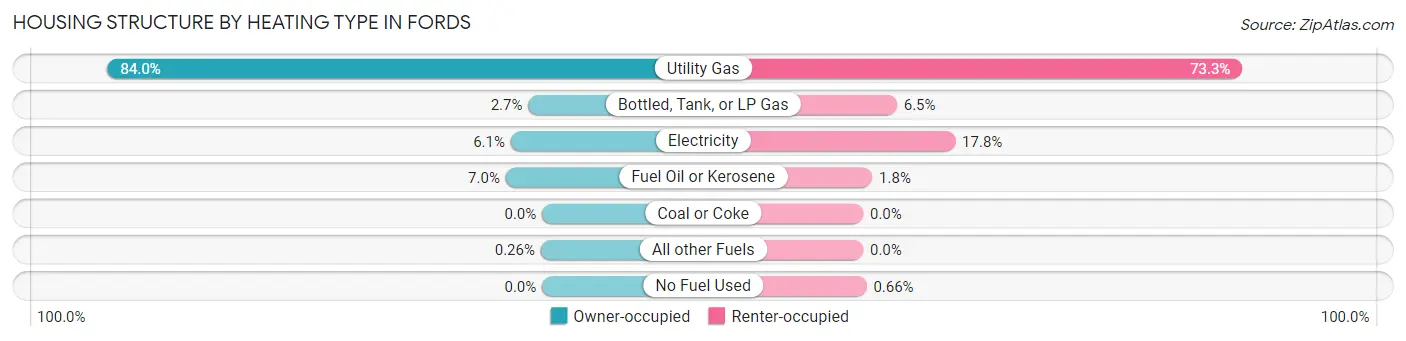
| Heating Type | Owner-occupied | Renter-occupied |
| Utility Gas | 2,581 (84.0%) | 1,000 (73.3%) |
| Bottled, Tank, or LP Gas | 82 (2.7%) | 89 (6.5%) |
| Electricity | 186 (6.0%) | 243 (17.8%) |
| Fuel Oil or Kerosene | 216 (7.0%) | 24 (1.8%) |
| Coal or Coke | 0 (0.0%) | 0 (0.0%) |
| All other Fuels | 8 (0.3%) | 0 (0.0%) |
| No Fuel Used | 0 (0.0%) | 9 (0.7%) |
| Total | 3,073 (100.0%) | 1,365 (100.0%) |
Household Vehicle Usage in Fords
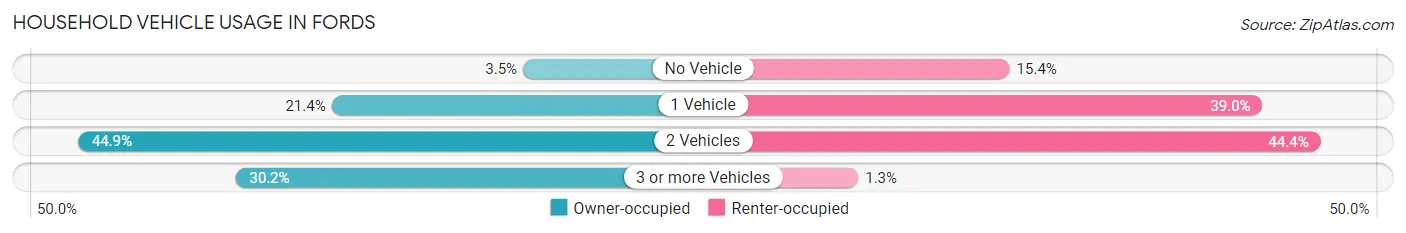
| Vehicles per Household | Owner-occupied | Renter-occupied |
| No Vehicle | 107 (3.5%) | 210 (15.4%) |
| 1 Vehicle | 656 (21.3%) | 532 (39.0%) |
| 2 Vehicles | 1,381 (44.9%) | 606 (44.4%) |
| 3 or more Vehicles | 929 (30.2%) | 17 (1.3%) |
| Total | 3,073 (100.0%) | 1,365 (100.0%) |
Real Estate & Mortgages in Fords
Real Estate and Mortgage Overview in Fords
| Characteristic | Without Mortgage | With Mortgage |
| Housing Units | 889 | 2,184 |
| Median Property Value | $376,600 | $385,400 |
| Median Household Income | $88,365 | $826 |
| Monthly Housing Costs | $1,234 | $976 |
| Real Estate Taxes | $9,464 | $13 |
Property Value by Mortgage Status in Fords
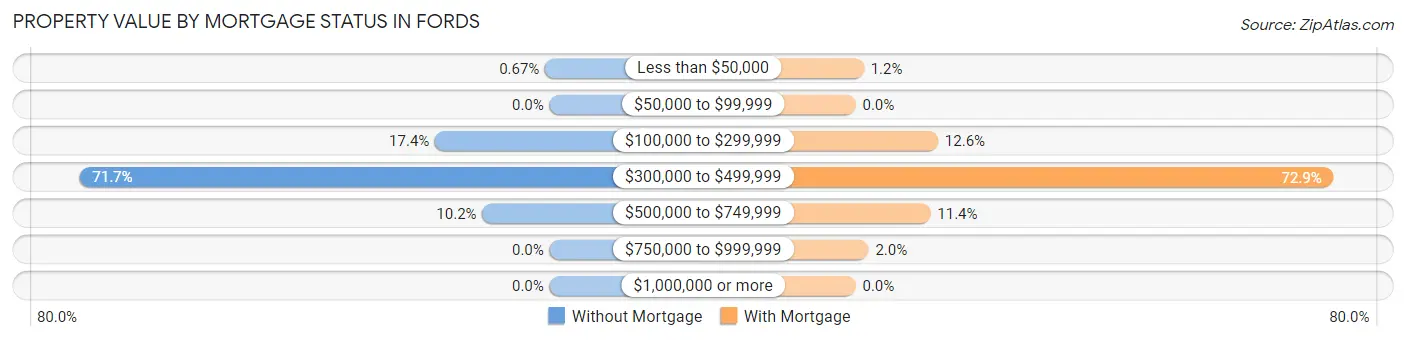
| Property Value | Without Mortgage | With Mortgage |
| Less than $50,000 | 6 (0.7%) | 27 (1.2%) |
| $50,000 to $99,999 | 0 (0.0%) | 0 (0.0%) |
| $100,000 to $299,999 | 155 (17.4%) | 274 (12.6%) |
| $300,000 to $499,999 | 637 (71.7%) | 1,591 (72.9%) |
| $500,000 to $749,999 | 91 (10.2%) | 249 (11.4%) |
| $750,000 to $999,999 | 0 (0.0%) | 43 (2.0%) |
| $1,000,000 or more | 0 (0.0%) | 0 (0.0%) |
| Total | 889 (100.0%) | 2,184 (100.0%) |
Household Income by Mortgage Status in Fords
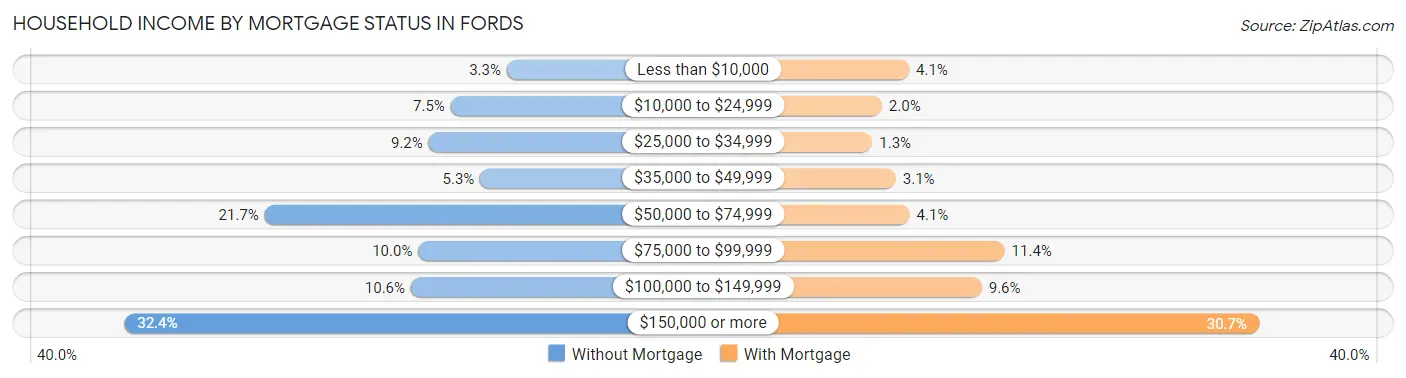
| Household Income | Without Mortgage | With Mortgage |
| Less than $10,000 | 29 (3.3%) | 89 (4.1%) |
| $10,000 to $24,999 | 67 (7.5%) | 44 (2.0%) |
| $25,000 to $34,999 | 82 (9.2%) | 28 (1.3%) |
| $35,000 to $49,999 | 47 (5.3%) | 67 (3.1%) |
| $50,000 to $74,999 | 193 (21.7%) | 90 (4.1%) |
| $75,000 to $99,999 | 89 (10.0%) | 248 (11.4%) |
| $100,000 to $149,999 | 94 (10.6%) | 210 (9.6%) |
| $150,000 or more | 288 (32.4%) | 671 (30.7%) |
| Total | 889 (100.0%) | 2,184 (100.0%) |
Property Value to Household Income Ratio in Fords
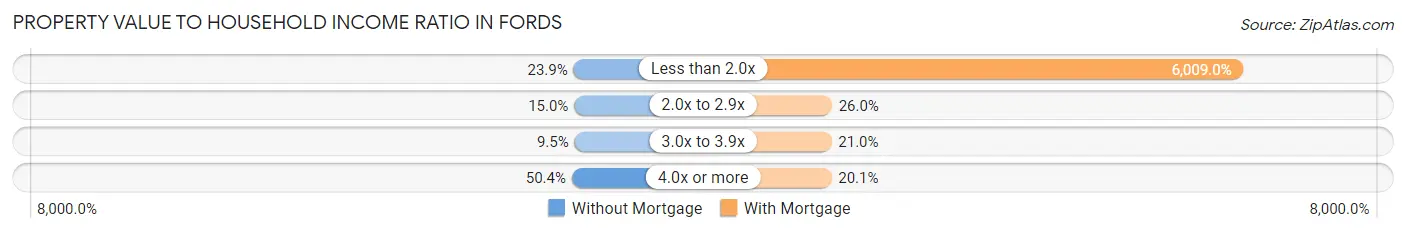
| Value-to-Income Ratio | Without Mortgage | With Mortgage |
| Less than 2.0x | 212 (23.8%) | 131,237 (6,009.0%) |
| 2.0x to 2.9x | 133 (15.0%) | 567 (26.0%) |
| 3.0x to 3.9x | 84 (9.5%) | 458 (21.0%) |
| 4.0x or more | 448 (50.4%) | 438 (20.1%) |
| Total | 889 (100.0%) | 2,184 (100.0%) |
Real Estate Taxes by Mortgage Status in Fords
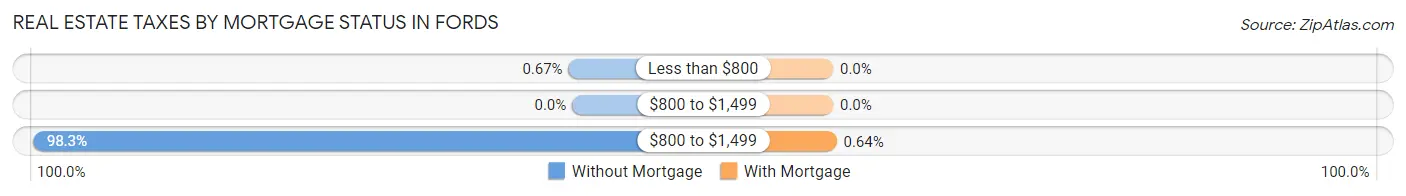
| Property Taxes | Without Mortgage | With Mortgage |
| Less than $800 | 6 (0.7%) | 0 (0.0%) |
| $800 to $1,499 | 0 (0.0%) | 0 (0.0%) |
| $800 to $1,499 | 874 (98.3%) | 14 (0.6%) |
| Total | 889 (100.0%) | 2,184 (100.0%) |
Health & Disability in Fords
Health Insurance Coverage by Age in Fords
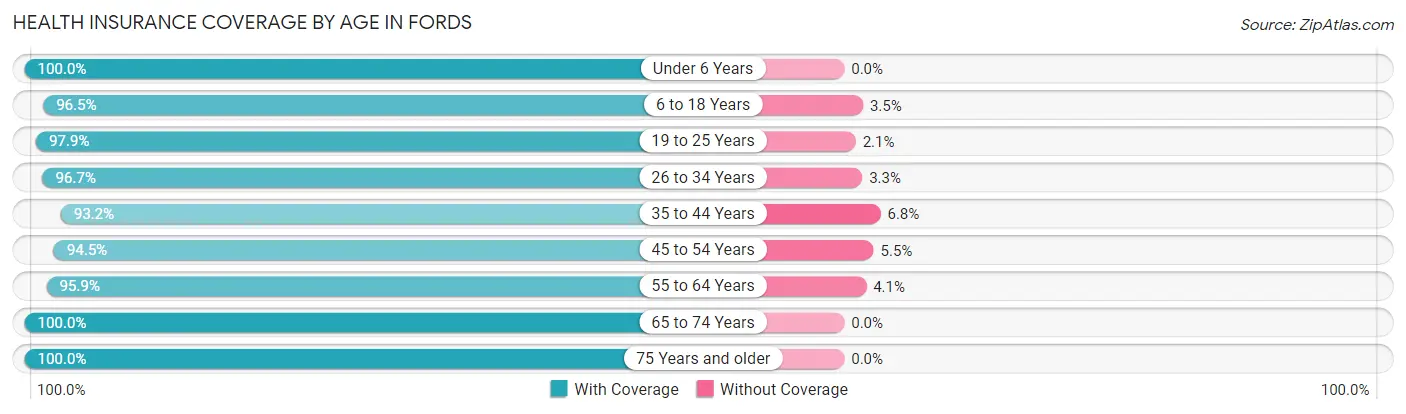
| Age Bracket | With Coverage | Without Coverage |
| Under 6 Years | 1,098 (100.0%) | 0 (0.0%) |
| 6 to 18 Years | 1,638 (96.5%) | 59 (3.5%) |
| 19 to 25 Years | 1,148 (97.9%) | 25 (2.1%) |
| 26 to 34 Years | 1,623 (96.7%) | 56 (3.3%) |
| 35 to 44 Years | 1,753 (93.2%) | 127 (6.8%) |
| 45 to 54 Years | 1,486 (94.5%) | 86 (5.5%) |
| 55 to 64 Years | 1,831 (95.9%) | 78 (4.1%) |
| 65 to 74 Years | 1,003 (100.0%) | 0 (0.0%) |
| 75 Years and older | 652 (100.0%) | 0 (0.0%) |
| Total | 12,232 (96.6%) | 431 (3.4%) |
Health Insurance Coverage by Citizenship Status in Fords
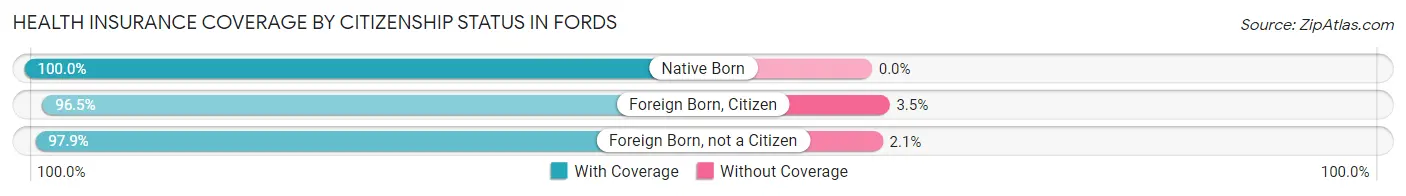
| Citizenship Status | With Coverage | Without Coverage |
| Native Born | 1,098 (100.0%) | 0 (0.0%) |
| Foreign Born, Citizen | 1,638 (96.5%) | 59 (3.5%) |
| Foreign Born, not a Citizen | 1,148 (97.9%) | 25 (2.1%) |
Health Insurance Coverage by Household Income in Fords
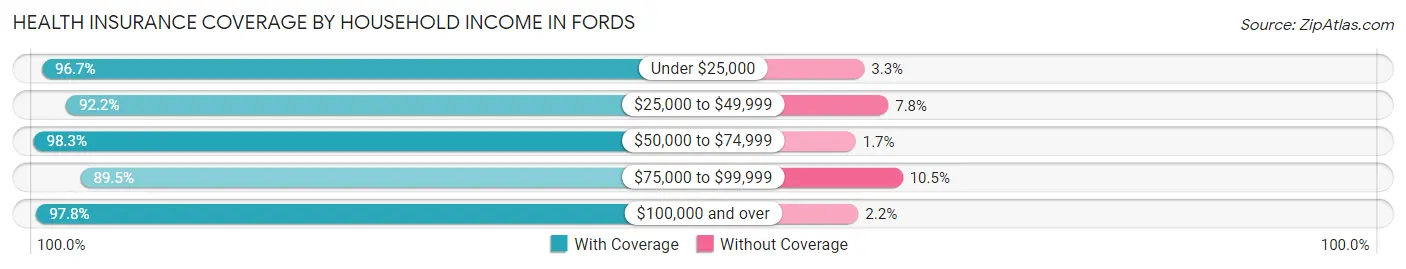
| Household Income | With Coverage | Without Coverage |
| Under $25,000 | 382 (96.7%) | 13 (3.3%) |
| $25,000 to $49,999 | 1,152 (92.2%) | 97 (7.8%) |
| $50,000 to $74,999 | 1,515 (98.3%) | 26 (1.7%) |
| $75,000 to $99,999 | 957 (89.5%) | 112 (10.5%) |
| $100,000 and over | 8,226 (97.8%) | 183 (2.2%) |
Public vs Private Health Insurance Coverage by Age in Fords
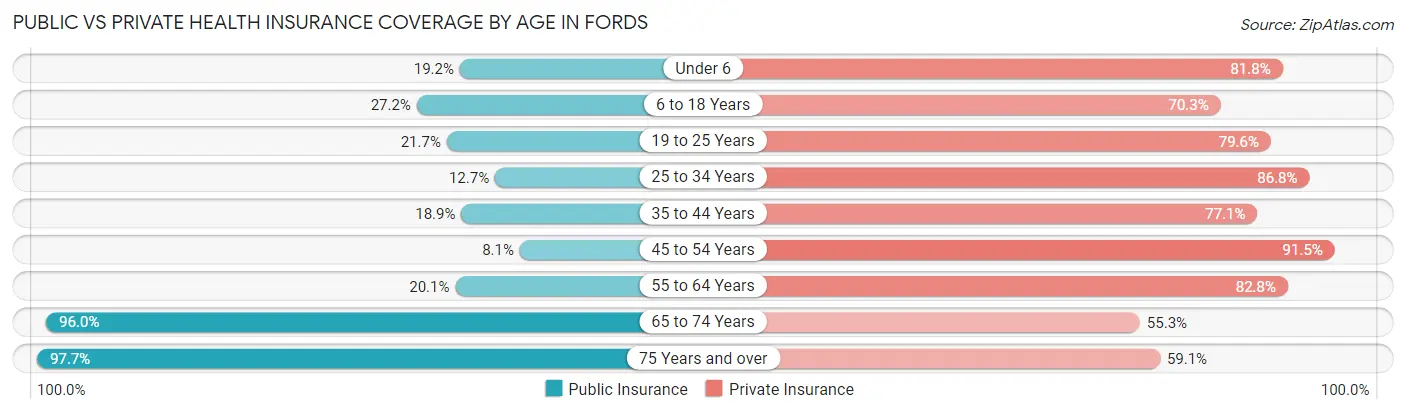
| Age Bracket | Public Insurance | Private Insurance |
| Under 6 | 211 (19.2%) | 898 (81.8%) |
| 6 to 18 Years | 462 (27.2%) | 1,193 (70.3%) |
| 19 to 25 Years | 254 (21.6%) | 934 (79.6%) |
| 25 to 34 Years | 213 (12.7%) | 1,457 (86.8%) |
| 35 to 44 Years | 356 (18.9%) | 1,450 (77.1%) |
| 45 to 54 Years | 127 (8.1%) | 1,438 (91.5%) |
| 55 to 64 Years | 383 (20.1%) | 1,580 (82.8%) |
| 65 to 74 Years | 963 (96.0%) | 555 (55.3%) |
| 75 Years and over | 637 (97.7%) | 385 (59.1%) |
| Total | 3,606 (28.5%) | 9,890 (78.1%) |
Disability Status by Sex by Age in Fords
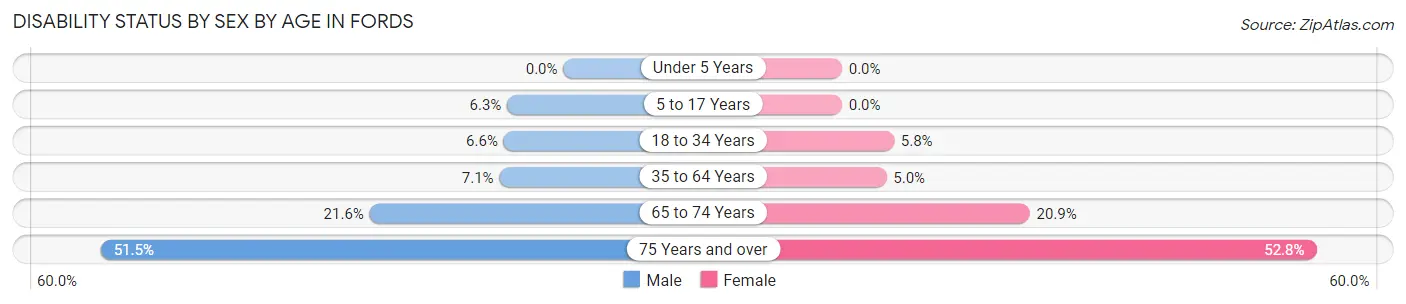
| Age Bracket | Male | Female |
| Under 5 Years | 0 (0.0%) | 0 (0.0%) |
| 5 to 17 Years | 67 (6.3%) | 0 (0.0%) |
| 18 to 34 Years | 108 (6.6%) | 75 (5.8%) |
| 35 to 64 Years | 188 (7.1%) | 135 (5.0%) |
| 65 to 74 Years | 107 (21.6%) | 106 (20.9%) |
| 75 Years and over | 136 (51.5%) | 205 (52.8%) |
Disability Class by Sex by Age in Fords
Disability Class: Hearing Difficulty
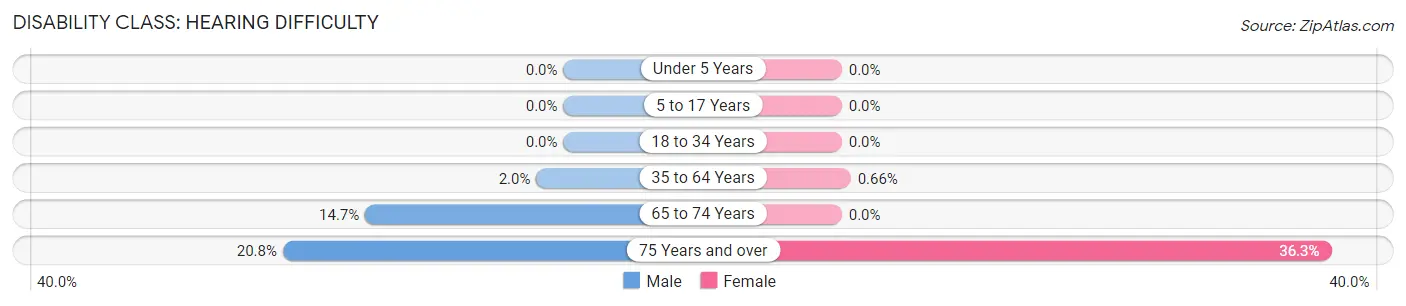
| Age Bracket | Male | Female |
| Under 5 Years | 0 (0.0%) | 0 (0.0%) |
| 5 to 17 Years | 0 (0.0%) | 0 (0.0%) |
| 18 to 34 Years | 0 (0.0%) | 0 (0.0%) |
| 35 to 64 Years | 53 (2.0%) | 18 (0.7%) |
| 65 to 74 Years | 73 (14.7%) | 0 (0.0%) |
| 75 Years and over | 55 (20.8%) | 141 (36.3%) |
Disability Class: Vision Difficulty
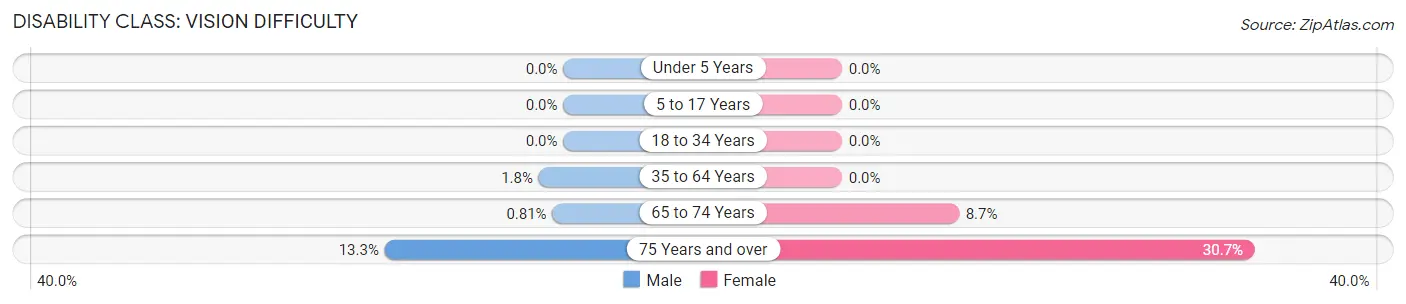
| Age Bracket | Male | Female |
| Under 5 Years | 0 (0.0%) | 0 (0.0%) |
| 5 to 17 Years | 0 (0.0%) | 0 (0.0%) |
| 18 to 34 Years | 0 (0.0%) | 0 (0.0%) |
| 35 to 64 Years | 48 (1.8%) | 0 (0.0%) |
| 65 to 74 Years | 4 (0.8%) | 44 (8.7%) |
| 75 Years and over | 35 (13.3%) | 119 (30.7%) |
Disability Class: Cognitive Difficulty
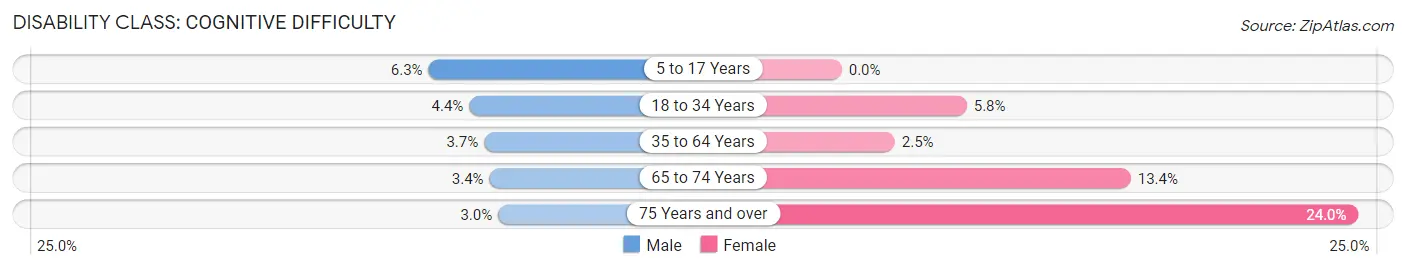
| Age Bracket | Male | Female |
| 5 to 17 Years | 67 (6.3%) | 0 (0.0%) |
| 18 to 34 Years | 71 (4.4%) | 75 (5.8%) |
| 35 to 64 Years | 97 (3.7%) | 67 (2.5%) |
| 65 to 74 Years | 17 (3.4%) | 68 (13.4%) |
| 75 Years and over | 8 (3.0%) | 93 (24.0%) |
Disability Class: Ambulatory Difficulty
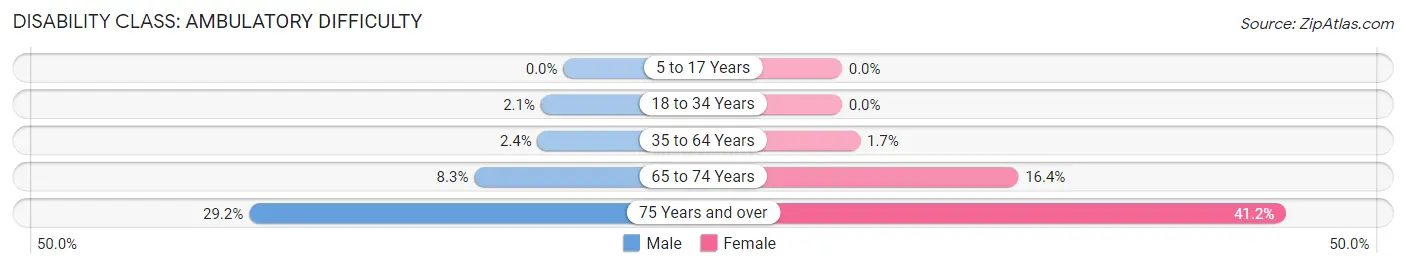
| Age Bracket | Male | Female |
| 5 to 17 Years | 0 (0.0%) | 0 (0.0%) |
| 18 to 34 Years | 34 (2.1%) | 0 (0.0%) |
| 35 to 64 Years | 63 (2.4%) | 46 (1.7%) |
| 65 to 74 Years | 41 (8.3%) | 83 (16.4%) |
| 75 Years and over | 77 (29.2%) | 160 (41.2%) |
Disability Class: Self-Care Difficulty
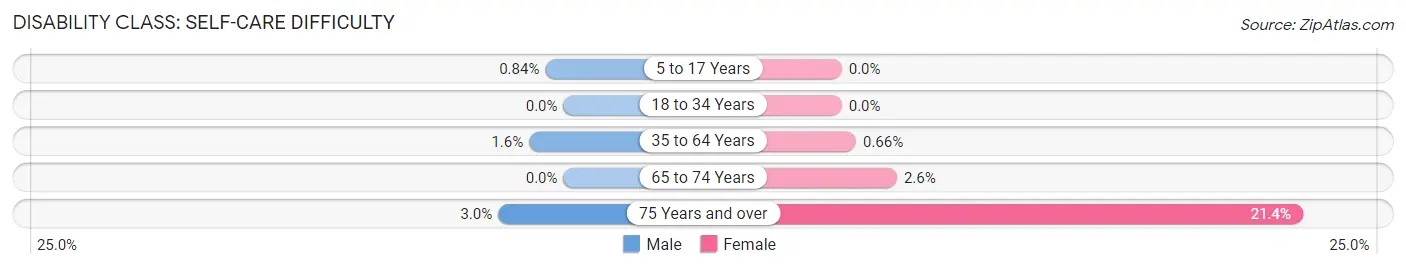
| Age Bracket | Male | Female |
| 5 to 17 Years | 9 (0.8%) | 0 (0.0%) |
| 18 to 34 Years | 0 (0.0%) | 0 (0.0%) |
| 35 to 64 Years | 42 (1.6%) | 18 (0.7%) |
| 65 to 74 Years | 0 (0.0%) | 13 (2.6%) |
| 75 Years and over | 8 (3.0%) | 83 (21.4%) |
Technology Access in Fords
Computing Device Access in Fords
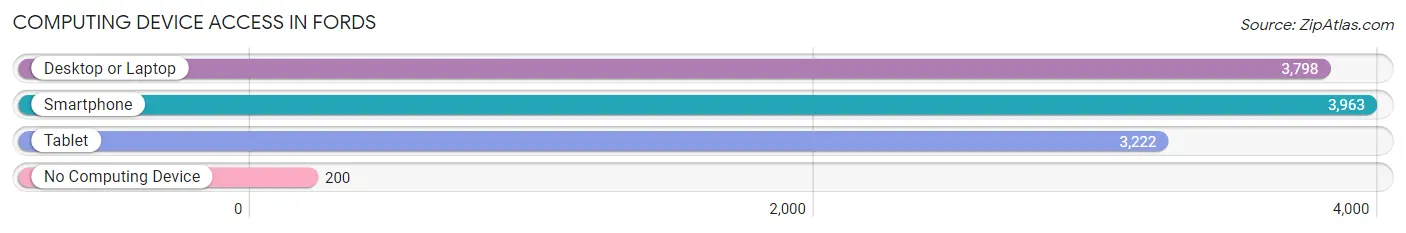
| Device Type | # Households | % Households |
| Desktop or Laptop | 3,798 | 85.6% |
| Smartphone | 3,963 | 89.3% |
| Tablet | 3,222 | 72.6% |
| No Computing Device | 200 | 4.5% |
| Total | 4,438 | 100.0% |
Internet Access in Fords
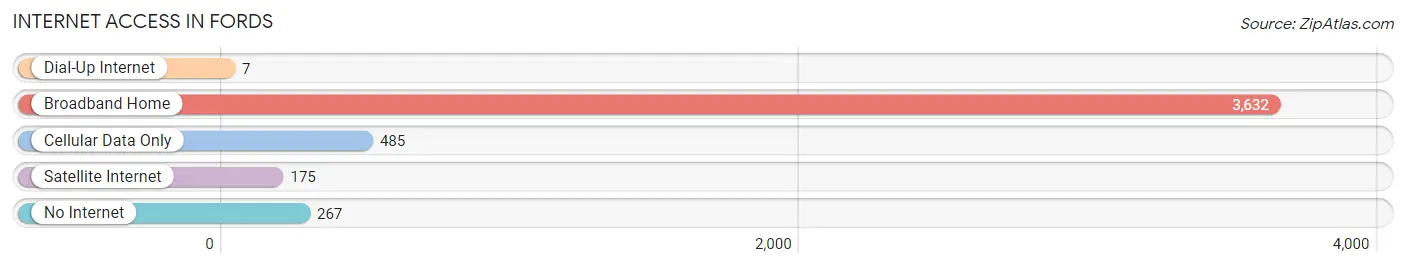
| Internet Type | # Households | % Households |
| Dial-Up Internet | 7 | 0.2% |
| Broadband Home | 3,632 | 81.8% |
| Cellular Data Only | 485 | 10.9% |
| Satellite Internet | 175 | 3.9% |
| No Internet | 267 | 6.0% |
| Total | 4,438 | 100.0% |
Fords Summary
Fords, NJ is a small borough located in Middlesex County, New Jersey. It is situated on the Raritan River, and is part of the larger New York metropolitan area. The borough has a population of 8,841 as of the 2010 census, and is home to a diverse population of people from all walks of life.
History
Fords, NJ was first settled in 1683 by Dutch settlers, who named the area after the Ford family, who owned the land. The area was originally part of Woodbridge Township, and was incorporated as a borough in 1906. The borough was named after the Ford family, who had owned the land since the 1600s.
Geography
Fords, NJ is located in Middlesex County, New Jersey. It is situated on the Raritan River, and is part of the larger New York metropolitan area. The borough has a total area of 1.3 square miles, all of which is land. The borough is bordered by Woodbridge Township to the north, Rahway to the east, and Perth Amboy to the south.
Economy
Fords, NJ has a diverse economy, with a variety of businesses and industries. The borough is home to several large companies, including the Ford Motor Company, which has a large manufacturing plant in the area. Other major employers in the area include the New Jersey Turnpike Authority, the Port Authority of New York and New Jersey, and the New Jersey Department of Transportation.
The borough also has a thriving retail sector, with several shopping centers and malls located in the area. The borough is also home to several restaurants, bars, and other entertainment venues.
Demographics
As of the 2010 census, Fords, NJ had a population of 8,841. The racial makeup of the borough was 64.3% White, 15.2% African American, 0.4% Native American, 8.2% Asian, 0.1% Pacific Islander, 8.2% from other races, and 3.7% from two or more races. Hispanic or Latino of any race were 18.3% of the population.
The median income for a household in the borough was $60,945, and the median income for a family was $71,945. The per capita income for the borough was $27,945. About 6.3% of families and 8.2% of the population were below the poverty line, including 10.2% of those under age 18 and 8.2% of those age 65 or over.
Fords, NJ is a diverse borough with a rich history and a vibrant economy. The borough is home to a variety of businesses and industries, and is a great place to live and work. The borough has a diverse population, with people from all walks of life. Fords, NJ is a great place to call home.
Common Questions
What is Per Capita Income in Fords?
Per Capita income in Fords is $45,315.
What is the Median Family Income in Fords?
Median Family Income in Fords is $127,528.
What is the Median Household income in Fords?
Median Household Income in Fords is $110,643.
What is Income or Wage Gap in Fords?
Income or Wage Gap in Fords is 27.3%.
Women in Fords earn 72.7 cents for every dollar earned by a man.
What is Inequality or Gini Index in Fords?
Inequality or Gini Index in Fords is 0.40.
What is the Total Population of Fords?
Total Population of Fords is 12,663.
What is the Total Male Population of Fords?
Total Male Population of Fords is 6,576.
What is the Total Female Population of Fords?
Total Female Population of Fords is 6,087.
What is the Ratio of Males per 100 Females in Fords?
There are 108.03 Males per 100 Females in Fords.
What is the Ratio of Females per 100 Males in Fords?
There are 92.56 Females per 100 Males in Fords.
What is the Median Population Age in Fords?
Median Population Age in Fords is 39.3 Years.
What is the Average Family Size in Fords
Average Family Size in Fords is 3.6 People.
What is the Average Household Size in Fords
Average Household Size in Fords is 2.9 People.
How Large is the Labor Force in Fords?
There are 6,830 People in the Labor Forcein in Fords.
What is the Percentage of People in the Labor Force in Fords?
65.1% of People are in the Labor Force in Fords.
What is the Unemployment Rate in Fords?
Unemployment Rate in Fords is 5.0%.