Cities with the Highest Percentage of Hispanic or Latino Population in Missouri
RELATED REPORTS & OPTIONS
Hispanic or Latino
Missouri
Compare Cities
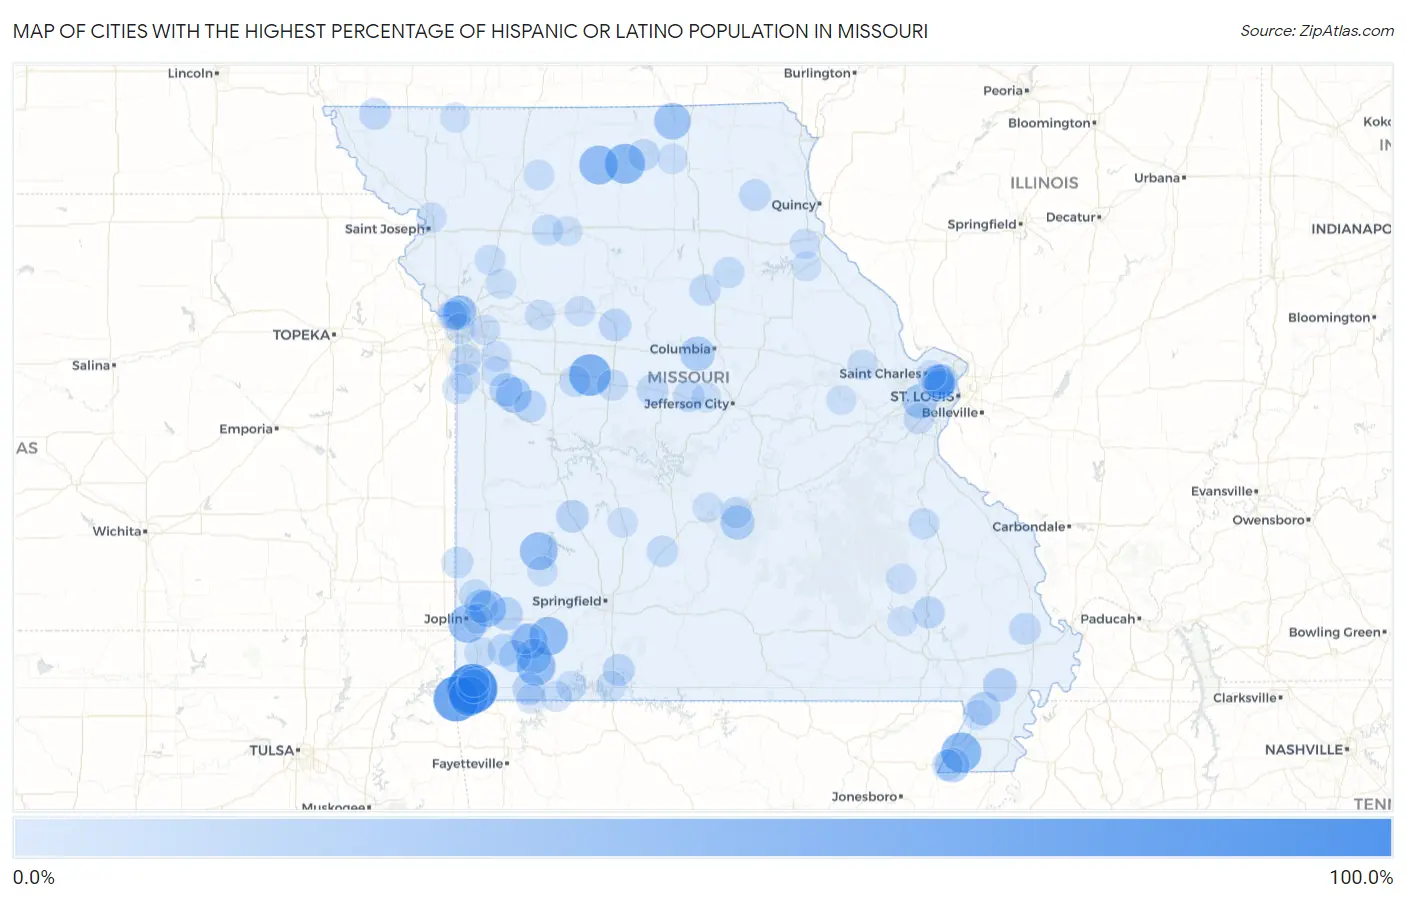
Map of Cities with the Highest Percentage of Hispanic or Latino Population in Missouri
0.0%
100.0%
Cities with the Highest Percentage of Hispanic or Latino Population in Missouri
| City | Hispanic or Latino | vs State | vs National | |
| 1. | Ginger Blue | 84.1% | 4.6%(+79.5)#1 | 18.7%(+65.4)#915 |
| 2. | Southwest City | 67.8% | 4.6%(+63.3)#2 | 18.7%(+49.2)#1,313 |
| 3. | La Monte | 52.8% | 4.6%(+48.2)#3 | 18.7%(+34.1)#1,842 |
| 4. | Senath | 46.1% | 4.6%(+41.5)#4 | 18.7%(+27.4)#2,159 |
| 5. | Milan | 45.8% | 4.6%(+41.2)#5 | 18.7%(+27.1)#2,169 |
| 6. | Noel | 44.9% | 4.6%(+40.3)#6 | 18.7%(+26.2)#2,213 |
| 7. | Osgood | 41.7% | 4.6%(+37.1)#7 | 18.7%(+23.0)#2,405 |
| 8. | Butterfield | 40.9% | 4.6%(+36.3)#8 | 18.7%(+22.2)#2,448 |
| 9. | Verona | 40.4% | 4.6%(+35.8)#9 | 18.7%(+21.7)#2,488 |
| 10. | Dennis Acres | 38.5% | 4.6%(+33.9)#10 | 18.7%(+19.8)#2,614 |
| 11. | Arcola | 37.5% | 4.6%(+32.9)#11 | 18.7%(+18.8)#2,685 |
| 12. | Carthage | 33.4% | 4.6%(+28.9)#12 | 18.7%(+14.8)#3,023 |
| 13. | Livonia | 33.3% | 4.6%(+28.8)#13 | 18.7%(+14.7)#3,038 |
| 14. | Monett | 29.8% | 4.6%(+25.2)#14 | 18.7%(+11.1)#3,425 |
| 15. | La Tour | 28.2% | 4.6%(+23.7)#15 | 18.7%(+9.56)#3,605 |
| 16. | Purdy | 27.8% | 4.6%(+23.3)#16 | 18.7%(+9.15)#3,652 |
| 17. | Winchester | 25.8% | 4.6%(+21.3)#17 | 18.7%(+7.20)#3,908 |
| 18. | Arbyrd | 25.5% | 4.6%(+20.9)#18 | 18.7%(+6.82)#3,964 |
| 19. | Woodson Terrace | 25.3% | 4.6%(+20.7)#19 | 18.7%(+6.63)#3,979 |
| 20. | Huntsdale | 25.0% | 4.6%(+20.4)#20 | 18.7%(+6.35)#4,019 |
| 21. | Fort Leonard Wood | 23.9% | 4.6%(+19.4)#21 | 18.7%(+5.25)#4,204 |
| 22. | Oaks | 23.5% | 4.6%(+18.9)#22 | 18.7%(+4.85)#4,266 |
| 23. | Lanagan | 22.4% | 4.6%(+17.9)#23 | 18.7%(+3.75)#4,465 |
| 24. | Clarkton | 21.8% | 4.6%(+17.2)#24 | 18.7%(+3.10)#4,586 |
| 25. | Parma | 21.7% | 4.6%(+17.1)#25 | 18.7%(+3.03)#4,597 |
| 26. | Gunn City | 21.4% | 4.6%(+16.9)#26 | 18.7%(+2.78)#4,655 |
| 27. | Brooklyn Heights | 21.2% | 4.6%(+16.7)#27 | 18.7%(+2.59)#4,692 |
| 28. | Breckenridge Hills | 20.9% | 4.6%(+16.4)#28 | 18.7%(+2.26)#4,764 |
| 29. | Reeds | 20.3% | 4.6%(+15.7)#29 | 18.7%(+1.62)#4,900 |
| 30. | Blue Summit | 18.8% | 4.6%(+14.2)#30 | 18.7%(+0.146)#5,229 |
| 31. | Humansville | 18.6% | 4.6%(+14.1)#31 | 18.7%(-0.021)#5,268 |
| 32. | Washburn | 18.5% | 4.6%(+14.0)#32 | 18.7%(-0.133)#5,294 |
| 33. | Stark City | 17.4% | 4.6%(+12.8)#33 | 18.7%(-1.29)#5,621 |
| 34. | Fairview | 17.3% | 4.6%(+12.8)#34 | 18.7%(-1.32)#5,631 |
| 35. | Marshall | 17.2% | 4.6%(+12.6)#35 | 18.7%(-1.47)#5,683 |
| 36. | Blairstown | 16.9% | 4.6%(+12.4)#36 | 18.7%(-1.70)#5,752 |
| 37. | Merriam Woods | 15.6% | 4.6%(+11.1)#37 | 18.7%(-3.05)#6,170 |
| 38. | Greenville | 15.5% | 4.6%(+11.0)#38 | 18.7%(-3.11)#6,196 |
| 39. | Syracuse | 15.3% | 4.6%(+10.7)#39 | 18.7%(-3.37)#6,258 |
| 40. | Grandview | 15.2% | 4.6%(+10.6)#40 | 18.7%(-3.45)#6,290 |
| 41. | Haywood City | 15.1% | 4.6%(+10.6)#41 | 18.7%(-3.54)#6,315 |
| 42. | Green City | 14.9% | 4.6%(+10.4)#42 | 18.7%(-3.72)#6,379 |
| 43. | Westboro | 14.6% | 4.6%(+10.0)#43 | 18.7%(-4.07)#6,519 |
| 44. | Newark | 14.6% | 4.6%(+10.0)#44 | 18.7%(-4.07)#6,520 |
| 45. | California | 14.5% | 4.6%(+9.98)#45 | 18.7%(-4.12)#6,539 |
| 46. | Kinloch | 14.4% | 4.6%(+9.88)#46 | 18.7%(-4.22)#6,574 |
| 47. | Overland | 14.4% | 4.6%(+9.88)#47 | 18.7%(-4.22)#6,578 |
| 48. | Sedalia | 13.8% | 4.6%(+9.26)#48 | 18.7%(-4.84)#6,786 |
| 49. | Anderson | 13.7% | 4.6%(+9.15)#49 | 18.7%(-4.95)#6,828 |
| 50. | Mindenmines | 13.7% | 4.6%(+9.14)#50 | 18.7%(-4.96)#6,832 |
| 51. | Renick | 13.6% | 4.6%(+9.02)#51 | 18.7%(-5.08)#6,886 |
| 52. | Phillipsburg | 13.6% | 4.6%(+9.02)#52 | 18.7%(-5.08)#6,889 |
| 53. | Purcell | 13.5% | 4.6%(+8.98)#53 | 18.7%(-5.13)#6,910 |
| 54. | Whiteman Afb | 13.5% | 4.6%(+8.97)#54 | 18.7%(-5.13)#6,911 |
| 55. | St Robert | 13.2% | 4.6%(+8.65)#55 | 18.7%(-5.45)#7,047 |
| 56. | Cardwell | 13.0% | 4.6%(+8.44)#56 | 18.7%(-5.66)#7,153 |
| 57. | Madison | 12.6% | 4.6%(+8.05)#57 | 18.7%(-6.06)#7,322 |
| 58. | Oakwood Park | 12.4% | 4.6%(+7.80)#58 | 18.7%(-6.30)#7,413 |
| 59. | Neosho | 12.2% | 4.6%(+7.67)#59 | 18.7%(-6.43)#7,482 |
| 60. | Doe Run | 12.2% | 4.6%(+7.60)#60 | 18.7%(-6.50)#7,520 |
| 61. | Houston Lake | 12.1% | 4.6%(+7.53)#61 | 18.7%(-6.57)#7,561 |
| 62. | Breckenridge | 12.1% | 4.6%(+7.51)#62 | 18.7%(-6.59)#7,568 |
| 63. | Edmundson | 11.8% | 4.6%(+7.21)#63 | 18.7%(-6.89)#7,709 |
| 64. | Chain O Lakes | 11.3% | 4.6%(+6.71)#64 | 18.7%(-7.39)#7,988 |
| 65. | Riverview Estates | 11.2% | 4.6%(+6.69)#65 | 18.7%(-7.42)#7,998 |
| 66. | Kansas City | 11.1% | 4.6%(+6.54)#66 | 18.7%(-7.56)#8,075 |
| 67. | Peaceful Village | 11.0% | 4.6%(+6.47)#67 | 18.7%(-7.63)#8,112 |
| 68. | St John | 11.0% | 4.6%(+6.43)#68 | 18.7%(-7.67)#8,130 |
| 69. | Gilman City | 10.9% | 4.6%(+6.37)#69 | 18.7%(-7.73)#8,160 |
| 70. | Lexington | 10.6% | 4.6%(+6.08)#70 | 18.7%(-8.02)#8,323 |
| 71. | Cleveland | 10.6% | 4.6%(+6.07)#71 | 18.7%(-8.03)#8,328 |
| 72. | Lathrop | 10.6% | 4.6%(+6.01)#72 | 18.7%(-8.09)#8,354 |
| 73. | Wright City | 10.5% | 4.6%(+5.99)#73 | 18.7%(-8.11)#8,372 |
| 74. | Shell Knob | 10.5% | 4.6%(+5.98)#74 | 18.7%(-8.12)#8,379 |
| 75. | Lake Lotawana | 10.2% | 4.6%(+5.69)#75 | 18.7%(-8.41)#8,563 |
| 76. | Annapolis | 10.2% | 4.6%(+5.64)#76 | 18.7%(-8.46)#8,586 |
| 77. | Novinger | 10.2% | 4.6%(+5.63)#77 | 18.7%(-8.47)#8,595 |
| 78. | Pierce City | 10.1% | 4.6%(+5.50)#78 | 18.7%(-8.60)#8,679 |
| 79. | Waverly | 9.9% | 4.6%(+5.30)#79 | 18.7%(-8.80)#8,806 |
| 80. | Hollister | 9.8% | 4.6%(+5.26)#80 | 18.7%(-8.84)#8,836 |
| 81. | Duenweg | 9.8% | 4.6%(+5.24)#81 | 18.7%(-8.86)#8,846 |
| 82. | Louisburg | 9.8% | 4.6%(+5.23)#82 | 18.7%(-8.87)#8,850 |
| 83. | Northmoor | 9.8% | 4.6%(+5.21)#83 | 18.7%(-8.89)#8,868 |
| 84. | Bridgeton | 9.6% | 4.6%(+5.04)#84 | 18.7%(-9.06)#8,985 |
| 85. | Excelsior Estates | 9.6% | 4.6%(+5.03)#85 | 18.7%(-9.07)#8,990 |
| 86. | Independence | 9.6% | 4.6%(+5.02)#86 | 18.7%(-9.08)#8,999 |
| 87. | Greenfield | 9.5% | 4.6%(+5.00)#87 | 18.7%(-9.10)#9,010 |
| 88. | Country Club | 9.5% | 4.6%(+4.98)#88 | 18.7%(-9.13)#9,032 |
| 89. | Rensselaer | 9.4% | 4.6%(+4.82)#89 | 18.7%(-9.28)#9,137 |
| 90. | Seligman | 9.3% | 4.6%(+4.72)#90 | 18.7%(-9.38)#9,200 |
| 91. | Sheridan | 9.2% | 4.6%(+4.70)#91 | 18.7%(-9.40)#9,224 |
| 92. | Center | 9.2% | 4.6%(+4.67)#92 | 18.7%(-9.43)#9,250 |
| 93. | Riverside | 9.2% | 4.6%(+4.66)#93 | 18.7%(-9.44)#9,266 |
| 94. | Mill Spring | 9.2% | 4.6%(+4.62)#94 | 18.7%(-9.48)#9,295 |
| 95. | Centertown | 9.1% | 4.6%(+4.51)#95 | 18.7%(-9.59)#9,381 |
| 96. | Utica | 8.9% | 4.6%(+4.36)#96 | 18.7%(-9.74)#9,496 |
| 97. | Holcomb | 8.8% | 4.6%(+4.22)#97 | 18.7%(-9.88)#9,607 |
| 98. | Baldwin Park | 8.7% | 4.6%(+4.14)#98 | 18.7%(-9.96)#9,674 |
| 99. | Richland | 8.7% | 4.6%(+4.12)#99 | 18.7%(-9.98)#9,688 |
| 100. | New Haven | 8.6% | 4.6%(+4.07)#100 | 18.7%(-10.0)#9,730 |
Common Questions
What are the Top 10 Cities with the Highest Percentage of Hispanic or Latino Population in Missouri?
Top 10 Cities with the Highest Percentage of Hispanic or Latino Population in Missouri are:
#1
84.1%
#2
67.8%
#3
52.8%
#4
46.1%
#5
45.8%
#6
44.9%
#7
41.7%
#8
40.9%
#9
40.4%
#10
38.5%
What city has the Highest Percentage of Hispanic or Latino Population in Missouri?
Ginger Blue has the Highest Percentage of Hispanic or Latino Population in Missouri with 84.1%.
What is the Percentage of Hispanic or Latino Population in the State of Missouri?
Percentage of Hispanic or Latino Population in Missouri is 4.6%.
What is the Percentage of Hispanic or Latino Population in the United States?
Percentage of Hispanic or Latino Population in the United States is 18.7%.