East Franklin, NJ Map & Demographics
East Franklin Map
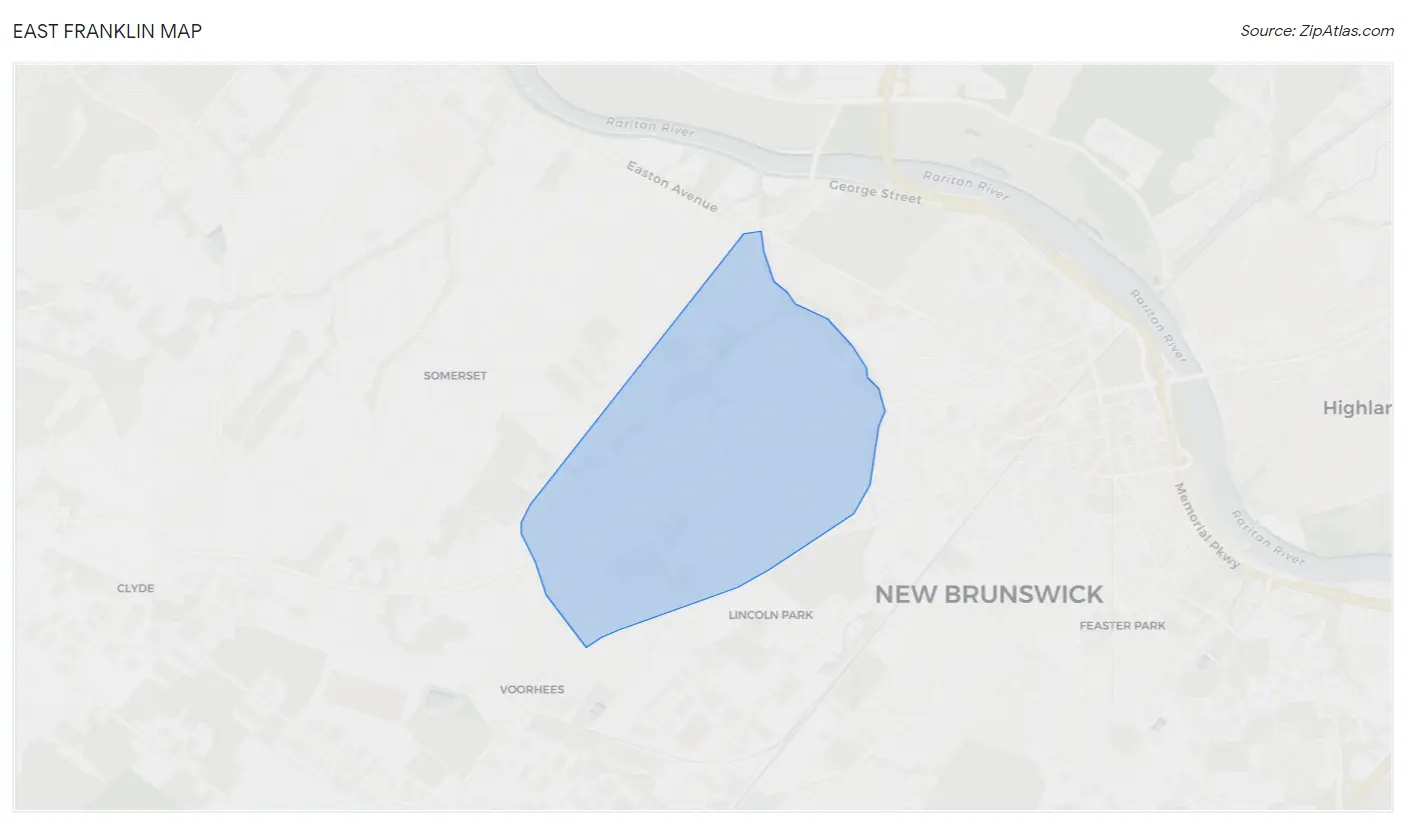
East Franklin Overview
$31,867
PER CAPITA INCOME
$99,840
AVG FAMILY INCOME
$96,963
AVG HOUSEHOLD INCOME
40.4%
WAGE / INCOME GAP [ % ]
59.6¢/ $1
WAGE / INCOME GAP [ $ ]
0.32
INEQUALITY / GINI INDEX
9,309
TOTAL POPULATION
4,879
MALE POPULATION
4,430
FEMALE POPULATION
110.14
MALES / 100 FEMALES
90.80
FEMALES / 100 MALES
28.5
MEDIAN AGE
4.2
AVG FAMILY SIZE
3.5
AVG HOUSEHOLD SIZE
4,991
LABOR FORCE [ PEOPLE ]
75.5%
PERCENT IN LABOR FORCE
4.1%
UNEMPLOYMENT RATE
Income in East Franklin
Income Overview in East Franklin
Per Capita Income in East Franklin is $31,867, while median incomes of families and households are $99,840 and $96,963 respectively.
| Characteristic | Number | Measure |
| Per Capita Income | 9,309 | $31,867 |
| Median Family Income | 1,931 | $99,840 |
| Mean Family Income | 1,931 | $113,362 |
| Median Household Income | 2,643 | $96,963 |
| Mean Household Income | 2,643 | $107,658 |
| Income Deficit | 1,931 | $0 |
| Wage / Income Gap (%) | 9,309 | 40.40% |
| Wage / Income Gap ($) | 9,309 | 59.60¢ per $1 |
| Gini / Inequality Index | 9,309 | 0.32 |
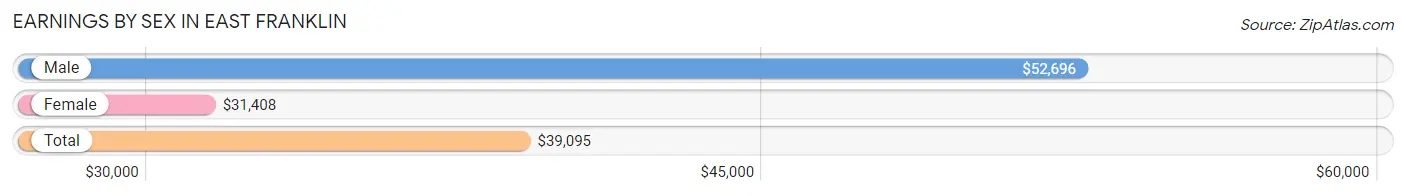
Earnings by Sex in East Franklin
Average Earnings in East Franklin are $39,095, $52,696 for men and $31,408 for women, a difference of 40.4%.
| Sex | Number | Average Earnings |
| Male | 2,769 (54.2%) | $52,696 |
| Female | 2,344 (45.8%) | $31,408 |
| Total | 5,113 (100.0%) | $39,095 |
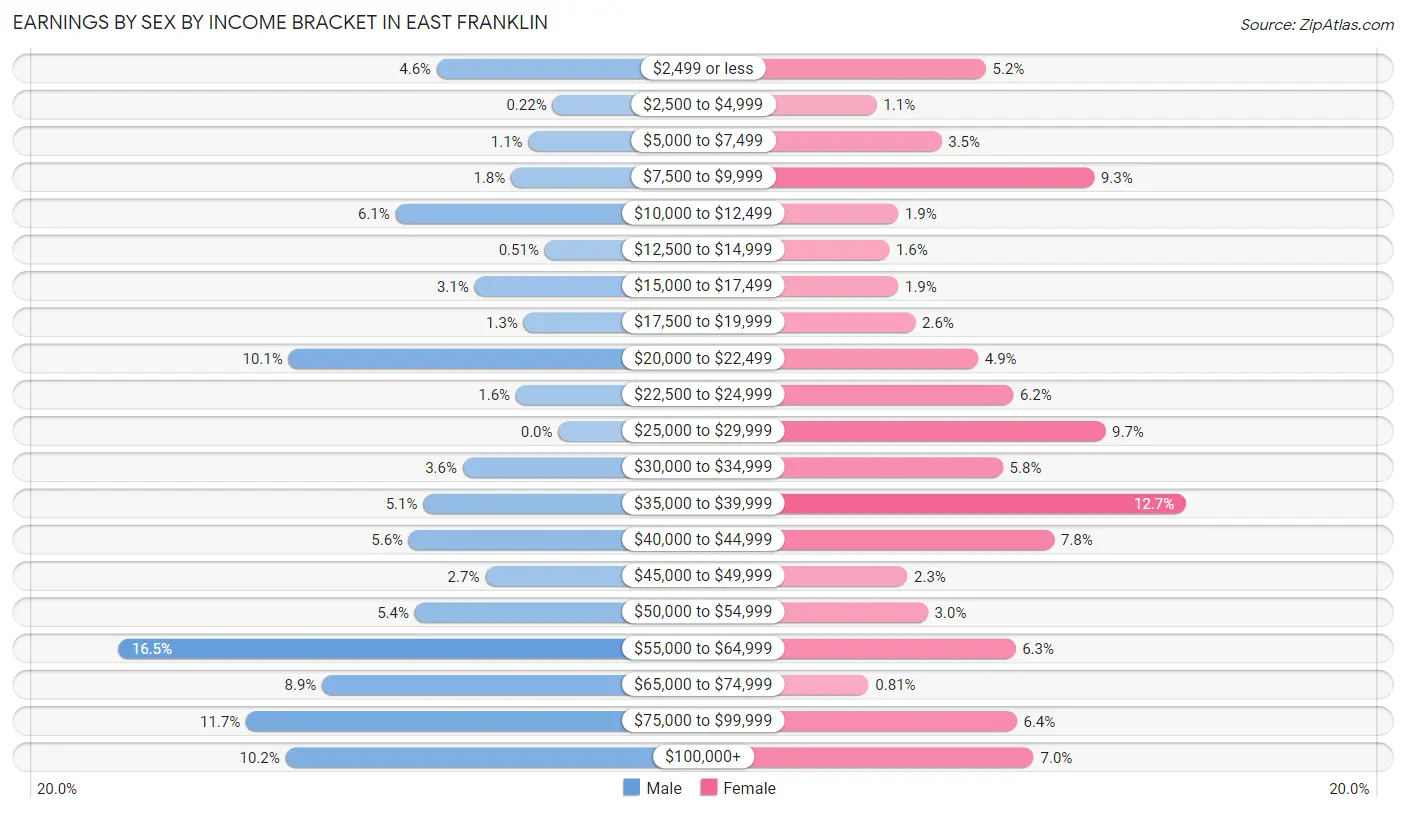
Earnings by Sex by Income Bracket in East Franklin
The most common earnings brackets in East Franklin are $55,000 to $64,999 for men (456 | 16.5%) and $35,000 to $39,999 for women (298 | 12.7%).
| Income | Male | Female |
| $2,499 or less | 126 (4.5%) | 122 (5.2%) |
| $2,500 to $4,999 | 6 (0.2%) | 26 (1.1%) |
| $5,000 to $7,499 | 31 (1.1%) | 83 (3.5%) |
| $7,500 to $9,999 | 49 (1.8%) | 217 (9.3%) |
| $10,000 to $12,499 | 169 (6.1%) | 45 (1.9%) |
| $12,500 to $14,999 | 14 (0.5%) | 37 (1.6%) |
| $15,000 to $17,499 | 87 (3.1%) | 45 (1.9%) |
| $17,500 to $19,999 | 36 (1.3%) | 60 (2.6%) |
| $20,000 to $22,499 | 280 (10.1%) | 115 (4.9%) |
| $22,500 to $24,999 | 44 (1.6%) | 146 (6.2%) |
| $25,000 to $29,999 | 0 (0.0%) | 227 (9.7%) |
| $30,000 to $34,999 | 99 (3.6%) | 137 (5.8%) |
| $35,000 to $39,999 | 140 (5.1%) | 298 (12.7%) |
| $40,000 to $44,999 | 155 (5.6%) | 182 (7.8%) |
| $45,000 to $49,999 | 76 (2.7%) | 53 (2.3%) |
| $50,000 to $54,999 | 149 (5.4%) | 71 (3.0%) |
| $55,000 to $64,999 | 456 (16.5%) | 148 (6.3%) |
| $65,000 to $74,999 | 245 (8.8%) | 19 (0.8%) |
| $75,000 to $99,999 | 324 (11.7%) | 149 (6.4%) |
| $100,000+ | 283 (10.2%) | 164 (7.0%) |
| Total | 2,769 (100.0%) | 2,344 (100.0%) |
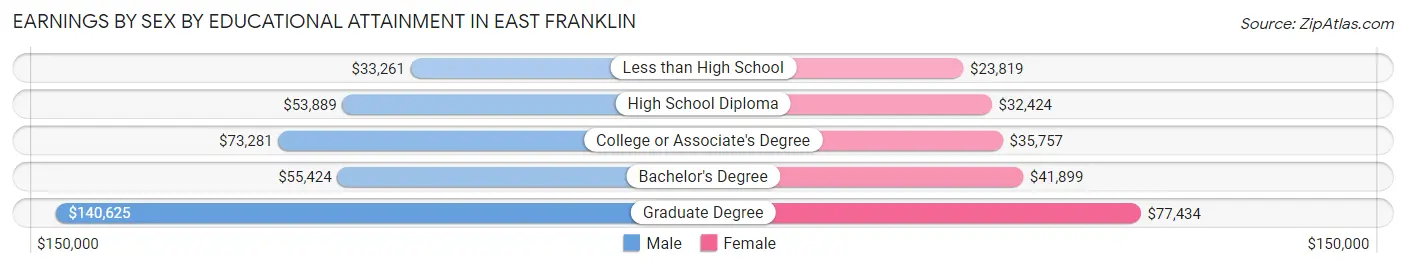
Earnings by Sex by Educational Attainment in East Franklin
Average earnings in East Franklin are $56,932 for men and $37,649 for women, a difference of 33.9%. Men with an educational attainment of graduate degree enjoy the highest average annual earnings of $140,625, while those with less than high school education earn the least with $33,261. Women with an educational attainment of graduate degree earn the most with the average annual earnings of $77,434, while those with less than high school education have the smallest earnings of $23,819.
| Educational Attainment | Male Income | Female Income |
| Less than High School | $33,261 | $23,819 |
| High School Diploma | $53,889 | $32,424 |
| College or Associate's Degree | $73,281 | $35,757 |
| Bachelor's Degree | $55,424 | $41,899 |
| Graduate Degree | $140,625 | $77,434 |
| Total | $56,932 | $37,649 |
Family Income in East Franklin
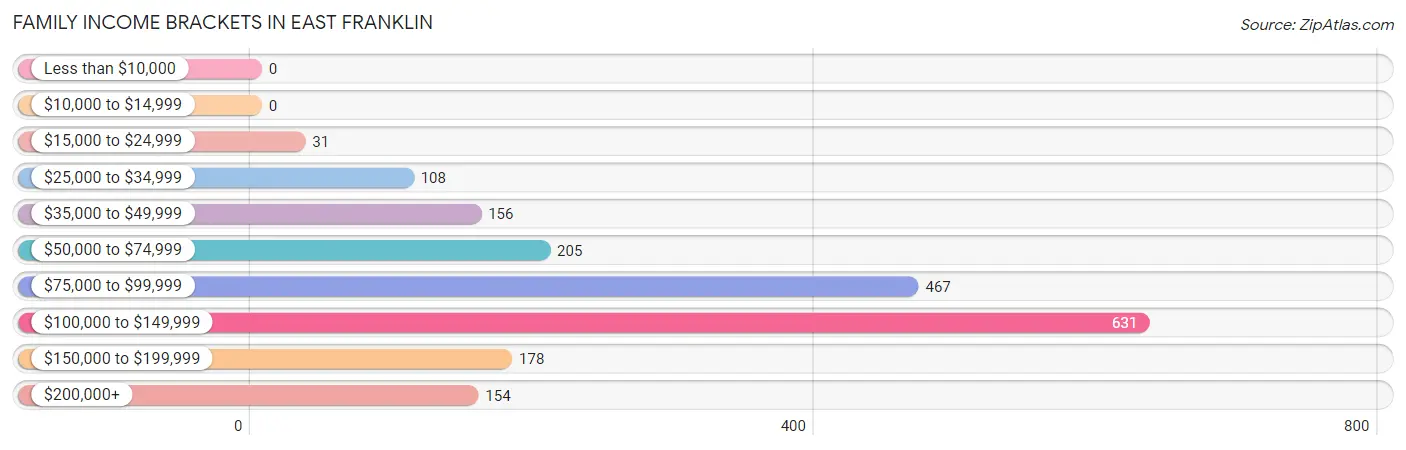
Family Income Brackets in East Franklin
According to the East Franklin family income data, there are 631 families falling into the $100,000 to $149,999 income range, which is the most common income bracket and makes up 32.7% of all families.
| Income Bracket | # Families | % Families |
| Less than $10,000 | 0 | 0.0% |
| $10,000 to $14,999 | 0 | 0.0% |
| $15,000 to $24,999 | 31 | 1.6% |
| $25,000 to $34,999 | 108 | 5.6% |
| $35,000 to $49,999 | 156 | 8.1% |
| $50,000 to $74,999 | 205 | 10.6% |
| $75,000 to $99,999 | 467 | 24.2% |
| $100,000 to $149,999 | 631 | 32.7% |
| $150,000 to $199,999 | 178 | 9.2% |
| $200,000+ | 154 | 8.0% |
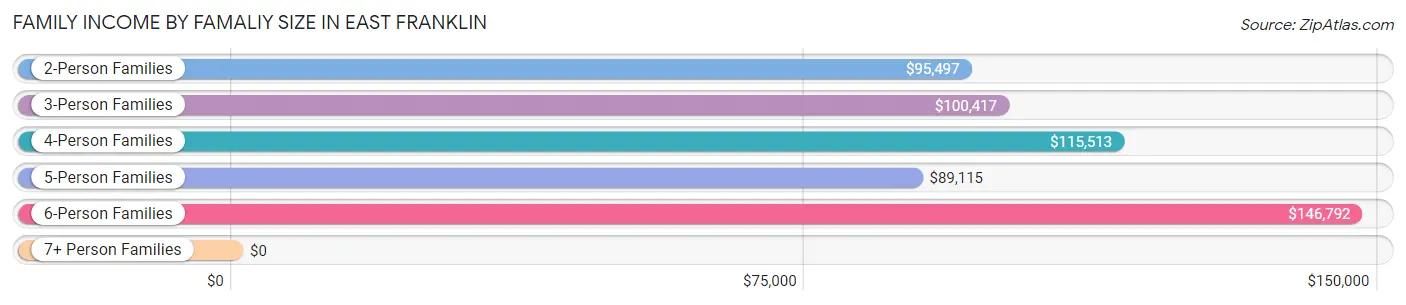
Family Income by Famaliy Size in East Franklin
6-person families (179 | 9.3%) account for the highest median family income in East Franklin with $146,792 per family, while 2-person families (385 | 19.9%) have the highest median income of $47,748 per family member.
| Income Bracket | # Families | Median Income |
| 2-Person Families | 385 (19.9%) | $95,497 |
| 3-Person Families | 494 (25.6%) | $100,417 |
| 4-Person Families | 615 (31.9%) | $115,513 |
| 5-Person Families | 177 (9.2%) | $89,115 |
| 6-Person Families | 179 (9.3%) | $146,792 |
| 7+ Person Families | 81 (4.2%) | $0 |
| Total | 1,931 (100.0%) | $99,840 |
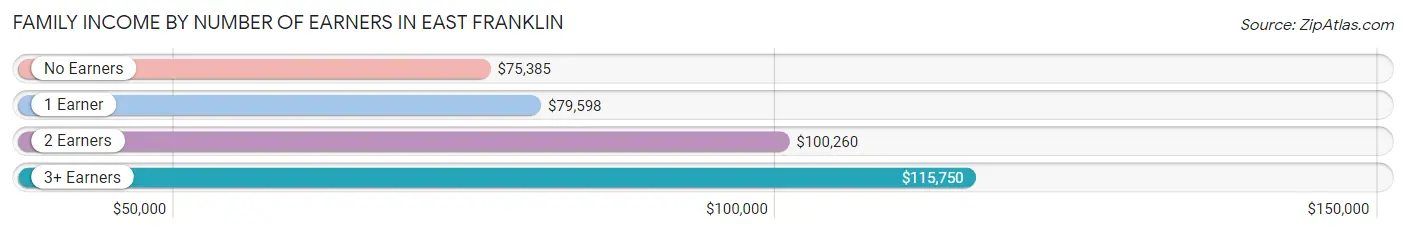
Family Income by Number of Earners in East Franklin
The median family income in East Franklin is $99,840, with families comprising 3+ earners (545) having the highest median family income of $115,750, while families with no earners (118) have the lowest median family income of $75,385, accounting for 28.2% and 6.1% of families, respectively.
| Number of Earners | # Families | Median Income |
| No Earners | 118 (6.1%) | $75,385 |
| 1 Earner | 415 (21.5%) | $79,598 |
| 2 Earners | 853 (44.2%) | $100,260 |
| 3+ Earners | 545 (28.2%) | $115,750 |
| Total | 1,931 (100.0%) | $99,840 |
Household Income in East Franklin
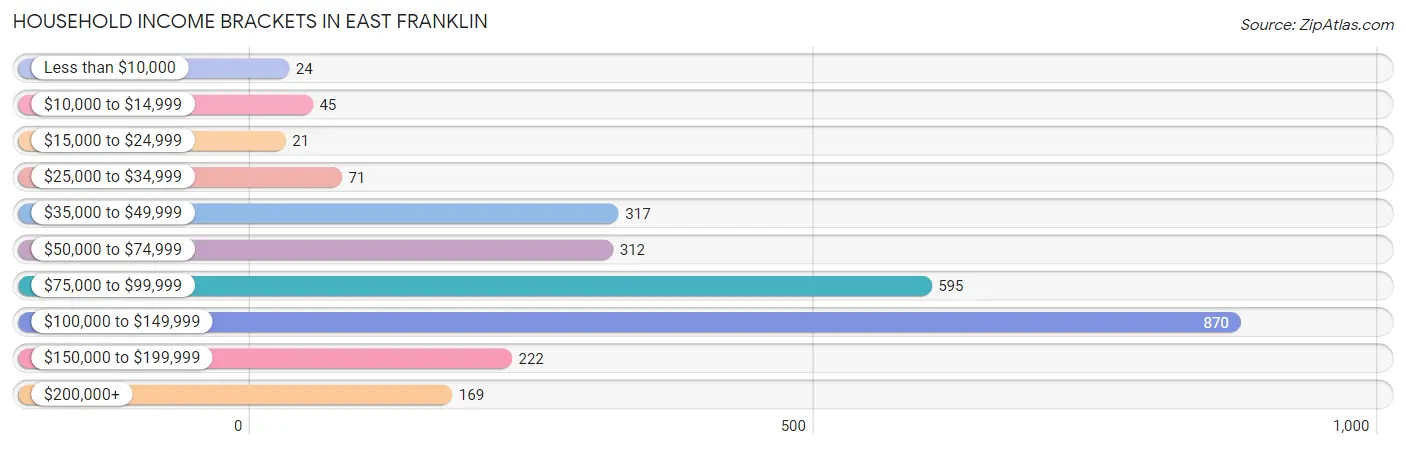
Household Income Brackets in East Franklin
With 870 households falling in the category, the $100,000 to $149,999 income range is the most frequent in East Franklin, accounting for 32.9% of all households. In contrast, only 21 households (0.8%) fall into the $15,000 to $24,999 income bracket, making it the least populous group.
| Income Bracket | # Households | % Households |
| Less than $10,000 | 24 | 0.9% |
| $10,000 to $14,999 | 45 | 1.7% |
| $15,000 to $24,999 | 21 | 0.8% |
| $25,000 to $34,999 | 71 | 2.7% |
| $35,000 to $49,999 | 317 | 12.0% |
| $50,000 to $74,999 | 312 | 11.8% |
| $75,000 to $99,999 | 595 | 22.5% |
| $100,000 to $149,999 | 870 | 32.9% |
| $150,000 to $199,999 | 222 | 8.4% |
| $200,000+ | 169 | 6.4% |
Household Income by Householder Age in East Franklin
The median household income in East Franklin is $96,963, with the highest median household income of $115,531 found in the 25 to 44 years age bracket for the primary householder. A total of 1,212 households (45.9%) fall into this category. Meanwhile, the 15 to 24 years age bracket for the primary householder has the lowest median household income of $52,000, with 230 households (8.7%) in this group.
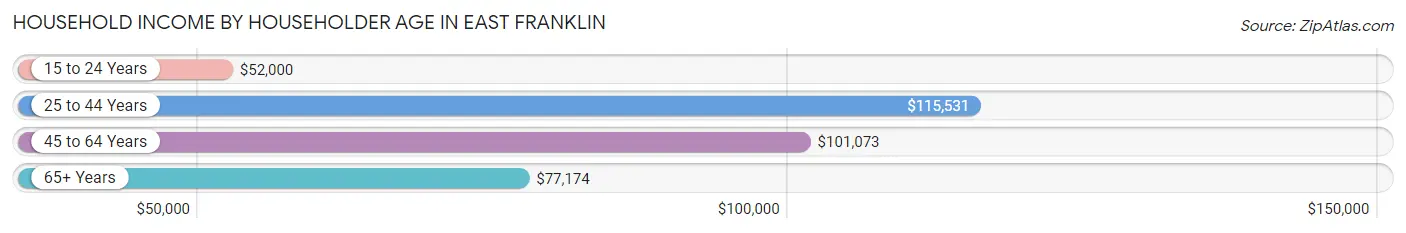
| Income Bracket | # Households | Median Income |
| 15 to 24 Years | 230 (8.7%) | $52,000 |
| 25 to 44 Years | 1,212 (45.9%) | $115,531 |
| 45 to 64 Years | 729 (27.6%) | $101,073 |
| 65+ Years | 472 (17.9%) | $77,174 |
| Total | 2,643 (100.0%) | $96,963 |
Poverty in East Franklin
Income Below Poverty by Sex and Age in East Franklin
With 6.7% poverty level for males and 13.0% for females among the residents of East Franklin, 12 to 14 year old males and 16 and 17 year old females are the most vulnerable to poverty, with 75 males (31.1%) and 63 females (33.7%) in their respective age groups living below the poverty level.
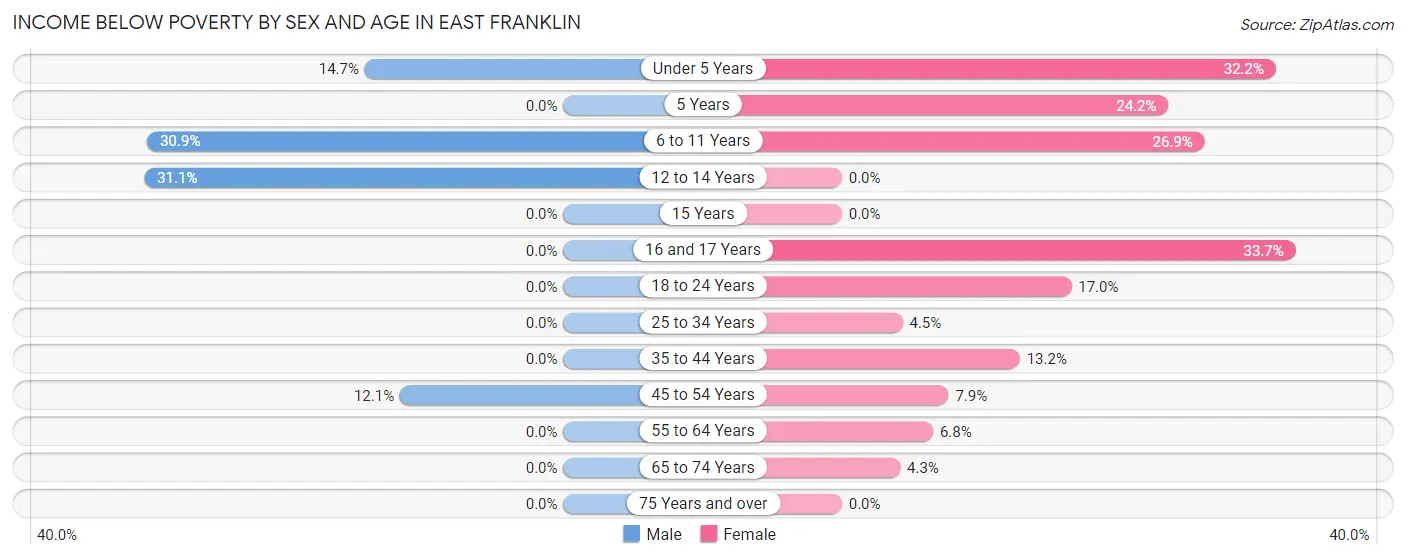
| Age Bracket | Male | Female |
| Under 5 Years | 89 (14.7%) | 58 (32.2%) |
| 5 Years | 0 (0.0%) | 24 (24.2%) |
| 6 to 11 Years | 98 (30.9%) | 139 (26.9%) |
| 12 to 14 Years | 75 (31.1%) | 0 (0.0%) |
| 15 Years | 0 (0.0%) | 0 (0.0%) |
| 16 and 17 Years | 0 (0.0%) | 63 (33.7%) |
| 18 to 24 Years | 0 (0.0%) | 106 (17.0%) |
| 25 to 34 Years | 0 (0.0%) | 24 (4.5%) |
| 35 to 44 Years | 0 (0.0%) | 79 (13.2%) |
| 45 to 54 Years | 66 (12.1%) | 37 (7.9%) |
| 55 to 64 Years | 0 (0.0%) | 27 (6.8%) |
| 65 to 74 Years | 0 (0.0%) | 17 (4.3%) |
| 75 Years and over | 0 (0.0%) | 0 (0.0%) |
| Total | 328 (6.7%) | 574 (13.0%) |
Income Above Poverty by Sex and Age in East Franklin
According to the poverty statistics in East Franklin, males aged 5 years and females aged 12 to 14 years are the age groups that are most secure financially, with 100.0% of males and 100.0% of females in these age groups living above the poverty line.
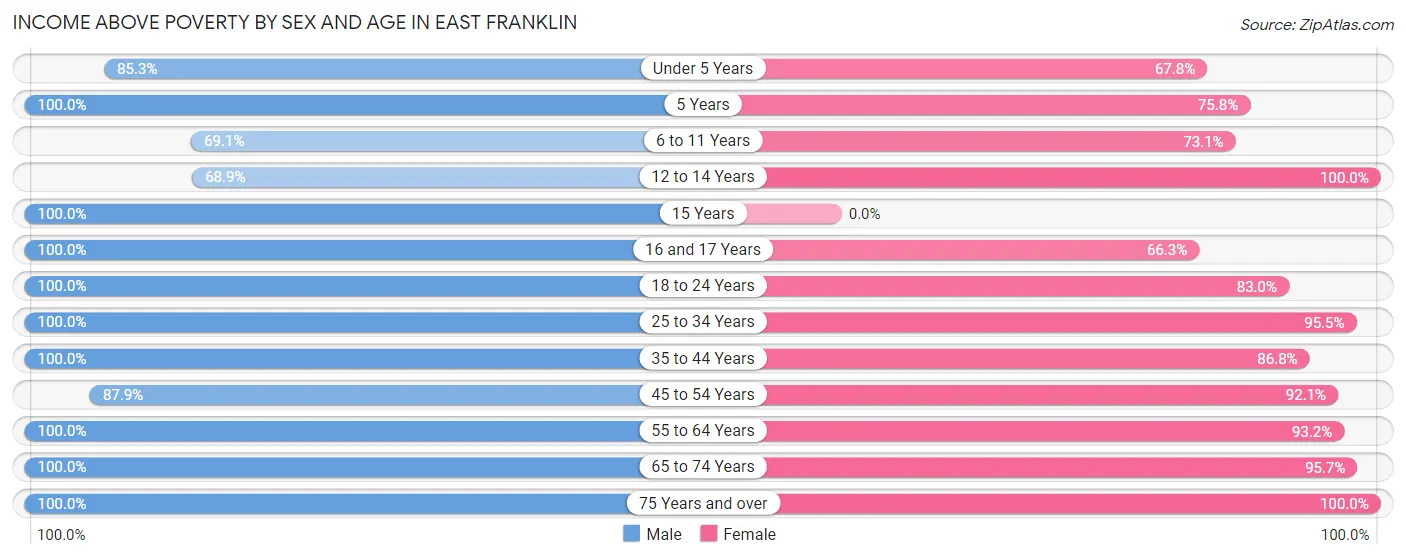
| Age Bracket | Male | Female |
| Under 5 Years | 515 (85.3%) | 122 (67.8%) |
| 5 Years | 66 (100.0%) | 75 (75.8%) |
| 6 to 11 Years | 219 (69.1%) | 377 (73.1%) |
| 12 to 14 Years | 166 (68.9%) | 347 (100.0%) |
| 15 Years | 328 (100.0%) | 0 (0.0%) |
| 16 and 17 Years | 3 (100.0%) | 124 (66.3%) |
| 18 to 24 Years | 618 (100.0%) | 516 (83.0%) |
| 25 to 34 Years | 673 (100.0%) | 508 (95.5%) |
| 35 to 44 Years | 707 (100.0%) | 519 (86.8%) |
| 45 to 54 Years | 478 (87.9%) | 430 (92.1%) |
| 55 to 64 Years | 489 (100.0%) | 372 (93.2%) |
| 65 to 74 Years | 141 (100.0%) | 376 (95.7%) |
| 75 Years and over | 148 (100.0%) | 90 (100.0%) |
| Total | 4,551 (93.3%) | 3,856 (87.0%) |
Income Below Poverty Among Married-Couple Families in East Franklin
The poverty statistics for married-couple families in East Franklin show that 5.3% or 61 of the total 1,143 families live below the poverty line. Families with 5 or more children have the highest poverty rate of 100.0%, comprising of 37 families. On the other hand, families with no children have the lowest poverty rate of 0.0%, which includes 0 families.
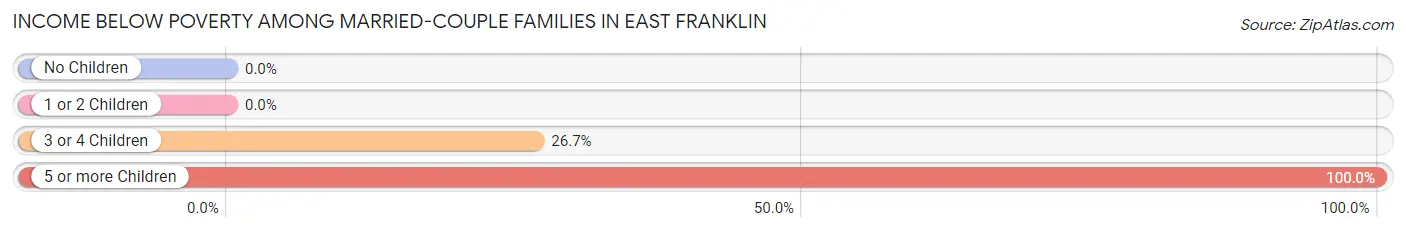
| Children | Above Poverty | Below Poverty |
| No Children | 521 (100.0%) | 0 (0.0%) |
| 1 or 2 Children | 495 (100.0%) | 0 (0.0%) |
| 3 or 4 Children | 66 (73.3%) | 24 (26.7%) |
| 5 or more Children | 0 (0.0%) | 37 (100.0%) |
| Total | 1,082 (94.7%) | 61 (5.3%) |
Income Below Poverty Among Single-Parent Households in East Franklin
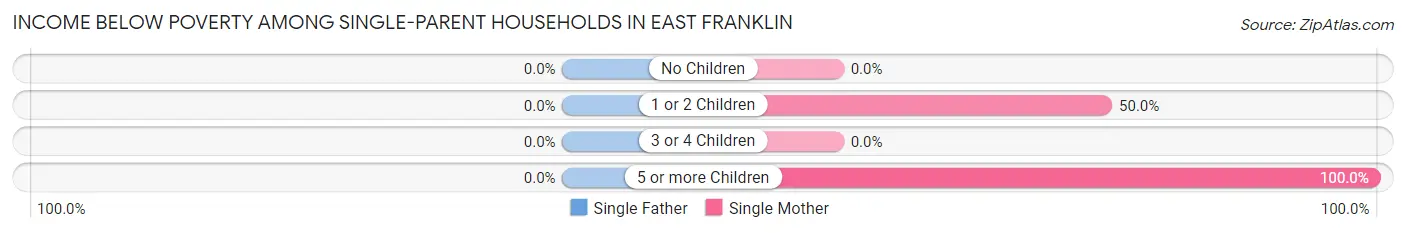
| Children | Single Father | Single Mother |
| No Children | 0 (0.0%) | 0 (0.0%) |
| 1 or 2 Children | 0 (0.0%) | 31 (50.0%) |
| 3 or 4 Children | 0 (0.0%) | 0 (0.0%) |
| 5 or more Children | 0 (0.0%) | 20 (100.0%) |
| Total | 0 (0.0%) | 51 (10.5%) |
Income Below Poverty Among Married-Couple vs Single-Parent Households in East Franklin
The poverty data for East Franklin shows that 61 of the married-couple family households (5.3%) and 51 of the single-parent households (6.5%) are living below the poverty level. Within the married-couple family households, those with 5 or more children have the highest poverty rate, with 37 households (100.0%) falling below the poverty line. Among the single-parent households, those with 5 or more children have the highest poverty rate, with 20 household (100.0%) living below poverty.
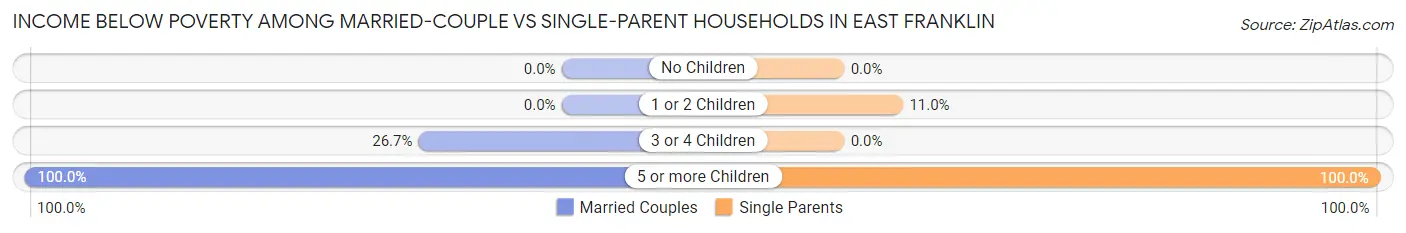
| Children | Married-Couple Families | Single-Parent Households |
| No Children | 0 (0.0%) | 0 (0.0%) |
| 1 or 2 Children | 0 (0.0%) | 31 (11.0%) |
| 3 or 4 Children | 24 (26.7%) | 0 (0.0%) |
| 5 or more Children | 37 (100.0%) | 20 (100.0%) |
| Total | 61 (5.3%) | 51 (6.5%) |
Race in East Franklin
The most populous races in East Franklin are Hispanic or Latino (5,119 | 55.0%), Some other Race (3,466 | 37.2%), and Black / African American (2,320 | 24.9%).
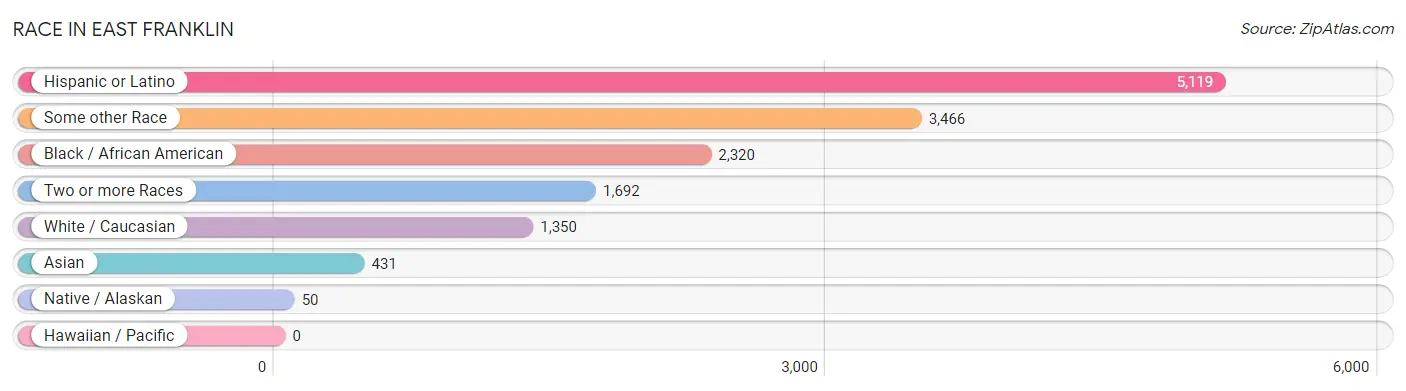
| Race | # Population | % Population |
| Asian | 431 | 4.6% |
| Black / African American | 2,320 | 24.9% |
| Hawaiian / Pacific | 0 | 0.0% |
| Hispanic or Latino | 5,119 | 55.0% |
| Native / Alaskan | 50 | 0.5% |
| White / Caucasian | 1,350 | 14.5% |
| Two or more Races | 1,692 | 18.2% |
| Some other Race | 3,466 | 37.2% |
| Total | 9,309 | 100.0% |
Ancestry in East Franklin
The most populous ancestries reported in East Franklin are Dominican (2,341 | 25.2%), Mexican (1,143 | 12.3%), Central American (793 | 8.5%), Honduran (600 | 6.5%), and Puerto Rican (468 | 5.0%), together accounting for 57.4% of all East Franklin residents.
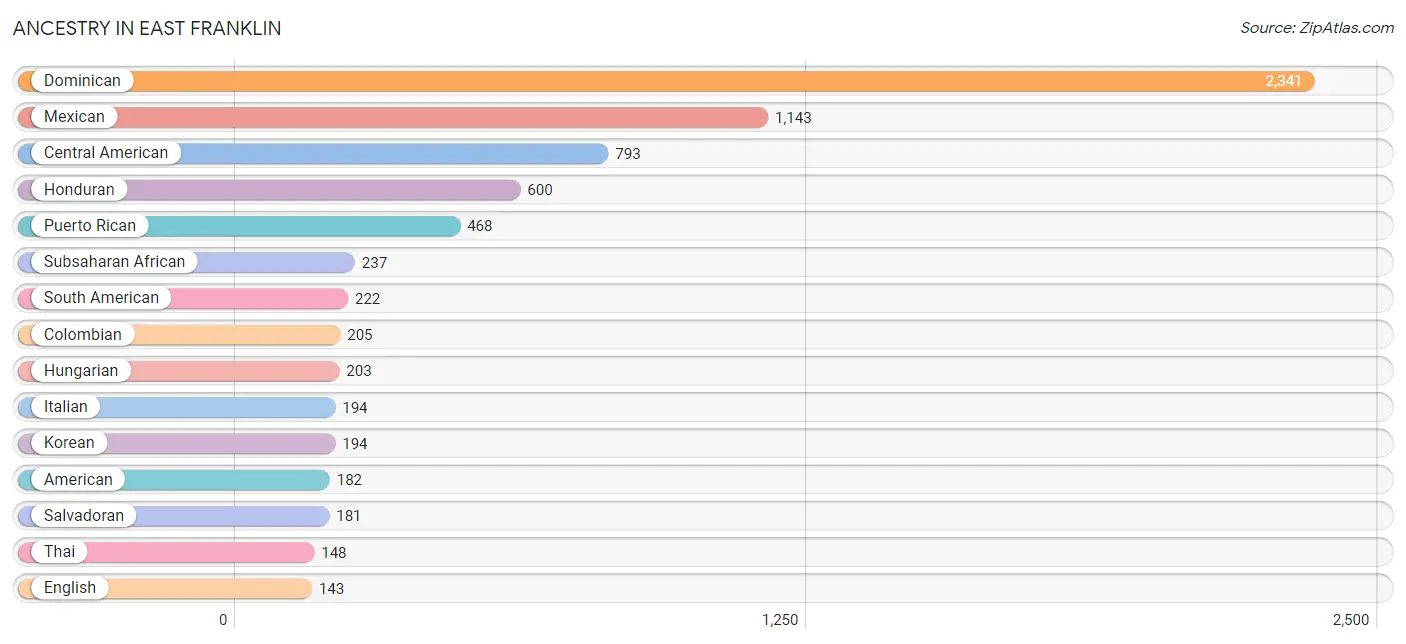
| Ancestry | # Population | % Population |
| African | 62 | 0.7% |
| American | 182 | 2.0% |
| Barbadian | 27 | 0.3% |
| British West Indian | 58 | 0.6% |
| Central American | 793 | 8.5% |
| Colombian | 205 | 2.2% |
| Cuban | 46 | 0.5% |
| Danish | 32 | 0.3% |
| Dominican | 2,341 | 25.2% |
| Dutch | 89 | 1.0% |
| Ecuadorian | 17 | 0.2% |
| English | 143 | 1.5% |
| French Canadian | 26 | 0.3% |
| German | 36 | 0.4% |
| Haitian | 54 | 0.6% |
| Honduran | 600 | 6.5% |
| Hungarian | 203 | 2.2% |
| Indian (Asian) | 107 | 1.1% |
| Irish | 126 | 1.3% |
| Italian | 194 | 2.1% |
| Jamaican | 58 | 0.6% |
| Korean | 194 | 2.1% |
| Laotian | 14 | 0.2% |
| Mexican | 1,143 | 12.3% |
| Mexican American Indian | 50 | 0.5% |
| Nicaraguan | 12 | 0.1% |
| Norwegian | 73 | 0.8% |
| Polish | 74 | 0.8% |
| Puerto Rican | 468 | 5.0% |
| Russian | 105 | 1.1% |
| Salvadoran | 181 | 1.9% |
| Scandinavian | 13 | 0.1% |
| Scottish | 20 | 0.2% |
| Sierra Leonean | 53 | 0.6% |
| South American | 222 | 2.4% |
| Sri Lankan | 38 | 0.4% |
| Subsaharan African | 237 | 2.5% |
| Thai | 148 | 1.6% | View All 38 Rows |
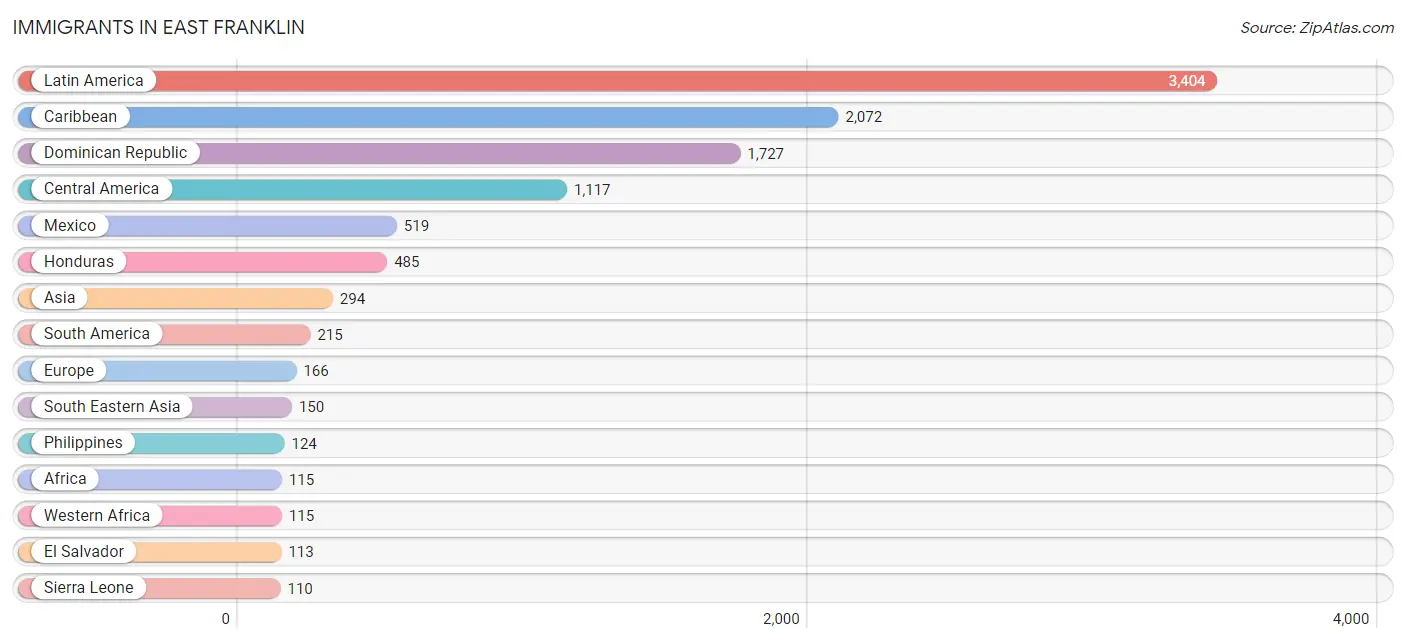
Immigrants in East Franklin
The most numerous immigrant groups reported in East Franklin came from Latin America (3,404 | 36.6%), Caribbean (2,072 | 22.3%), Dominican Republic (1,727 | 18.5%), Central America (1,117 | 12.0%), and Mexico (519 | 5.6%), together accounting for 95.0% of all East Franklin residents.
| Immigration Origin | # Population | % Population |
| Africa | 115 | 1.2% |
| Argentina | 38 | 0.4% |
| Asia | 294 | 3.2% |
| Barbados | 27 | 0.3% |
| Canada | 23 | 0.3% |
| Caribbean | 2,072 | 22.3% |
| Central America | 1,117 | 12.0% |
| China | 88 | 0.9% |
| Colombia | 60 | 0.6% |
| Dominica | 52 | 0.6% |
| Dominican Republic | 1,727 | 18.5% |
| Eastern Asia | 88 | 0.9% |
| Eastern Europe | 90 | 1.0% |
| Ecuador | 59 | 0.6% |
| El Salvador | 113 | 1.2% |
| Europe | 166 | 1.8% |
| Guyana | 58 | 0.6% |
| Haiti | 56 | 0.6% |
| Honduras | 485 | 5.2% |
| India | 30 | 0.3% |
| Indonesia | 14 | 0.2% |
| Italy | 13 | 0.1% |
| Jamaica | 46 | 0.5% |
| Latin America | 3,404 | 36.6% |
| Liberia | 5 | 0.1% |
| Mexico | 519 | 5.6% |
| Netherlands | 30 | 0.3% |
| Northern Europe | 12 | 0.1% |
| Pakistan | 26 | 0.3% |
| Philippines | 124 | 1.3% |
| Poland | 74 | 0.8% |
| Romania | 16 | 0.2% |
| Sierra Leone | 110 | 1.2% |
| South America | 215 | 2.3% |
| South Central Asia | 56 | 0.6% |
| South Eastern Asia | 150 | 1.6% |
| Southern Europe | 34 | 0.4% |
| Spain | 21 | 0.2% |
| Taiwan | 17 | 0.2% |
| Vietnam | 12 | 0.1% |
| Western Africa | 115 | 1.2% |
| Western Europe | 30 | 0.3% | View All 42 Rows |
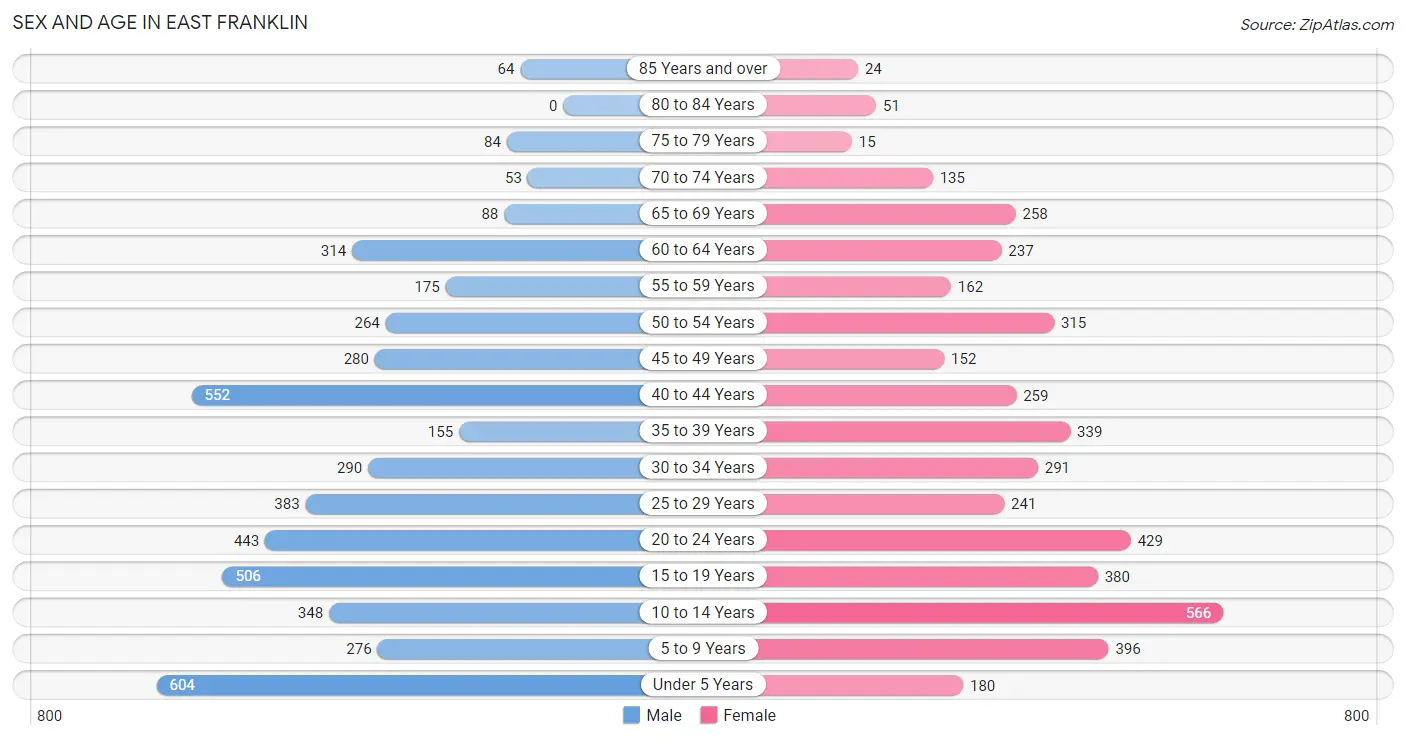
Sex and Age in East Franklin
Sex and Age in East Franklin
The most populous age groups in East Franklin are Under 5 Years (604 | 12.4%) for men and 10 to 14 Years (566 | 12.8%) for women.
| Age Bracket | Male | Female |
| Under 5 Years | 604 (12.4%) | 180 (4.1%) |
| 5 to 9 Years | 276 (5.7%) | 396 (8.9%) |
| 10 to 14 Years | 348 (7.1%) | 566 (12.8%) |
| 15 to 19 Years | 506 (10.4%) | 380 (8.6%) |
| 20 to 24 Years | 443 (9.1%) | 429 (9.7%) |
| 25 to 29 Years | 383 (7.9%) | 241 (5.4%) |
| 30 to 34 Years | 290 (5.9%) | 291 (6.6%) |
| 35 to 39 Years | 155 (3.2%) | 339 (7.6%) |
| 40 to 44 Years | 552 (11.3%) | 259 (5.9%) |
| 45 to 49 Years | 280 (5.7%) | 152 (3.4%) |
| 50 to 54 Years | 264 (5.4%) | 315 (7.1%) |
| 55 to 59 Years | 175 (3.6%) | 162 (3.7%) |
| 60 to 64 Years | 314 (6.4%) | 237 (5.3%) |
| 65 to 69 Years | 88 (1.8%) | 258 (5.8%) |
| 70 to 74 Years | 53 (1.1%) | 135 (3.0%) |
| 75 to 79 Years | 84 (1.7%) | 15 (0.3%) |
| 80 to 84 Years | 0 (0.0%) | 51 (1.1%) |
| 85 Years and over | 64 (1.3%) | 24 (0.5%) |
| Total | 4,879 (100.0%) | 4,430 (100.0%) |
Families and Households in East Franklin
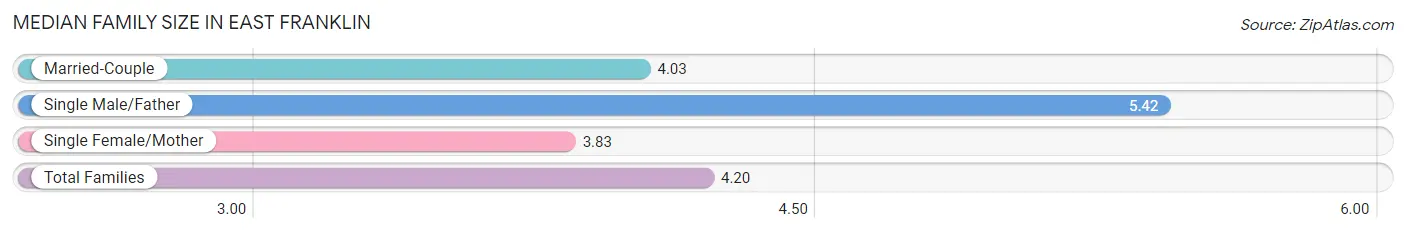
Median Family Size in East Franklin
The median family size in East Franklin is 4.20 persons per family, with single male/father families (302 | 15.6%) accounting for the largest median family size of 5.42 persons per family. On the other hand, single female/mother families (486 | 25.2%) represent the smallest median family size with 3.83 persons per family.
| Family Type | # Families | Family Size |
| Married-Couple | 1,143 (59.2%) | 4.03 |
| Single Male/Father | 302 (15.6%) | 5.42 |
| Single Female/Mother | 486 (25.2%) | 3.83 |
| Total Families | 1,931 (100.0%) | 4.20 |
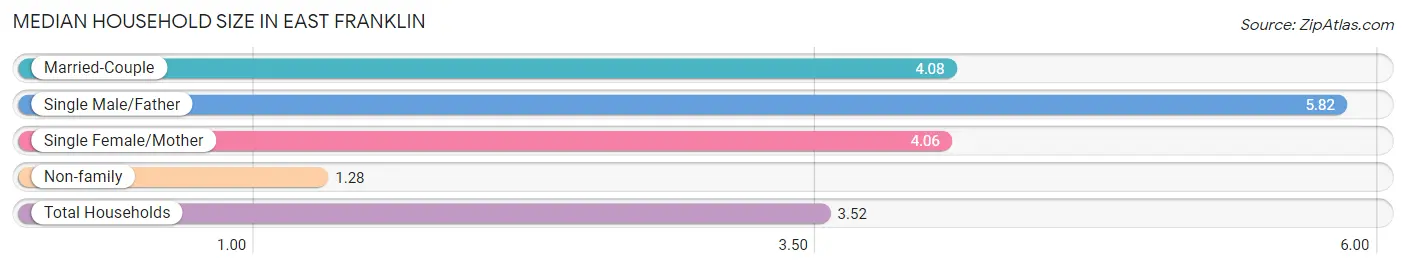
Median Household Size in East Franklin
The median household size in East Franklin is 3.52 persons per household, with single male/father households (302 | 11.4%) accounting for the largest median household size of 5.82 persons per household. non-family households (712 | 26.9%) represent the smallest median household size with 1.28 persons per household.
| Household Type | # Households | Household Size |
| Married-Couple | 1,143 (43.2%) | 4.08 |
| Single Male/Father | 302 (11.4%) | 5.82 |
| Single Female/Mother | 486 (18.4%) | 4.06 |
| Non-family | 712 (26.9%) | 1.28 |
| Total Households | 2,643 (100.0%) | 3.52 |
Household Size by Marriage Status in East Franklin
Out of a total of 2,643 households in East Franklin, 1,931 (73.1%) are family households, while 712 (26.9%) are nonfamily households. The most numerous type of family households are 4-person households, comprising 622, and the most common type of nonfamily households are 1-person households, comprising 602.
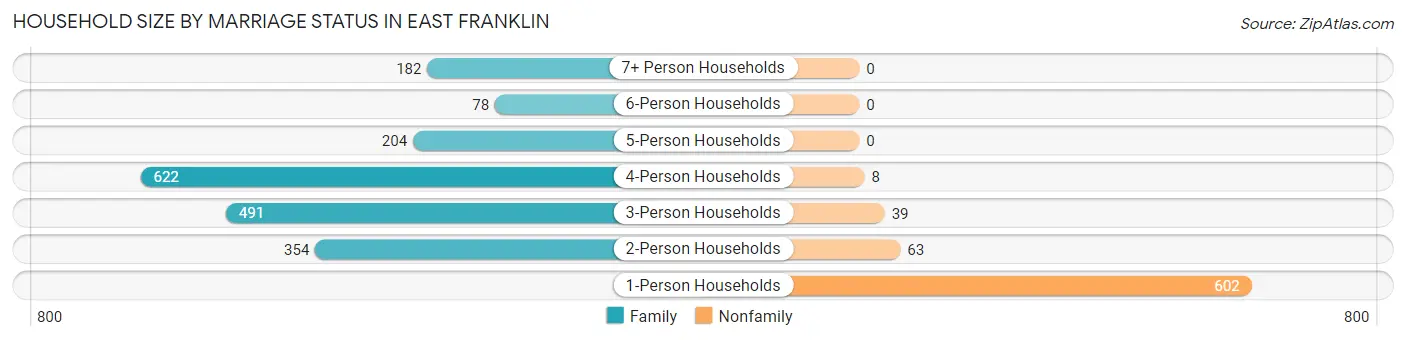
| Household Size | Family Households | Nonfamily Households |
| 1-Person Households | - | 602 (22.8%) |
| 2-Person Households | 354 (13.4%) | 63 (2.4%) |
| 3-Person Households | 491 (18.6%) | 39 (1.5%) |
| 4-Person Households | 622 (23.5%) | 8 (0.3%) |
| 5-Person Households | 204 (7.7%) | 0 (0.0%) |
| 6-Person Households | 78 (2.9%) | 0 (0.0%) |
| 7+ Person Households | 182 (6.9%) | 0 (0.0%) |
| Total | 1,931 (73.1%) | 712 (26.9%) |
Female Fertility in East Franklin
Fertility by Age in East Franklin
Average fertility rate in East Franklin is 113.0 births per 1,000 women. Women in the age bracket of 15 to 19 years have the highest fertility rate with 166.0 births per 1,000 women. Women in the age bracket of 20 to 34 years acount for 39.5% of all women with births.
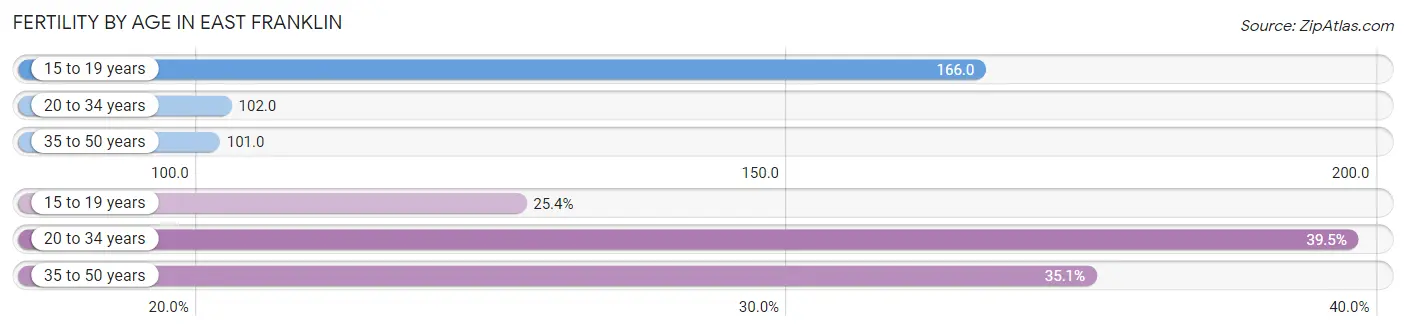
| Age Bracket | Women with Births | Births / 1,000 Women |
| 15 to 19 years | 63 (25.4%) | 166.0 |
| 20 to 34 years | 98 (39.5%) | 102.0 |
| 35 to 50 years | 87 (35.1%) | 101.0 |
| Total | 248 (100.0%) | 113.0 |
Fertility by Age by Marriage Status in East Franklin
29.8% of women with births (248) in East Franklin are married. The highest percentage of unmarried women with births falls into 15 to 19 years age bracket with 100.0% of them unmarried at the time of birth, while the lowest percentage of unmarried women with births belong to 20 to 34 years age bracket with 42.9% of them unmarried.
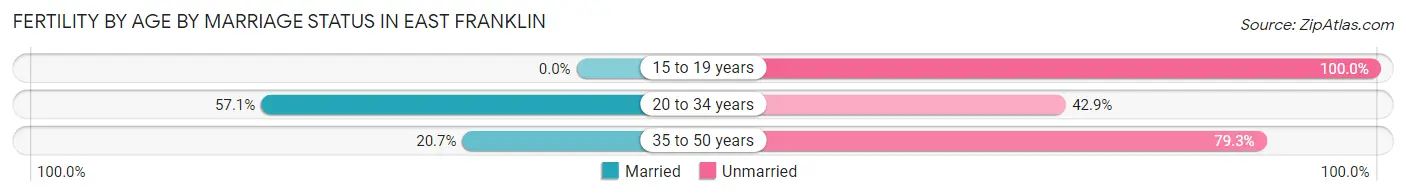
| Age Bracket | Married | Unmarried |
| 15 to 19 years | 0 (0.0%) | 63 (100.0%) |
| 20 to 34 years | 56 (57.1%) | 42 (42.9%) |
| 35 to 50 years | 18 (20.7%) | 69 (79.3%) |
| Total | 74 (29.8%) | 174 (70.2%) |
Fertility by Education in East Franklin
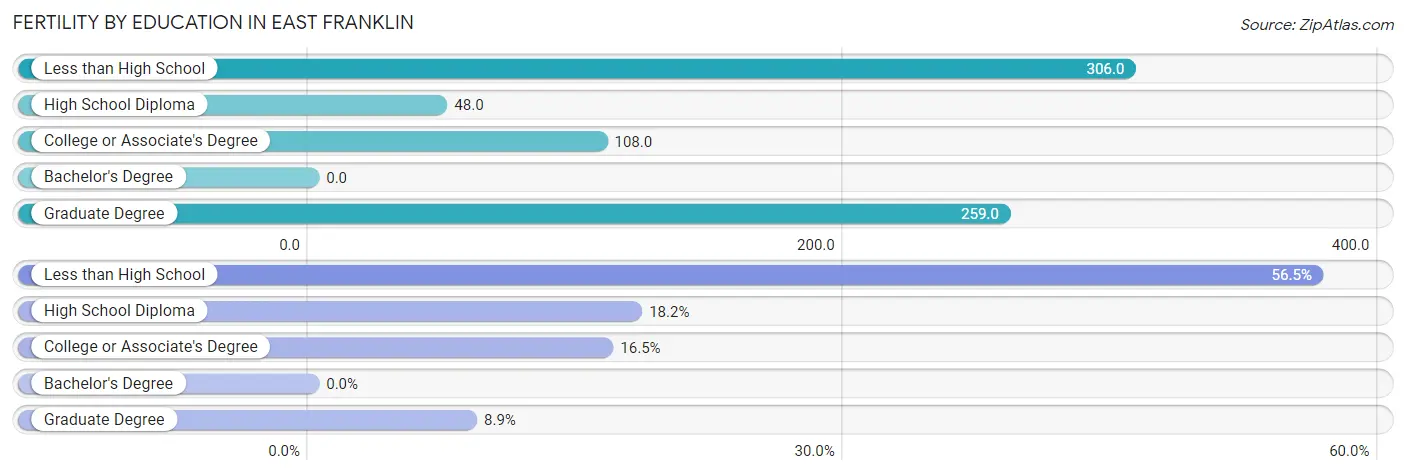
| Educational Attainment | Women with Births | Births / 1,000 Women |
| Less than High School | 140 (56.5%) | 306.0 |
| High School Diploma | 45 (18.1%) | 48.0 |
| College or Associate's Degree | 41 (16.5%) | 108.0 |
| Bachelor's Degree | 0 (0.0%) | 0.0 |
| Graduate Degree | 22 (8.9%) | 259.0 |
| Total | 248 (100.0%) | 113.0 |
Fertility by Education by Marriage Status in East Franklin
70.2% of women with births in East Franklin are unmarried. Women with the educational attainment of graduate degree are most likely to be married with 100.0% of them married at childbirth, while women with the educational attainment of college or associate's degree are least likely to be married with 100.0% of them unmarried at childbirth.
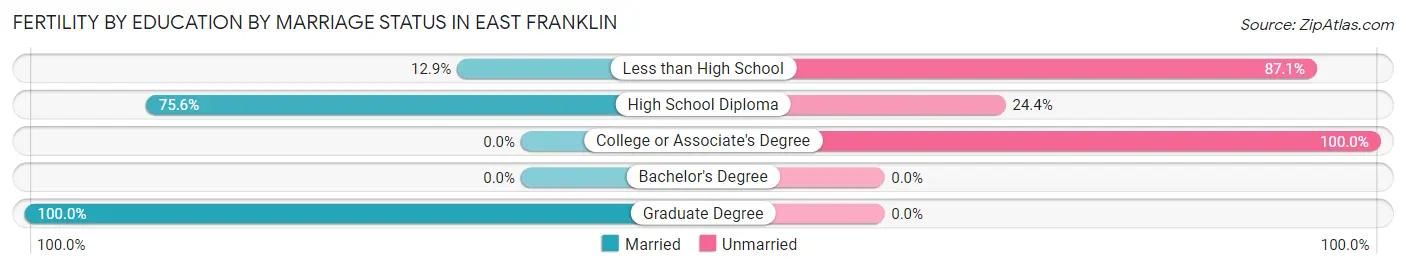
| Educational Attainment | Married | Unmarried |
| Less than High School | 18 (12.9%) | 122 (87.1%) |
| High School Diploma | 34 (75.6%) | 11 (24.4%) |
| College or Associate's Degree | 0 (0.0%) | 41 (100.0%) |
| Bachelor's Degree | 0 (0.0%) | 0 (0.0%) |
| Graduate Degree | 22 (100.0%) | 0 (0.0%) |
| Total | 74 (29.8%) | 174 (70.2%) |
Employment Characteristics in East Franklin
Employment by Class of Employer in East Franklin
Among the 4,478 employed individuals in East Franklin, private company employees (3,824 | 85.4%), not-for-profit organizations (185 | 4.1%), and self-employed (incorporated) (173 | 3.9%) make up the most common classes of employment.
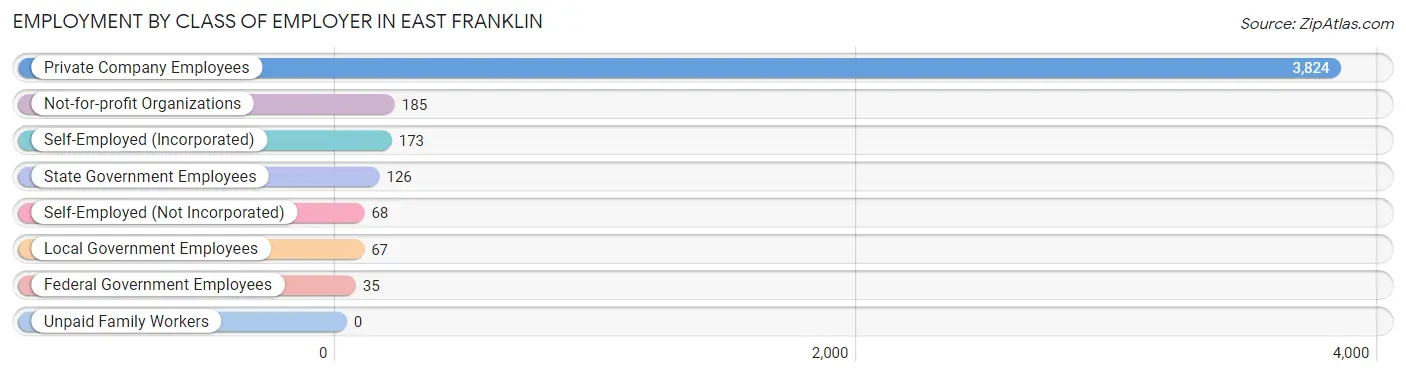
| Employer Class | # Employees | % Employees |
| Private Company Employees | 3,824 | 85.4% |
| Self-Employed (Incorporated) | 173 | 3.9% |
| Self-Employed (Not Incorporated) | 68 | 1.5% |
| Not-for-profit Organizations | 185 | 4.1% |
| Local Government Employees | 67 | 1.5% |
| State Government Employees | 126 | 2.8% |
| Federal Government Employees | 35 | 0.8% |
| Unpaid Family Workers | 0 | 0.0% |
| Total | 4,478 | 100.0% |
Employment Status by Age in East Franklin
According to the labor force statistics for East Franklin, out of the total population over 16 years of age (6,611), 75.5% or 4,991 individuals are in the labor force, with 4.1% or 205 of them unemployed. The age group with the highest labor force participation rate is 20 to 24 years, with 96.4% or 841 individuals in the labor force. Within the labor force, the 20 to 24 years age range has the highest percentage of unemployed individuals, with 19.4% or 163 of them being unemployed.
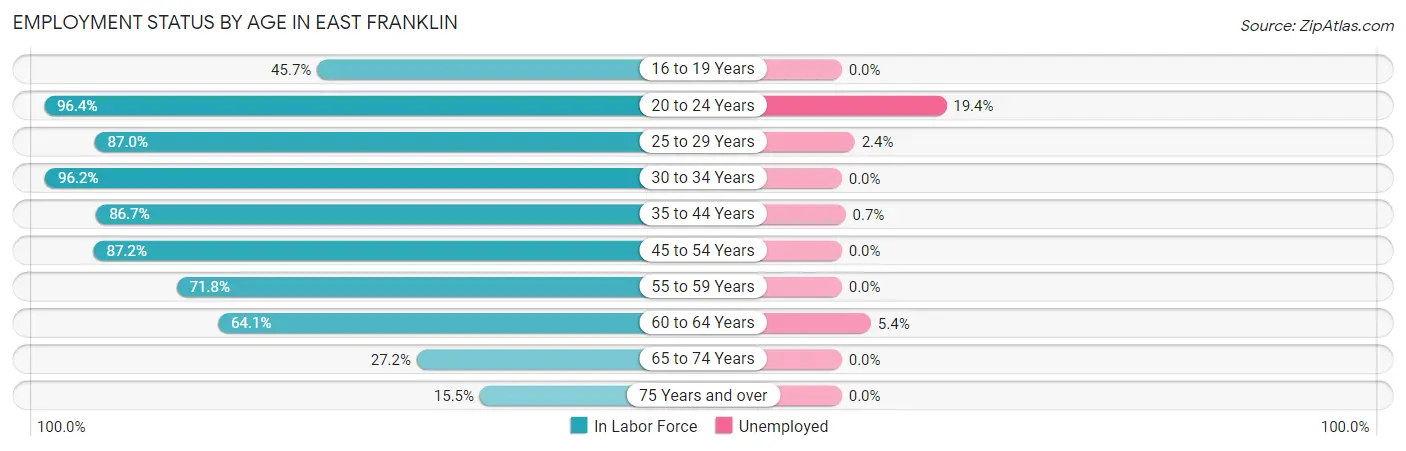
| Age Bracket | In Labor Force | Unemployed |
| 16 to 19 Years | 255 (45.7%) | 0 (0.0%) |
| 20 to 24 Years | 841 (96.4%) | 163 (19.4%) |
| 25 to 29 Years | 543 (87.0%) | 13 (2.4%) |
| 30 to 34 Years | 559 (96.2%) | 0 (0.0%) |
| 35 to 44 Years | 1,131 (86.7%) | 8 (0.7%) |
| 45 to 54 Years | 882 (87.2%) | 0 (0.0%) |
| 55 to 59 Years | 242 (71.8%) | 0 (0.0%) |
| 60 to 64 Years | 353 (64.1%) | 19 (5.4%) |
| 65 to 74 Years | 145 (27.2%) | 0 (0.0%) |
| 75 Years and over | 37 (15.5%) | 0 (0.0%) |
| Total | 4,991 (75.5%) | 205 (4.1%) |
Employment Status by Educational Attainment in East Franklin
According to labor force statistics for East Franklin, 84.1% of individuals (3,708) out of the total population between 25 and 64 years of age (4,409) are in the labor force, with 1.1% or 41 of them being unemployed. The group with the highest labor force participation rate are those with the educational attainment of college / associate degree, with 87.4% or 982 individuals in the labor force. Within the labor force, individuals with college / associate degree education have the highest percentage of unemployment, with 2.8% or 27 of them being unemployed.
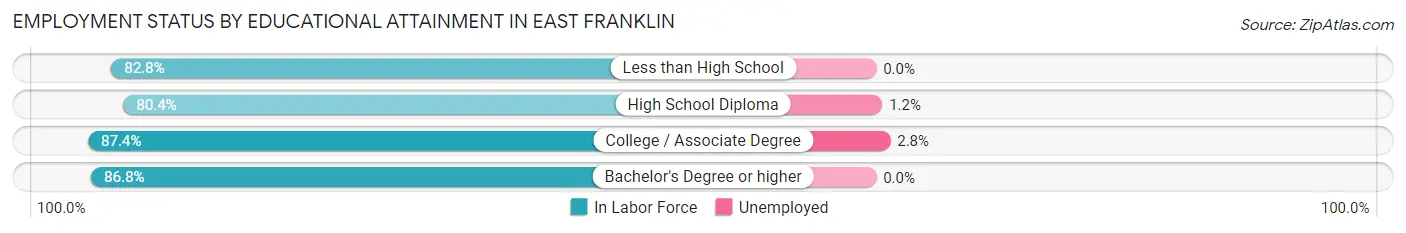
| Educational Attainment | In Labor Force | Unemployed |
| Less than High School | 826 (82.8%) | 0 (0.0%) |
| High School Diploma | 1,049 (80.4%) | 16 (1.2%) |
| College / Associate Degree | 982 (87.4%) | 31 (2.8%) |
| Bachelor's Degree or higher | 854 (86.8%) | 0 (0.0%) |
| Total | 3,708 (84.1%) | 48 (1.1%) |
Employment Occupations by Sex in East Franklin
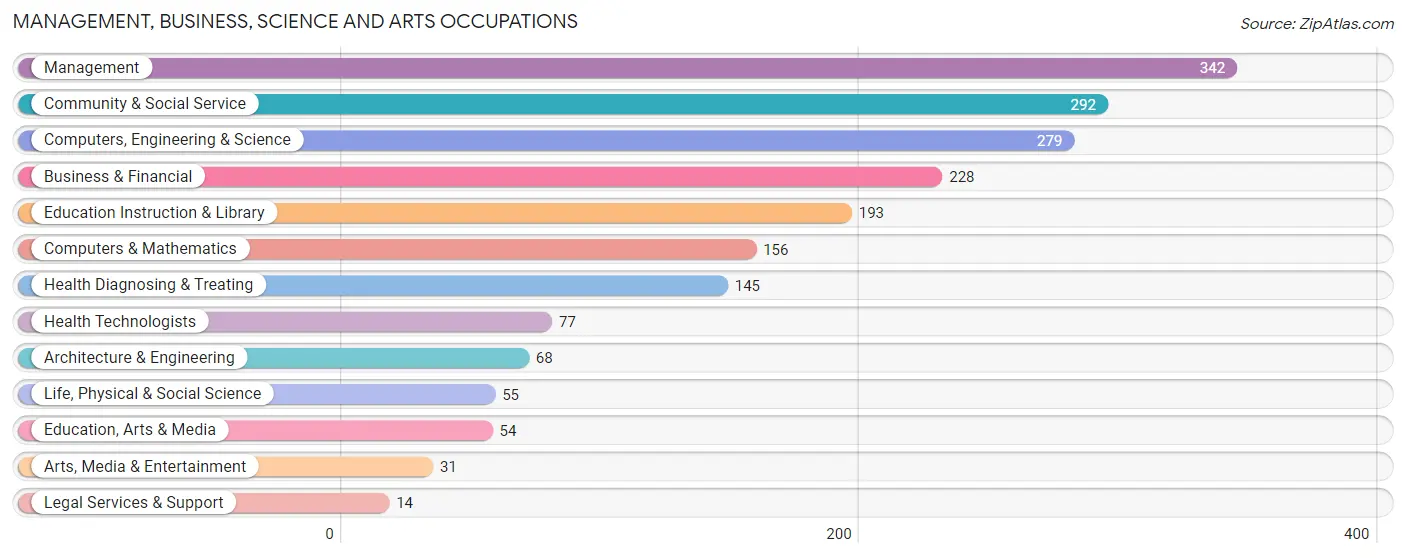
Management, Business, Science and Arts Occupations
The most common Management, Business, Science and Arts occupations in East Franklin are Management (342 | 7.1%), Community & Social Service (292 | 6.1%), Computers, Engineering & Science (279 | 5.8%), Business & Financial (228 | 4.8%), and Education Instruction & Library (193 | 4.0%).
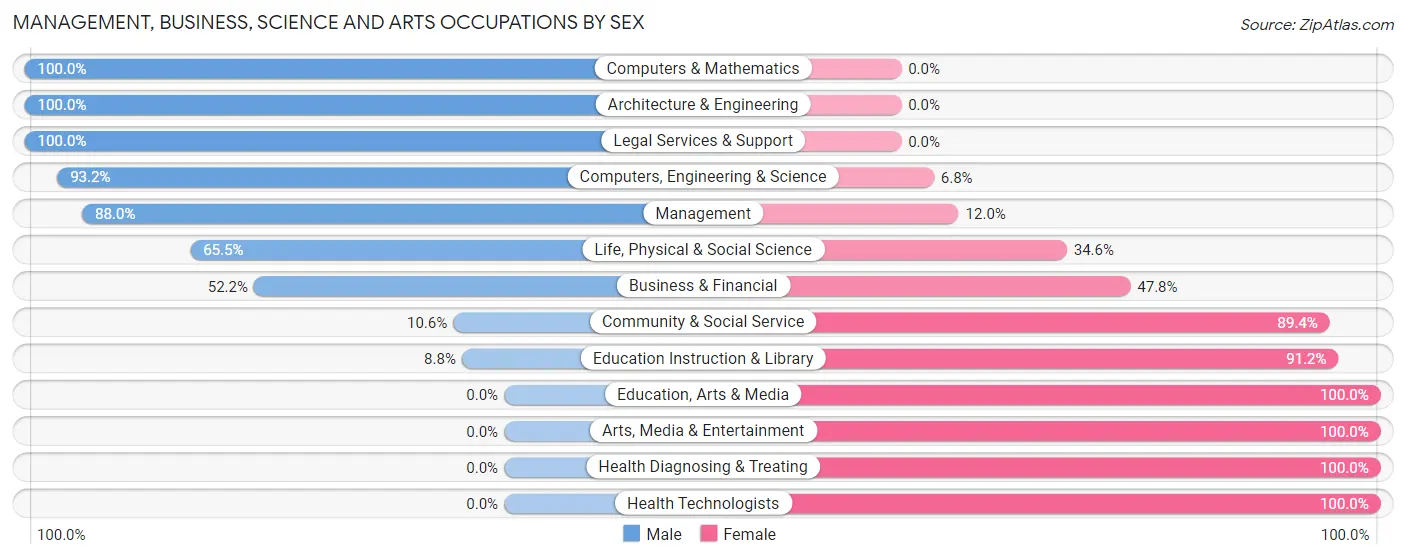
Management, Business, Science and Arts Occupations by Sex
Within the Management, Business, Science and Arts occupations in East Franklin, the most male-oriented occupations are Computers & Mathematics (100.0%), Architecture & Engineering (100.0%), and Legal Services & Support (100.0%), while the most female-oriented occupations are Education, Arts & Media (100.0%), Arts, Media & Entertainment (100.0%), and Health Diagnosing & Treating (100.0%).
| Occupation | Male | Female |
| Management | 301 (88.0%) | 41 (12.0%) |
| Business & Financial | 119 (52.2%) | 109 (47.8%) |
| Computers, Engineering & Science | 260 (93.2%) | 19 (6.8%) |
| Computers & Mathematics | 156 (100.0%) | 0 (0.0%) |
| Architecture & Engineering | 68 (100.0%) | 0 (0.0%) |
| Life, Physical & Social Science | 36 (65.4%) | 19 (34.5%) |
| Community & Social Service | 31 (10.6%) | 261 (89.4%) |
| Education, Arts & Media | 0 (0.0%) | 54 (100.0%) |
| Legal Services & Support | 14 (100.0%) | 0 (0.0%) |
| Education Instruction & Library | 17 (8.8%) | 176 (91.2%) |
| Arts, Media & Entertainment | 0 (0.0%) | 31 (100.0%) |
| Health Diagnosing & Treating | 0 (0.0%) | 145 (100.0%) |
| Health Technologists | 0 (0.0%) | 77 (100.0%) |
| Total (Category) | 711 (55.3%) | 575 (44.7%) |
| Total (Overall) | 2,573 (53.8%) | 2,212 (46.2%) |
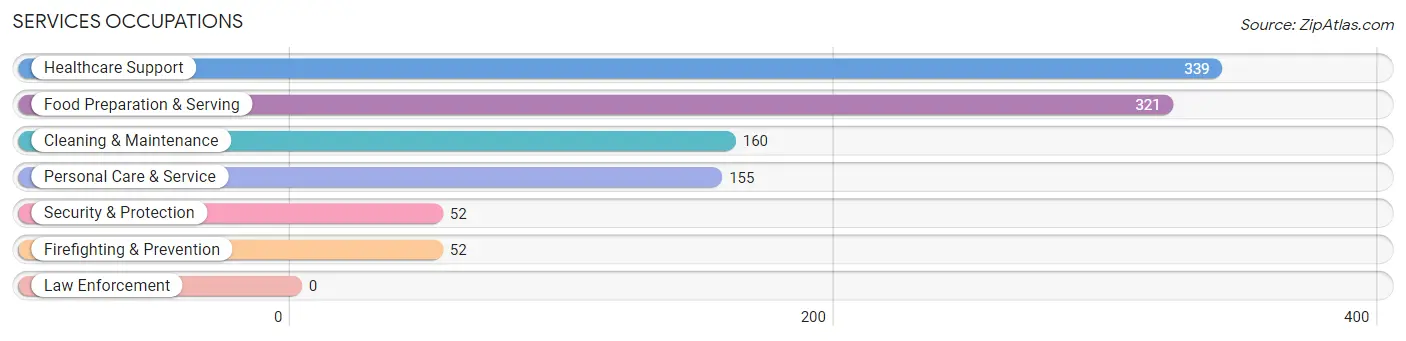
Services Occupations
The most common Services occupations in East Franklin are Healthcare Support (339 | 7.1%), Food Preparation & Serving (321 | 6.7%), Cleaning & Maintenance (160 | 3.3%), Personal Care & Service (155 | 3.2%), and Security & Protection (52 | 1.1%).
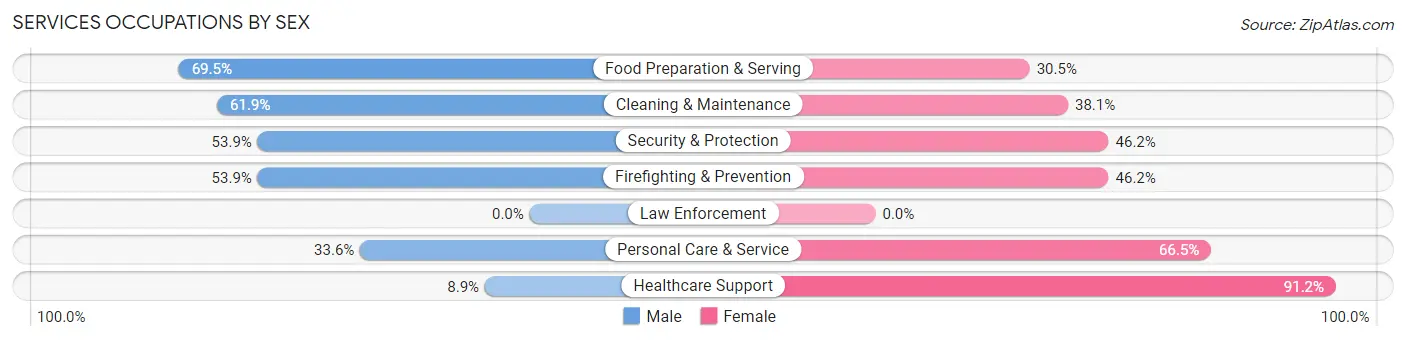
Services Occupations by Sex
Within the Services occupations in East Franklin, the most male-oriented occupations are Food Preparation & Serving (69.5%), Cleaning & Maintenance (61.9%), and Security & Protection (53.8%), while the most female-oriented occupations are Healthcare Support (91.1%), Personal Care & Service (66.4%), and Security & Protection (46.2%).
| Occupation | Male | Female |
| Healthcare Support | 30 (8.8%) | 309 (91.1%) |
| Security & Protection | 28 (53.8%) | 24 (46.2%) |
| Firefighting & Prevention | 28 (53.8%) | 24 (46.2%) |
| Law Enforcement | 0 (0.0%) | 0 (0.0%) |
| Food Preparation & Serving | 223 (69.5%) | 98 (30.5%) |
| Cleaning & Maintenance | 99 (61.9%) | 61 (38.1%) |
| Personal Care & Service | 52 (33.6%) | 103 (66.4%) |
| Total (Category) | 432 (42.1%) | 595 (57.9%) |
| Total (Overall) | 2,573 (53.8%) | 2,212 (46.2%) |
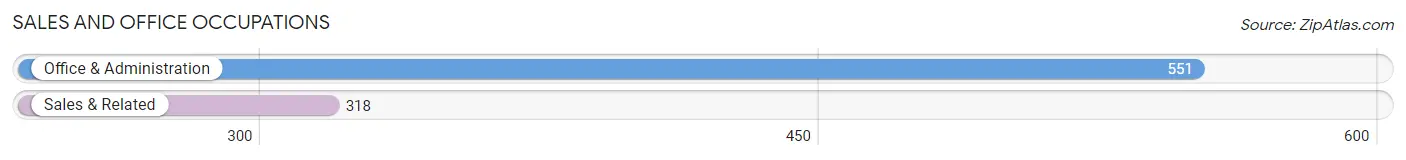
Sales and Office Occupations
The most common Sales and Office occupations in East Franklin are Office & Administration (551 | 11.5%), and Sales & Related (318 | 6.7%).
Sales and Office Occupations by Sex
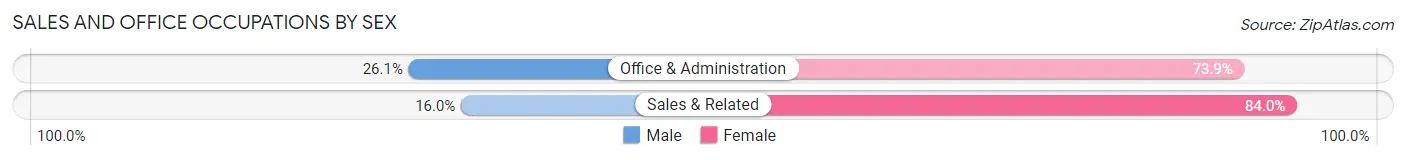
| Occupation | Male | Female |
| Sales & Related | 51 (16.0%) | 267 (84.0%) |
| Office & Administration | 144 (26.1%) | 407 (73.9%) |
| Total (Category) | 195 (22.4%) | 674 (77.6%) |
| Total (Overall) | 2,573 (53.8%) | 2,212 (46.2%) |
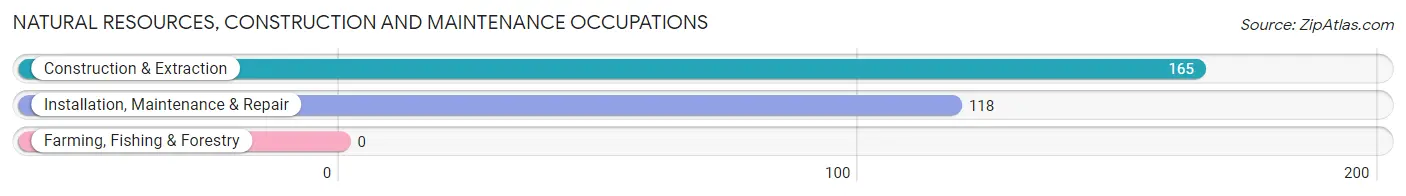
Natural Resources, Construction and Maintenance Occupations
The most common Natural Resources, Construction and Maintenance occupations in East Franklin are Construction & Extraction (165 | 3.5%), and Installation, Maintenance & Repair (118 | 2.5%).
Natural Resources, Construction and Maintenance Occupations by Sex
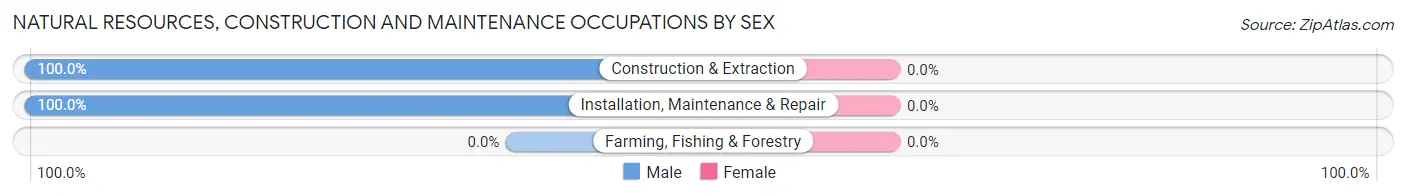
| Occupation | Male | Female |
| Farming, Fishing & Forestry | 0 (0.0%) | 0 (0.0%) |
| Construction & Extraction | 165 (100.0%) | 0 (0.0%) |
| Installation, Maintenance & Repair | 118 (100.0%) | 0 (0.0%) |
| Total (Category) | 283 (100.0%) | 0 (0.0%) |
| Total (Overall) | 2,573 (53.8%) | 2,212 (46.2%) |
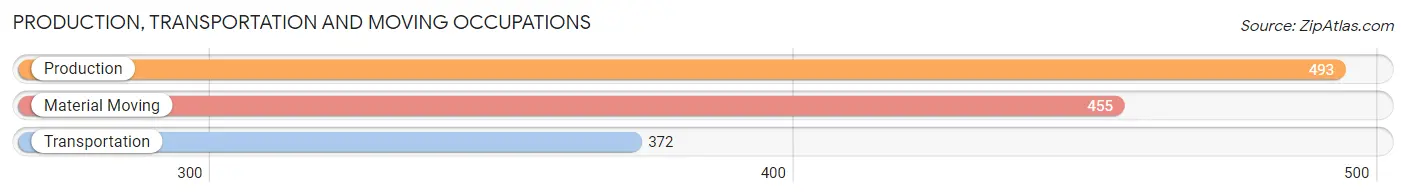
Production, Transportation and Moving Occupations
The most common Production, Transportation and Moving occupations in East Franklin are Production (493 | 10.3%), Material Moving (455 | 9.5%), and Transportation (372 | 7.8%).
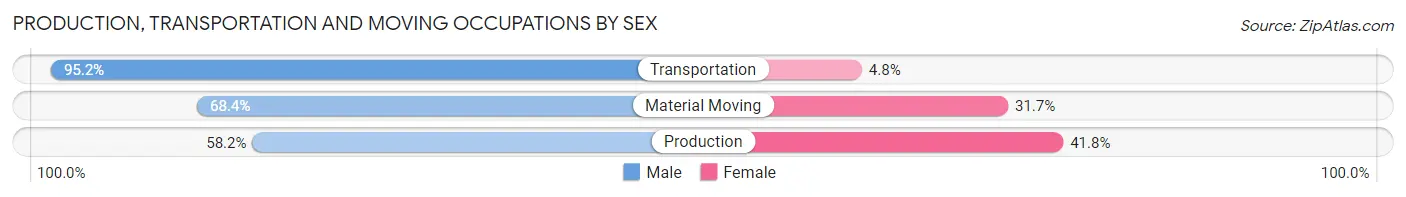
Production, Transportation and Moving Occupations by Sex
| Occupation | Male | Female |
| Production | 287 (58.2%) | 206 (41.8%) |
| Transportation | 354 (95.2%) | 18 (4.8%) |
| Material Moving | 311 (68.3%) | 144 (31.7%) |
| Total (Category) | 952 (72.1%) | 368 (27.9%) |
| Total (Overall) | 2,573 (53.8%) | 2,212 (46.2%) |
Employment Industries by Sex in East Franklin
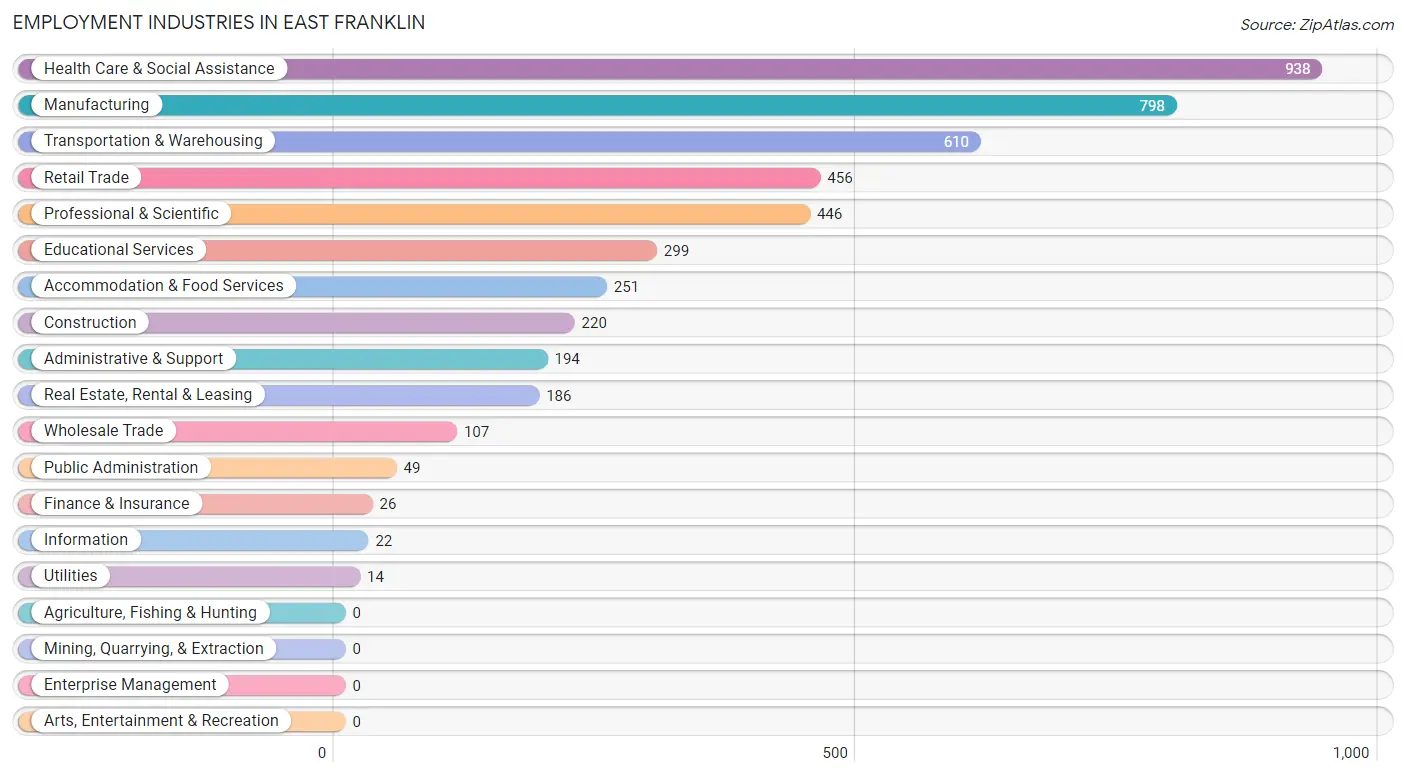
Employment Industries in East Franklin
The major employment industries in East Franklin include Health Care & Social Assistance (938 | 19.6%), Manufacturing (798 | 16.7%), Transportation & Warehousing (610 | 12.8%), Retail Trade (456 | 9.5%), and Professional & Scientific (446 | 9.3%).
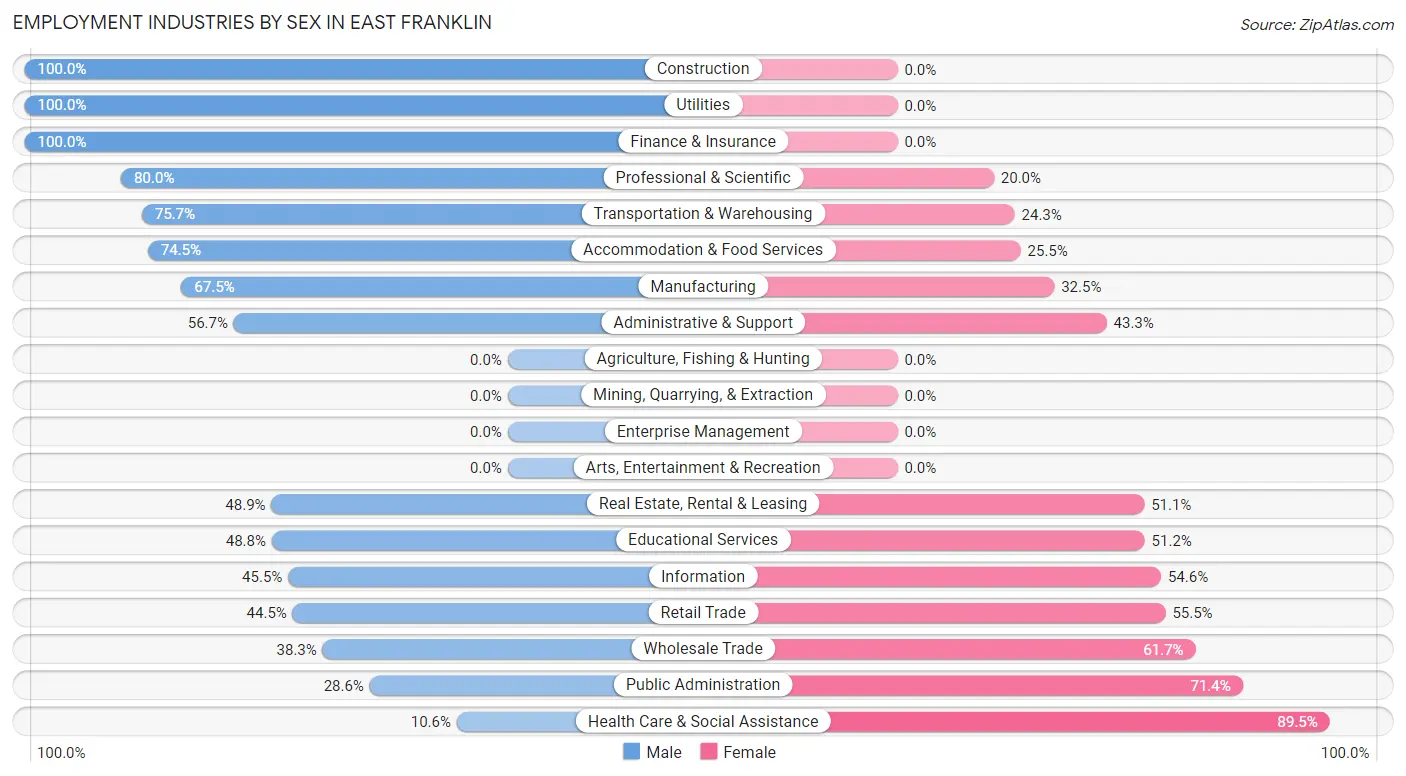
Employment Industries by Sex in East Franklin
The East Franklin industries that see more men than women are Construction (100.0%), Utilities (100.0%), and Finance & Insurance (100.0%), whereas the industries that tend to have a higher number of women are Health Care & Social Assistance (89.4%), Public Administration (71.4%), and Wholesale Trade (61.7%).
| Industry | Male | Female |
| Agriculture, Fishing & Hunting | 0 (0.0%) | 0 (0.0%) |
| Mining, Quarrying, & Extraction | 0 (0.0%) | 0 (0.0%) |
| Construction | 220 (100.0%) | 0 (0.0%) |
| Manufacturing | 539 (67.5%) | 259 (32.5%) |
| Wholesale Trade | 41 (38.3%) | 66 (61.7%) |
| Retail Trade | 203 (44.5%) | 253 (55.5%) |
| Transportation & Warehousing | 462 (75.7%) | 148 (24.3%) |
| Utilities | 14 (100.0%) | 0 (0.0%) |
| Information | 10 (45.5%) | 12 (54.5%) |
| Finance & Insurance | 26 (100.0%) | 0 (0.0%) |
| Real Estate, Rental & Leasing | 91 (48.9%) | 95 (51.1%) |
| Professional & Scientific | 357 (80.0%) | 89 (20.0%) |
| Enterprise Management | 0 (0.0%) | 0 (0.0%) |
| Administrative & Support | 110 (56.7%) | 84 (43.3%) |
| Educational Services | 146 (48.8%) | 153 (51.2%) |
| Health Care & Social Assistance | 99 (10.5%) | 839 (89.4%) |
| Arts, Entertainment & Recreation | 0 (0.0%) | 0 (0.0%) |
| Accommodation & Food Services | 187 (74.5%) | 64 (25.5%) |
| Public Administration | 14 (28.6%) | 35 (71.4%) |
| Total | 2,573 (53.8%) | 2,212 (46.2%) |
Education in East Franklin
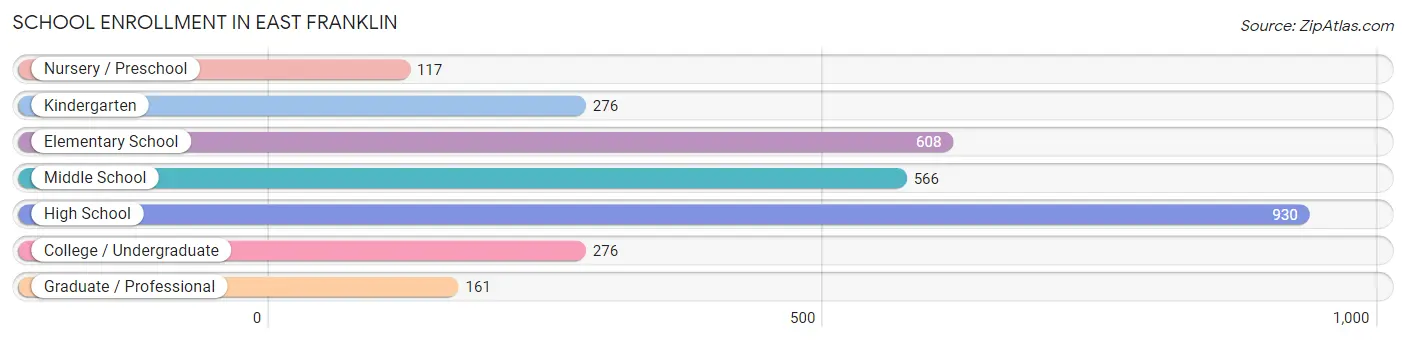
School Enrollment in East Franklin
The most common levels of schooling among the 2,934 students in East Franklin are high school (930 | 31.7%), elementary school (608 | 20.7%), and middle school (566 | 19.3%).
| School Level | # Students | % Students |
| Nursery / Preschool | 117 | 4.0% |
| Kindergarten | 276 | 9.4% |
| Elementary School | 608 | 20.7% |
| Middle School | 566 | 19.3% |
| High School | 930 | 31.7% |
| College / Undergraduate | 276 | 9.4% |
| Graduate / Professional | 161 | 5.5% |
| Total | 2,934 | 100.0% |
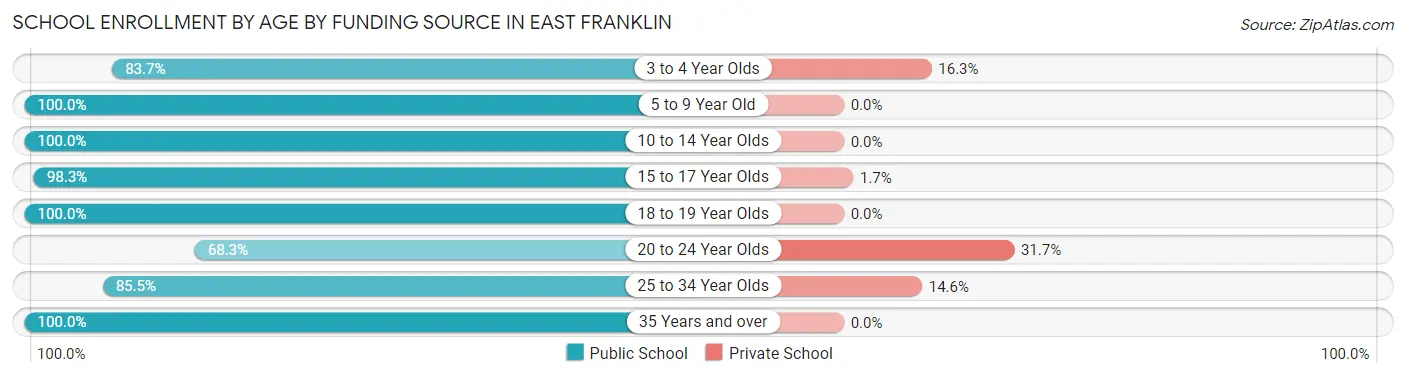
School Enrollment by Age by Funding Source in East Franklin
Out of a total of 2,934 students who are enrolled in schools in East Franklin, 158 (5.4%) attend a private institution, while the remaining 2,776 (94.6%) are enrolled in public schools. The age group of 20 to 24 year olds has the highest likelihood of being enrolled in private schools, with 85 (31.7% in the age bracket) enrolled. Conversely, the age group of 5 to 9 year old has the lowest likelihood of being enrolled in a private school, with 649 (100.0% in the age bracket) attending a public institution.
| Age Bracket | Public School | Private School |
| 3 to 4 Year Olds | 210 (83.7%) | 41 (16.3%) |
| 5 to 9 Year Old | 649 (100.0%) | 0 (0.0%) |
| 10 to 14 Year Olds | 914 (100.0%) | 0 (0.0%) |
| 15 to 17 Year Olds | 509 (98.3%) | 9 (1.7%) |
| 18 to 19 Year Olds | 138 (100.0%) | 0 (0.0%) |
| 20 to 24 Year Olds | 183 (68.3%) | 85 (31.7%) |
| 25 to 34 Year Olds | 141 (85.5%) | 24 (14.5%) |
| 35 Years and over | 31 (100.0%) | 0 (0.0%) |
| Total | 2,776 (94.6%) | 158 (5.4%) |
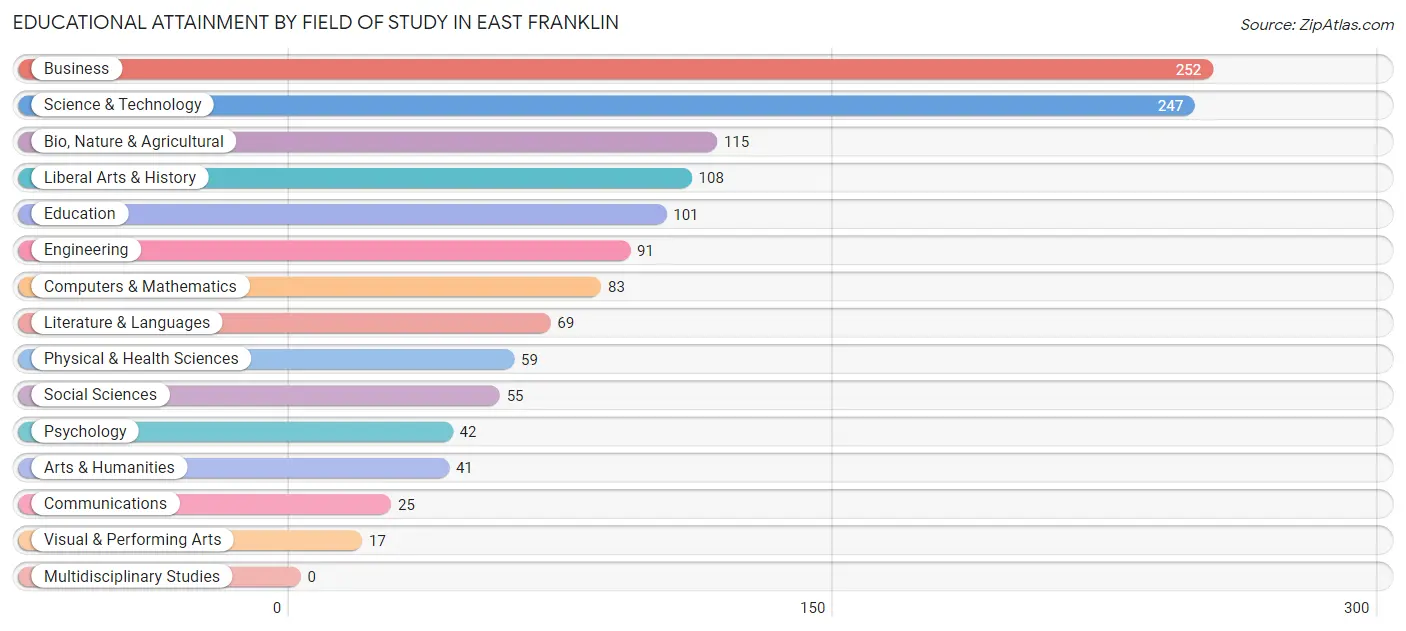
Educational Attainment by Field of Study in East Franklin
Business (252 | 19.3%), science & technology (247 | 18.9%), bio, nature & agricultural (115 | 8.8%), liberal arts & history (108 | 8.3%), and education (101 | 7.7%) are the most common fields of study among 1,305 individuals in East Franklin who have obtained a bachelor's degree or higher.
| Field of Study | # Graduates | % Graduates |
| Computers & Mathematics | 83 | 6.4% |
| Bio, Nature & Agricultural | 115 | 8.8% |
| Physical & Health Sciences | 59 | 4.5% |
| Psychology | 42 | 3.2% |
| Social Sciences | 55 | 4.2% |
| Engineering | 91 | 7.0% |
| Multidisciplinary Studies | 0 | 0.0% |
| Science & Technology | 247 | 18.9% |
| Business | 252 | 19.3% |
| Education | 101 | 7.7% |
| Literature & Languages | 69 | 5.3% |
| Liberal Arts & History | 108 | 8.3% |
| Visual & Performing Arts | 17 | 1.3% |
| Communications | 25 | 1.9% |
| Arts & Humanities | 41 | 3.1% |
| Total | 1,305 | 100.0% |
Transportation & Commute in East Franklin
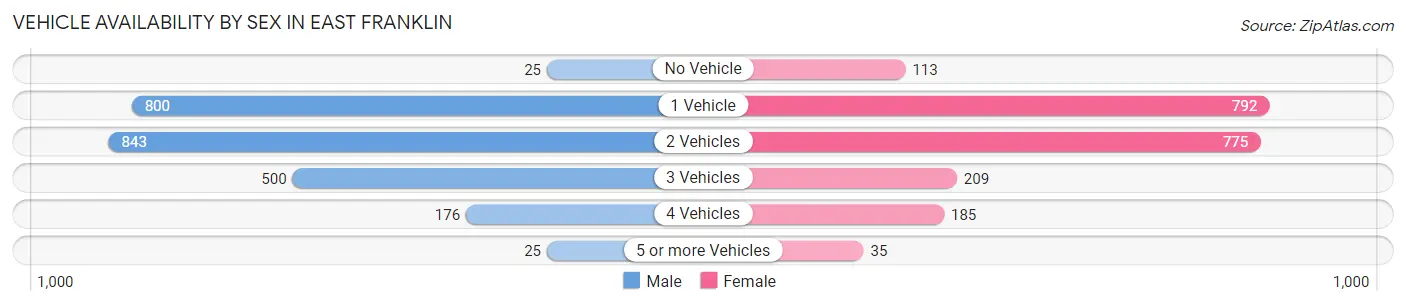
Vehicle Availability by Sex in East Franklin
The most prevalent vehicle ownership categories in East Franklin are males with 2 vehicles (843, accounting for 35.6%) and females with 2 vehicles (775, making up 40.0%).
| Vehicles Available | Male | Female |
| No Vehicle | 25 (1.1%) | 113 (5.4%) |
| 1 Vehicle | 800 (33.8%) | 792 (37.6%) |
| 2 Vehicles | 843 (35.6%) | 775 (36.7%) |
| 3 Vehicles | 500 (21.1%) | 209 (9.9%) |
| 4 Vehicles | 176 (7.4%) | 185 (8.8%) |
| 5 or more Vehicles | 25 (1.1%) | 35 (1.7%) |
| Total | 2,369 (100.0%) | 2,109 (100.0%) |
Commute Time in East Franklin
The most frequently occuring commute durations in East Franklin are 20 to 24 minutes (713 commuters, 17.2%), 15 to 19 minutes (621 commuters, 15.0%), and 30 to 34 minutes (456 commuters, 11.0%).
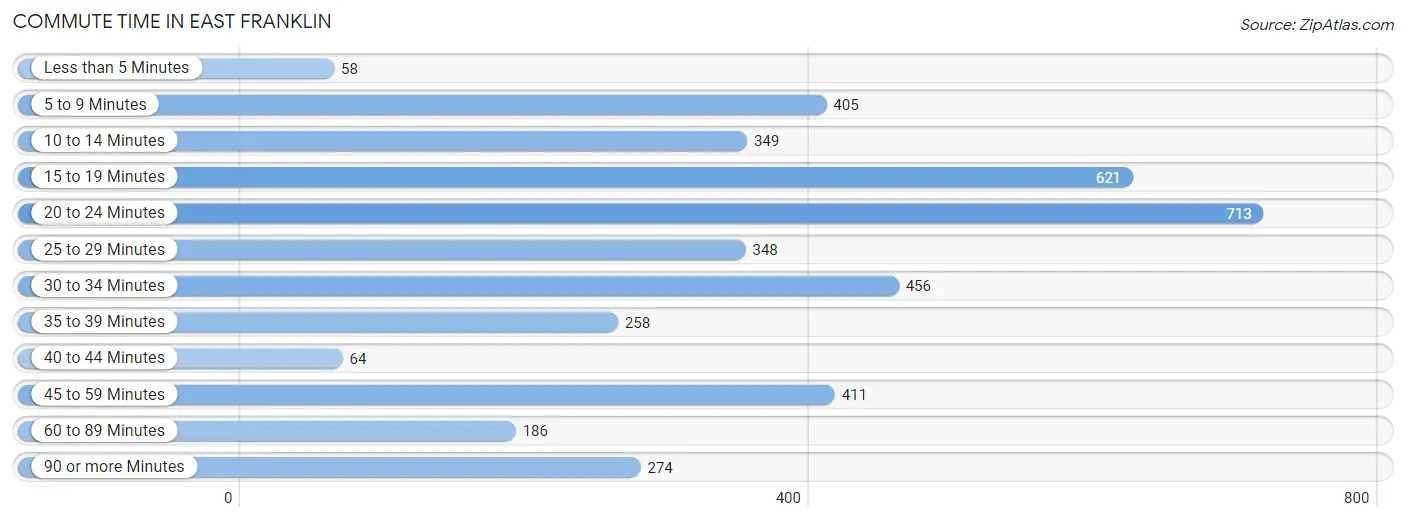
| Commute Time | # Commuters | % Commuters |
| Less than 5 Minutes | 58 | 1.4% |
| 5 to 9 Minutes | 405 | 9.8% |
| 10 to 14 Minutes | 349 | 8.4% |
| 15 to 19 Minutes | 621 | 15.0% |
| 20 to 24 Minutes | 713 | 17.2% |
| 25 to 29 Minutes | 348 | 8.4% |
| 30 to 34 Minutes | 456 | 11.0% |
| 35 to 39 Minutes | 258 | 6.2% |
| 40 to 44 Minutes | 64 | 1.5% |
| 45 to 59 Minutes | 411 | 9.9% |
| 60 to 89 Minutes | 186 | 4.5% |
| 90 or more Minutes | 274 | 6.6% |
Commute Time by Sex in East Franklin
The most common commute times in East Franklin are 20 to 24 minutes (417 commuters, 18.8%) for males and 5 to 9 minutes (317 commuters, 16.5%) for females.
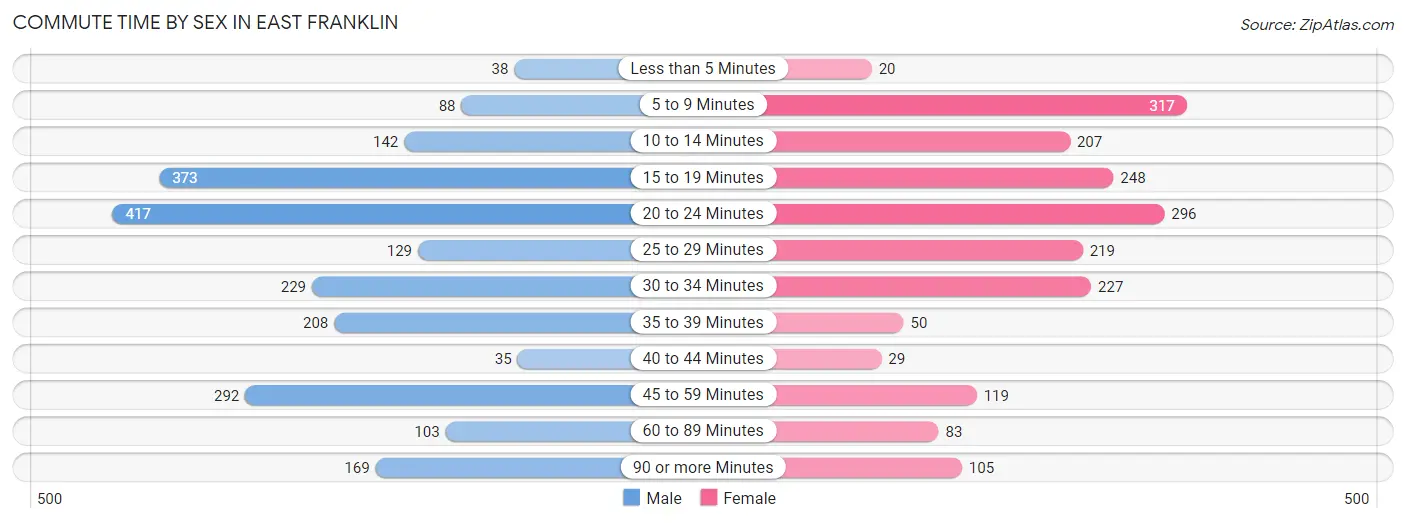
| Commute Time | Male | Female |
| Less than 5 Minutes | 38 (1.7%) | 20 (1.0%) |
| 5 to 9 Minutes | 88 (4.0%) | 317 (16.5%) |
| 10 to 14 Minutes | 142 (6.4%) | 207 (10.8%) |
| 15 to 19 Minutes | 373 (16.8%) | 248 (12.9%) |
| 20 to 24 Minutes | 417 (18.8%) | 296 (15.4%) |
| 25 to 29 Minutes | 129 (5.8%) | 219 (11.4%) |
| 30 to 34 Minutes | 229 (10.3%) | 227 (11.8%) |
| 35 to 39 Minutes | 208 (9.4%) | 50 (2.6%) |
| 40 to 44 Minutes | 35 (1.6%) | 29 (1.5%) |
| 45 to 59 Minutes | 292 (13.1%) | 119 (6.2%) |
| 60 to 89 Minutes | 103 (4.6%) | 83 (4.3%) |
| 90 or more Minutes | 169 (7.6%) | 105 (5.5%) |
Time of Departure to Work by Sex in East Franklin
The most frequent times of departure to work in East Franklin are 5:00 AM to 5:29 AM (362, 16.3%) for males and 6:00 AM to 6:29 AM (377, 19.6%) for females.
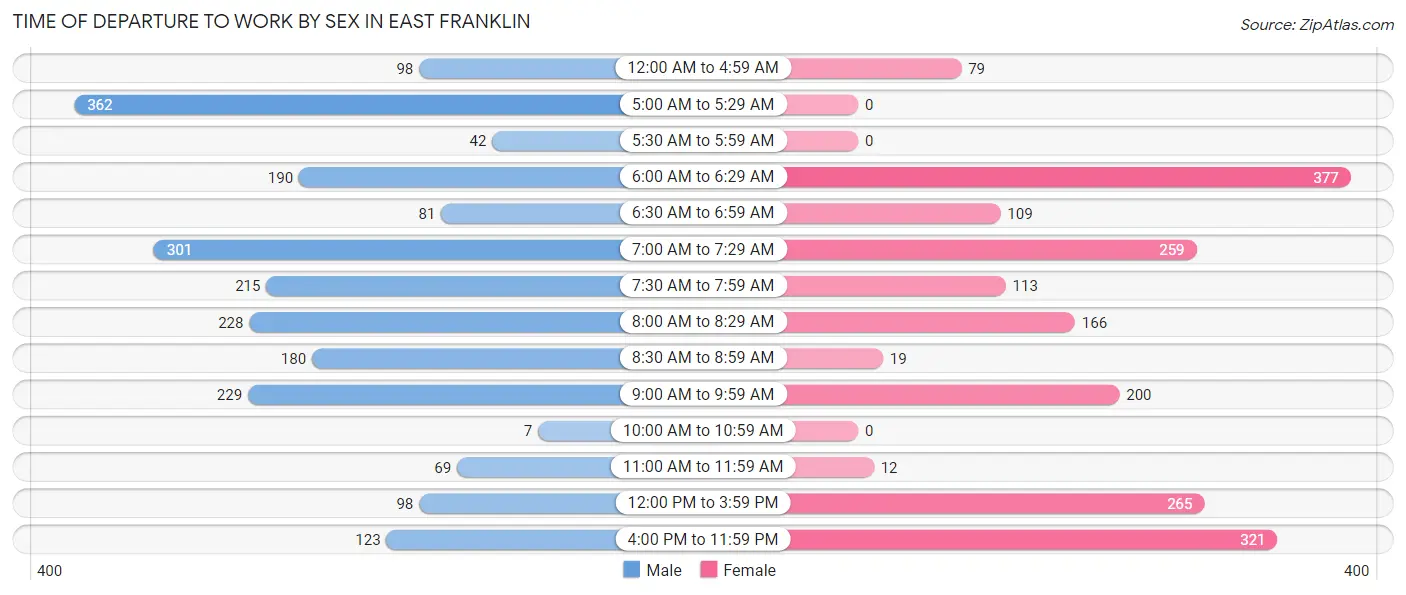
| Time of Departure | Male | Female |
| 12:00 AM to 4:59 AM | 98 (4.4%) | 79 (4.1%) |
| 5:00 AM to 5:29 AM | 362 (16.3%) | 0 (0.0%) |
| 5:30 AM to 5:59 AM | 42 (1.9%) | 0 (0.0%) |
| 6:00 AM to 6:29 AM | 190 (8.6%) | 377 (19.6%) |
| 6:30 AM to 6:59 AM | 81 (3.6%) | 109 (5.7%) |
| 7:00 AM to 7:29 AM | 301 (13.5%) | 259 (13.5%) |
| 7:30 AM to 7:59 AM | 215 (9.7%) | 113 (5.9%) |
| 8:00 AM to 8:29 AM | 228 (10.3%) | 166 (8.6%) |
| 8:30 AM to 8:59 AM | 180 (8.1%) | 19 (1.0%) |
| 9:00 AM to 9:59 AM | 229 (10.3%) | 200 (10.4%) |
| 10:00 AM to 10:59 AM | 7 (0.3%) | 0 (0.0%) |
| 11:00 AM to 11:59 AM | 69 (3.1%) | 12 (0.6%) |
| 12:00 PM to 3:59 PM | 98 (4.4%) | 265 (13.8%) |
| 4:00 PM to 11:59 PM | 123 (5.5%) | 321 (16.7%) |
| Total | 2,223 (100.0%) | 1,920 (100.0%) |
Housing Occupancy in East Franklin
Occupancy by Ownership in East Franklin
Of the total 2,643 dwellings in East Franklin, owner-occupied units account for 1,328 (50.2%), while renter-occupied units make up 1,315 (49.7%).
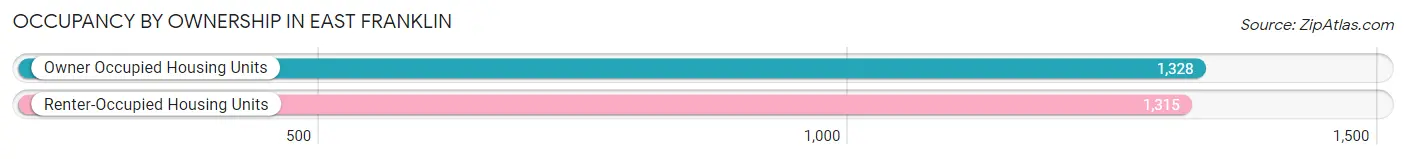
| Occupancy | # Housing Units | % Housing Units |
| Owner Occupied Housing Units | 1,328 | 50.2% |
| Renter-Occupied Housing Units | 1,315 | 49.7% |
| Total Occupied Housing Units | 2,643 | 100.0% |
Occupancy by Household Size in East Franklin
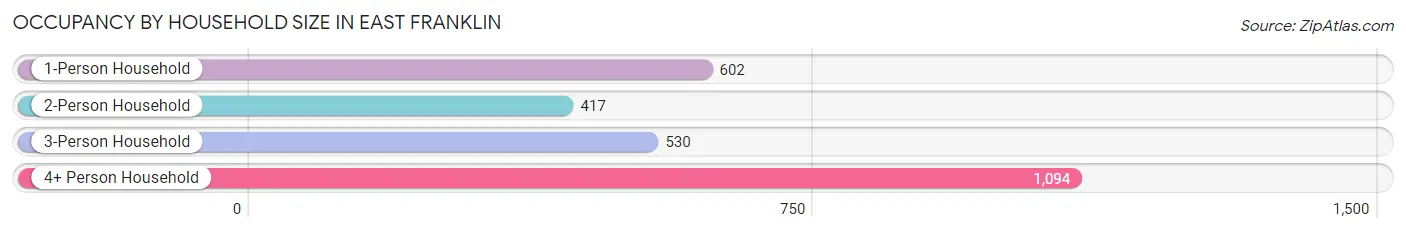
| Household Size | # Housing Units | % Housing Units |
| 1-Person Household | 602 | 22.8% |
| 2-Person Household | 417 | 15.8% |
| 3-Person Household | 530 | 20.1% |
| 4+ Person Household | 1,094 | 41.4% |
| Total Housing Units | 2,643 | 100.0% |
Occupancy by Ownership by Household Size in East Franklin
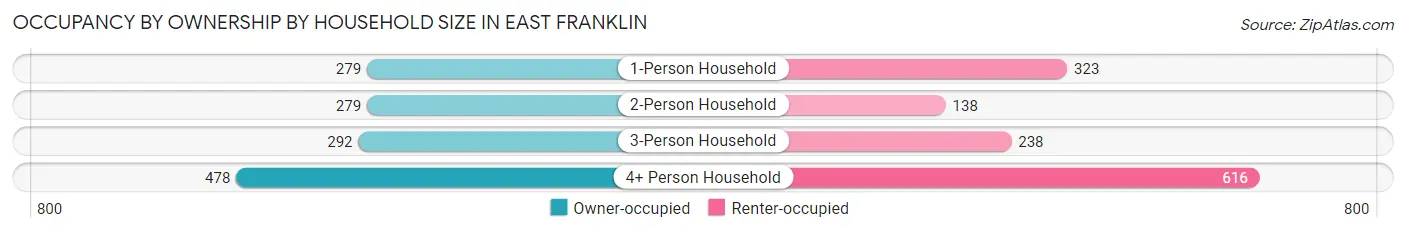
| Household Size | Owner-occupied | Renter-occupied |
| 1-Person Household | 279 (46.4%) | 323 (53.6%) |
| 2-Person Household | 279 (66.9%) | 138 (33.1%) |
| 3-Person Household | 292 (55.1%) | 238 (44.9%) |
| 4+ Person Household | 478 (43.7%) | 616 (56.3%) |
| Total Housing Units | 1,328 (50.2%) | 1,315 (49.7%) |
Occupancy by Educational Attainment in East Franklin
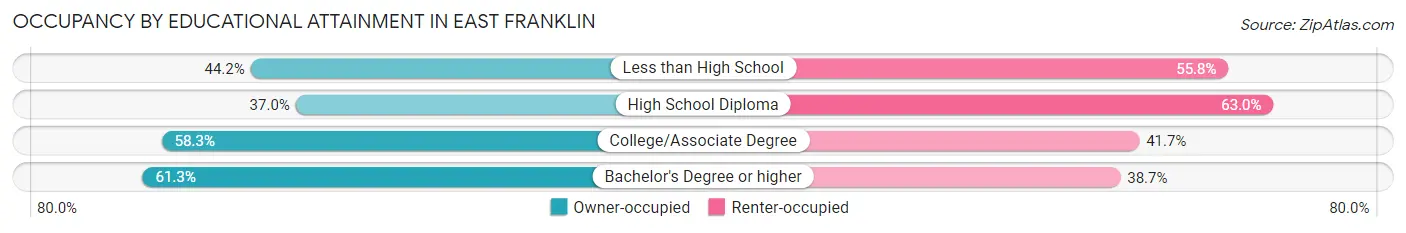
| Household Size | Owner-occupied | Renter-occupied |
| Less than High School | 155 (44.2%) | 196 (55.8%) |
| High School Diploma | 319 (37.0%) | 543 (63.0%) |
| College/Associate Degree | 433 (58.3%) | 310 (41.7%) |
| Bachelor's Degree or higher | 421 (61.3%) | 266 (38.7%) |
Occupancy by Age of Householder in East Franklin
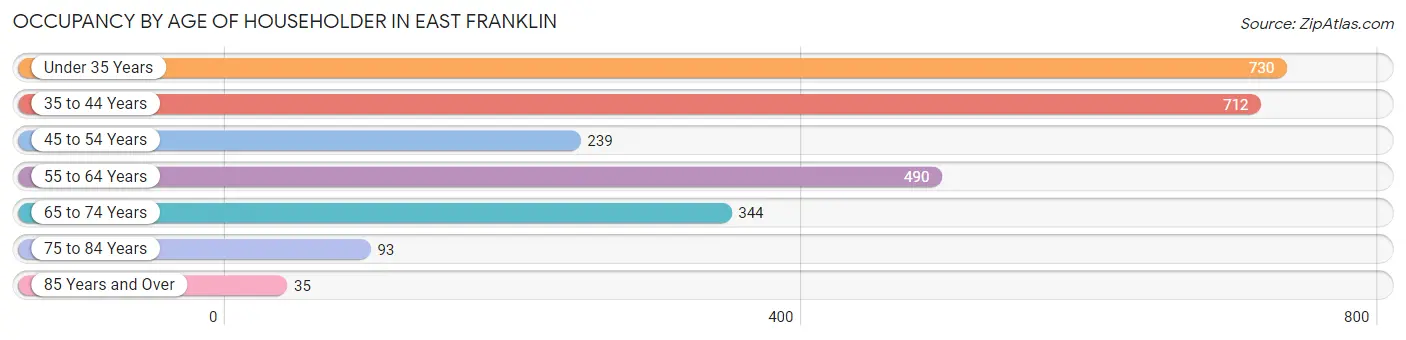
| Age Bracket | # Households | % Households |
| Under 35 Years | 730 | 27.6% |
| 35 to 44 Years | 712 | 26.9% |
| 45 to 54 Years | 239 | 9.0% |
| 55 to 64 Years | 490 | 18.5% |
| 65 to 74 Years | 344 | 13.0% |
| 75 to 84 Years | 93 | 3.5% |
| 85 Years and Over | 35 | 1.3% |
| Total | 2,643 | 100.0% |
Housing Finances in East Franklin
Median Income by Occupancy in East Franklin
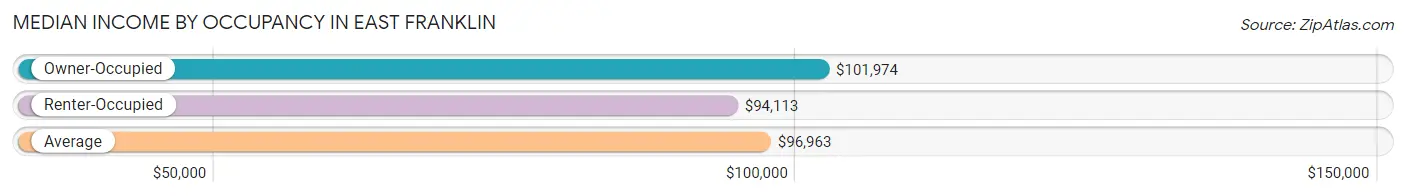
| Occupancy Type | # Households | Median Income |
| Owner-Occupied | 1,328 (50.2%) | $101,974 |
| Renter-Occupied | 1,315 (49.7%) | $94,113 |
| Average | 2,643 (100.0%) | $96,963 |
Occupancy by Householder Income Bracket in East Franklin
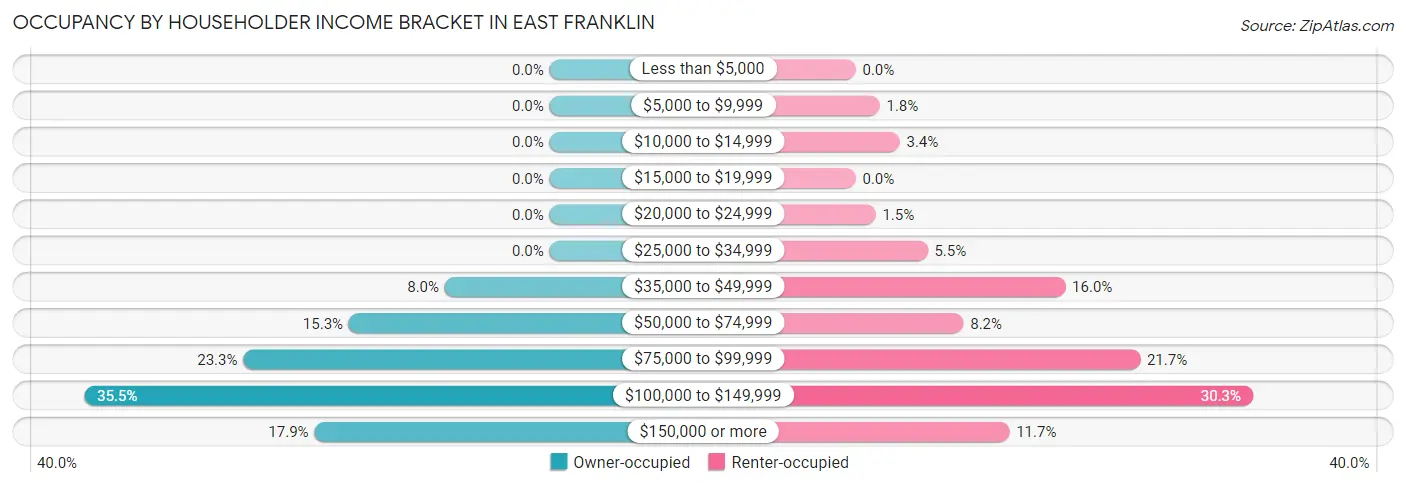
| Income Bracket | Owner-occupied | Renter-occupied |
| Less than $5,000 | 0 (0.0%) | 0 (0.0%) |
| $5,000 to $9,999 | 0 (0.0%) | 24 (1.8%) |
| $10,000 to $14,999 | 0 (0.0%) | 44 (3.4%) |
| $15,000 to $19,999 | 0 (0.0%) | 0 (0.0%) |
| $20,000 to $24,999 | 0 (0.0%) | 20 (1.5%) |
| $25,000 to $34,999 | 0 (0.0%) | 72 (5.5%) |
| $35,000 to $49,999 | 106 (8.0%) | 210 (16.0%) |
| $50,000 to $74,999 | 203 (15.3%) | 108 (8.2%) |
| $75,000 to $99,999 | 310 (23.3%) | 285 (21.7%) |
| $100,000 to $149,999 | 471 (35.5%) | 398 (30.3%) |
| $150,000 or more | 238 (17.9%) | 154 (11.7%) |
| Total | 1,328 (100.0%) | 1,315 (100.0%) |
Monthly Housing Cost Tiers in East Franklin
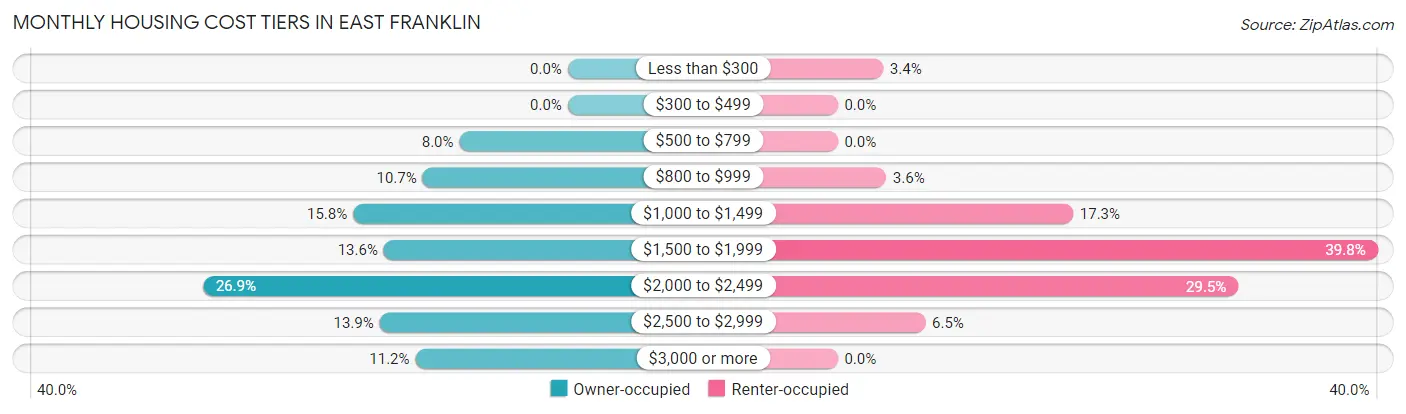
| Monthly Cost | Owner-occupied | Renter-occupied |
| Less than $300 | 0 (0.0%) | 44 (3.4%) |
| $300 to $499 | 0 (0.0%) | 0 (0.0%) |
| $500 to $799 | 106 (8.0%) | 0 (0.0%) |
| $800 to $999 | 142 (10.7%) | 47 (3.6%) |
| $1,000 to $1,499 | 210 (15.8%) | 228 (17.3%) |
| $1,500 to $1,999 | 180 (13.6%) | 523 (39.8%) |
| $2,000 to $2,499 | 357 (26.9%) | 388 (29.5%) |
| $2,500 to $2,999 | 184 (13.9%) | 85 (6.5%) |
| $3,000 or more | 149 (11.2%) | 0 (0.0%) |
| Total | 1,328 (100.0%) | 1,315 (100.0%) |
Physical Housing Characteristics in East Franklin
Housing Structures in East Franklin
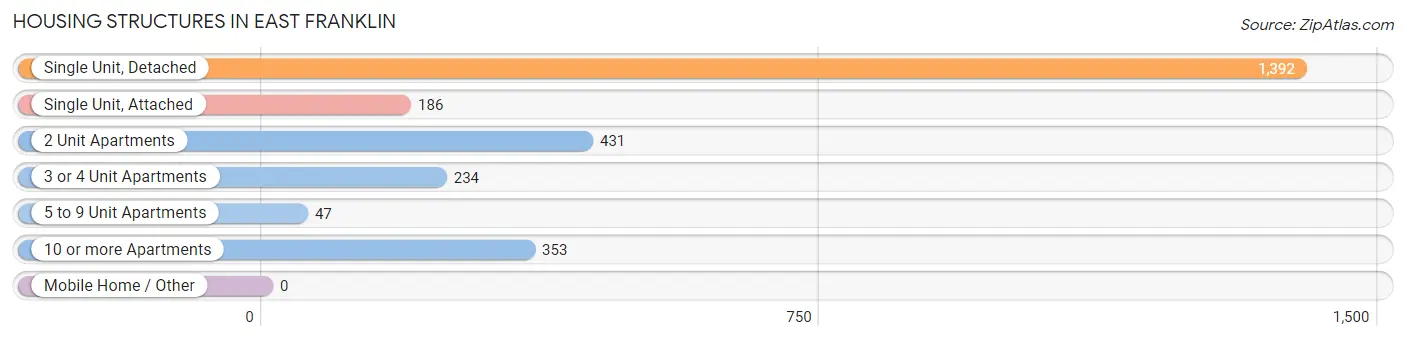
| Structure Type | # Housing Units | % Housing Units |
| Single Unit, Detached | 1,392 | 52.7% |
| Single Unit, Attached | 186 | 7.0% |
| 2 Unit Apartments | 431 | 16.3% |
| 3 or 4 Unit Apartments | 234 | 8.8% |
| 5 to 9 Unit Apartments | 47 | 1.8% |
| 10 or more Apartments | 353 | 13.4% |
| Mobile Home / Other | 0 | 0.0% |
| Total | 2,643 | 100.0% |
Housing Structures by Occupancy in East Franklin
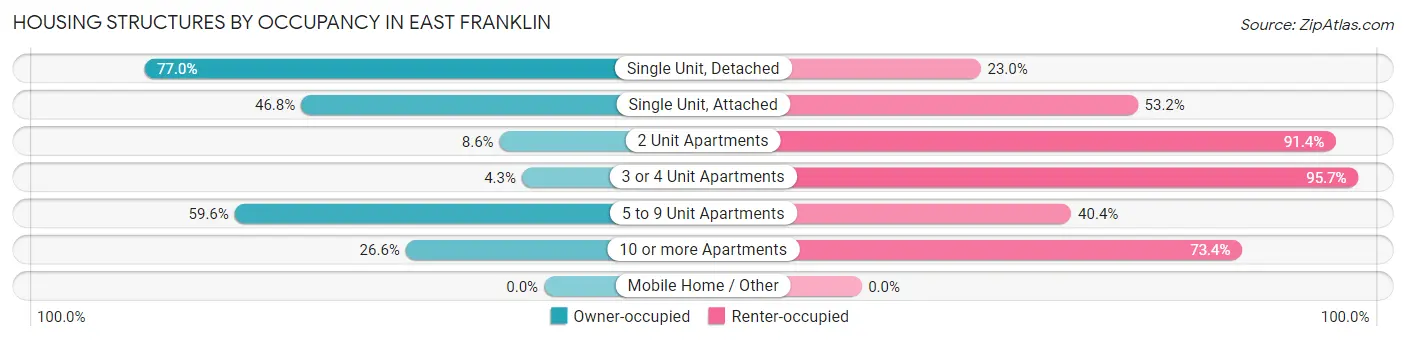
| Structure Type | Owner-occupied | Renter-occupied |
| Single Unit, Detached | 1,072 (77.0%) | 320 (23.0%) |
| Single Unit, Attached | 87 (46.8%) | 99 (53.2%) |
| 2 Unit Apartments | 37 (8.6%) | 394 (91.4%) |
| 3 or 4 Unit Apartments | 10 (4.3%) | 224 (95.7%) |
| 5 to 9 Unit Apartments | 28 (59.6%) | 19 (40.4%) |
| 10 or more Apartments | 94 (26.6%) | 259 (73.4%) |
| Mobile Home / Other | 0 (0.0%) | 0 (0.0%) |
| Total | 1,328 (50.2%) | 1,315 (49.7%) |
Housing Structures by Number of Rooms in East Franklin
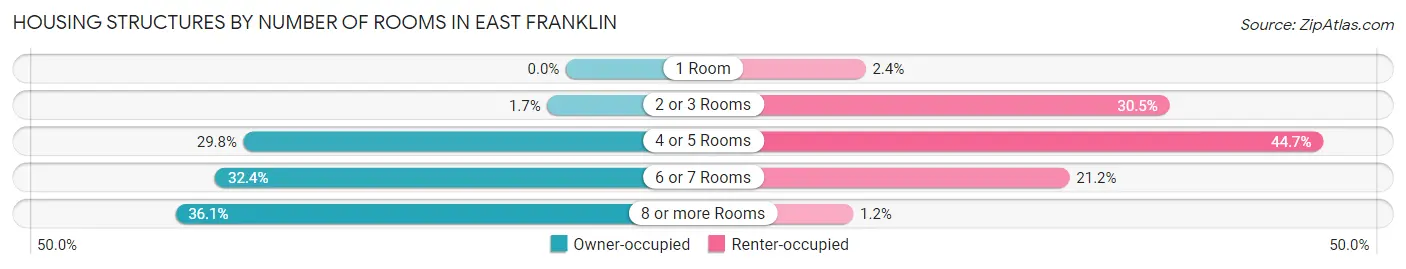
| Number of Rooms | Owner-occupied | Renter-occupied |
| 1 Room | 0 (0.0%) | 31 (2.4%) |
| 2 or 3 Rooms | 23 (1.7%) | 401 (30.5%) |
| 4 or 5 Rooms | 396 (29.8%) | 588 (44.7%) |
| 6 or 7 Rooms | 430 (32.4%) | 279 (21.2%) |
| 8 or more Rooms | 479 (36.1%) | 16 (1.2%) |
| Total | 1,328 (100.0%) | 1,315 (100.0%) |
Housing Structure by Heating Type in East Franklin
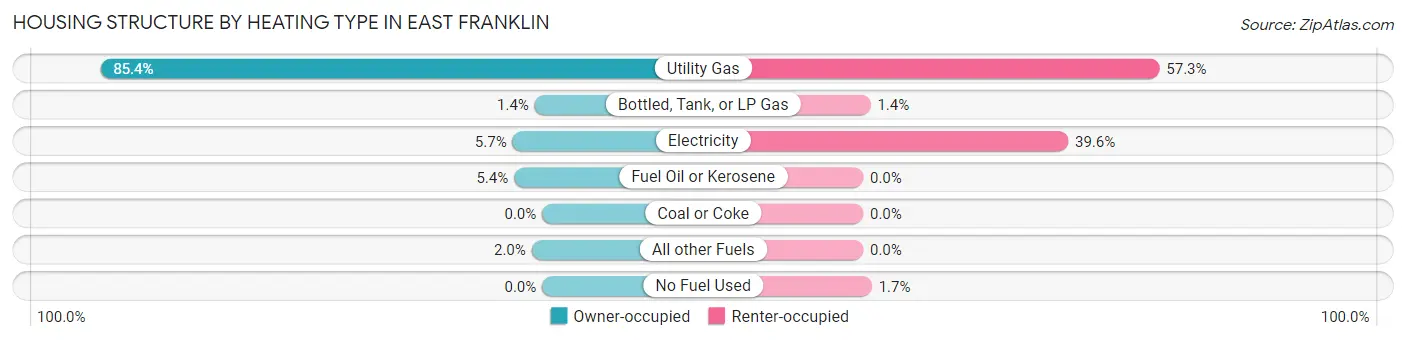
| Heating Type | Owner-occupied | Renter-occupied |
| Utility Gas | 1,134 (85.4%) | 753 (57.3%) |
| Bottled, Tank, or LP Gas | 19 (1.4%) | 19 (1.4%) |
| Electricity | 76 (5.7%) | 521 (39.6%) |
| Fuel Oil or Kerosene | 72 (5.4%) | 0 (0.0%) |
| Coal or Coke | 0 (0.0%) | 0 (0.0%) |
| All other Fuels | 27 (2.0%) | 0 (0.0%) |
| No Fuel Used | 0 (0.0%) | 22 (1.7%) |
| Total | 1,328 (100.0%) | 1,315 (100.0%) |
Household Vehicle Usage in East Franklin
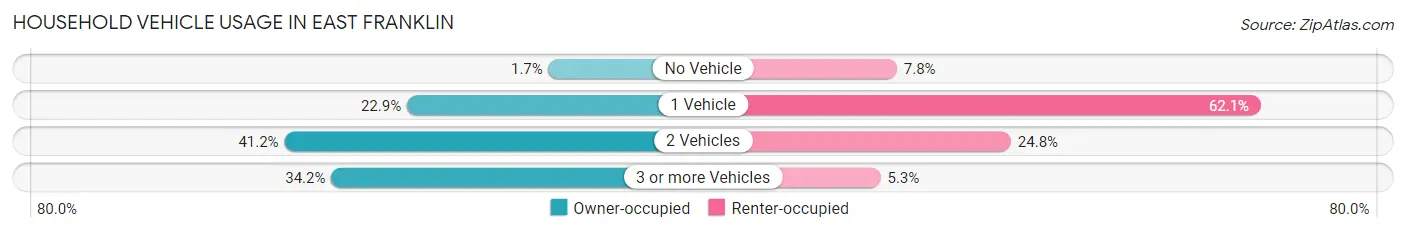
| Vehicles per Household | Owner-occupied | Renter-occupied |
| No Vehicle | 23 (1.7%) | 102 (7.8%) |
| 1 Vehicle | 304 (22.9%) | 817 (62.1%) |
| 2 Vehicles | 547 (41.2%) | 326 (24.8%) |
| 3 or more Vehicles | 454 (34.2%) | 70 (5.3%) |
| Total | 1,328 (100.0%) | 1,315 (100.0%) |
Real Estate & Mortgages in East Franklin
Real Estate and Mortgage Overview in East Franklin
| Characteristic | Without Mortgage | With Mortgage |
| Housing Units | 400 | 928 |
| Median Property Value | $371,500 | $325,300 |
| Median Household Income | $106,944 | $182 |
| Monthly Housing Costs | $983 | $149 |
| Real Estate Taxes | $6,614 | $0 |
Property Value by Mortgage Status in East Franklin
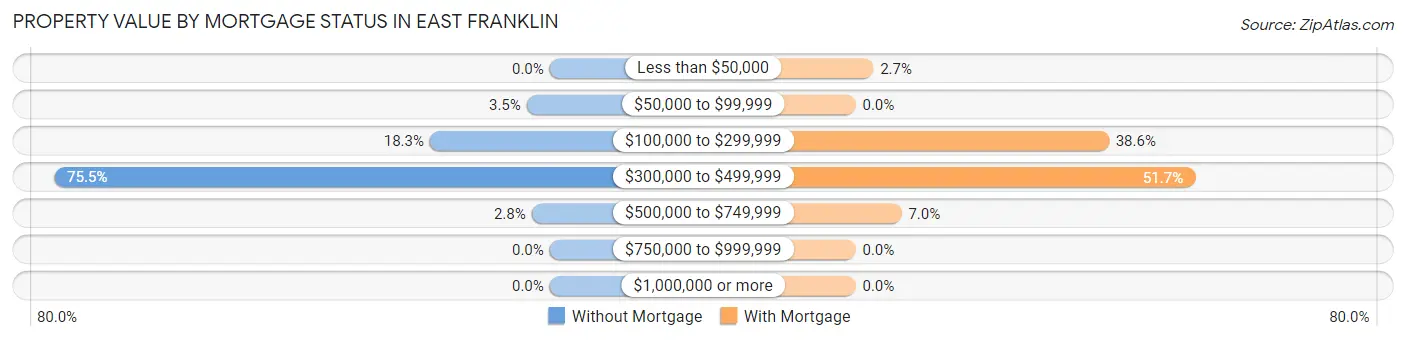
| Property Value | Without Mortgage | With Mortgage |
| Less than $50,000 | 0 (0.0%) | 25 (2.7%) |
| $50,000 to $99,999 | 14 (3.5%) | 0 (0.0%) |
| $100,000 to $299,999 | 73 (18.2%) | 358 (38.6%) |
| $300,000 to $499,999 | 302 (75.5%) | 480 (51.7%) |
| $500,000 to $749,999 | 11 (2.8%) | 65 (7.0%) |
| $750,000 to $999,999 | 0 (0.0%) | 0 (0.0%) |
| $1,000,000 or more | 0 (0.0%) | 0 (0.0%) |
| Total | 400 (100.0%) | 928 (100.0%) |
Household Income by Mortgage Status in East Franklin
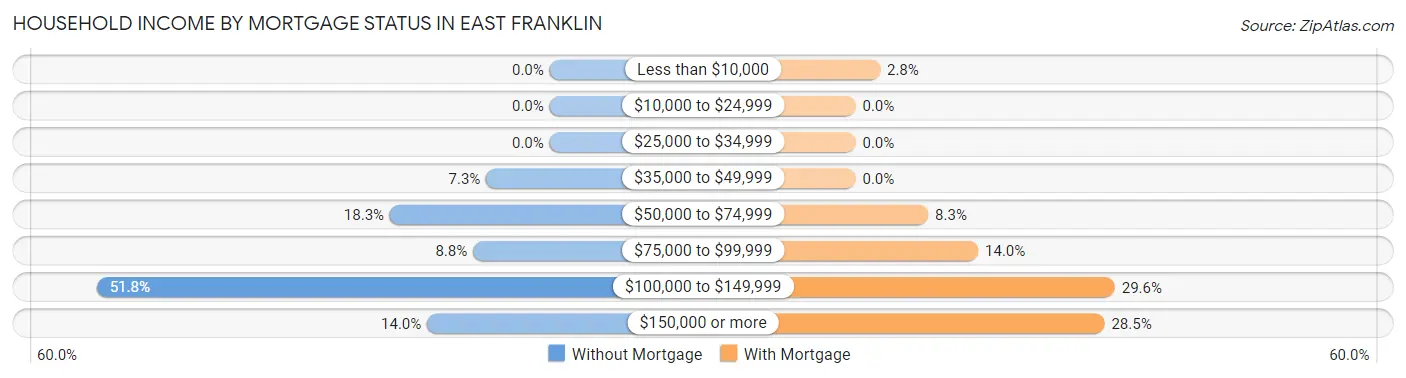
| Household Income | Without Mortgage | With Mortgage |
| Less than $10,000 | 0 (0.0%) | 26 (2.8%) |
| $10,000 to $24,999 | 0 (0.0%) | 0 (0.0%) |
| $25,000 to $34,999 | 0 (0.0%) | 0 (0.0%) |
| $35,000 to $49,999 | 29 (7.2%) | 0 (0.0%) |
| $50,000 to $74,999 | 73 (18.2%) | 77 (8.3%) |
| $75,000 to $99,999 | 35 (8.7%) | 130 (14.0%) |
| $100,000 to $149,999 | 207 (51.7%) | 275 (29.6%) |
| $150,000 or more | 56 (14.0%) | 264 (28.4%) |
| Total | 400 (100.0%) | 928 (100.0%) |
Property Value to Household Income Ratio in East Franklin
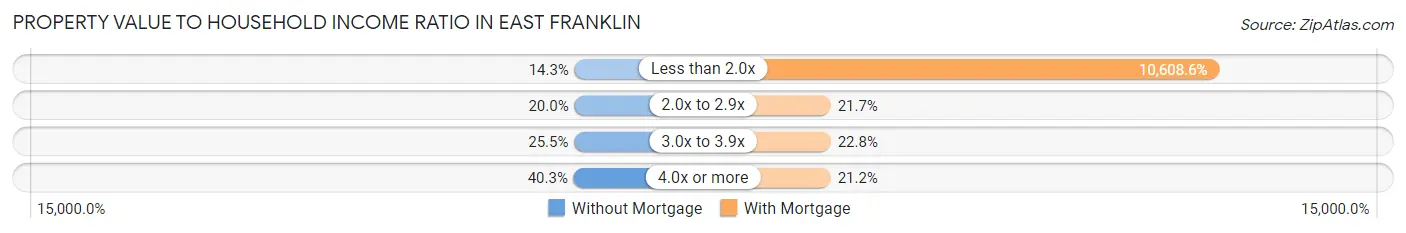
| Value-to-Income Ratio | Without Mortgage | With Mortgage |
| Less than 2.0x | 57 (14.2%) | 98,448 (10,608.6%) |
| 2.0x to 2.9x | 80 (20.0%) | 201 (21.7%) |
| 3.0x to 3.9x | 102 (25.5%) | 212 (22.8%) |
| 4.0x or more | 161 (40.3%) | 197 (21.2%) |
| Total | 400 (100.0%) | 928 (100.0%) |
Real Estate Taxes by Mortgage Status in East Franklin
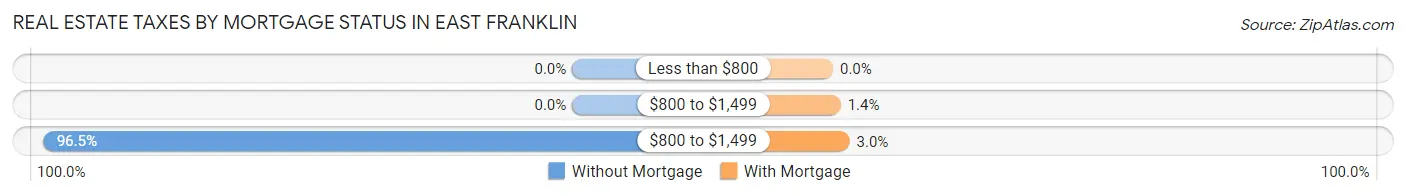
| Property Taxes | Without Mortgage | With Mortgage |
| Less than $800 | 0 (0.0%) | 0 (0.0%) |
| $800 to $1,499 | 0 (0.0%) | 13 (1.4%) |
| $800 to $1,499 | 386 (96.5%) | 28 (3.0%) |
| Total | 400 (100.0%) | 928 (100.0%) |
Health & Disability in East Franklin
Health Insurance Coverage by Age in East Franklin
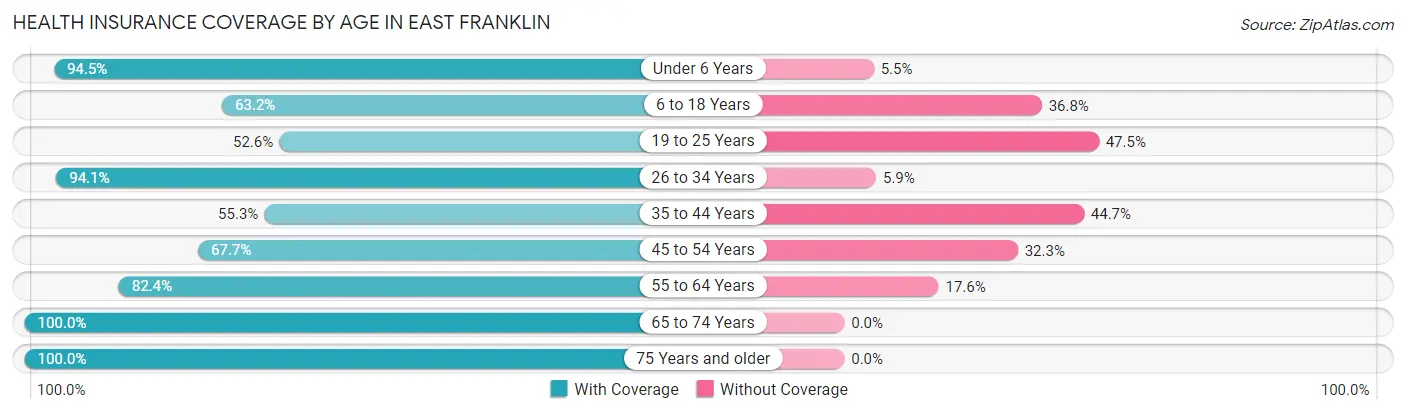
| Age Bracket | With Coverage | Without Coverage |
| Under 6 Years | 897 (94.5%) | 52 (5.5%) |
| 6 to 18 Years | 1,296 (63.2%) | 755 (36.8%) |
| 19 to 25 Years | 649 (52.5%) | 586 (47.4%) |
| 26 to 34 Years | 1,033 (94.1%) | 65 (5.9%) |
| 35 to 44 Years | 722 (55.3%) | 583 (44.7%) |
| 45 to 54 Years | 684 (67.7%) | 327 (32.3%) |
| 55 to 64 Years | 732 (82.4%) | 156 (17.6%) |
| 65 to 74 Years | 534 (100.0%) | 0 (0.0%) |
| 75 Years and older | 238 (100.0%) | 0 (0.0%) |
| Total | 6,785 (72.9%) | 2,524 (27.1%) |
Health Insurance Coverage by Citizenship Status in East Franklin
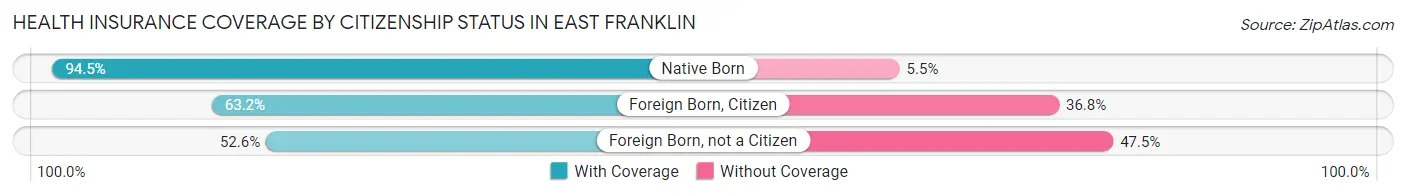
| Citizenship Status | With Coverage | Without Coverage |
| Native Born | 897 (94.5%) | 52 (5.5%) |
| Foreign Born, Citizen | 1,296 (63.2%) | 755 (36.8%) |
| Foreign Born, not a Citizen | 649 (52.5%) | 586 (47.4%) |
Health Insurance Coverage by Household Income in East Franklin
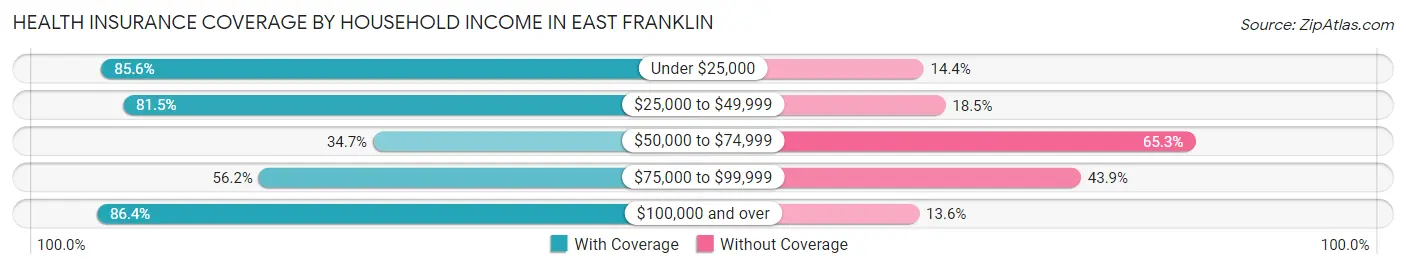
| Household Income | With Coverage | Without Coverage |
| Under $25,000 | 119 (85.6%) | 20 (14.4%) |
| $25,000 to $49,999 | 993 (81.5%) | 225 (18.5%) |
| $50,000 to $74,999 | 378 (34.7%) | 710 (65.3%) |
| $75,000 to $99,999 | 1,183 (56.1%) | 924 (43.9%) |
| $100,000 and over | 4,112 (86.4%) | 645 (13.6%) |
Public vs Private Health Insurance Coverage by Age in East Franklin
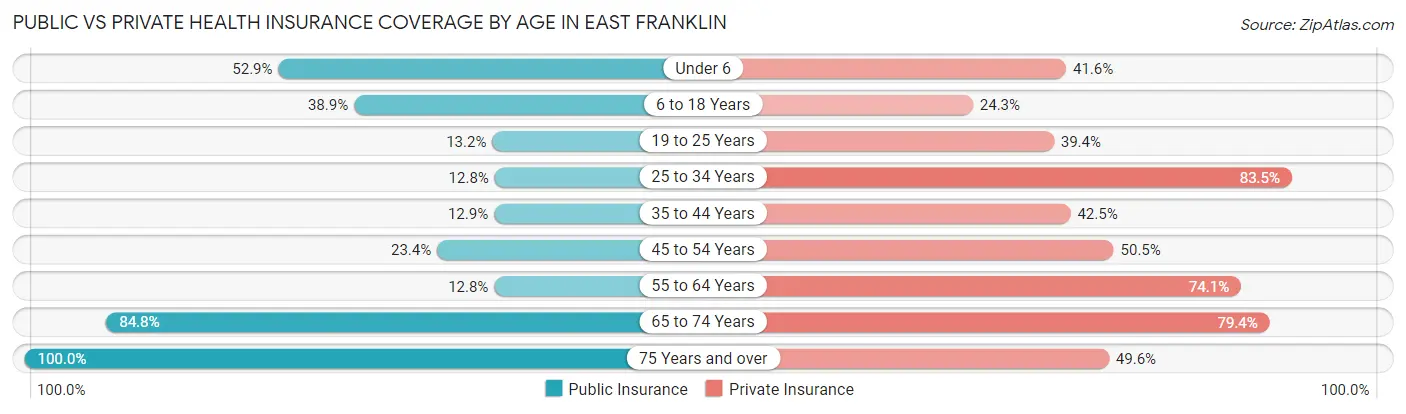
| Age Bracket | Public Insurance | Private Insurance |
| Under 6 | 502 (52.9%) | 395 (41.6%) |
| 6 to 18 Years | 797 (38.9%) | 499 (24.3%) |
| 19 to 25 Years | 163 (13.2%) | 486 (39.4%) |
| 25 to 34 Years | 140 (12.8%) | 917 (83.5%) |
| 35 to 44 Years | 168 (12.9%) | 554 (42.4%) |
| 45 to 54 Years | 237 (23.4%) | 510 (50.4%) |
| 55 to 64 Years | 114 (12.8%) | 658 (74.1%) |
| 65 to 74 Years | 453 (84.8%) | 424 (79.4%) |
| 75 Years and over | 238 (100.0%) | 118 (49.6%) |
| Total | 2,812 (30.2%) | 4,561 (49.0%) |
Disability Status by Sex by Age in East Franklin
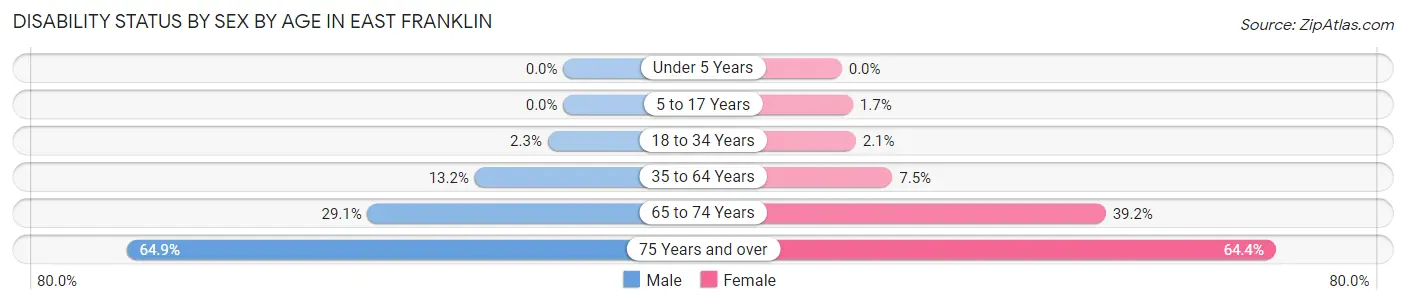
| Age Bracket | Male | Female |
| Under 5 Years | 0 (0.0%) | 0 (0.0%) |
| 5 to 17 Years | 0 (0.0%) | 19 (1.7%) |
| 18 to 34 Years | 30 (2.3%) | 24 (2.1%) |
| 35 to 64 Years | 229 (13.2%) | 110 (7.5%) |
| 65 to 74 Years | 41 (29.1%) | 154 (39.2%) |
| 75 Years and over | 96 (64.9%) | 58 (64.4%) |
Disability Class by Sex by Age in East Franklin
Disability Class: Hearing Difficulty
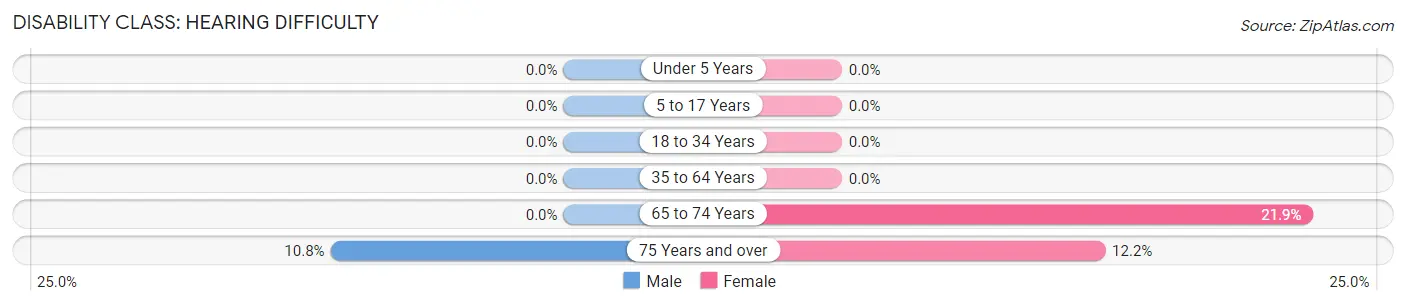
| Age Bracket | Male | Female |
| Under 5 Years | 0 (0.0%) | 0 (0.0%) |
| 5 to 17 Years | 0 (0.0%) | 0 (0.0%) |
| 18 to 34 Years | 0 (0.0%) | 0 (0.0%) |
| 35 to 64 Years | 0 (0.0%) | 0 (0.0%) |
| 65 to 74 Years | 0 (0.0%) | 86 (21.9%) |
| 75 Years and over | 16 (10.8%) | 11 (12.2%) |
Disability Class: Vision Difficulty
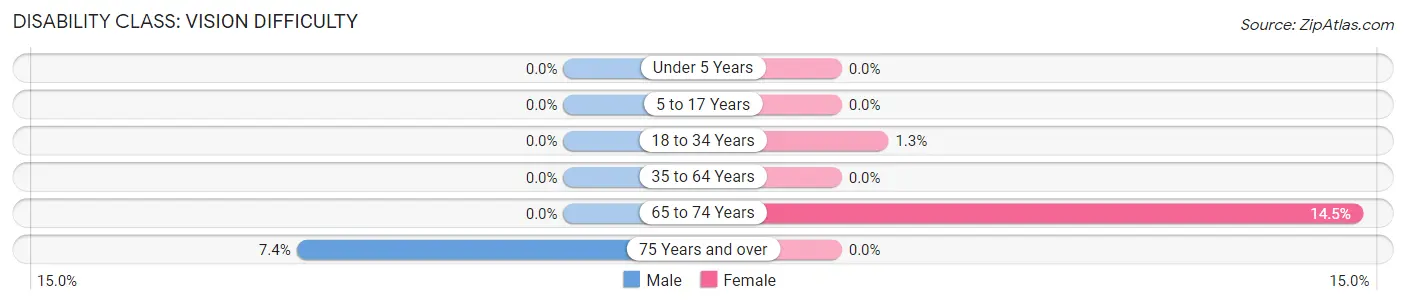
| Age Bracket | Male | Female |
| Under 5 Years | 0 (0.0%) | 0 (0.0%) |
| 5 to 17 Years | 0 (0.0%) | 0 (0.0%) |
| 18 to 34 Years | 0 (0.0%) | 15 (1.3%) |
| 35 to 64 Years | 0 (0.0%) | 0 (0.0%) |
| 65 to 74 Years | 0 (0.0%) | 57 (14.5%) |
| 75 Years and over | 11 (7.4%) | 0 (0.0%) |
Disability Class: Cognitive Difficulty
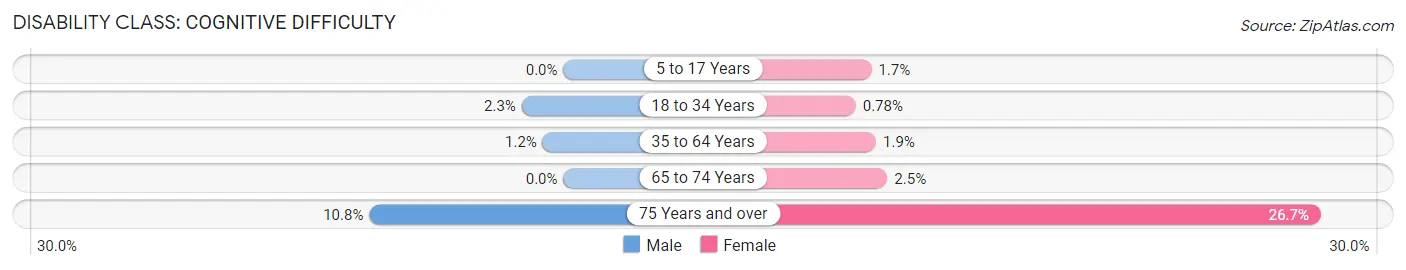
| Age Bracket | Male | Female |
| 5 to 17 Years | 0 (0.0%) | 19 (1.7%) |
| 18 to 34 Years | 30 (2.3%) | 9 (0.8%) |
| 35 to 64 Years | 20 (1.1%) | 28 (1.9%) |
| 65 to 74 Years | 0 (0.0%) | 10 (2.5%) |
| 75 Years and over | 16 (10.8%) | 24 (26.7%) |
Disability Class: Ambulatory Difficulty
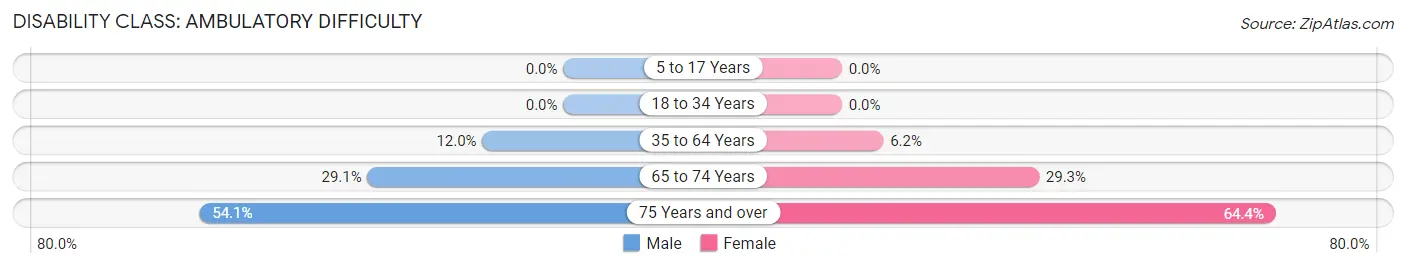
| Age Bracket | Male | Female |
| 5 to 17 Years | 0 (0.0%) | 0 (0.0%) |
| 18 to 34 Years | 0 (0.0%) | 0 (0.0%) |
| 35 to 64 Years | 209 (12.0%) | 90 (6.1%) |
| 65 to 74 Years | 41 (29.1%) | 115 (29.3%) |
| 75 Years and over | 80 (54.0%) | 58 (64.4%) |
Disability Class: Self-Care Difficulty
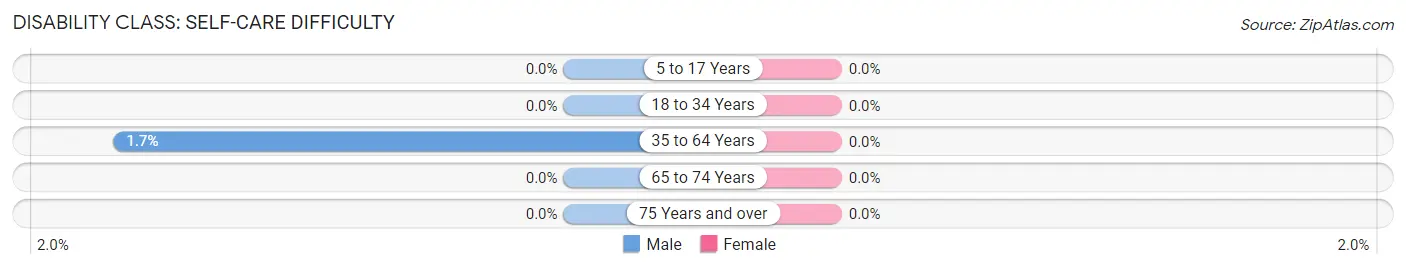
| Age Bracket | Male | Female |
| 5 to 17 Years | 0 (0.0%) | 0 (0.0%) |
| 18 to 34 Years | 0 (0.0%) | 0 (0.0%) |
| 35 to 64 Years | 29 (1.7%) | 0 (0.0%) |
| 65 to 74 Years | 0 (0.0%) | 0 (0.0%) |
| 75 Years and over | 0 (0.0%) | 0 (0.0%) |
Technology Access in East Franklin
Computing Device Access in East Franklin
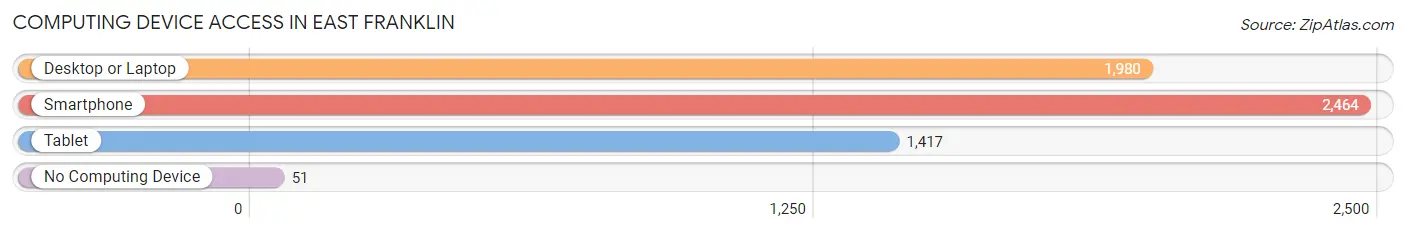
| Device Type | # Households | % Households |
| Desktop or Laptop | 1,980 | 74.9% |
| Smartphone | 2,464 | 93.2% |
| Tablet | 1,417 | 53.6% |
| No Computing Device | 51 | 1.9% |
| Total | 2,643 | 100.0% |
Internet Access in East Franklin
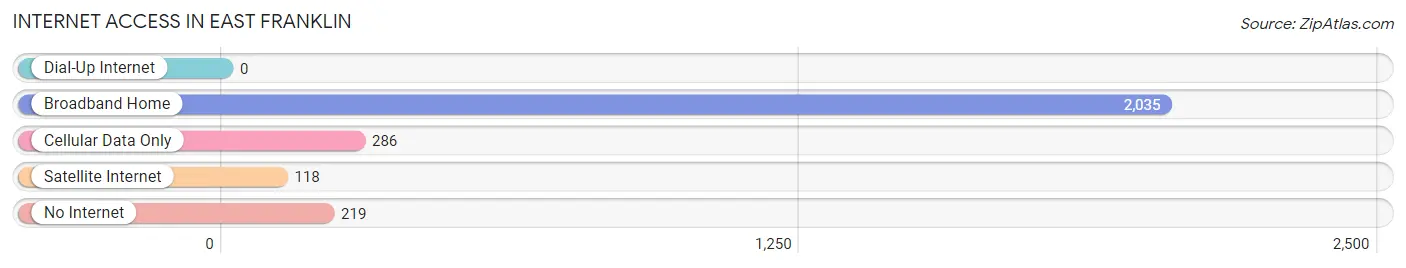
| Internet Type | # Households | % Households |
| Dial-Up Internet | 0 | 0.0% |
| Broadband Home | 2,035 | 77.0% |
| Cellular Data Only | 286 | 10.8% |
| Satellite Internet | 118 | 4.5% |
| No Internet | 219 | 8.3% |
| Total | 2,643 | 100.0% |
East Franklin Summary
Franklin Township is a township located in the eastern part of Somerset County, New Jersey. It is bordered by the townships of Hillsborough, Montgomery, Warren, and Manville. The township is home to a population of approximately 27,000 people, and is part of the larger New York metropolitan area.
History
The area that is now Franklin Township was originally inhabited by the Lenape Native Americans. The first European settlers arrived in the area in the late 17th century, and the township was officially established in 1798. The township was named after Benjamin Franklin, one of the Founding Fathers of the United States.
In the 19th century, the township was largely agricultural, with many farms and orchards. The township also had several mills, which were powered by the nearby Millstone River. In the late 19th century, the township began to industrialize, with several factories being built in the area.
Geography
Franklin Township is located in the eastern part of Somerset County, New Jersey. It is bordered by the townships of Hillsborough, Montgomery, Warren, and Manville. The township covers an area of approximately 24 square miles, and is located approximately 25 miles southwest of New York City.
The township is located in the Raritan Valley region of New Jersey, and is part of the larger New York metropolitan area. The township is located in the Piedmont region of New Jersey, and is characterized by rolling hills and valleys. The township is home to several parks and recreational areas, including Colonial Park, Six Mile Run, and Washington Valley Park.
Economy
Franklin Township has a diverse economy, with a variety of industries represented. The township is home to several large employers, including Johnson & Johnson, Merck & Co., and Siemens. The township is also home to several smaller businesses, including retail stores, restaurants, and professional services.
The township is also home to several educational institutions, including Rutgers University, Princeton University, and the University of Medicine and Dentistry of New Jersey. The township is also home to several hospitals, including Robert Wood Johnson University Hospital and Somerset Medical Center.
Demographics
As of the 2010 census, Franklin Township had a population of 27,000 people. The racial makeup of the township was 79.3% White, 11.2% African American, 0.5% Native American, 4.2% Asian, and 4.8% from other races. The median household income was $76,000, and the median family income was $90,000.
The township is home to a large number of immigrants, with approximately 20% of the population being foreign-born. The largest immigrant groups are from India, China, and Mexico. The township is also home to a large number of religious institutions, including churches, synagogues, and mosques.
Common Questions
What is Per Capita Income in East Franklin?
Per Capita income in East Franklin is $31,867.
What is the Median Family Income in East Franklin?
Median Family Income in East Franklin is $99,840.
What is the Median Household income in East Franklin?
Median Household Income in East Franklin is $96,963.
What is Income or Wage Gap in East Franklin?
Income or Wage Gap in East Franklin is 40.4%.
Women in East Franklin earn 59.6 cents for every dollar earned by a man.
What is Inequality or Gini Index in East Franklin?
Inequality or Gini Index in East Franklin is 0.32.
What is the Total Population of East Franklin?
Total Population of East Franklin is 9,309.
What is the Total Male Population of East Franklin?
Total Male Population of East Franklin is 4,879.
What is the Total Female Population of East Franklin?
Total Female Population of East Franklin is 4,430.
What is the Ratio of Males per 100 Females in East Franklin?
There are 110.14 Males per 100 Females in East Franklin.
What is the Ratio of Females per 100 Males in East Franklin?
There are 90.80 Females per 100 Males in East Franklin.
What is the Median Population Age in East Franklin?
Median Population Age in East Franklin is 28.5 Years.
What is the Average Family Size in East Franklin
Average Family Size in East Franklin is 4.2 People.
What is the Average Household Size in East Franklin
Average Household Size in East Franklin is 3.5 People.
How Large is the Labor Force in East Franklin?
There are 4,991 People in the Labor Forcein in East Franklin.
What is the Percentage of People in the Labor Force in East Franklin?
75.5% of People are in the Labor Force in East Franklin.
What is the Unemployment Rate in East Franklin?
Unemployment Rate in East Franklin is 4.1%.