Garfield, NJ Map & Demographics
Garfield Map
Garfield Overview
$34,418
PER CAPITA INCOME
$76,761
AVG FAMILY INCOME
$72,026
AVG HOUSEHOLD INCOME
30.9%
WAGE / INCOME GAP [ % ]
69.1¢/ $1
WAGE / INCOME GAP [ $ ]
$10,228
FAMILY INCOME DEFICIT
0.45
INEQUALITY / GINI INDEX
32,472
TOTAL POPULATION
16,310
MALE POPULATION
16,162
FEMALE POPULATION
100.92
MALES / 100 FEMALES
99.09
FEMALES / 100 MALES
38.4
MEDIAN AGE
3.2
AVG FAMILY SIZE
2.8
AVG HOUSEHOLD SIZE
17,527
LABOR FORCE [ PEOPLE ]
65.6%
PERCENT IN LABOR FORCE
4.7%
UNEMPLOYMENT RATE
Garfield Zip Codes
Income in Garfield
Income Overview in Garfield
Per Capita Income in Garfield is $34,418, while median incomes of families and households are $76,761 and $72,026 respectively.
| Characteristic | Number | Measure |
| Per Capita Income | 32,472 | $34,418 |
| Median Family Income | 8,576 | $76,761 |
| Mean Family Income | 8,576 | $103,392 |
| Median Household Income | 11,544 | $72,026 |
| Mean Household Income | 11,544 | $95,640 |
| Income Deficit | 8,576 | $10,228 |
| Wage / Income Gap (%) | 32,472 | 30.94% |
| Wage / Income Gap ($) | 32,472 | 69.06¢ per $1 |
| Gini / Inequality Index | 32,472 | 0.45 |
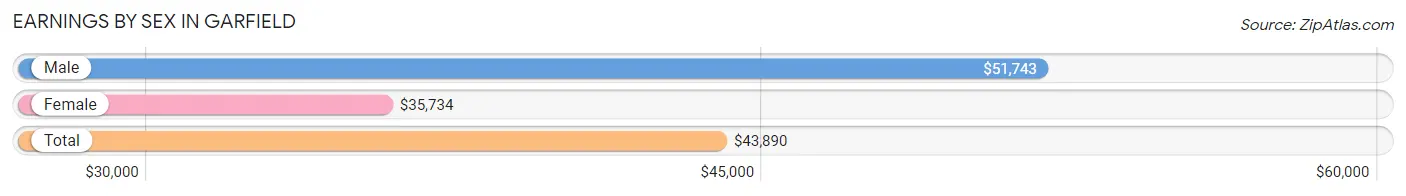
Earnings by Sex in Garfield
Average Earnings in Garfield are $43,890, $51,743 for men and $35,734 for women, a difference of 30.9%.
| Sex | Number | Average Earnings |
| Male | 9,792 (55.8%) | $51,743 |
| Female | 7,750 (44.2%) | $35,734 |
| Total | 17,542 (100.0%) | $43,890 |
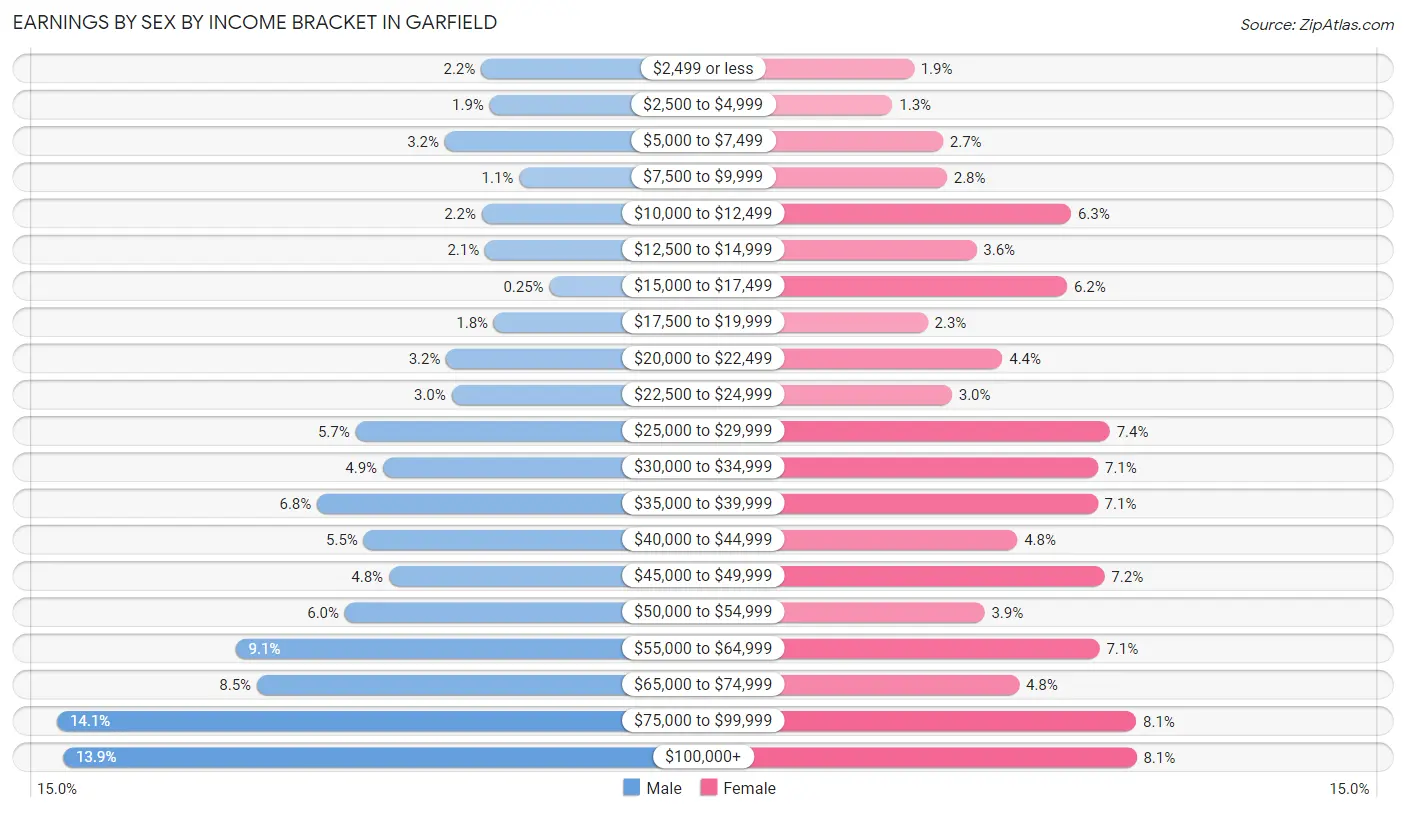
Earnings by Sex by Income Bracket in Garfield
The most common earnings brackets in Garfield are $75,000 to $99,999 for men (1,380 | 14.1%) and $100,000+ for women (631 | 8.1%).
| Income | Male | Female |
| $2,499 or less | 212 (2.2%) | 146 (1.9%) |
| $2,500 to $4,999 | 189 (1.9%) | 99 (1.3%) |
| $5,000 to $7,499 | 312 (3.2%) | 209 (2.7%) |
| $7,500 to $9,999 | 108 (1.1%) | 218 (2.8%) |
| $10,000 to $12,499 | 211 (2.1%) | 488 (6.3%) |
| $12,500 to $14,999 | 202 (2.1%) | 282 (3.6%) |
| $15,000 to $17,499 | 24 (0.3%) | 480 (6.2%) |
| $17,500 to $19,999 | 177 (1.8%) | 176 (2.3%) |
| $20,000 to $22,499 | 308 (3.2%) | 339 (4.4%) |
| $22,500 to $24,999 | 294 (3.0%) | 229 (2.9%) |
| $25,000 to $29,999 | 558 (5.7%) | 573 (7.4%) |
| $30,000 to $34,999 | 483 (4.9%) | 547 (7.1%) |
| $35,000 to $39,999 | 664 (6.8%) | 546 (7.0%) |
| $40,000 to $44,999 | 536 (5.5%) | 371 (4.8%) |
| $45,000 to $49,999 | 466 (4.8%) | 561 (7.2%) |
| $50,000 to $54,999 | 588 (6.0%) | 300 (3.9%) |
| $55,000 to $64,999 | 888 (9.1%) | 550 (7.1%) |
| $65,000 to $74,999 | 829 (8.5%) | 375 (4.8%) |
| $75,000 to $99,999 | 1,380 (14.1%) | 630 (8.1%) |
| $100,000+ | 1,363 (13.9%) | 631 (8.1%) |
| Total | 9,792 (100.0%) | 7,750 (100.0%) |
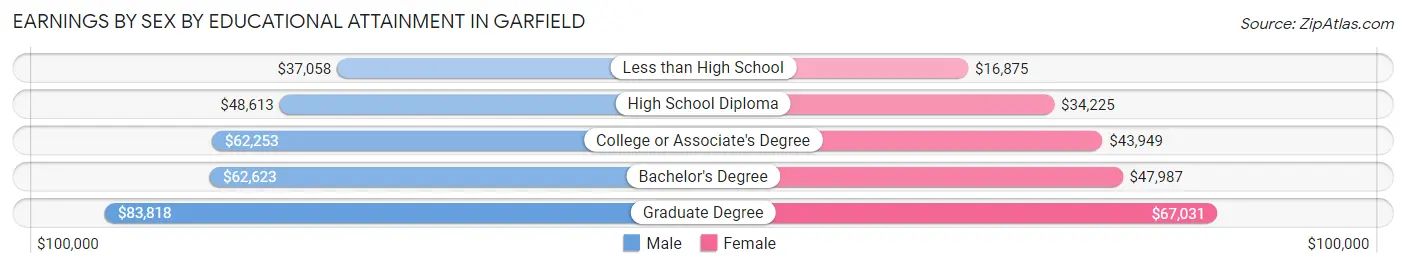
Earnings by Sex by Educational Attainment in Garfield
Average earnings in Garfield are $53,954 for men and $39,453 for women, a difference of 26.9%. Men with an educational attainment of graduate degree enjoy the highest average annual earnings of $83,818, while those with less than high school education earn the least with $37,058. Women with an educational attainment of graduate degree earn the most with the average annual earnings of $67,031, while those with less than high school education have the smallest earnings of $16,875.
| Educational Attainment | Male Income | Female Income |
| Less than High School | $37,058 | $16,875 |
| High School Diploma | $48,613 | $34,225 |
| College or Associate's Degree | $62,253 | $43,949 |
| Bachelor's Degree | $62,623 | $47,987 |
| Graduate Degree | $83,818 | $67,031 |
| Total | $53,954 | $39,453 |
Family Income in Garfield
Family Income Brackets in Garfield
According to the Garfield family income data, there are 1,518 families falling into the $100,000 to $149,999 income range, which is the most common income bracket and makes up 17.7% of all families. Conversely, the $10,000 to $14,999 income bracket is the least frequent group with only 232 families (2.7%) belonging to this category.
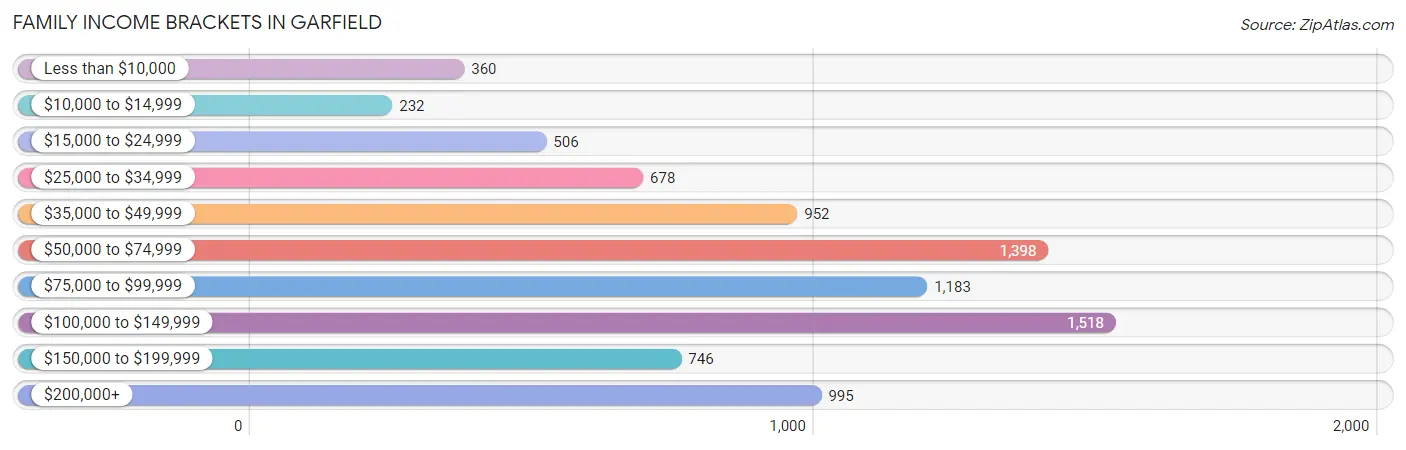
| Income Bracket | # Families | % Families |
| Less than $10,000 | 360 | 4.2% |
| $10,000 to $14,999 | 232 | 2.7% |
| $15,000 to $24,999 | 506 | 5.9% |
| $25,000 to $34,999 | 678 | 7.9% |
| $35,000 to $49,999 | 952 | 11.1% |
| $50,000 to $74,999 | 1,398 | 16.3% |
| $75,000 to $99,999 | 1,183 | 13.8% |
| $100,000 to $149,999 | 1,518 | 17.7% |
| $150,000 to $199,999 | 746 | 8.7% |
| $200,000+ | 995 | 11.6% |
Family Income by Famaliy Size in Garfield
7+ person families (90 | 1.1%) account for the highest median family income in Garfield with $225,426 per family, while 7+ person families (90 | 1.1%) have the highest median income of $32,204 per family member.
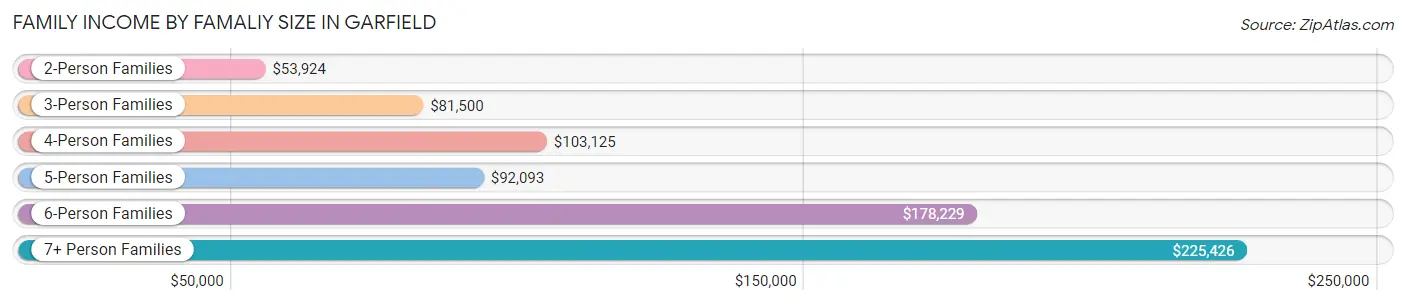
| Income Bracket | # Families | Median Income |
| 2-Person Families | 3,044 (35.5%) | $53,924 |
| 3-Person Families | 2,468 (28.8%) | $81,500 |
| 4-Person Families | 1,762 (20.5%) | $103,125 |
| 5-Person Families | 794 (9.3%) | $92,093 |
| 6-Person Families | 418 (4.9%) | $178,229 |
| 7+ Person Families | 90 (1.1%) | $225,426 |
| Total | 8,576 (100.0%) | $76,761 |
Family Income by Number of Earners in Garfield
The median family income in Garfield is $76,761, with families comprising 3+ earners (1,481) having the highest median family income of $158,238, while families with no earners (933) have the lowest median family income of $33,030, accounting for 17.3% and 10.9% of families, respectively.
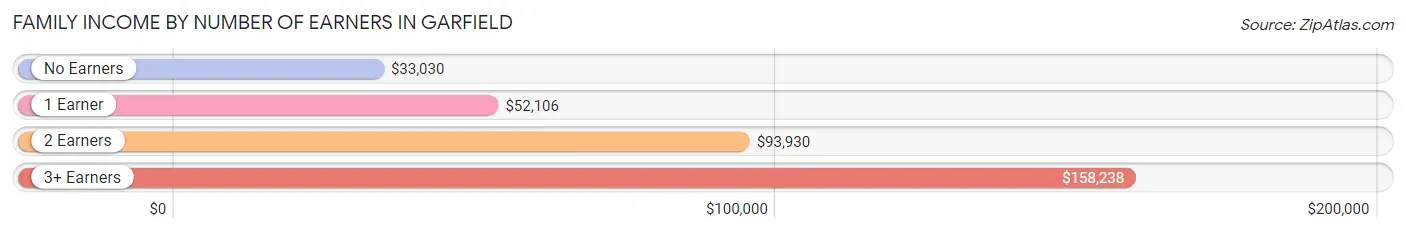
| Number of Earners | # Families | Median Income |
| No Earners | 933 (10.9%) | $33,030 |
| 1 Earner | 3,103 (36.2%) | $52,106 |
| 2 Earners | 3,059 (35.7%) | $93,930 |
| 3+ Earners | 1,481 (17.3%) | $158,238 |
| Total | 8,576 (100.0%) | $76,761 |
Household Income in Garfield
Household Income Brackets in Garfield
With 2,020 households falling in the category, the $100,000 to $149,999 income range is the most frequent in Garfield, accounting for 17.5% of all households. In contrast, only 450 households (3.9%) fall into the less than $10,000 income bracket, making it the least populous group.
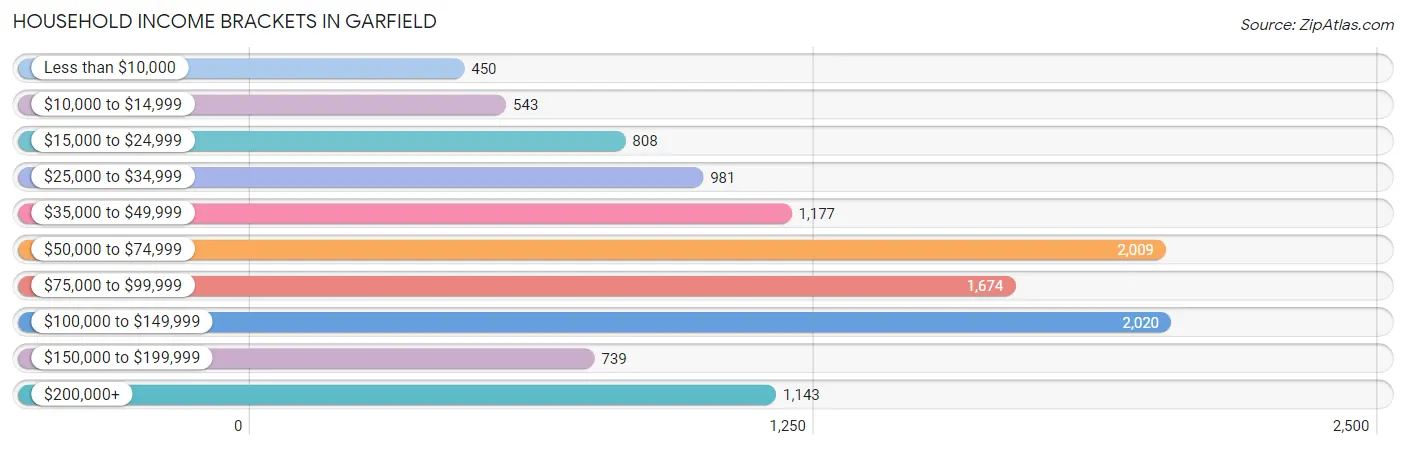
| Income Bracket | # Households | % Households |
| Less than $10,000 | 450 | 3.9% |
| $10,000 to $14,999 | 543 | 4.7% |
| $15,000 to $24,999 | 808 | 7.0% |
| $25,000 to $34,999 | 981 | 8.5% |
| $35,000 to $49,999 | 1,177 | 10.2% |
| $50,000 to $74,999 | 2,009 | 17.4% |
| $75,000 to $99,999 | 1,674 | 14.5% |
| $100,000 to $149,999 | 2,020 | 17.5% |
| $150,000 to $199,999 | 739 | 6.4% |
| $200,000+ | 1,143 | 9.9% |
Household Income by Householder Age in Garfield
The median household income in Garfield is $72,026, with the highest median household income of $80,938 found in the 45 to 64 years age bracket for the primary householder. A total of 4,581 households (39.7%) fall into this category. Meanwhile, the 65+ years age bracket for the primary householder has the lowest median household income of $45,907, with 2,584 households (22.4%) in this group.
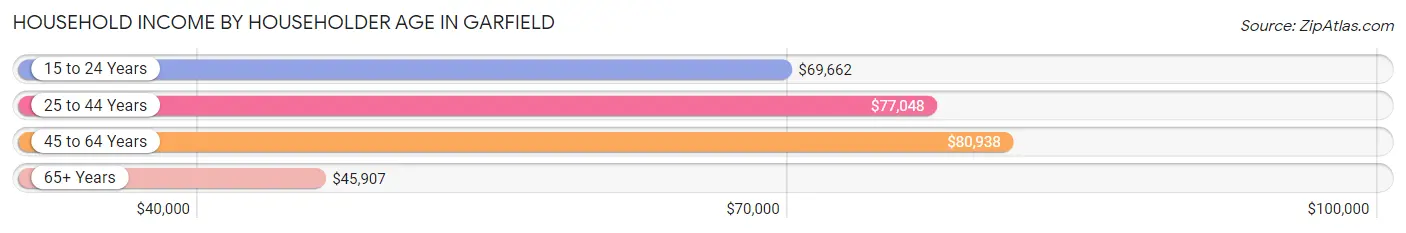
| Income Bracket | # Households | Median Income |
| 15 to 24 Years | 338 (2.9%) | $69,662 |
| 25 to 44 Years | 4,041 (35.0%) | $77,048 |
| 45 to 64 Years | 4,581 (39.7%) | $80,938 |
| 65+ Years | 2,584 (22.4%) | $45,907 |
| Total | 11,544 (100.0%) | $72,026 |
Poverty in Garfield
Income Below Poverty by Sex and Age in Garfield
With 10.8% poverty level for males and 18.9% for females among the residents of Garfield, 15 year old males and 12 to 14 year old females are the most vulnerable to poverty, with 92 males (47.9%) and 229 females (49.1%) in their respective age groups living below the poverty level.
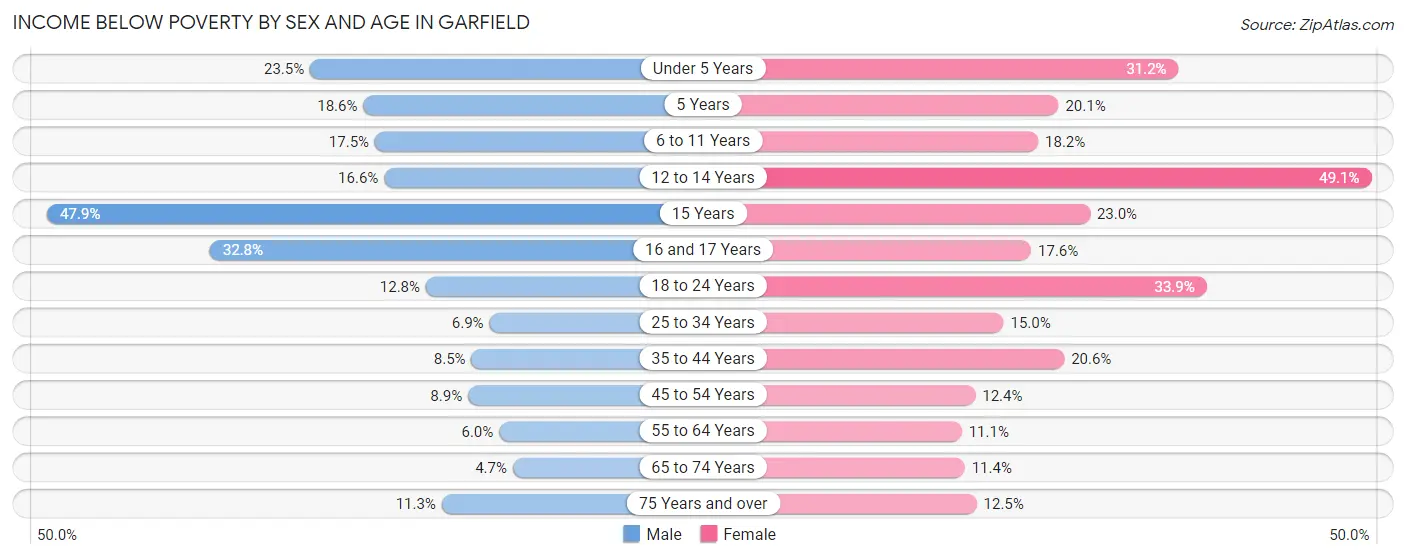
| Age Bracket | Male | Female |
| Under 5 Years | 181 (23.5%) | 348 (31.2%) |
| 5 Years | 44 (18.6%) | 35 (20.1%) |
| 6 to 11 Years | 173 (17.5%) | 184 (18.2%) |
| 12 to 14 Years | 75 (16.6%) | 229 (49.1%) |
| 15 Years | 92 (47.9%) | 41 (23.0%) |
| 16 and 17 Years | 104 (32.8%) | 52 (17.6%) |
| 18 to 24 Years | 209 (12.8%) | 565 (33.9%) |
| 25 to 34 Years | 179 (6.9%) | 360 (15.0%) |
| 35 to 44 Years | 218 (8.5%) | 439 (20.6%) |
| 45 to 54 Years | 206 (8.8%) | 256 (12.4%) |
| 55 to 64 Years | 126 (6.0%) | 228 (11.1%) |
| 65 to 74 Years | 58 (4.7%) | 162 (11.4%) |
| 75 Years and over | 92 (11.3%) | 135 (12.5%) |
| Total | 1,757 (10.8%) | 3,034 (18.9%) |
Income Above Poverty by Sex and Age in Garfield
According to the poverty statistics in Garfield, males aged 65 to 74 years and females aged 55 to 64 years are the age groups that are most secure financially, with 95.3% of males and 88.9% of females in these age groups living above the poverty line.
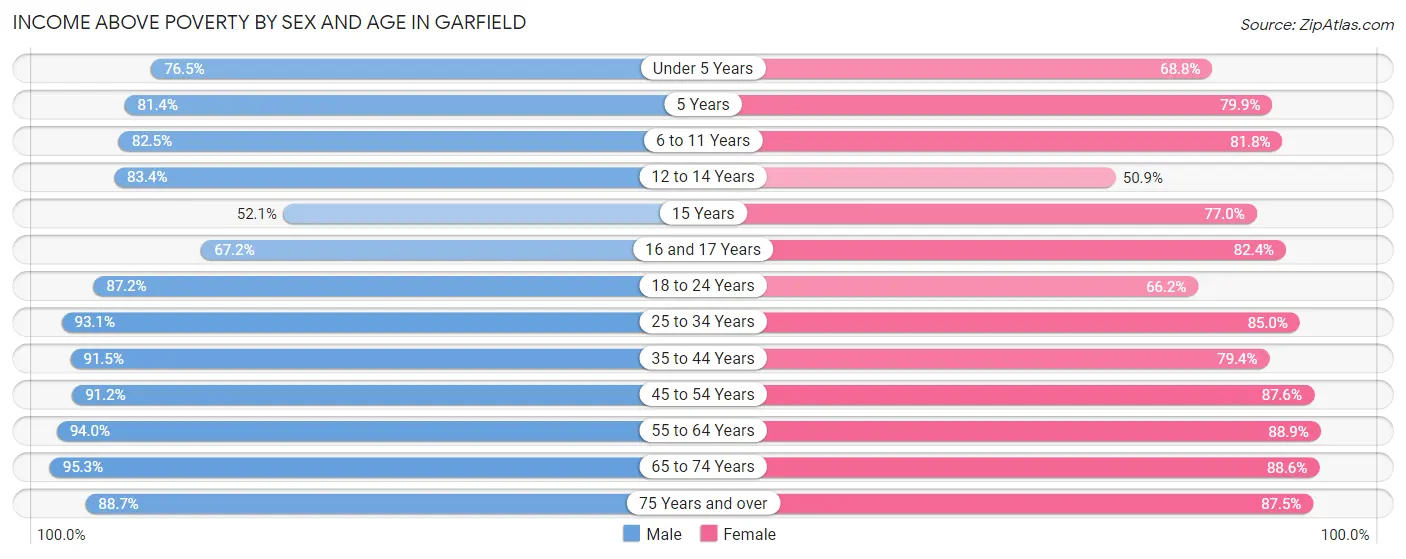
| Age Bracket | Male | Female |
| Under 5 Years | 589 (76.5%) | 766 (68.8%) |
| 5 Years | 193 (81.4%) | 139 (79.9%) |
| 6 to 11 Years | 816 (82.5%) | 826 (81.8%) |
| 12 to 14 Years | 376 (83.4%) | 237 (50.9%) |
| 15 Years | 100 (52.1%) | 137 (77.0%) |
| 16 and 17 Years | 213 (67.2%) | 244 (82.4%) |
| 18 to 24 Years | 1,429 (87.2%) | 1,104 (66.1%) |
| 25 to 34 Years | 2,430 (93.1%) | 2,039 (85.0%) |
| 35 to 44 Years | 2,337 (91.5%) | 1,688 (79.4%) |
| 45 to 54 Years | 2,122 (91.1%) | 1,811 (87.6%) |
| 55 to 64 Years | 1,989 (94.0%) | 1,820 (88.9%) |
| 65 to 74 Years | 1,178 (95.3%) | 1,258 (88.6%) |
| 75 Years and over | 723 (88.7%) | 944 (87.5%) |
| Total | 14,495 (89.2%) | 13,013 (81.1%) |
Income Below Poverty Among Married-Couple Families in Garfield
The poverty statistics for married-couple families in Garfield show that 6.7% or 372 of the total 5,526 families live below the poverty line. Families with 5 or more children have the highest poverty rate of 100.0%, comprising of 11 families. On the other hand, families with no children have the lowest poverty rate of 2.6%, which includes 73 families.
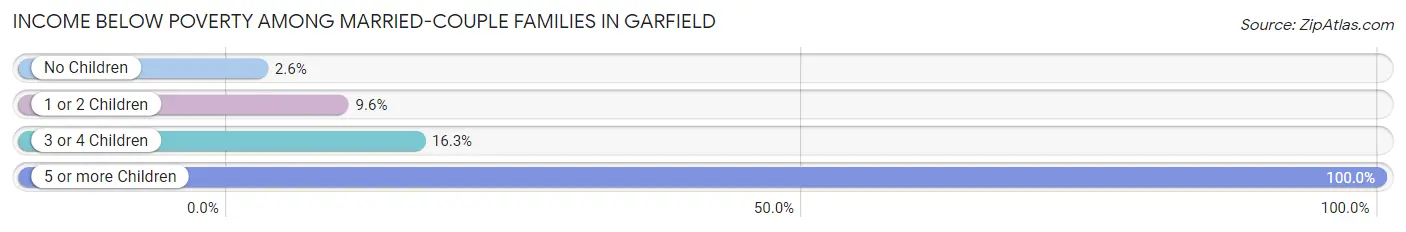
| Children | Above Poverty | Below Poverty |
| No Children | 2,739 (97.4%) | 73 (2.6%) |
| 1 or 2 Children | 2,065 (90.4%) | 220 (9.6%) |
| 3 or 4 Children | 350 (83.7%) | 68 (16.3%) |
| 5 or more Children | 0 (0.0%) | 11 (100.0%) |
| Total | 5,154 (93.3%) | 372 (6.7%) |
Income Below Poverty Among Single-Parent Households in Garfield
According to the poverty data in Garfield, 15.8% or 146 single-father households and 29.4% or 624 single-mother households are living below the poverty line. Among single-father households, those with 1 or 2 children have the highest poverty rate, with 52 households (18.0%) experiencing poverty. Likewise, among single-mother households, those with 3 or 4 children have the highest poverty rate, with 131 households (97.0%) falling below the poverty line.
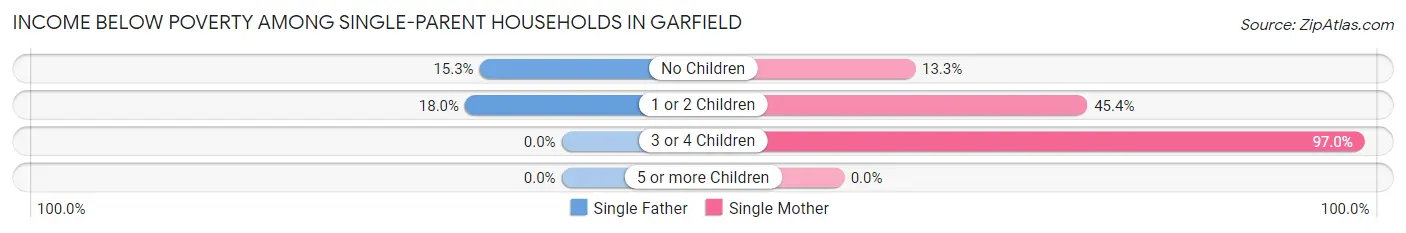
| Children | Single Father | Single Mother |
| No Children | 94 (15.3%) | 170 (13.3%) |
| 1 or 2 Children | 52 (18.0%) | 323 (45.4%) |
| 3 or 4 Children | 0 (0.0%) | 131 (97.0%) |
| 5 or more Children | 0 (0.0%) | 0 (0.0%) |
| Total | 146 (15.8%) | 624 (29.4%) |
Income Below Poverty Among Married-Couple vs Single-Parent Households in Garfield
The poverty data for Garfield shows that 372 of the married-couple family households (6.7%) and 770 of the single-parent households (25.3%) are living below the poverty level. Within the married-couple family households, those with 5 or more children have the highest poverty rate, with 11 households (100.0%) falling below the poverty line. Among the single-parent households, those with 3 or 4 children have the highest poverty rate, with 131 household (84.0%) living below poverty.
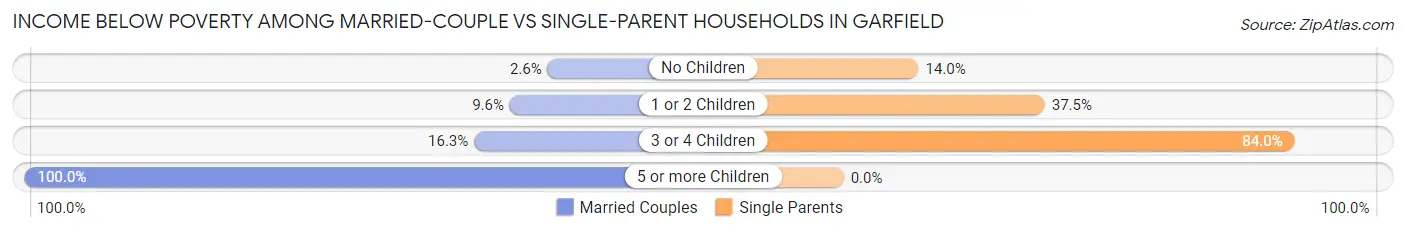
| Children | Married-Couple Families | Single-Parent Households |
| No Children | 73 (2.6%) | 264 (14.0%) |
| 1 or 2 Children | 220 (9.6%) | 375 (37.5%) |
| 3 or 4 Children | 68 (16.3%) | 131 (84.0%) |
| 5 or more Children | 11 (100.0%) | 0 (0.0%) |
| Total | 372 (6.7%) | 770 (25.3%) |
Race in Garfield
The most populous races in Garfield are White / Caucasian (22,459 | 69.2%), Hispanic or Latino (13,115 | 40.4%), and Some other Race (4,029 | 12.4%).
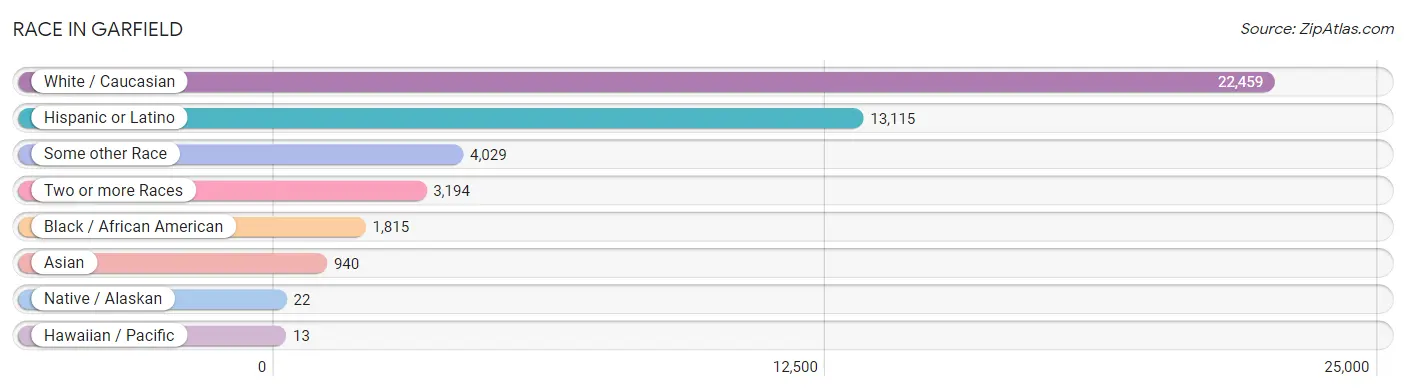
| Race | # Population | % Population |
| Asian | 940 | 2.9% |
| Black / African American | 1,815 | 5.6% |
| Hawaiian / Pacific | 13 | 0.0% |
| Hispanic or Latino | 13,115 | 40.4% |
| Native / Alaskan | 22 | 0.1% |
| White / Caucasian | 22,459 | 69.2% |
| Two or more Races | 3,194 | 9.8% |
| Some other Race | 4,029 | 12.4% |
| Total | 32,472 | 100.0% |
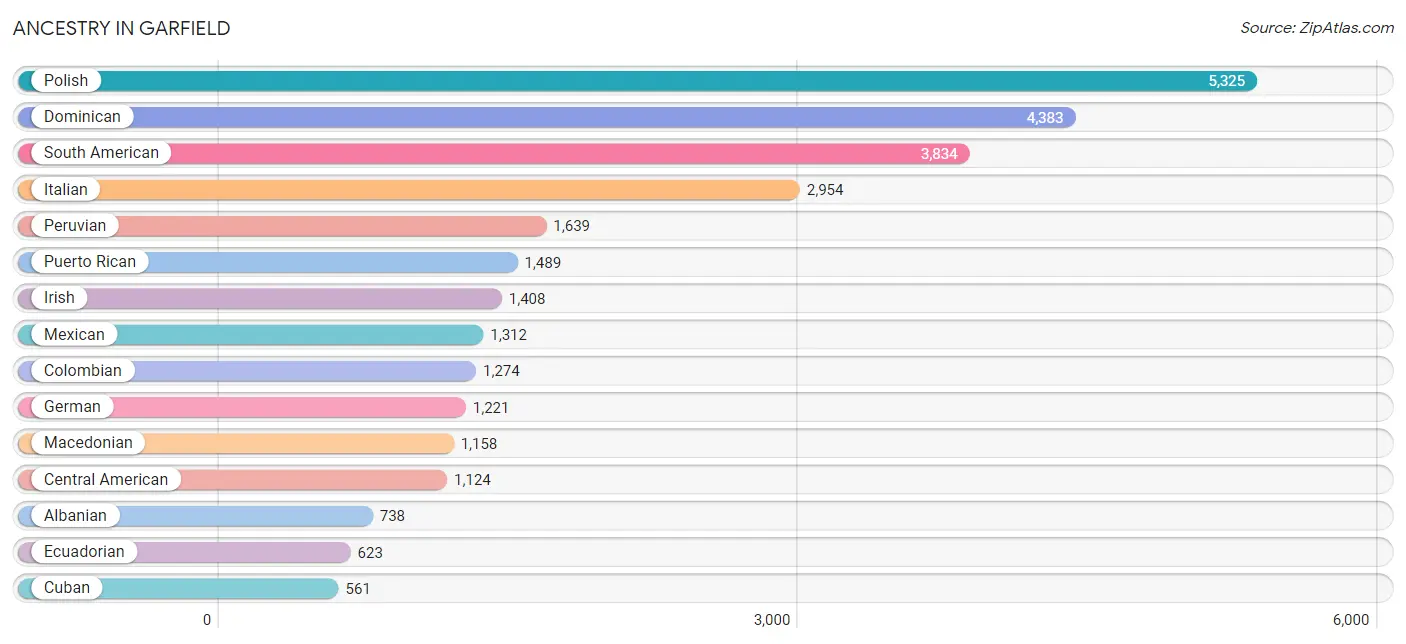
Ancestry in Garfield
The most populous ancestries reported in Garfield are Polish (5,325 | 16.4%), Dominican (4,383 | 13.5%), South American (3,834 | 11.8%), Italian (2,954 | 9.1%), and Peruvian (1,639 | 5.1%), together accounting for 55.9% of all Garfield residents.
| Ancestry | # Population | % Population |
| African | 59 | 0.2% |
| Albanian | 738 | 2.3% |
| American | 543 | 1.7% |
| Arab | 487 | 1.5% |
| Argentinean | 100 | 0.3% |
| Armenian | 50 | 0.2% |
| Austrian | 68 | 0.2% |
| Belgian | 9 | 0.0% |
| Bhutanese | 30 | 0.1% |
| Bolivian | 84 | 0.3% |
| Brazilian | 57 | 0.2% |
| British | 22 | 0.1% |
| British West Indian | 40 | 0.1% |
| Bulgarian | 133 | 0.4% |
| Burmese | 154 | 0.5% |
| Central American | 1,124 | 3.5% |
| Central American Indian | 22 | 0.1% |
| Cherokee | 3 | 0.0% |
| Chilean | 31 | 0.1% |
| Colombian | 1,274 | 3.9% |
| Costa Rican | 402 | 1.2% |
| Croatian | 47 | 0.1% |
| Cuban | 561 | 1.7% |
| Czech | 70 | 0.2% |
| Czechoslovakian | 19 | 0.1% |
| Dominican | 4,383 | 13.5% |
| Dutch | 236 | 0.7% |
| Eastern European | 45 | 0.1% |
| Ecuadorian | 623 | 1.9% |
| Egyptian | 191 | 0.6% |
| English | 191 | 0.6% |
| European | 92 | 0.3% |
| French | 32 | 0.1% |
| German | 1,221 | 3.8% |
| Ghanaian | 22 | 0.1% |
| Greek | 60 | 0.2% |
| Guatemalan | 46 | 0.1% |
| Haitian | 77 | 0.2% |
| Honduran | 124 | 0.4% |
| Hungarian | 339 | 1.0% |
| Indian (Asian) | 239 | 0.7% |
| Iranian | 26 | 0.1% |
| Irish | 1,408 | 4.3% |
| Italian | 2,954 | 9.1% |
| Jamaican | 303 | 0.9% |
| Jordanian | 9 | 0.0% |
| Korean | 222 | 0.7% |
| Lebanese | 34 | 0.1% |
| Lithuanian | 54 | 0.2% |
| Macedonian | 1,158 | 3.6% |
| Malaysian | 19 | 0.1% |
| Mexican | 1,312 | 4.0% |
| Moroccan | 94 | 0.3% |
| Nicaraguan | 5 | 0.0% |
| Nigerian | 1 | 0.0% |
| Norwegian | 123 | 0.4% |
| Panamanian | 76 | 0.2% |
| Peruvian | 1,639 | 5.1% |
| Polish | 5,325 | 16.4% |
| Portuguese | 225 | 0.7% |
| Puerto Rican | 1,489 | 4.6% |
| Romanian | 59 | 0.2% |
| Russian | 332 | 1.0% |
| Salvadoran | 471 | 1.5% |
| Samoan | 13 | 0.0% |
| Scotch-Irish | 175 | 0.5% |
| Scottish | 58 | 0.2% |
| Serbian | 7 | 0.0% |
| Slovak | 249 | 0.8% |
| Slovene | 53 | 0.2% |
| South American | 3,834 | 11.8% |
| South American Indian | 11 | 0.0% |
| Spaniard | 34 | 0.1% |
| Spanish | 87 | 0.3% |
| Sri Lankan | 6 | 0.0% |
| Subsaharan African | 82 | 0.3% |
| Swiss | 41 | 0.1% |
| Syrian | 91 | 0.3% |
| Thai | 350 | 1.1% |
| Turkish | 325 | 1.0% |
| Ukrainian | 238 | 0.7% |
| Venezuelan | 83 | 0.3% |
| Yugoslavian | 356 | 1.1% | View All 83 Rows |
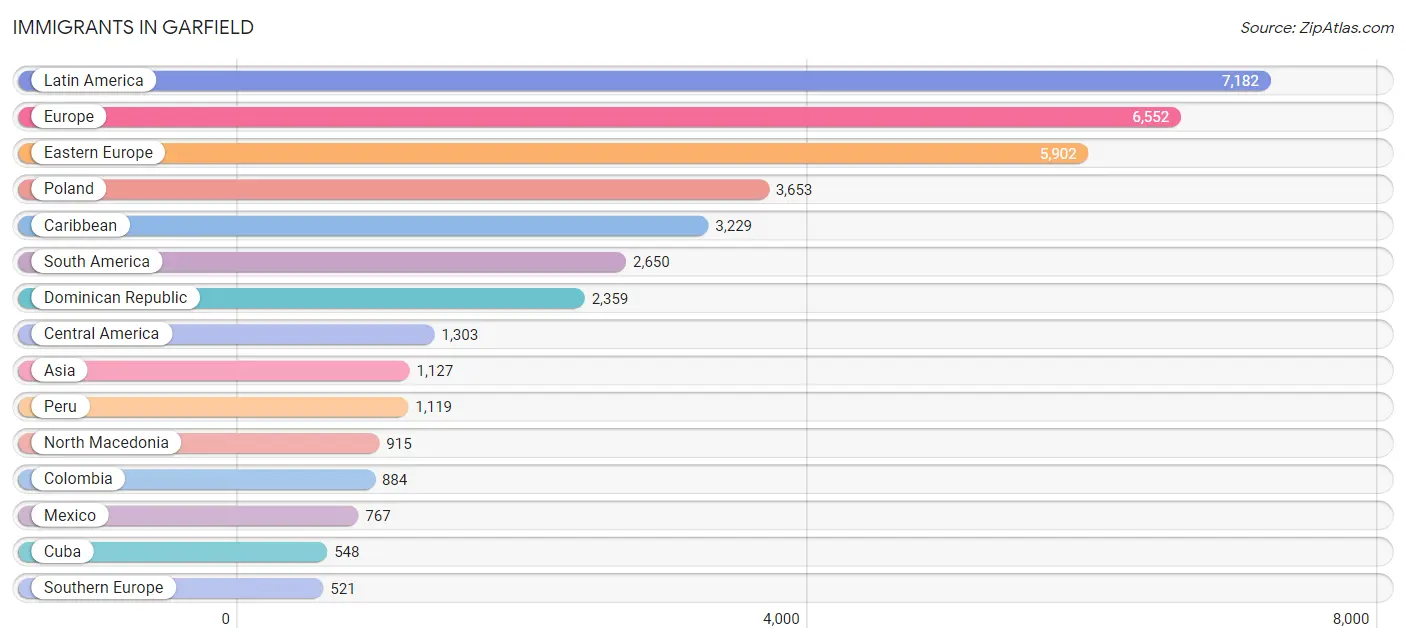
Immigrants in Garfield
The most numerous immigrant groups reported in Garfield came from Latin America (7,182 | 22.1%), Europe (6,552 | 20.2%), Eastern Europe (5,902 | 18.2%), Poland (3,653 | 11.3%), and Caribbean (3,229 | 9.9%), together accounting for 81.7% of all Garfield residents.
| Immigration Origin | # Population | % Population |
| Afghanistan | 21 | 0.1% |
| Africa | 238 | 0.7% |
| Albania | 495 | 1.5% |
| Argentina | 97 | 0.3% |
| Asia | 1,127 | 3.5% |
| Bangladesh | 28 | 0.1% |
| Belgium | 9 | 0.0% |
| Bolivia | 53 | 0.2% |
| Bosnia and Herzegovina | 49 | 0.2% |
| Brazil | 70 | 0.2% |
| Bulgaria | 114 | 0.4% |
| Canada | 9 | 0.0% |
| Caribbean | 3,229 | 9.9% |
| Central America | 1,303 | 4.0% |
| China | 99 | 0.3% |
| Colombia | 884 | 2.7% |
| Costa Rica | 146 | 0.4% |
| Croatia | 17 | 0.1% |
| Cuba | 548 | 1.7% |
| Czechoslovakia | 82 | 0.3% |
| Dominica | 53 | 0.2% |
| Dominican Republic | 2,359 | 7.3% |
| Eastern Africa | 44 | 0.1% |
| Eastern Asia | 263 | 0.8% |
| Eastern Europe | 5,902 | 18.2% |
| Ecuador | 350 | 1.1% |
| Egypt | 76 | 0.2% |
| El Salvador | 327 | 1.0% |
| England | 11 | 0.0% |
| Europe | 6,552 | 20.2% |
| France | 33 | 0.1% |
| Germany | 76 | 0.2% |
| Greece | 36 | 0.1% |
| Guatemala | 17 | 0.1% |
| Haiti | 31 | 0.1% |
| Honduras | 46 | 0.1% |
| Hungary | 60 | 0.2% |
| India | 25 | 0.1% |
| Israel | 12 | 0.0% |
| Italy | 313 | 1.0% |
| Jamaica | 238 | 0.7% |
| Japan | 10 | 0.0% |
| Korea | 154 | 0.5% |
| Latin America | 7,182 | 22.1% |
| Lebanon | 21 | 0.1% |
| Mexico | 767 | 2.4% |
| Morocco | 57 | 0.2% |
| Nigeria | 20 | 0.1% |
| North Macedonia | 915 | 2.8% |
| Northern Africa | 133 | 0.4% |
| Northern Europe | 11 | 0.0% |
| Oceania | 13 | 0.0% |
| Pakistan | 155 | 0.5% |
| Peru | 1,119 | 3.5% |
| Philippines | 125 | 0.4% |
| Poland | 3,653 | 11.3% |
| Portugal | 172 | 0.5% |
| Russia | 27 | 0.1% |
| Saudi Arabia | 27 | 0.1% |
| Serbia | 19 | 0.1% |
| South Africa | 11 | 0.0% |
| South America | 2,650 | 8.2% |
| South Central Asia | 247 | 0.8% |
| South Eastern Asia | 132 | 0.4% |
| Southern Europe | 521 | 1.6% |
| Syria | 84 | 0.3% |
| Taiwan | 41 | 0.1% |
| Turkey | 269 | 0.8% |
| Ukraine | 84 | 0.3% |
| Venezuela | 56 | 0.2% |
| Vietnam | 7 | 0.0% |
| Western Africa | 31 | 0.1% |
| Western Asia | 446 | 1.4% |
| Western Europe | 118 | 0.4% | View All 74 Rows |
Sex and Age in Garfield
Sex and Age in Garfield
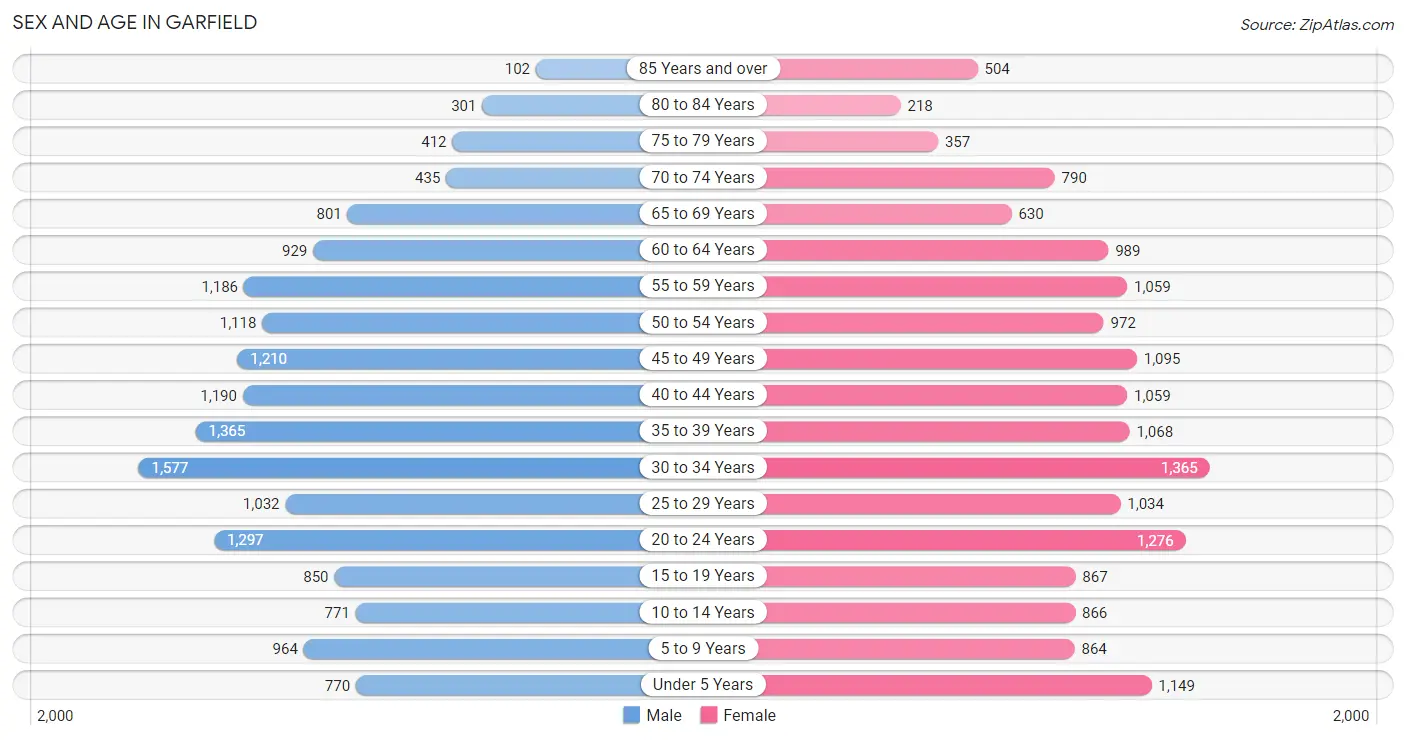
The most populous age groups in Garfield are 30 to 34 Years (1,577 | 9.7%) for men and 30 to 34 Years (1,365 | 8.5%) for women.
| Age Bracket | Male | Female |
| Under 5 Years | 770 (4.7%) | 1,149 (7.1%) |
| 5 to 9 Years | 964 (5.9%) | 864 (5.3%) |
| 10 to 14 Years | 771 (4.7%) | 866 (5.4%) |
| 15 to 19 Years | 850 (5.2%) | 867 (5.4%) |
| 20 to 24 Years | 1,297 (8.0%) | 1,276 (7.9%) |
| 25 to 29 Years | 1,032 (6.3%) | 1,034 (6.4%) |
| 30 to 34 Years | 1,577 (9.7%) | 1,365 (8.5%) |
| 35 to 39 Years | 1,365 (8.4%) | 1,068 (6.6%) |
| 40 to 44 Years | 1,190 (7.3%) | 1,059 (6.6%) |
| 45 to 49 Years | 1,210 (7.4%) | 1,095 (6.8%) |
| 50 to 54 Years | 1,118 (6.9%) | 972 (6.0%) |
| 55 to 59 Years | 1,186 (7.3%) | 1,059 (6.6%) |
| 60 to 64 Years | 929 (5.7%) | 989 (6.1%) |
| 65 to 69 Years | 801 (4.9%) | 630 (3.9%) |
| 70 to 74 Years | 435 (2.7%) | 790 (4.9%) |
| 75 to 79 Years | 412 (2.5%) | 357 (2.2%) |
| 80 to 84 Years | 301 (1.8%) | 218 (1.3%) |
| 85 Years and over | 102 (0.6%) | 504 (3.1%) |
| Total | 16,310 (100.0%) | 16,162 (100.0%) |
Families and Households in Garfield
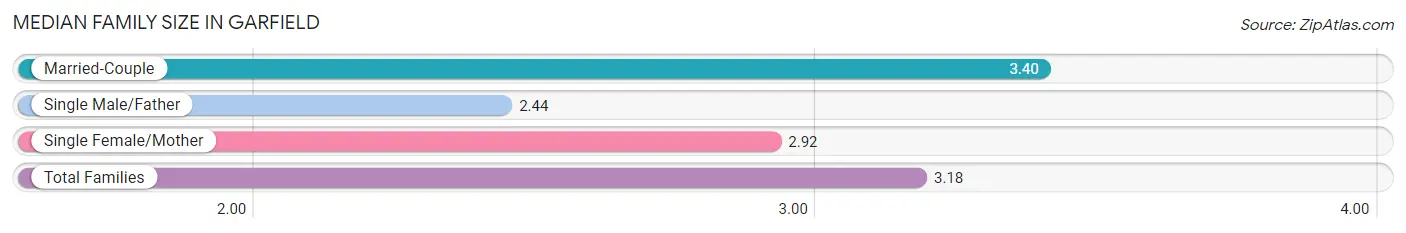
Median Family Size in Garfield
The median family size in Garfield is 3.18 persons per family, with married-couple families (5,526 | 64.4%) accounting for the largest median family size of 3.4 persons per family. On the other hand, single male/father families (925 | 10.8%) represent the smallest median family size with 2.44 persons per family.
| Family Type | # Families | Family Size |
| Married-Couple | 5,526 (64.4%) | 3.40 |
| Single Male/Father | 925 (10.8%) | 2.44 |
| Single Female/Mother | 2,125 (24.8%) | 2.92 |
| Total Families | 8,576 (100.0%) | 3.18 |
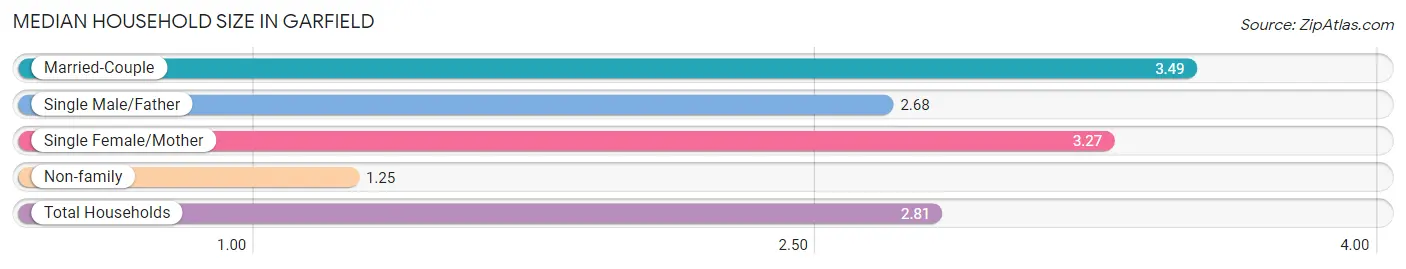
Median Household Size in Garfield
The median household size in Garfield is 2.81 persons per household, with married-couple households (5,526 | 47.9%) accounting for the largest median household size of 3.49 persons per household. non-family households (2,968 | 25.7%) represent the smallest median household size with 1.25 persons per household.
| Household Type | # Households | Household Size |
| Married-Couple | 5,526 (47.9%) | 3.49 |
| Single Male/Father | 925 (8.0%) | 2.68 |
| Single Female/Mother | 2,125 (18.4%) | 3.27 |
| Non-family | 2,968 (25.7%) | 1.25 |
| Total Households | 11,544 (100.0%) | 2.81 |
Household Size by Marriage Status in Garfield
Out of a total of 11,544 households in Garfield, 8,576 (74.3%) are family households, while 2,968 (25.7%) are nonfamily households. The most numerous type of family households are 2-person households, comprising 2,750, and the most common type of nonfamily households are 1-person households, comprising 2,310.
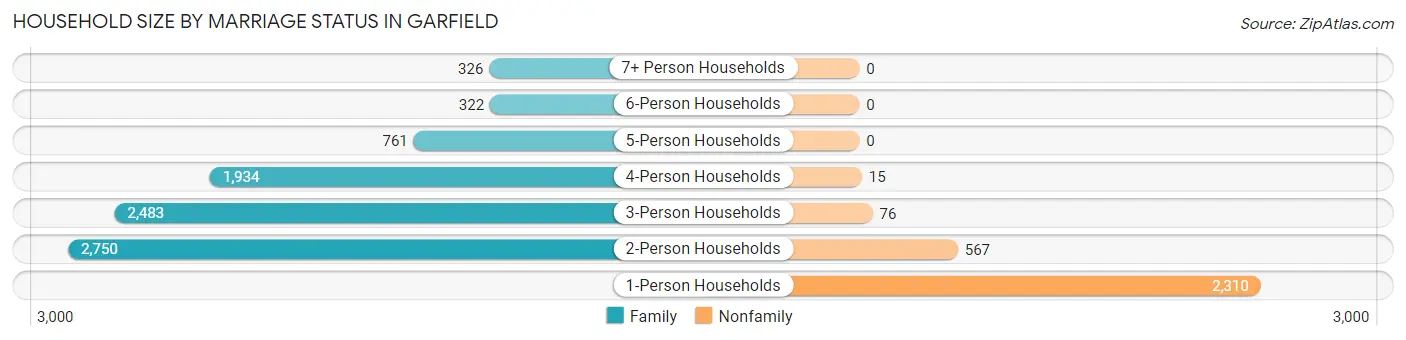
| Household Size | Family Households | Nonfamily Households |
| 1-Person Households | - | 2,310 (20.0%) |
| 2-Person Households | 2,750 (23.8%) | 567 (4.9%) |
| 3-Person Households | 2,483 (21.5%) | 76 (0.7%) |
| 4-Person Households | 1,934 (16.8%) | 15 (0.1%) |
| 5-Person Households | 761 (6.6%) | 0 (0.0%) |
| 6-Person Households | 322 (2.8%) | 0 (0.0%) |
| 7+ Person Households | 326 (2.8%) | 0 (0.0%) |
| Total | 8,576 (74.3%) | 2,968 (25.7%) |
Female Fertility in Garfield
Fertility by Age in Garfield
Average fertility rate in Garfield is 71.0 births per 1,000 women. Women in the age bracket of 20 to 34 years have the highest fertility rate with 96.0 births per 1,000 women. Women in the age bracket of 20 to 34 years acount for 62.1% of all women with births.
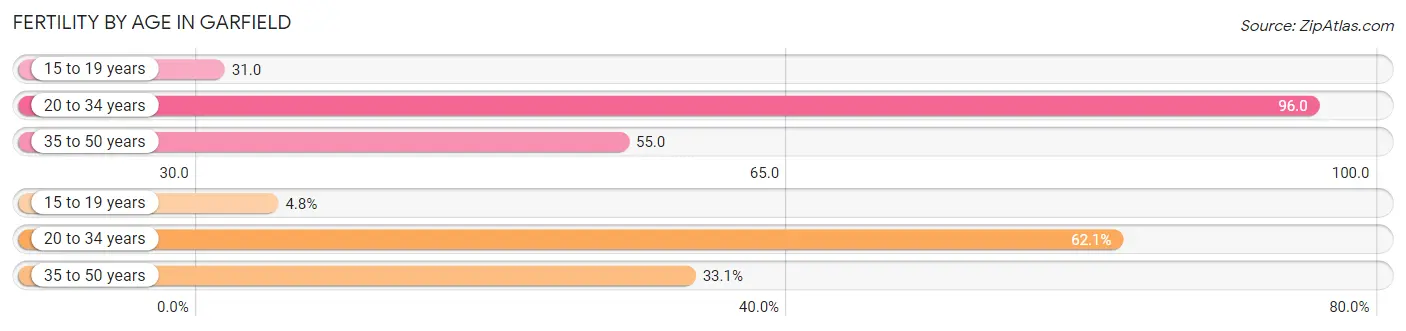
| Age Bracket | Women with Births | Births / 1,000 Women |
| 15 to 19 years | 27 (4.8%) | 31.0 |
| 20 to 34 years | 351 (62.1%) | 96.0 |
| 35 to 50 years | 187 (33.1%) | 55.0 |
| Total | 565 (100.0%) | 71.0 |
Fertility by Age by Marriage Status in Garfield
62.8% of women with births (565) in Garfield are married. The highest percentage of unmarried women with births falls into 15 to 19 years age bracket with 100.0% of them unmarried at the time of birth, while the lowest percentage of unmarried women with births belong to 35 to 50 years age bracket with 27.3% of them unmarried.
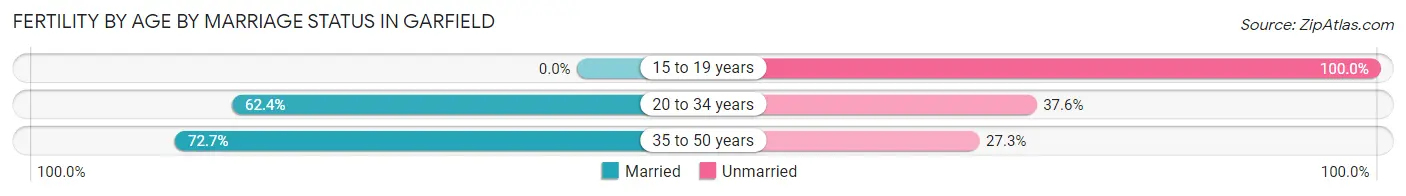
| Age Bracket | Married | Unmarried |
| 15 to 19 years | 0 (0.0%) | 27 (100.0%) |
| 20 to 34 years | 219 (62.4%) | 132 (37.6%) |
| 35 to 50 years | 136 (72.7%) | 51 (27.3%) |
| Total | 355 (62.8%) | 210 (37.2%) |
Fertility by Education in Garfield
Average fertility rate in Garfield is 71.0 births per 1,000 women. Women with the education attainment of graduate degree have the highest fertility rate of 137.0 births per 1,000 women, while women with the education attainment of high school diploma have the lowest fertility at 59.0 births per 1,000 women. Women with the education attainment of college or associate's degree represent 29.6% of all women with births.
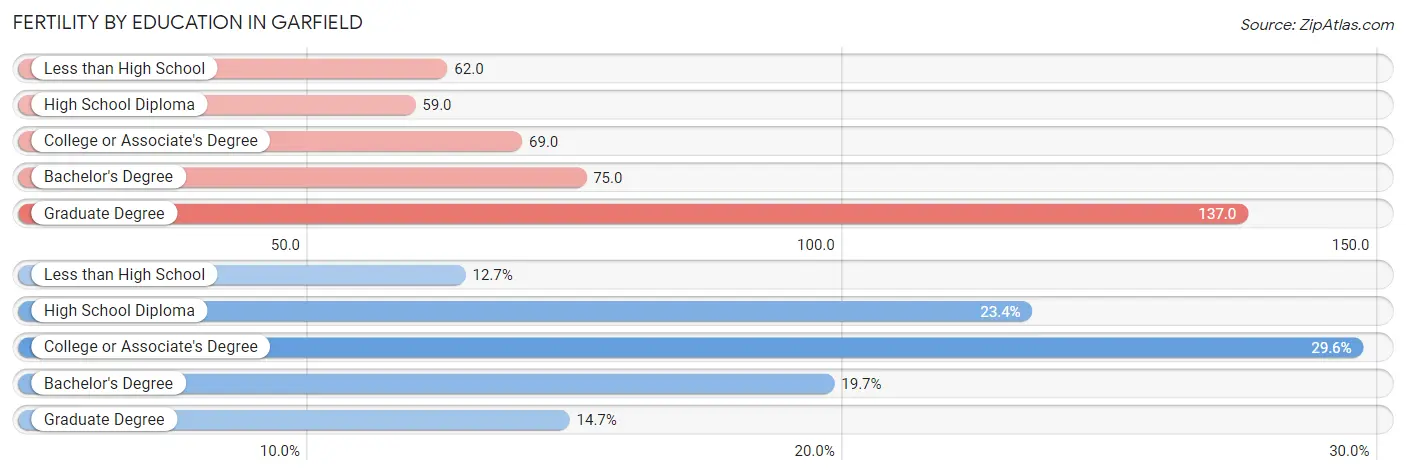
| Educational Attainment | Women with Births | Births / 1,000 Women |
| Less than High School | 72 (12.7%) | 62.0 |
| High School Diploma | 132 (23.4%) | 59.0 |
| College or Associate's Degree | 167 (29.6%) | 69.0 |
| Bachelor's Degree | 111 (19.7%) | 75.0 |
| Graduate Degree | 83 (14.7%) | 137.0 |
| Total | 565 (100.0%) | 71.0 |
Fertility by Education by Marriage Status in Garfield
37.2% of women with births in Garfield are unmarried. Women with the educational attainment of graduate degree are most likely to be married with 84.3% of them married at childbirth, while women with the educational attainment of college or associate's degree are least likely to be married with 49.1% of them unmarried at childbirth.
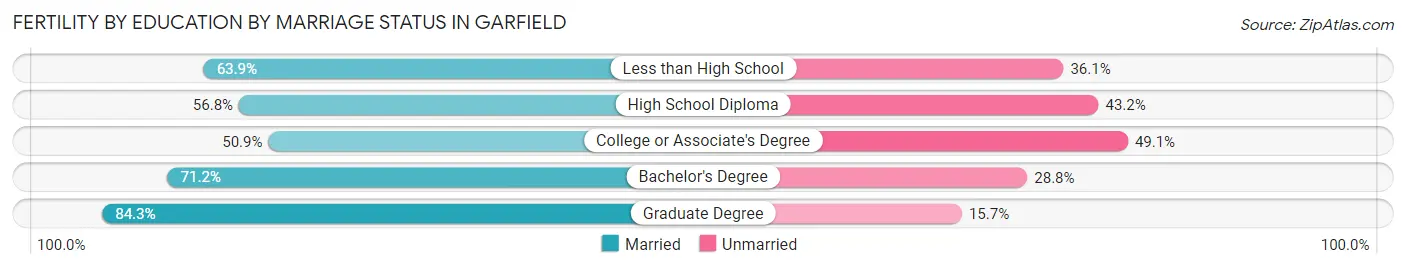
| Educational Attainment | Married | Unmarried |
| Less than High School | 46 (63.9%) | 26 (36.1%) |
| High School Diploma | 75 (56.8%) | 57 (43.2%) |
| College or Associate's Degree | 85 (50.9%) | 82 (49.1%) |
| Bachelor's Degree | 79 (71.2%) | 32 (28.8%) |
| Graduate Degree | 70 (84.3%) | 13 (15.7%) |
| Total | 355 (62.8%) | 210 (37.2%) |
Employment Characteristics in Garfield
Employment by Class of Employer in Garfield
Among the 16,517 employed individuals in Garfield, private company employees (12,443 | 75.3%), local government employees (1,138 | 6.9%), and self-employed (not incorporated) (893 | 5.4%) make up the most common classes of employment.
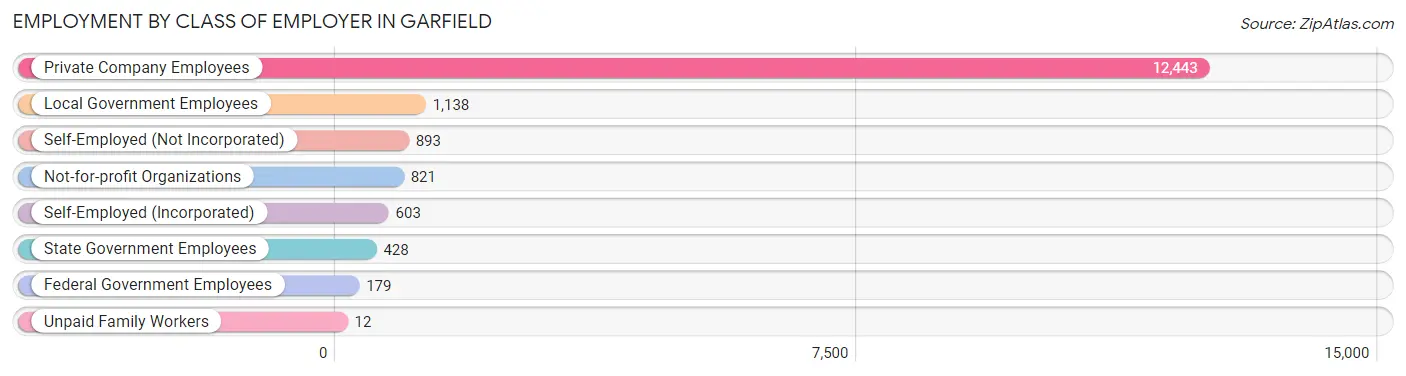
| Employer Class | # Employees | % Employees |
| Private Company Employees | 12,443 | 75.3% |
| Self-Employed (Incorporated) | 603 | 3.6% |
| Self-Employed (Not Incorporated) | 893 | 5.4% |
| Not-for-profit Organizations | 821 | 5.0% |
| Local Government Employees | 1,138 | 6.9% |
| State Government Employees | 428 | 2.6% |
| Federal Government Employees | 179 | 1.1% |
| Unpaid Family Workers | 12 | 0.1% |
| Total | 16,517 | 100.0% |
Employment Status by Age in Garfield
According to the labor force statistics for Garfield, out of the total population over 16 years of age (26,718), 65.6% or 17,527 individuals are in the labor force, with 4.7% or 824 of them unemployed. The age group with the highest labor force participation rate is 25 to 29 years, with 84.8% or 1,752 individuals in the labor force. Within the labor force, the 75 years and over age range has the highest percentage of unemployed individuals, with 13.4% or 9 of them being unemployed.
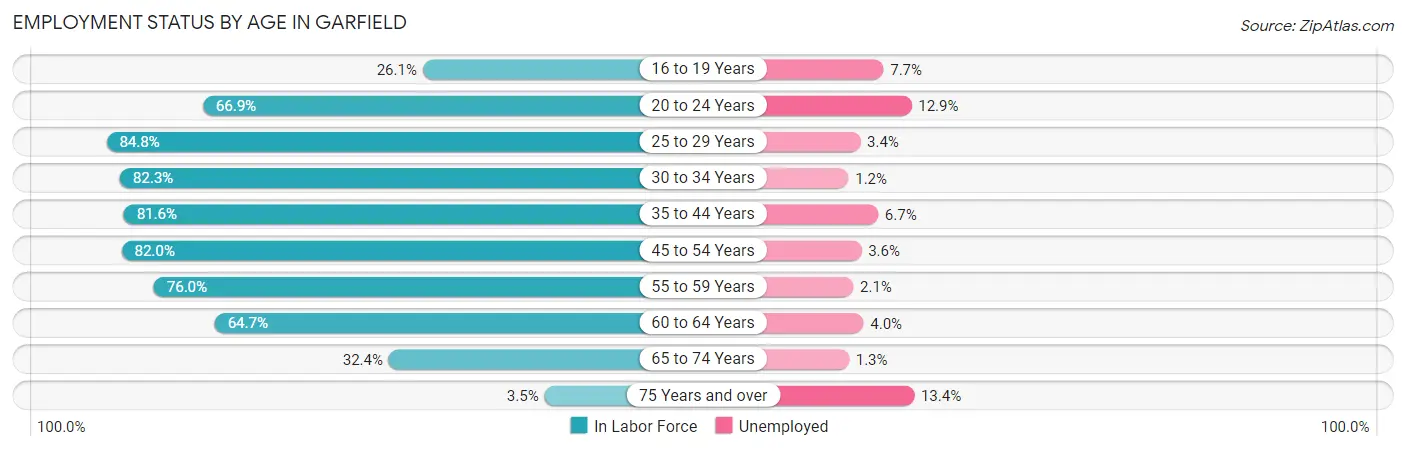
| Age Bracket | In Labor Force | Unemployed |
| 16 to 19 Years | 352 (26.1%) | 27 (7.7%) |
| 20 to 24 Years | 1,721 (66.9%) | 222 (12.9%) |
| 25 to 29 Years | 1,752 (84.8%) | 60 (3.4%) |
| 30 to 34 Years | 2,421 (82.3%) | 29 (1.2%) |
| 35 to 44 Years | 3,821 (81.6%) | 256 (6.7%) |
| 45 to 54 Years | 3,604 (82.0%) | 130 (3.6%) |
| 55 to 59 Years | 1,706 (76.0%) | 36 (2.1%) |
| 60 to 64 Years | 1,241 (64.7%) | 50 (4.0%) |
| 65 to 74 Years | 861 (32.4%) | 11 (1.3%) |
| 75 Years and over | 66 (3.5%) | 9 (13.4%) |
| Total | 17,527 (65.6%) | 824 (4.7%) |
Employment Status by Educational Attainment in Garfield
According to labor force statistics for Garfield, 79.7% of individuals (14,544) out of the total population between 25 and 64 years of age (18,248) are in the labor force, with 3.8% or 553 of them being unemployed. The group with the highest labor force participation rate are those with the educational attainment of bachelor's degree or higher, with 88.4% or 4,128 individuals in the labor force. Within the labor force, individuals with less than high school education have the highest percentage of unemployment, with 7.8% or 119 of them being unemployed.
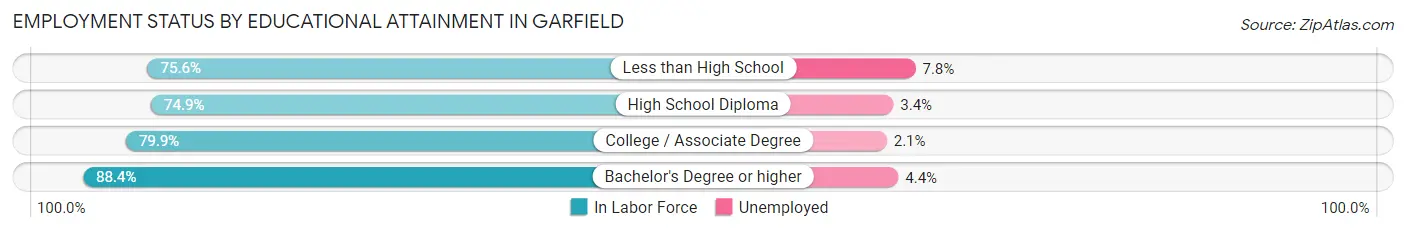
| Educational Attainment | In Labor Force | Unemployed |
| Less than High School | 1,530 (75.6%) | 158 (7.8%) |
| High School Diploma | 5,293 (74.9%) | 240 (3.4%) |
| College / Associate Degree | 3,585 (79.9%) | 94 (2.1%) |
| Bachelor's Degree or higher | 4,128 (88.4%) | 205 (4.4%) |
| Total | 14,544 (79.7%) | 693 (3.8%) |
Employment Occupations by Sex in Garfield
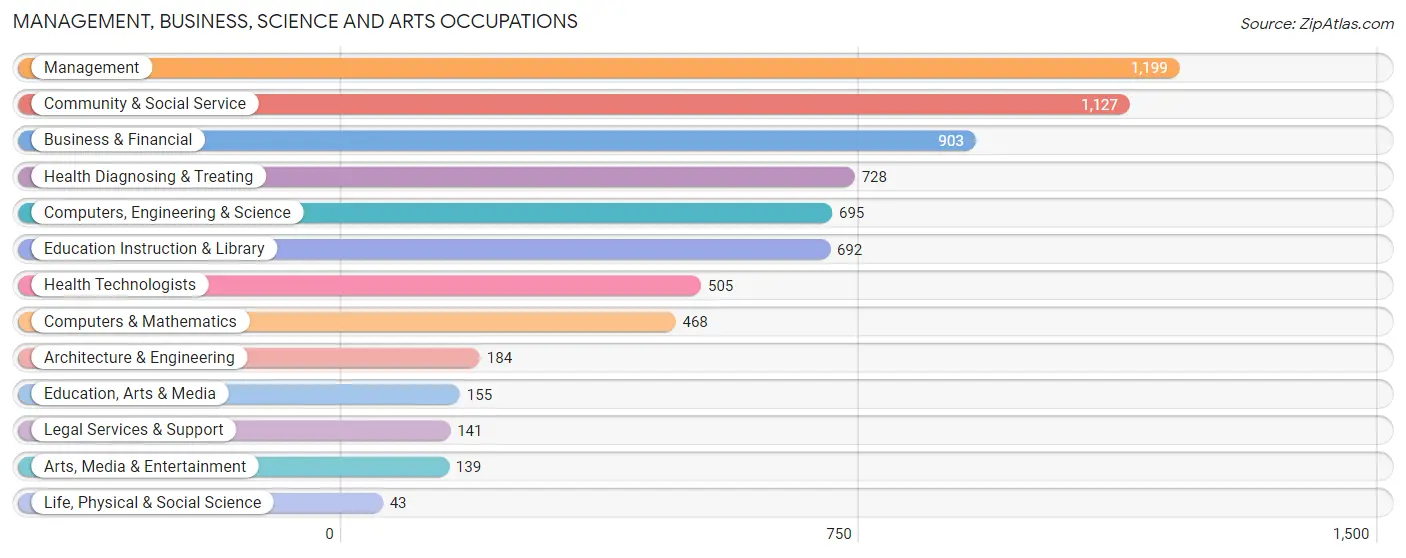
Management, Business, Science and Arts Occupations
The most common Management, Business, Science and Arts occupations in Garfield are Management (1,199 | 7.2%), Community & Social Service (1,127 | 6.8%), Business & Financial (903 | 5.4%), Health Diagnosing & Treating (728 | 4.4%), and Computers, Engineering & Science (695 | 4.2%).
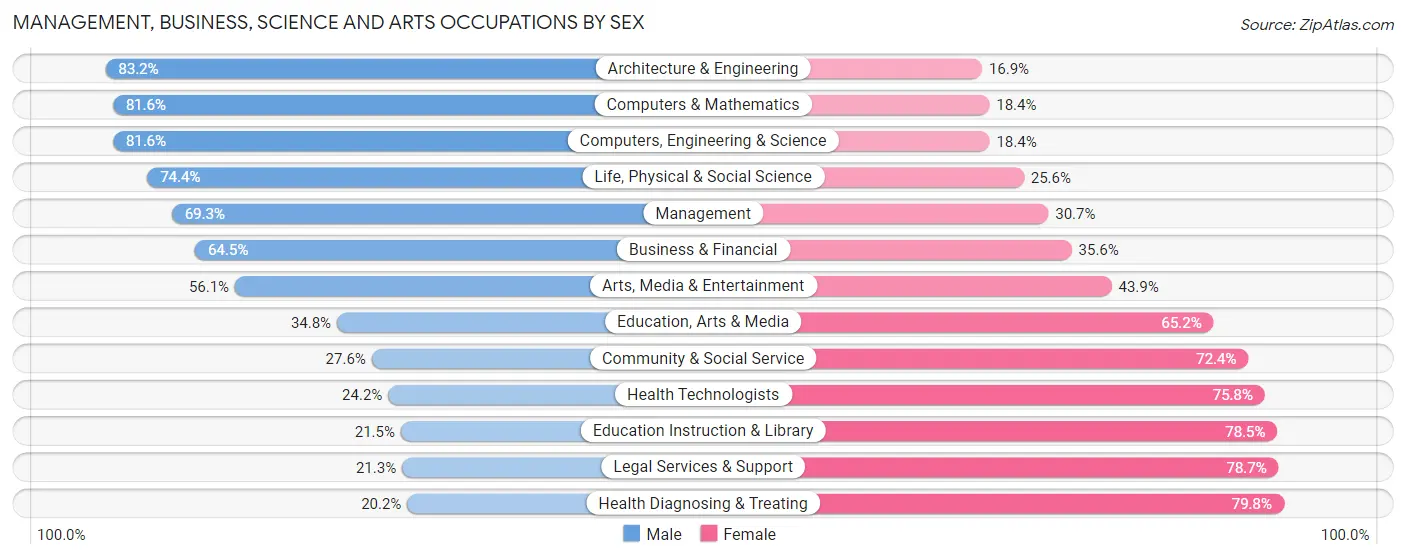
Management, Business, Science and Arts Occupations by Sex
Within the Management, Business, Science and Arts occupations in Garfield, the most male-oriented occupations are Architecture & Engineering (83.2%), Computers & Mathematics (81.6%), and Computers, Engineering & Science (81.6%), while the most female-oriented occupations are Health Diagnosing & Treating (79.8%), Legal Services & Support (78.7%), and Education Instruction & Library (78.5%).
| Occupation | Male | Female |
| Management | 831 (69.3%) | 368 (30.7%) |
| Business & Financial | 582 (64.4%) | 321 (35.5%) |
| Computers, Engineering & Science | 567 (81.6%) | 128 (18.4%) |
| Computers & Mathematics | 382 (81.6%) | 86 (18.4%) |
| Architecture & Engineering | 153 (83.2%) | 31 (16.9%) |
| Life, Physical & Social Science | 32 (74.4%) | 11 (25.6%) |
| Community & Social Service | 311 (27.6%) | 816 (72.4%) |
| Education, Arts & Media | 54 (34.8%) | 101 (65.2%) |
| Legal Services & Support | 30 (21.3%) | 111 (78.7%) |
| Education Instruction & Library | 149 (21.5%) | 543 (78.5%) |
| Arts, Media & Entertainment | 78 (56.1%) | 61 (43.9%) |
| Health Diagnosing & Treating | 147 (20.2%) | 581 (79.8%) |
| Health Technologists | 122 (24.2%) | 383 (75.8%) |
| Total (Category) | 2,438 (52.4%) | 2,214 (47.6%) |
| Total (Overall) | 9,332 (55.9%) | 7,373 (44.1%) |
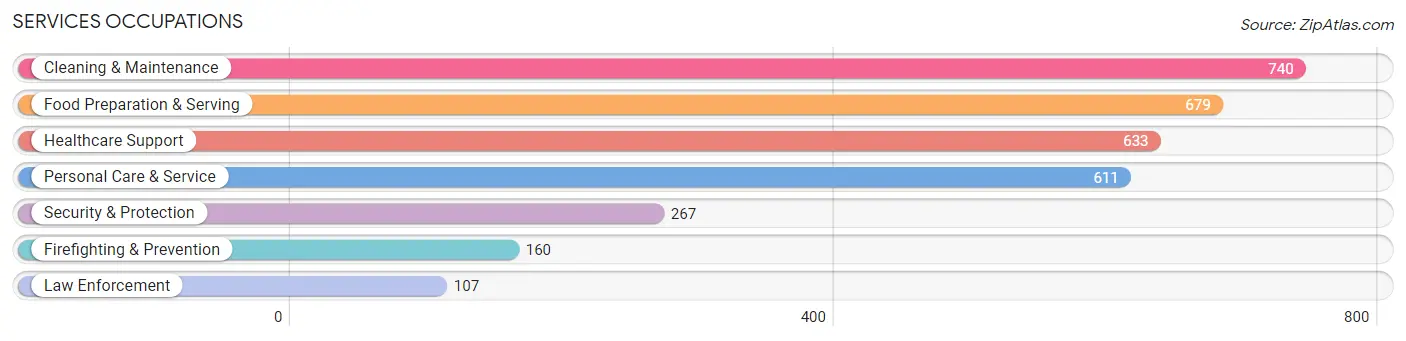
Services Occupations
The most common Services occupations in Garfield are Cleaning & Maintenance (740 | 4.4%), Food Preparation & Serving (679 | 4.1%), Healthcare Support (633 | 3.8%), Personal Care & Service (611 | 3.7%), and Security & Protection (267 | 1.6%).
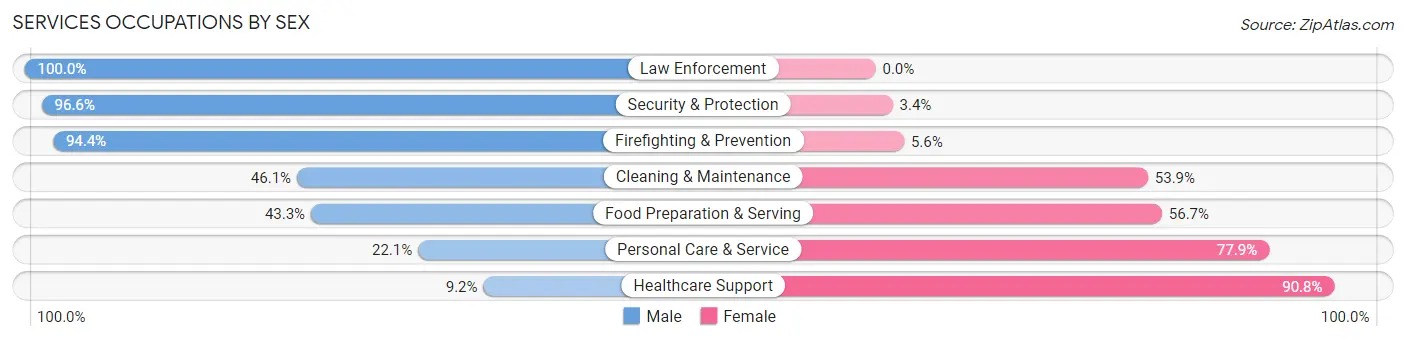
Services Occupations by Sex
Within the Services occupations in Garfield, the most male-oriented occupations are Law Enforcement (100.0%), Security & Protection (96.6%), and Firefighting & Prevention (94.4%), while the most female-oriented occupations are Healthcare Support (90.8%), Personal Care & Service (77.9%), and Food Preparation & Serving (56.7%).
| Occupation | Male | Female |
| Healthcare Support | 58 (9.2%) | 575 (90.8%) |
| Security & Protection | 258 (96.6%) | 9 (3.4%) |
| Firefighting & Prevention | 151 (94.4%) | 9 (5.6%) |
| Law Enforcement | 107 (100.0%) | 0 (0.0%) |
| Food Preparation & Serving | 294 (43.3%) | 385 (56.7%) |
| Cleaning & Maintenance | 341 (46.1%) | 399 (53.9%) |
| Personal Care & Service | 135 (22.1%) | 476 (77.9%) |
| Total (Category) | 1,086 (37.1%) | 1,844 (62.9%) |
| Total (Overall) | 9,332 (55.9%) | 7,373 (44.1%) |
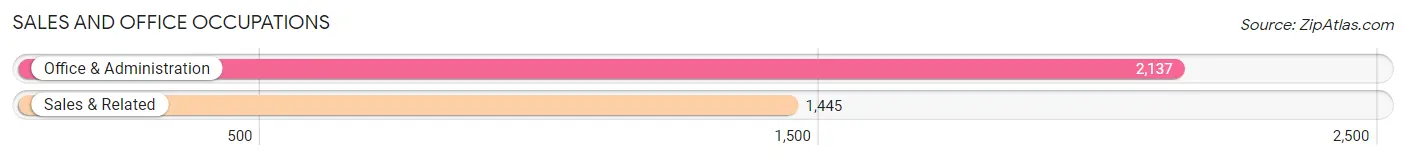
Sales and Office Occupations
The most common Sales and Office occupations in Garfield are Office & Administration (2,137 | 12.8%), and Sales & Related (1,445 | 8.6%).
Sales and Office Occupations by Sex
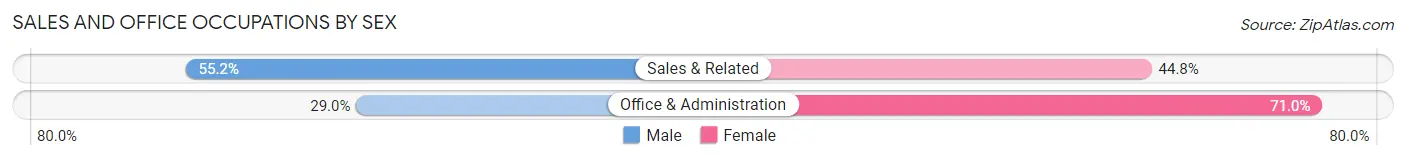
| Occupation | Male | Female |
| Sales & Related | 798 (55.2%) | 647 (44.8%) |
| Office & Administration | 619 (29.0%) | 1,518 (71.0%) |
| Total (Category) | 1,417 (39.6%) | 2,165 (60.4%) |
| Total (Overall) | 9,332 (55.9%) | 7,373 (44.1%) |
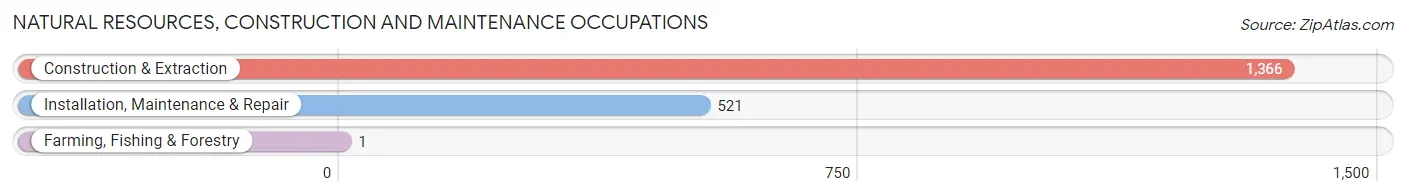
Natural Resources, Construction and Maintenance Occupations
The most common Natural Resources, Construction and Maintenance occupations in Garfield are Construction & Extraction (1,366 | 8.2%), Installation, Maintenance & Repair (521 | 3.1%), and Farming, Fishing & Forestry (1 | 0.0%).
Natural Resources, Construction and Maintenance Occupations by Sex
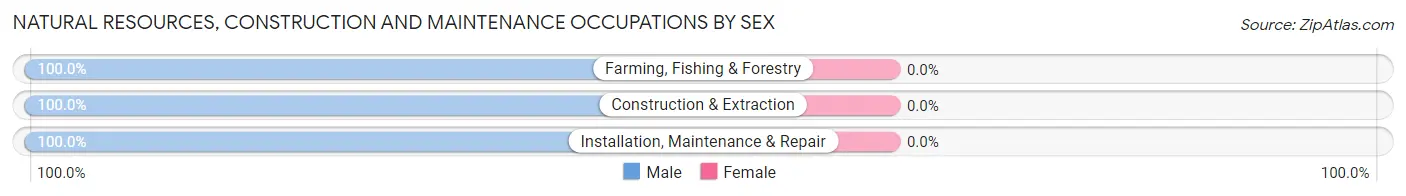
| Occupation | Male | Female |
| Farming, Fishing & Forestry | 1 (100.0%) | 0 (0.0%) |
| Construction & Extraction | 1,366 (100.0%) | 0 (0.0%) |
| Installation, Maintenance & Repair | 521 (100.0%) | 0 (0.0%) |
| Total (Category) | 1,888 (100.0%) | 0 (0.0%) |
| Total (Overall) | 9,332 (55.9%) | 7,373 (44.1%) |
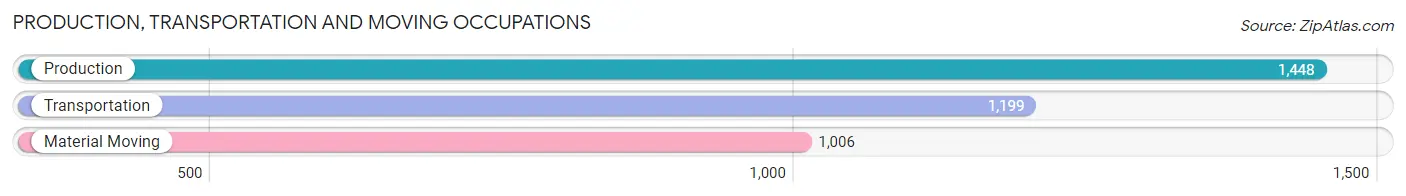
Production, Transportation and Moving Occupations
The most common Production, Transportation and Moving occupations in Garfield are Production (1,448 | 8.7%), Transportation (1,199 | 7.2%), and Material Moving (1,006 | 6.0%).
Production, Transportation and Moving Occupations by Sex
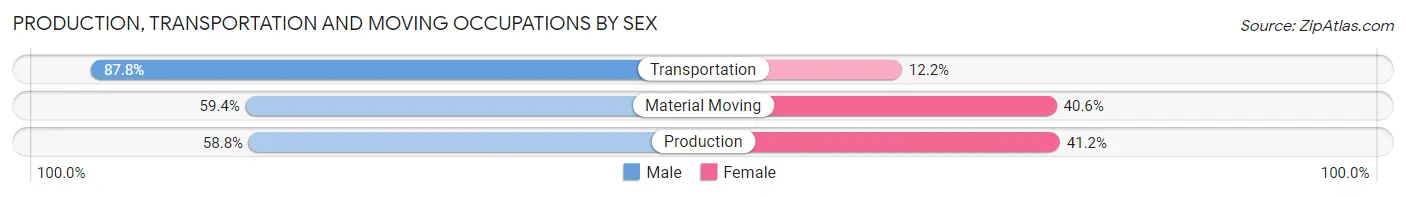
| Occupation | Male | Female |
| Production | 852 (58.8%) | 596 (41.2%) |
| Transportation | 1,053 (87.8%) | 146 (12.2%) |
| Material Moving | 598 (59.4%) | 408 (40.6%) |
| Total (Category) | 2,503 (68.5%) | 1,150 (31.5%) |
| Total (Overall) | 9,332 (55.9%) | 7,373 (44.1%) |
Employment Industries by Sex in Garfield
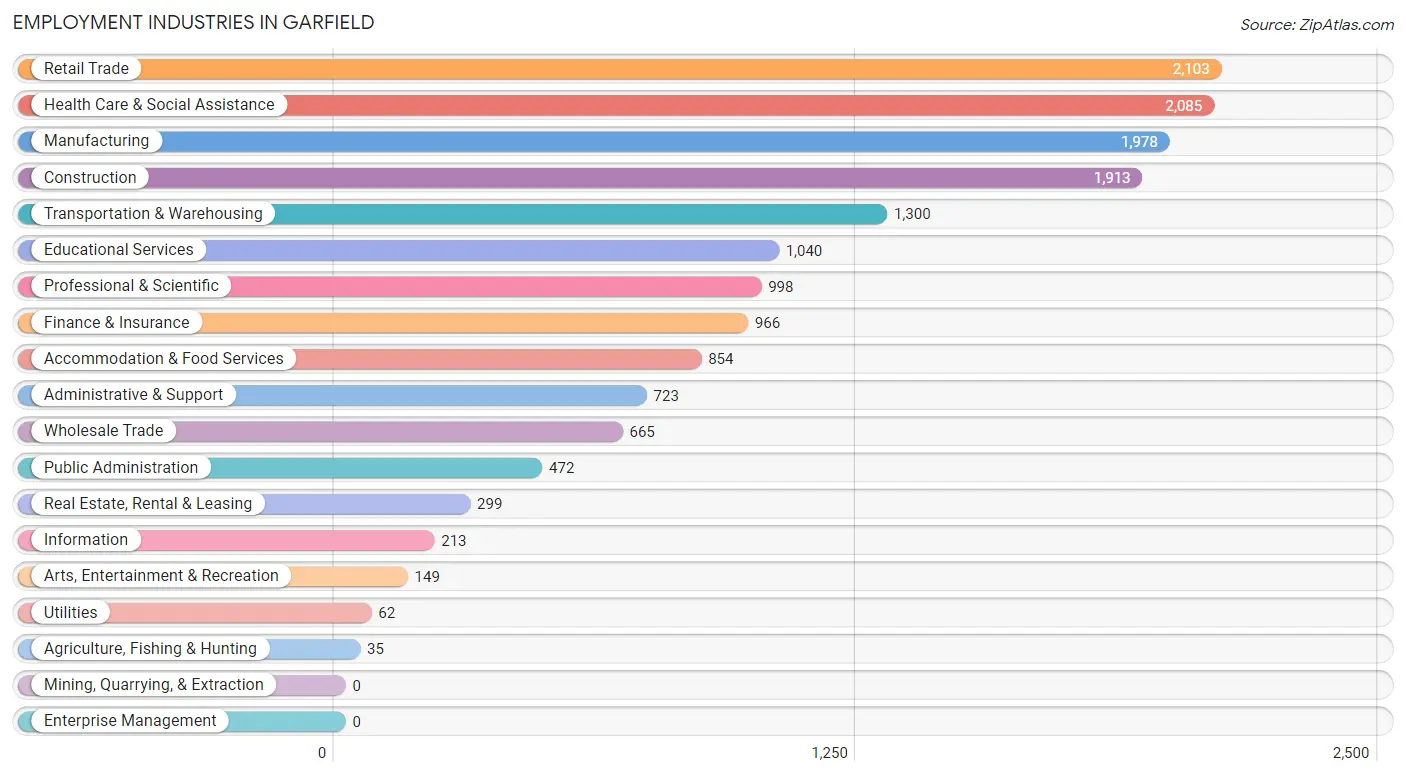
Employment Industries in Garfield
The major employment industries in Garfield include Retail Trade (2,103 | 12.6%), Health Care & Social Assistance (2,085 | 12.5%), Manufacturing (1,978 | 11.8%), Construction (1,913 | 11.5%), and Transportation & Warehousing (1,300 | 7.8%).
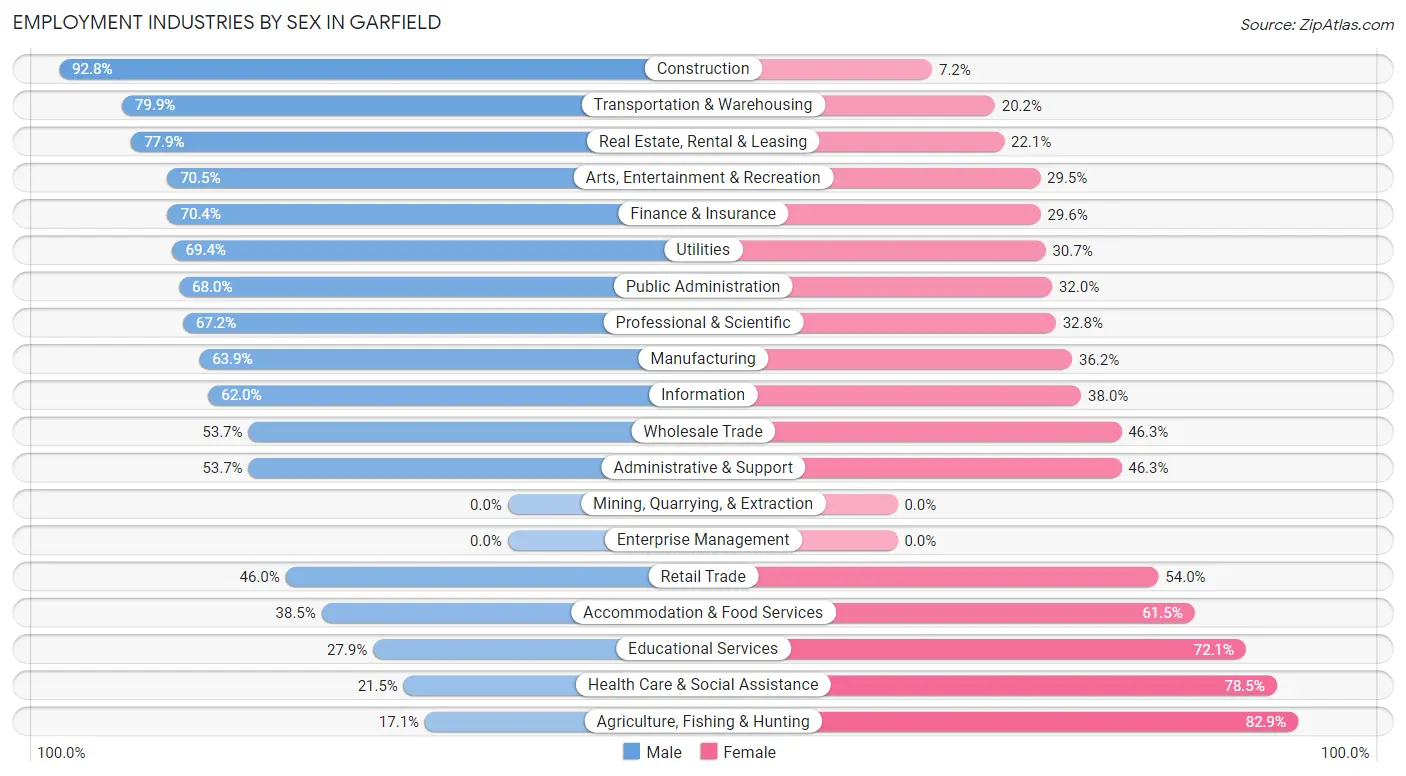
Employment Industries by Sex in Garfield
The Garfield industries that see more men than women are Construction (92.8%), Transportation & Warehousing (79.8%), and Real Estate, Rental & Leasing (77.9%), whereas the industries that tend to have a higher number of women are Agriculture, Fishing & Hunting (82.9%), Health Care & Social Assistance (78.5%), and Educational Services (72.1%).
| Industry | Male | Female |
| Agriculture, Fishing & Hunting | 6 (17.1%) | 29 (82.9%) |
| Mining, Quarrying, & Extraction | 0 (0.0%) | 0 (0.0%) |
| Construction | 1,776 (92.8%) | 137 (7.2%) |
| Manufacturing | 1,263 (63.8%) | 715 (36.1%) |
| Wholesale Trade | 357 (53.7%) | 308 (46.3%) |
| Retail Trade | 967 (46.0%) | 1,136 (54.0%) |
| Transportation & Warehousing | 1,038 (79.8%) | 262 (20.2%) |
| Utilities | 43 (69.4%) | 19 (30.6%) |
| Information | 132 (62.0%) | 81 (38.0%) |
| Finance & Insurance | 680 (70.4%) | 286 (29.6%) |
| Real Estate, Rental & Leasing | 233 (77.9%) | 66 (22.1%) |
| Professional & Scientific | 671 (67.2%) | 327 (32.8%) |
| Enterprise Management | 0 (0.0%) | 0 (0.0%) |
| Administrative & Support | 388 (53.7%) | 335 (46.3%) |
| Educational Services | 290 (27.9%) | 750 (72.1%) |
| Health Care & Social Assistance | 449 (21.5%) | 1,636 (78.5%) |
| Arts, Entertainment & Recreation | 105 (70.5%) | 44 (29.5%) |
| Accommodation & Food Services | 329 (38.5%) | 525 (61.5%) |
| Public Administration | 321 (68.0%) | 151 (32.0%) |
| Total | 9,332 (55.9%) | 7,373 (44.1%) |
Education in Garfield
School Enrollment in Garfield
The most common levels of schooling among the 7,120 students in Garfield are college / undergraduate (1,670 | 23.5%), middle school (1,422 | 20.0%), and elementary school (1,326 | 18.6%).
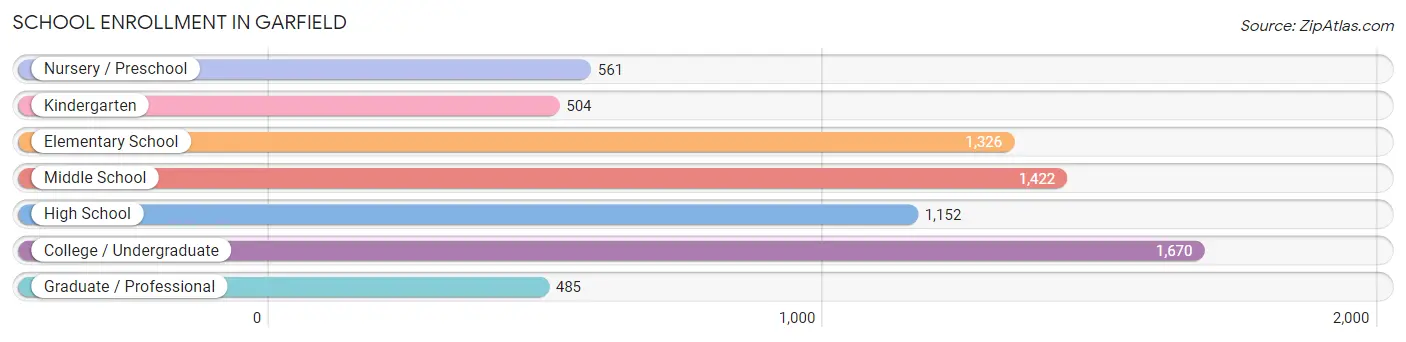
| School Level | # Students | % Students |
| Nursery / Preschool | 561 | 7.9% |
| Kindergarten | 504 | 7.1% |
| Elementary School | 1,326 | 18.6% |
| Middle School | 1,422 | 20.0% |
| High School | 1,152 | 16.2% |
| College / Undergraduate | 1,670 | 23.5% |
| Graduate / Professional | 485 | 6.8% |
| Total | 7,120 | 100.0% |
School Enrollment by Age by Funding Source in Garfield
Out of a total of 7,120 students who are enrolled in schools in Garfield, 1,082 (15.2%) attend a private institution, while the remaining 6,038 (84.8%) are enrolled in public schools. The age group of 35 years and over has the highest likelihood of being enrolled in private schools, with 180 (45.6% in the age bracket) enrolled. Conversely, the age group of 18 to 19 year olds has the lowest likelihood of being enrolled in a private school, with 518 (99.8% in the age bracket) attending a public institution.
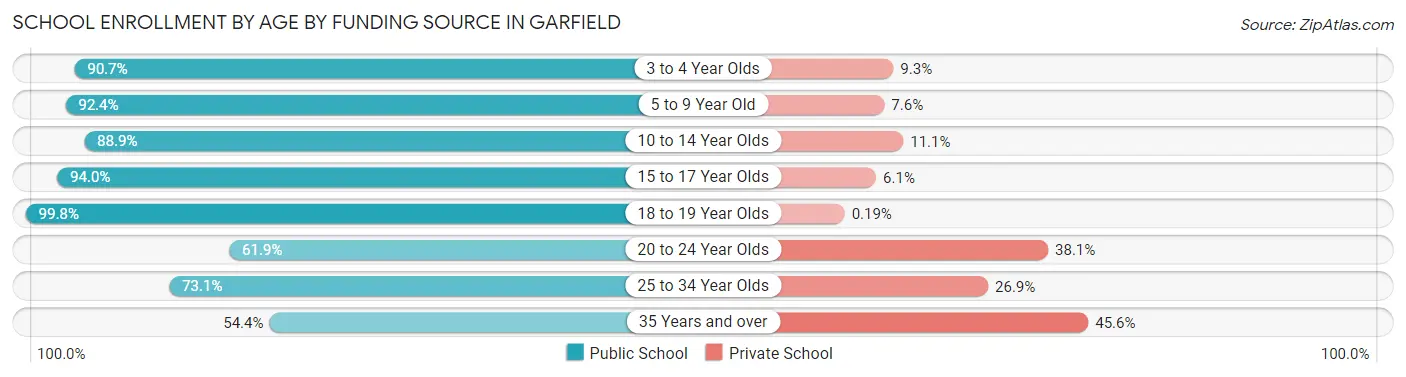
| Age Bracket | Public School | Private School |
| 3 to 4 Year Olds | 441 (90.7%) | 45 (9.3%) |
| 5 to 9 Year Old | 1,608 (92.4%) | 132 (7.6%) |
| 10 to 14 Year Olds | 1,418 (88.9%) | 177 (11.1%) |
| 15 to 17 Year Olds | 838 (94.0%) | 54 (6.0%) |
| 18 to 19 Year Olds | 518 (99.8%) | 1 (0.2%) |
| 20 to 24 Year Olds | 517 (61.9%) | 318 (38.1%) |
| 25 to 34 Year Olds | 481 (73.1%) | 177 (26.9%) |
| 35 Years and over | 215 (54.4%) | 180 (45.6%) |
| Total | 6,038 (84.8%) | 1,082 (15.2%) |
Educational Attainment by Field of Study in Garfield
Business (1,421 | 26.4%), education (673 | 12.5%), science & technology (668 | 12.4%), engineering (472 | 8.8%), and social sciences (363 | 6.7%) are the most common fields of study among 5,386 individuals in Garfield who have obtained a bachelor's degree or higher.
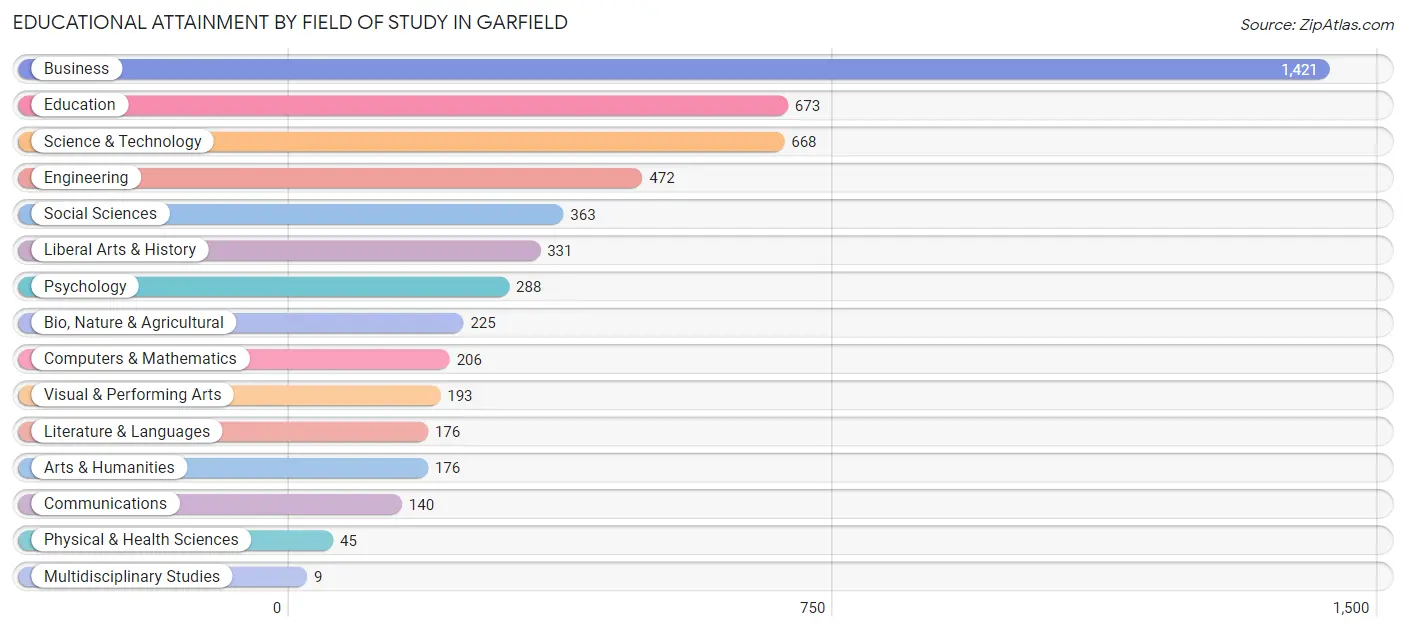
| Field of Study | # Graduates | % Graduates |
| Computers & Mathematics | 206 | 3.8% |
| Bio, Nature & Agricultural | 225 | 4.2% |
| Physical & Health Sciences | 45 | 0.8% |
| Psychology | 288 | 5.3% |
| Social Sciences | 363 | 6.7% |
| Engineering | 472 | 8.8% |
| Multidisciplinary Studies | 9 | 0.2% |
| Science & Technology | 668 | 12.4% |
| Business | 1,421 | 26.4% |
| Education | 673 | 12.5% |
| Literature & Languages | 176 | 3.3% |
| Liberal Arts & History | 331 | 6.1% |
| Visual & Performing Arts | 193 | 3.6% |
| Communications | 140 | 2.6% |
| Arts & Humanities | 176 | 3.3% |
| Total | 5,386 | 100.0% |
Transportation & Commute in Garfield
Vehicle Availability by Sex in Garfield
The most prevalent vehicle ownership categories in Garfield are males with 2 vehicles (3,320, accounting for 35.8%) and females with 2 vehicles (2,936, making up 45.9%).
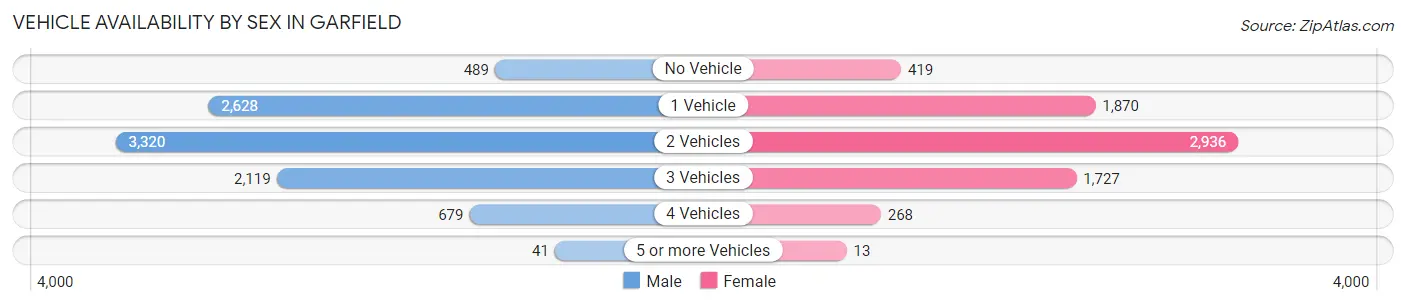
| Vehicles Available | Male | Female |
| No Vehicle | 489 (5.3%) | 419 (5.8%) |
| 1 Vehicle | 2,628 (28.3%) | 1,870 (25.9%) |
| 2 Vehicles | 3,320 (35.8%) | 2,936 (40.6%) |
| 3 Vehicles | 2,119 (22.8%) | 1,727 (23.9%) |
| 4 Vehicles | 679 (7.3%) | 268 (3.7%) |
| 5 or more Vehicles | 41 (0.4%) | 13 (0.2%) |
| Total | 9,276 (100.0%) | 7,233 (100.0%) |
Commute Time in Garfield
The most frequently occuring commute durations in Garfield are 10 to 14 minutes (2,862 commuters, 18.4%), 30 to 34 minutes (2,244 commuters, 14.4%), and 20 to 24 minutes (2,117 commuters, 13.6%).
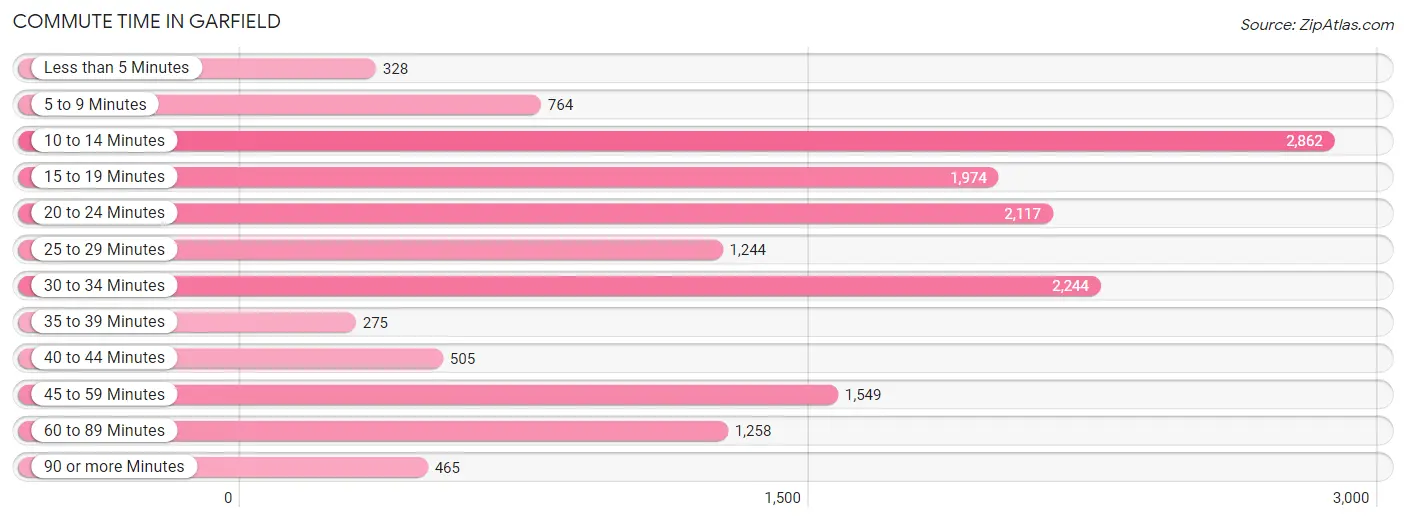
| Commute Time | # Commuters | % Commuters |
| Less than 5 Minutes | 328 | 2.1% |
| 5 to 9 Minutes | 764 | 4.9% |
| 10 to 14 Minutes | 2,862 | 18.4% |
| 15 to 19 Minutes | 1,974 | 12.7% |
| 20 to 24 Minutes | 2,117 | 13.6% |
| 25 to 29 Minutes | 1,244 | 8.0% |
| 30 to 34 Minutes | 2,244 | 14.4% |
| 35 to 39 Minutes | 275 | 1.8% |
| 40 to 44 Minutes | 505 | 3.2% |
| 45 to 59 Minutes | 1,549 | 9.9% |
| 60 to 89 Minutes | 1,258 | 8.1% |
| 90 or more Minutes | 465 | 3.0% |
Commute Time by Sex in Garfield
The most common commute times in Garfield are 10 to 14 minutes (1,454 commuters, 16.3%) for males and 10 to 14 minutes (1,408 commuters, 21.1%) for females.
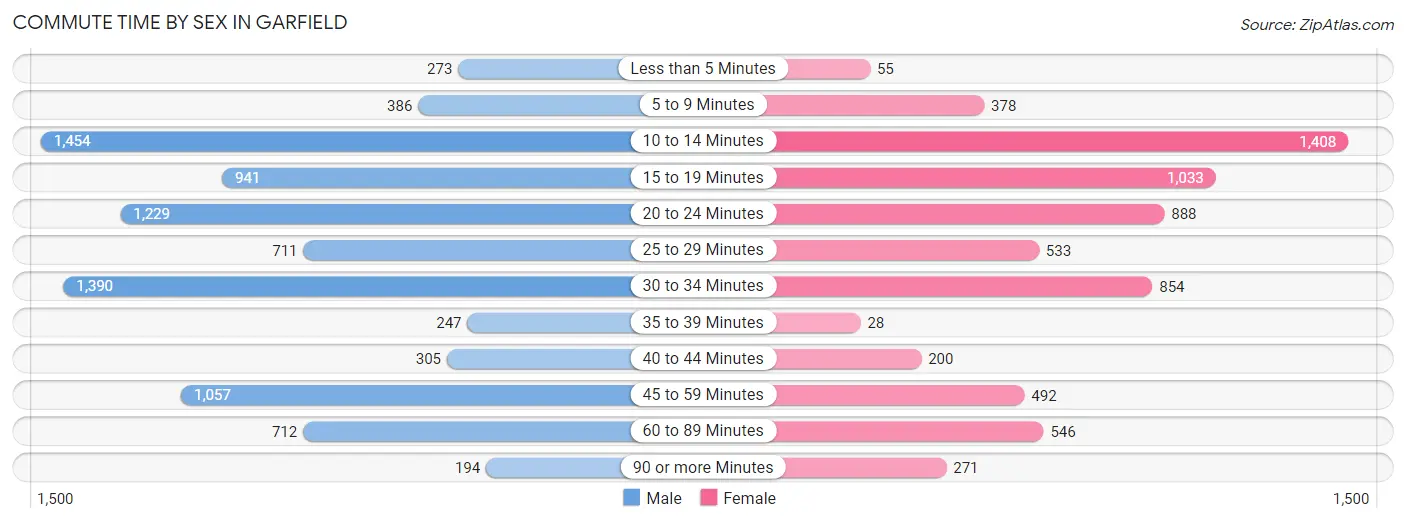
| Commute Time | Male | Female |
| Less than 5 Minutes | 273 (3.1%) | 55 (0.8%) |
| 5 to 9 Minutes | 386 (4.3%) | 378 (5.7%) |
| 10 to 14 Minutes | 1,454 (16.3%) | 1,408 (21.1%) |
| 15 to 19 Minutes | 941 (10.6%) | 1,033 (15.4%) |
| 20 to 24 Minutes | 1,229 (13.8%) | 888 (13.3%) |
| 25 to 29 Minutes | 711 (8.0%) | 533 (8.0%) |
| 30 to 34 Minutes | 1,390 (15.6%) | 854 (12.8%) |
| 35 to 39 Minutes | 247 (2.8%) | 28 (0.4%) |
| 40 to 44 Minutes | 305 (3.4%) | 200 (3.0%) |
| 45 to 59 Minutes | 1,057 (11.9%) | 492 (7.4%) |
| 60 to 89 Minutes | 712 (8.0%) | 546 (8.2%) |
| 90 or more Minutes | 194 (2.2%) | 271 (4.1%) |
Time of Departure to Work by Sex in Garfield
The most frequent times of departure to work in Garfield are 7:00 AM to 7:29 AM (1,408, 15.8%) for males and 8:00 AM to 8:29 AM (977, 14.6%) for females.
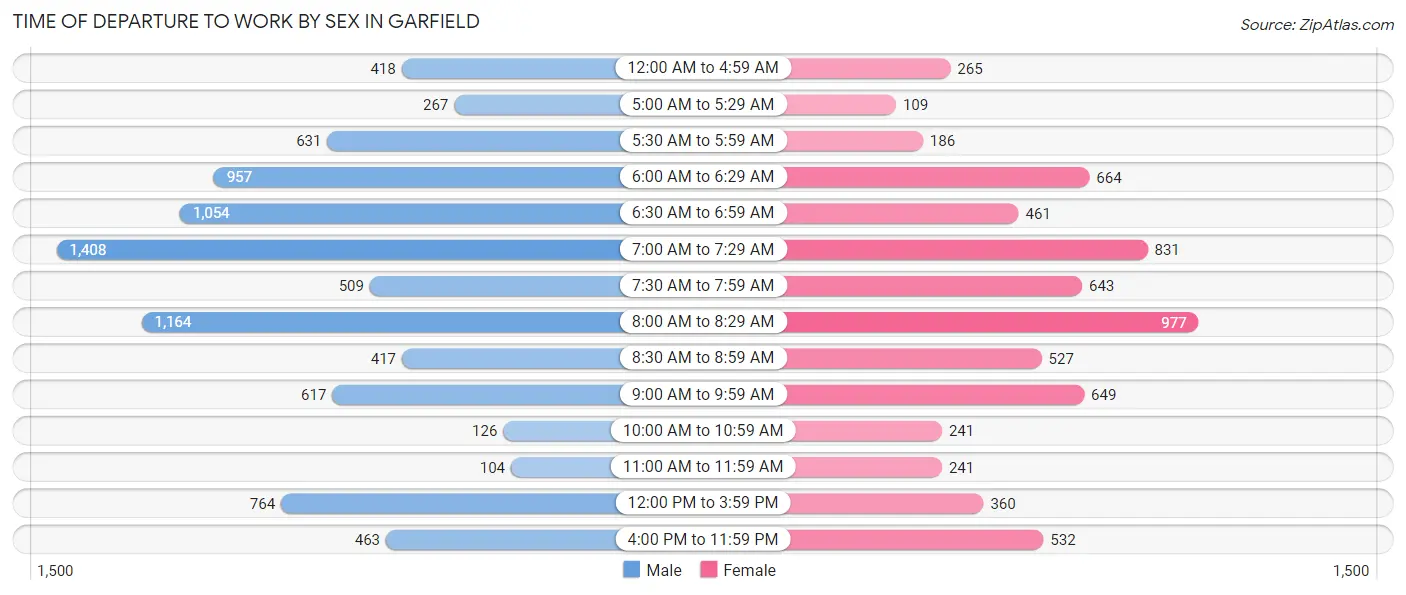
| Time of Departure | Male | Female |
| 12:00 AM to 4:59 AM | 418 (4.7%) | 265 (4.0%) |
| 5:00 AM to 5:29 AM | 267 (3.0%) | 109 (1.6%) |
| 5:30 AM to 5:59 AM | 631 (7.1%) | 186 (2.8%) |
| 6:00 AM to 6:29 AM | 957 (10.7%) | 664 (9.9%) |
| 6:30 AM to 6:59 AM | 1,054 (11.8%) | 461 (6.9%) |
| 7:00 AM to 7:29 AM | 1,408 (15.8%) | 831 (12.4%) |
| 7:30 AM to 7:59 AM | 509 (5.7%) | 643 (9.6%) |
| 8:00 AM to 8:29 AM | 1,164 (13.1%) | 977 (14.6%) |
| 8:30 AM to 8:59 AM | 417 (4.7%) | 527 (7.9%) |
| 9:00 AM to 9:59 AM | 617 (6.9%) | 649 (9.7%) |
| 10:00 AM to 10:59 AM | 126 (1.4%) | 241 (3.6%) |
| 11:00 AM to 11:59 AM | 104 (1.2%) | 241 (3.6%) |
| 12:00 PM to 3:59 PM | 764 (8.6%) | 360 (5.4%) |
| 4:00 PM to 11:59 PM | 463 (5.2%) | 532 (8.0%) |
| Total | 8,899 (100.0%) | 6,686 (100.0%) |
Housing Occupancy in Garfield
Occupancy by Ownership in Garfield
Of the total 11,544 dwellings in Garfield, owner-occupied units account for 5,375 (46.6%), while renter-occupied units make up 6,169 (53.4%).
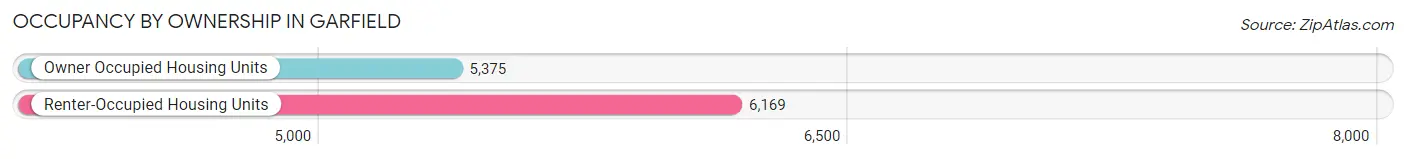
| Occupancy | # Housing Units | % Housing Units |
| Owner Occupied Housing Units | 5,375 | 46.6% |
| Renter-Occupied Housing Units | 6,169 | 53.4% |
| Total Occupied Housing Units | 11,544 | 100.0% |
Occupancy by Household Size in Garfield
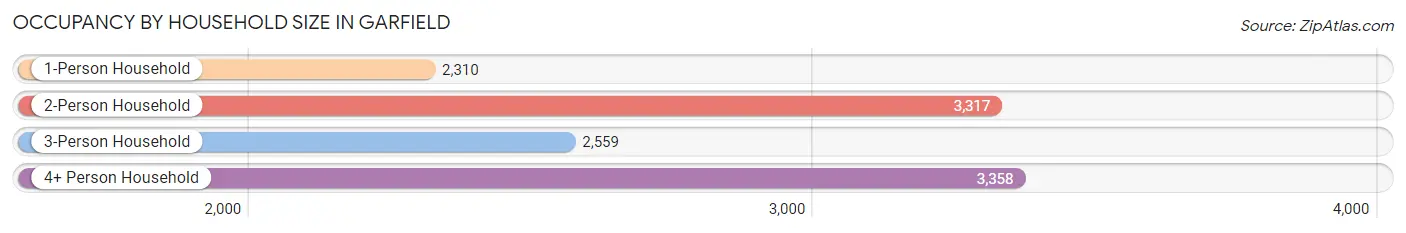
| Household Size | # Housing Units | % Housing Units |
| 1-Person Household | 2,310 | 20.0% |
| 2-Person Household | 3,317 | 28.7% |
| 3-Person Household | 2,559 | 22.2% |
| 4+ Person Household | 3,358 | 29.1% |
| Total Housing Units | 11,544 | 100.0% |
Occupancy by Ownership by Household Size in Garfield
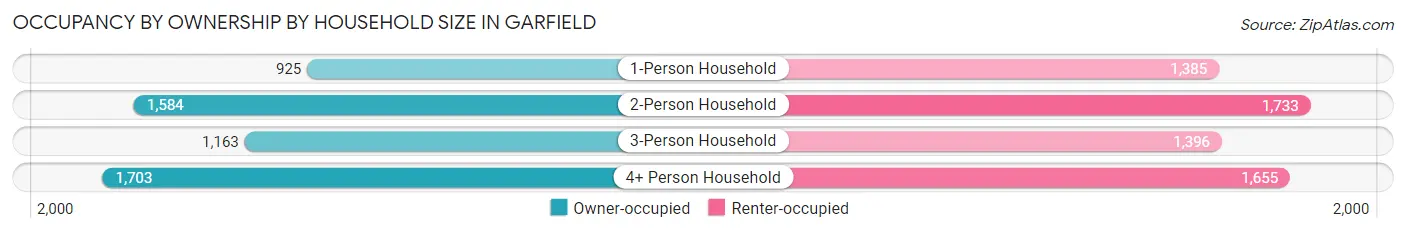
| Household Size | Owner-occupied | Renter-occupied |
| 1-Person Household | 925 (40.0%) | 1,385 (60.0%) |
| 2-Person Household | 1,584 (47.7%) | 1,733 (52.2%) |
| 3-Person Household | 1,163 (45.5%) | 1,396 (54.5%) |
| 4+ Person Household | 1,703 (50.7%) | 1,655 (49.3%) |
| Total Housing Units | 5,375 (46.6%) | 6,169 (53.4%) |
Occupancy by Educational Attainment in Garfield
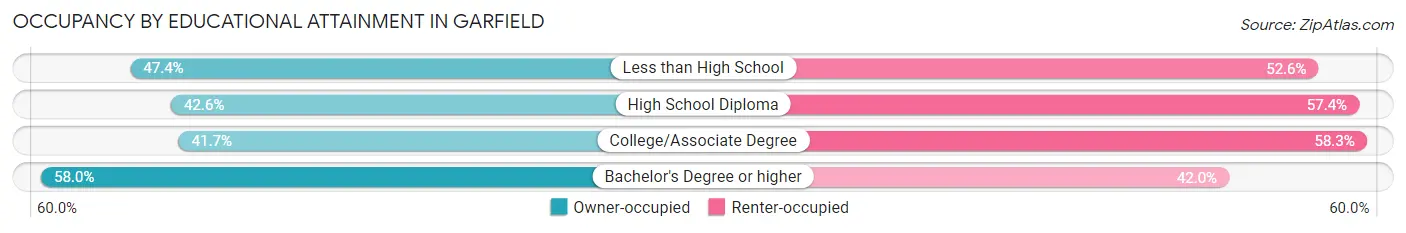
| Household Size | Owner-occupied | Renter-occupied |
| Less than High School | 779 (47.4%) | 864 (52.6%) |
| High School Diploma | 1,748 (42.6%) | 2,357 (57.4%) |
| College/Associate Degree | 1,314 (41.7%) | 1,839 (58.3%) |
| Bachelor's Degree or higher | 1,534 (58.0%) | 1,109 (42.0%) |
Occupancy by Age of Householder in Garfield
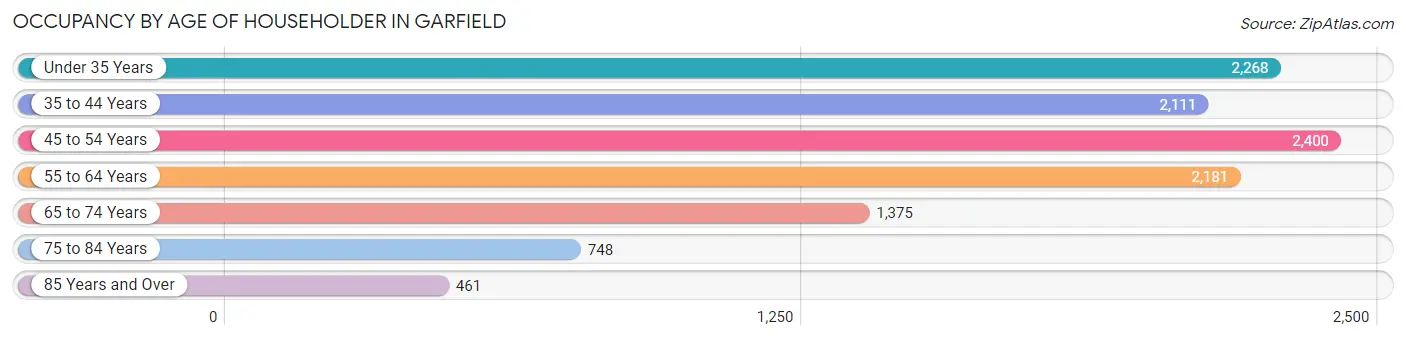
| Age Bracket | # Households | % Households |
| Under 35 Years | 2,268 | 19.7% |
| 35 to 44 Years | 2,111 | 18.3% |
| 45 to 54 Years | 2,400 | 20.8% |
| 55 to 64 Years | 2,181 | 18.9% |
| 65 to 74 Years | 1,375 | 11.9% |
| 75 to 84 Years | 748 | 6.5% |
| 85 Years and Over | 461 | 4.0% |
| Total | 11,544 | 100.0% |
Housing Finances in Garfield
Median Income by Occupancy in Garfield
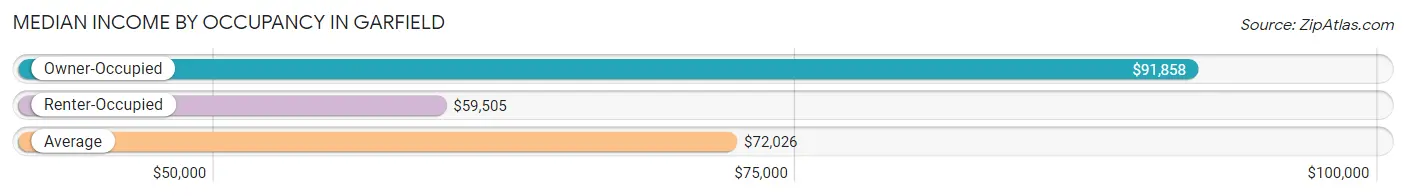
| Occupancy Type | # Households | Median Income |
| Owner-Occupied | 5,375 (46.6%) | $91,858 |
| Renter-Occupied | 6,169 (53.4%) | $59,505 |
| Average | 11,544 (100.0%) | $72,026 |
Occupancy by Householder Income Bracket in Garfield
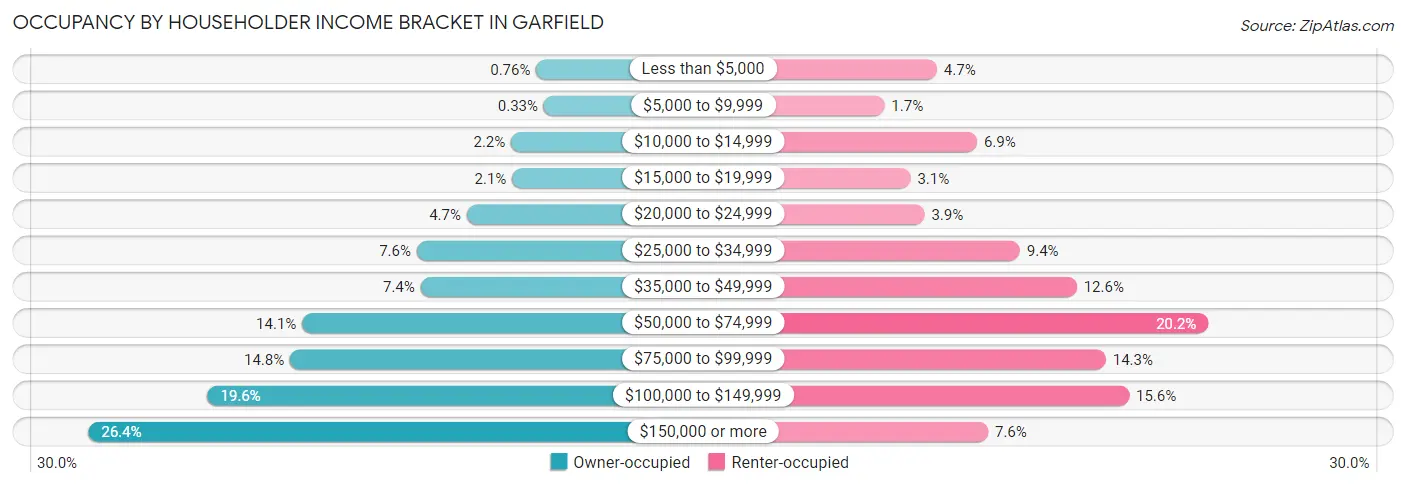
| Income Bracket | Owner-occupied | Renter-occupied |
| Less than $5,000 | 41 (0.8%) | 287 (4.6%) |
| $5,000 to $9,999 | 18 (0.3%) | 102 (1.7%) |
| $10,000 to $14,999 | 118 (2.2%) | 428 (6.9%) |
| $15,000 to $19,999 | 115 (2.1%) | 194 (3.1%) |
| $20,000 to $24,999 | 254 (4.7%) | 243 (3.9%) |
| $25,000 to $34,999 | 408 (7.6%) | 579 (9.4%) |
| $35,000 to $49,999 | 396 (7.4%) | 780 (12.6%) |
| $50,000 to $74,999 | 760 (14.1%) | 1,243 (20.2%) |
| $75,000 to $99,999 | 797 (14.8%) | 882 (14.3%) |
| $100,000 to $149,999 | 1,051 (19.6%) | 964 (15.6%) |
| $150,000 or more | 1,417 (26.4%) | 467 (7.6%) |
| Total | 5,375 (100.0%) | 6,169 (100.0%) |
Monthly Housing Cost Tiers in Garfield
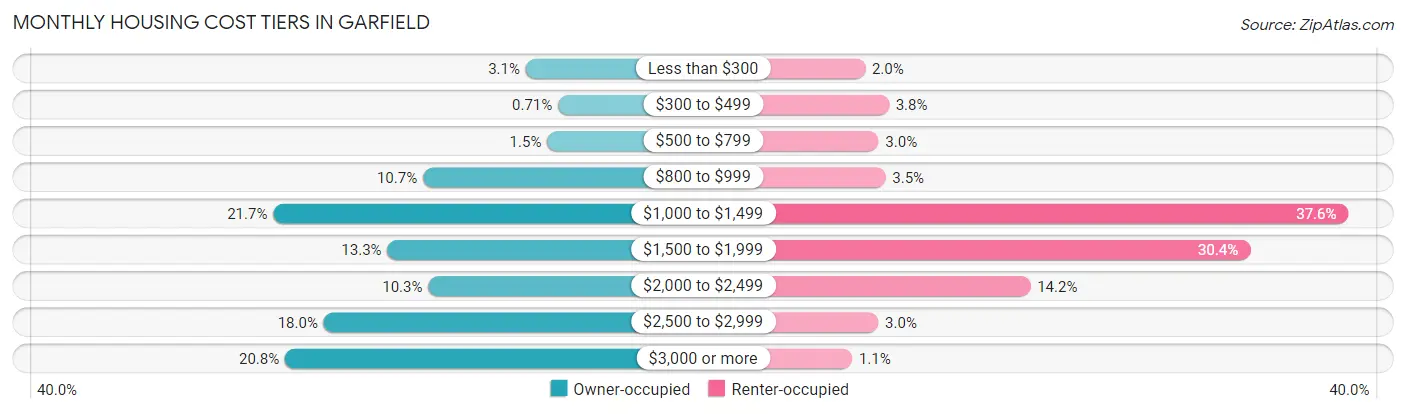
| Monthly Cost | Owner-occupied | Renter-occupied |
| Less than $300 | 166 (3.1%) | 125 (2.0%) |
| $300 to $499 | 38 (0.7%) | 233 (3.8%) |
| $500 to $799 | 81 (1.5%) | 186 (3.0%) |
| $800 to $999 | 573 (10.7%) | 218 (3.5%) |
| $1,000 to $1,499 | 1,166 (21.7%) | 2,321 (37.6%) |
| $1,500 to $1,999 | 714 (13.3%) | 1,875 (30.4%) |
| $2,000 to $2,499 | 552 (10.3%) | 876 (14.2%) |
| $2,500 to $2,999 | 966 (18.0%) | 185 (3.0%) |
| $3,000 or more | 1,119 (20.8%) | 66 (1.1%) |
| Total | 5,375 (100.0%) | 6,169 (100.0%) |
Physical Housing Characteristics in Garfield
Housing Structures in Garfield
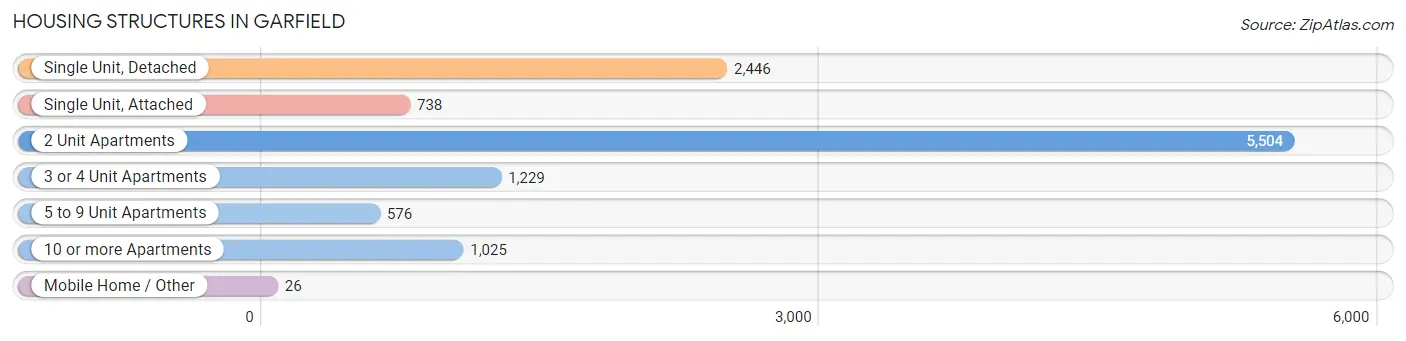
| Structure Type | # Housing Units | % Housing Units |
| Single Unit, Detached | 2,446 | 21.2% |
| Single Unit, Attached | 738 | 6.4% |
| 2 Unit Apartments | 5,504 | 47.7% |
| 3 or 4 Unit Apartments | 1,229 | 10.6% |
| 5 to 9 Unit Apartments | 576 | 5.0% |
| 10 or more Apartments | 1,025 | 8.9% |
| Mobile Home / Other | 26 | 0.2% |
| Total | 11,544 | 100.0% |
Housing Structures by Occupancy in Garfield
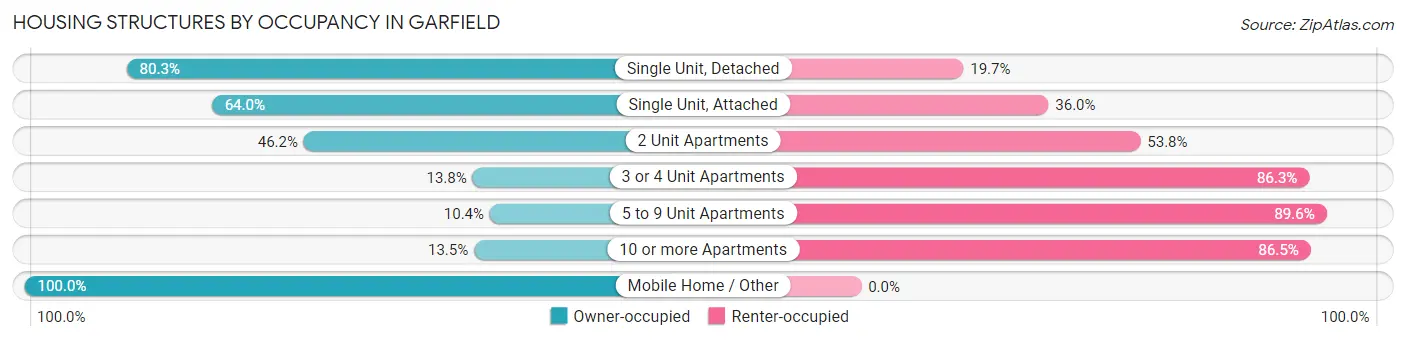
| Structure Type | Owner-occupied | Renter-occupied |
| Single Unit, Detached | 1,965 (80.3%) | 481 (19.7%) |
| Single Unit, Attached | 472 (64.0%) | 266 (36.0%) |
| 2 Unit Apartments | 2,545 (46.2%) | 2,959 (53.8%) |
| 3 or 4 Unit Apartments | 169 (13.8%) | 1,060 (86.3%) |
| 5 to 9 Unit Apartments | 60 (10.4%) | 516 (89.6%) |
| 10 or more Apartments | 138 (13.5%) | 887 (86.5%) |
| Mobile Home / Other | 26 (100.0%) | 0 (0.0%) |
| Total | 5,375 (46.6%) | 6,169 (53.4%) |
Housing Structures by Number of Rooms in Garfield
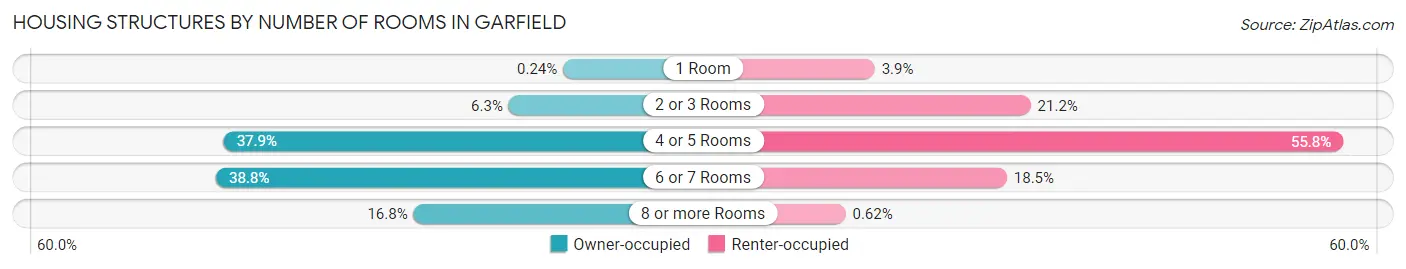
| Number of Rooms | Owner-occupied | Renter-occupied |
| 1 Room | 13 (0.2%) | 238 (3.9%) |
| 2 or 3 Rooms | 337 (6.3%) | 1,306 (21.2%) |
| 4 or 5 Rooms | 2,037 (37.9%) | 3,444 (55.8%) |
| 6 or 7 Rooms | 2,083 (38.8%) | 1,143 (18.5%) |
| 8 or more Rooms | 905 (16.8%) | 38 (0.6%) |
| Total | 5,375 (100.0%) | 6,169 (100.0%) |
Housing Structure by Heating Type in Garfield
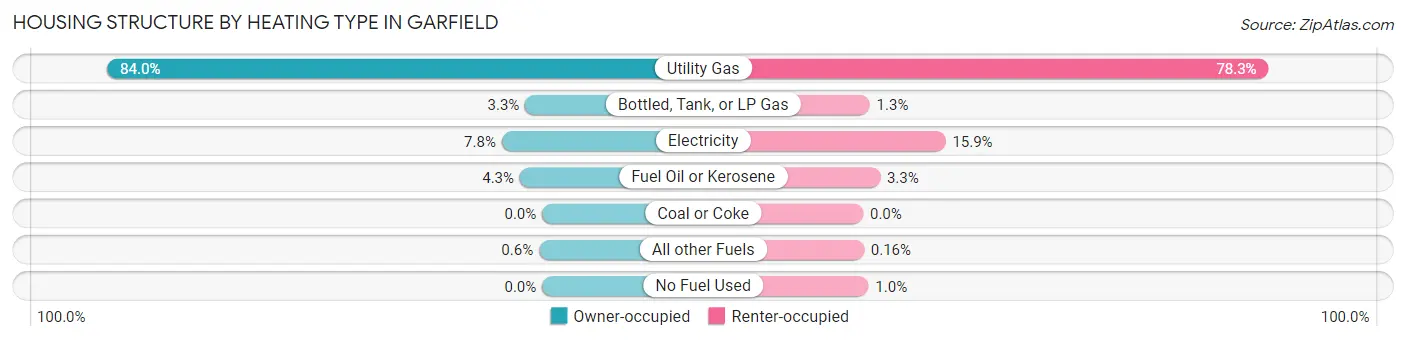
| Heating Type | Owner-occupied | Renter-occupied |
| Utility Gas | 4,517 (84.0%) | 4,832 (78.3%) |
| Bottled, Tank, or LP Gas | 176 (3.3%) | 79 (1.3%) |
| Electricity | 419 (7.8%) | 982 (15.9%) |
| Fuel Oil or Kerosene | 231 (4.3%) | 202 (3.3%) |
| Coal or Coke | 0 (0.0%) | 0 (0.0%) |
| All other Fuels | 32 (0.6%) | 10 (0.2%) |
| No Fuel Used | 0 (0.0%) | 64 (1.0%) |
| Total | 5,375 (100.0%) | 6,169 (100.0%) |
Household Vehicle Usage in Garfield
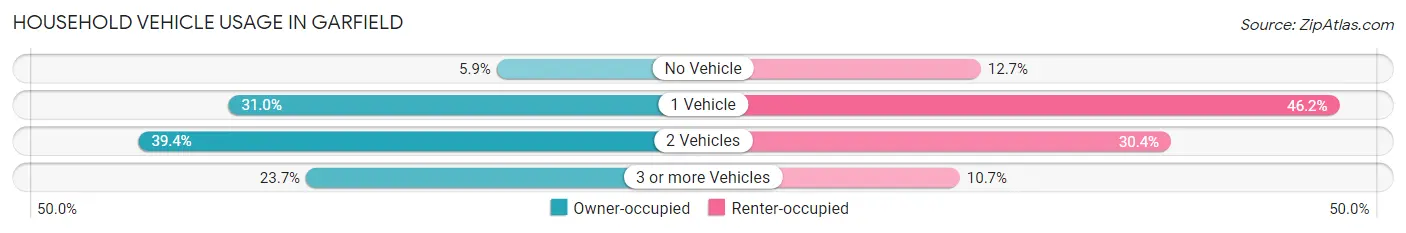
| Vehicles per Household | Owner-occupied | Renter-occupied |
| No Vehicle | 319 (5.9%) | 783 (12.7%) |
| 1 Vehicle | 1,664 (31.0%) | 2,847 (46.2%) |
| 2 Vehicles | 2,116 (39.4%) | 1,877 (30.4%) |
| 3 or more Vehicles | 1,276 (23.7%) | 662 (10.7%) |
| Total | 5,375 (100.0%) | 6,169 (100.0%) |
Real Estate & Mortgages in Garfield
Real Estate and Mortgage Overview in Garfield
| Characteristic | Without Mortgage | With Mortgage |
| Housing Units | 2,215 | 3,160 |
| Median Property Value | $412,800 | $442,600 |
| Median Household Income | $71,066 | $878 |
| Monthly Housing Costs | $1,100 | $1,093 |
| Real Estate Taxes | $9,081 | $84 |
Property Value by Mortgage Status in Garfield
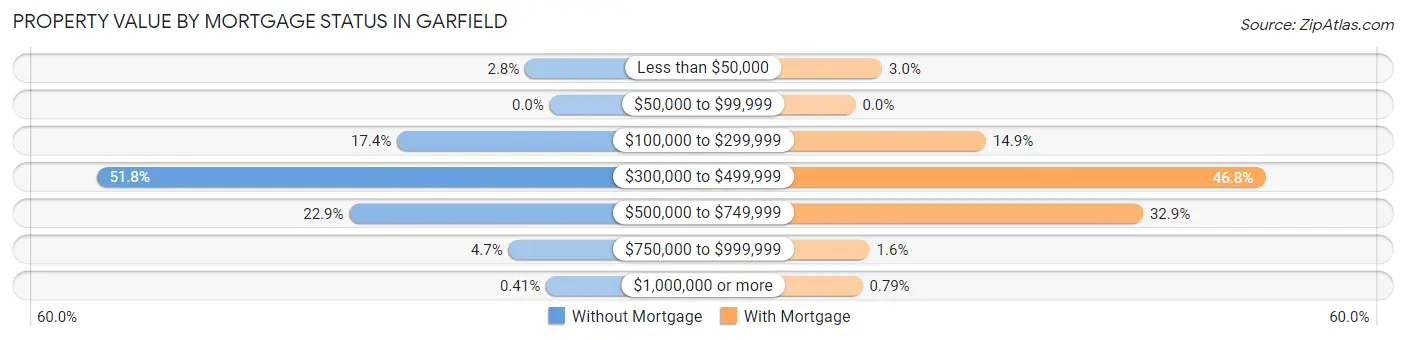
| Property Value | Without Mortgage | With Mortgage |
| Less than $50,000 | 62 (2.8%) | 96 (3.0%) |
| $50,000 to $99,999 | 0 (0.0%) | 0 (0.0%) |
| $100,000 to $299,999 | 386 (17.4%) | 471 (14.9%) |
| $300,000 to $499,999 | 1,147 (51.8%) | 1,479 (46.8%) |
| $500,000 to $749,999 | 507 (22.9%) | 1,038 (32.9%) |
| $750,000 to $999,999 | 104 (4.7%) | 51 (1.6%) |
| $1,000,000 or more | 9 (0.4%) | 25 (0.8%) |
| Total | 2,215 (100.0%) | 3,160 (100.0%) |
Household Income by Mortgage Status in Garfield
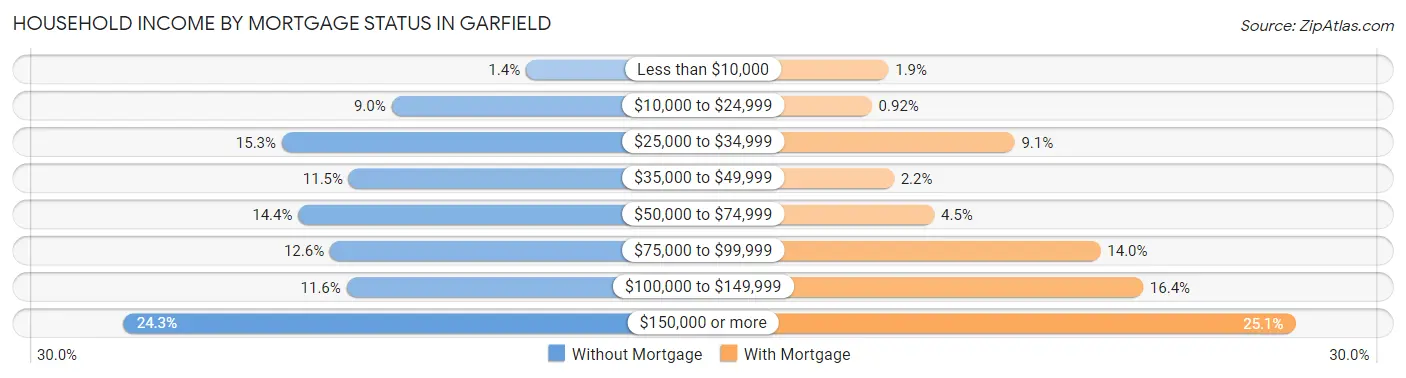
| Household Income | Without Mortgage | With Mortgage |
| Less than $10,000 | 30 (1.3%) | 59 (1.9%) |
| $10,000 to $24,999 | 200 (9.0%) | 29 (0.9%) |
| $25,000 to $34,999 | 339 (15.3%) | 287 (9.1%) |
| $35,000 to $49,999 | 254 (11.5%) | 69 (2.2%) |
| $50,000 to $74,999 | 318 (14.4%) | 142 (4.5%) |
| $75,000 to $99,999 | 278 (12.6%) | 442 (14.0%) |
| $100,000 to $149,999 | 257 (11.6%) | 519 (16.4%) |
| $150,000 or more | 539 (24.3%) | 794 (25.1%) |
| Total | 2,215 (100.0%) | 3,160 (100.0%) |
Property Value to Household Income Ratio in Garfield
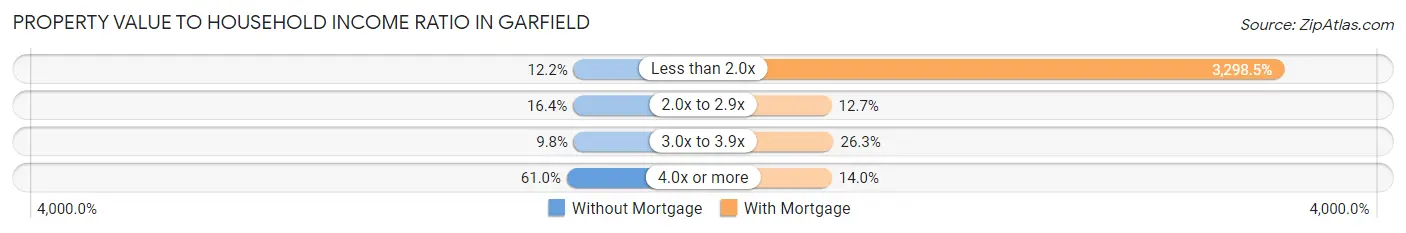
| Value-to-Income Ratio | Without Mortgage | With Mortgage |
| Less than 2.0x | 270 (12.2%) | 104,231 (3,298.4%) |
| 2.0x to 2.9x | 363 (16.4%) | 401 (12.7%) |
| 3.0x to 3.9x | 217 (9.8%) | 830 (26.3%) |
| 4.0x or more | 1,350 (61.0%) | 441 (14.0%) |
| Total | 2,215 (100.0%) | 3,160 (100.0%) |
Real Estate Taxes by Mortgage Status in Garfield
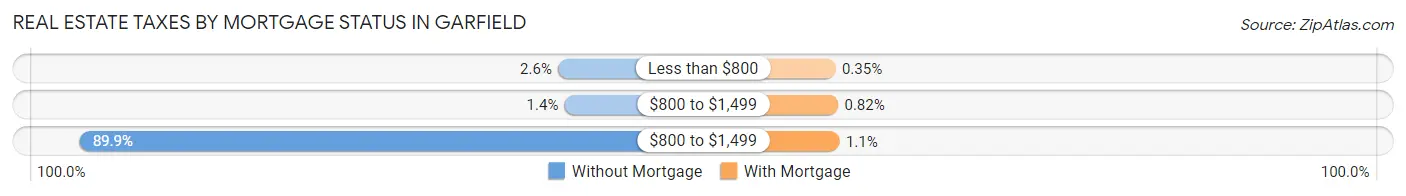
| Property Taxes | Without Mortgage | With Mortgage |
| Less than $800 | 58 (2.6%) | 11 (0.4%) |
| $800 to $1,499 | 32 (1.4%) | 26 (0.8%) |
| $800 to $1,499 | 1,992 (89.9%) | 34 (1.1%) |
| Total | 2,215 (100.0%) | 3,160 (100.0%) |
Health & Disability in Garfield
Health Insurance Coverage by Age in Garfield
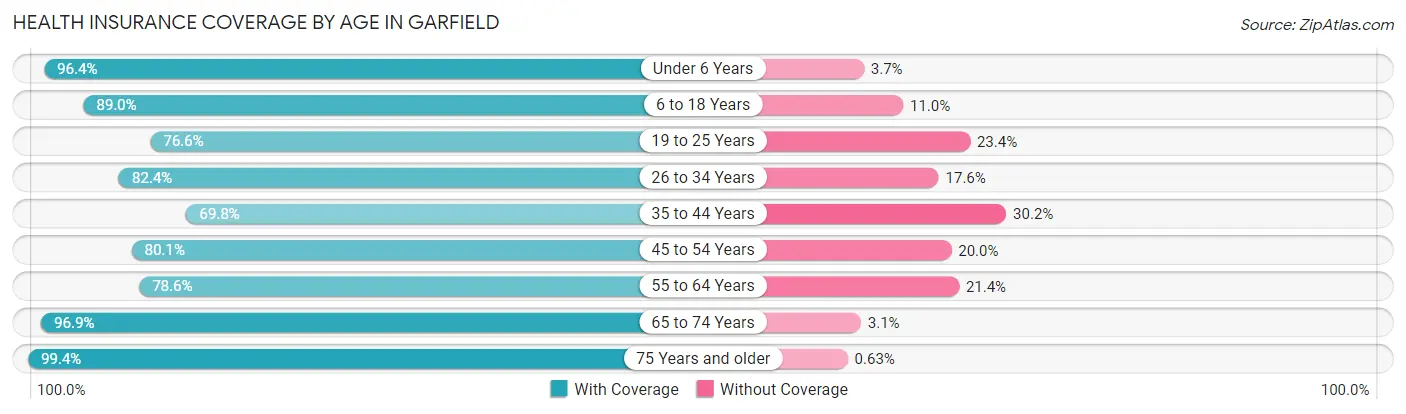
| Age Bracket | With Coverage | Without Coverage |
| Under 6 Years | 2,245 (96.4%) | 85 (3.6%) |
| 6 to 18 Years | 3,987 (89.0%) | 491 (11.0%) |
| 19 to 25 Years | 2,607 (76.6%) | 798 (23.4%) |
| 26 to 34 Years | 3,673 (82.4%) | 784 (17.6%) |
| 35 to 44 Years | 3,269 (69.8%) | 1,413 (30.2%) |
| 45 to 54 Years | 3,518 (80.0%) | 877 (20.0%) |
| 55 to 64 Years | 3,273 (78.6%) | 890 (21.4%) |
| 65 to 74 Years | 2,574 (96.9%) | 82 (3.1%) |
| 75 Years and older | 1,882 (99.4%) | 12 (0.6%) |
| Total | 27,028 (83.3%) | 5,432 (16.7%) |
Health Insurance Coverage by Citizenship Status in Garfield
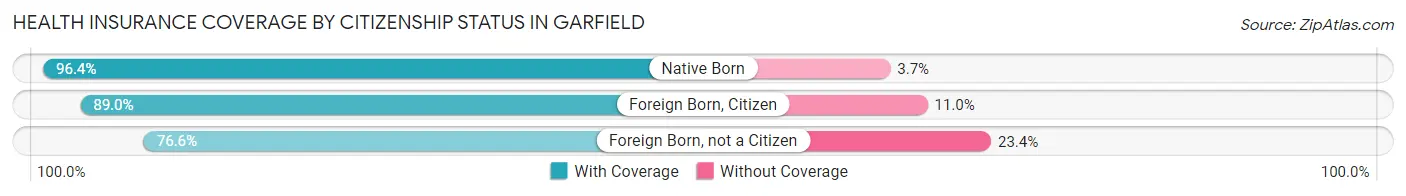
| Citizenship Status | With Coverage | Without Coverage |
| Native Born | 2,245 (96.4%) | 85 (3.6%) |
| Foreign Born, Citizen | 3,987 (89.0%) | 491 (11.0%) |
| Foreign Born, not a Citizen | 2,607 (76.6%) | 798 (23.4%) |
Health Insurance Coverage by Household Income in Garfield
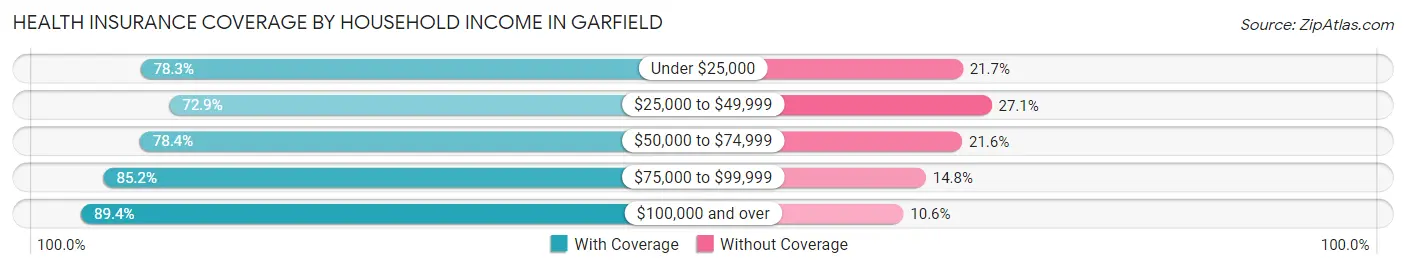
| Household Income | With Coverage | Without Coverage |
| Under $25,000 | 2,876 (78.3%) | 798 (21.7%) |
| $25,000 to $49,999 | 3,712 (72.9%) | 1,381 (27.1%) |
| $50,000 to $74,999 | 3,764 (78.4%) | 1,037 (21.6%) |
| $75,000 to $99,999 | 4,169 (85.2%) | 724 (14.8%) |
| $100,000 and over | 12,481 (89.4%) | 1,480 (10.6%) |
Public vs Private Health Insurance Coverage by Age in Garfield
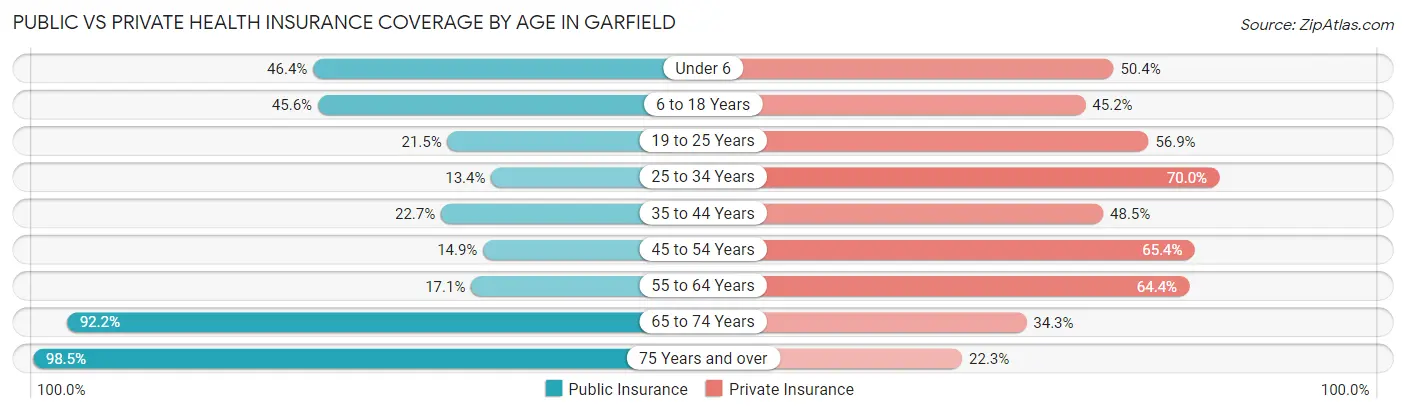
| Age Bracket | Public Insurance | Private Insurance |
| Under 6 | 1,082 (46.4%) | 1,175 (50.4%) |
| 6 to 18 Years | 2,040 (45.6%) | 2,025 (45.2%) |
| 19 to 25 Years | 732 (21.5%) | 1,938 (56.9%) |
| 25 to 34 Years | 596 (13.4%) | 3,120 (70.0%) |
| 35 to 44 Years | 1,063 (22.7%) | 2,271 (48.5%) |
| 45 to 54 Years | 654 (14.9%) | 2,876 (65.4%) |
| 55 to 64 Years | 712 (17.1%) | 2,682 (64.4%) |
| 65 to 74 Years | 2,448 (92.2%) | 910 (34.3%) |
| 75 Years and over | 1,865 (98.5%) | 423 (22.3%) |
| Total | 11,192 (34.5%) | 17,420 (53.7%) |
Disability Status by Sex by Age in Garfield
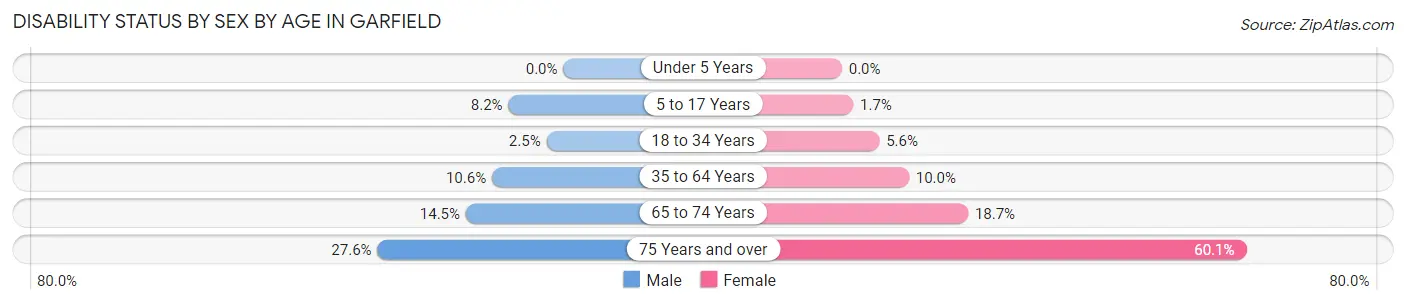
| Age Bracket | Male | Female |
| Under 5 Years | 0 (0.0%) | 0 (0.0%) |
| 5 to 17 Years | 183 (8.2%) | 37 (1.7%) |
| 18 to 34 Years | 106 (2.5%) | 226 (5.6%) |
| 35 to 64 Years | 742 (10.6%) | 621 (10.0%) |
| 65 to 74 Years | 179 (14.5%) | 266 (18.7%) |
| 75 Years and over | 225 (27.6%) | 648 (60.1%) |
Disability Class by Sex by Age in Garfield
Disability Class: Hearing Difficulty
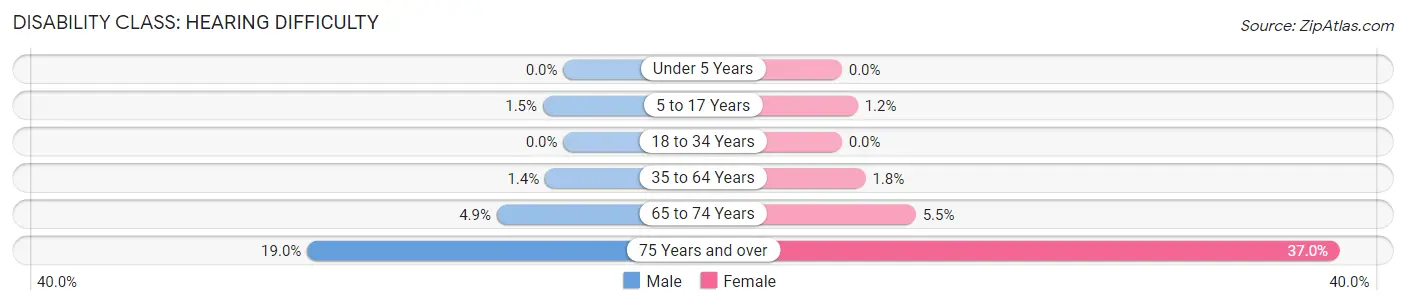
| Age Bracket | Male | Female |
| Under 5 Years | 0 (0.0%) | 0 (0.0%) |
| 5 to 17 Years | 34 (1.5%) | 26 (1.2%) |
| 18 to 34 Years | 0 (0.0%) | 0 (0.0%) |
| 35 to 64 Years | 95 (1.4%) | 110 (1.8%) |
| 65 to 74 Years | 61 (4.9%) | 78 (5.5%) |
| 75 Years and over | 155 (19.0%) | 399 (37.0%) |
Disability Class: Vision Difficulty
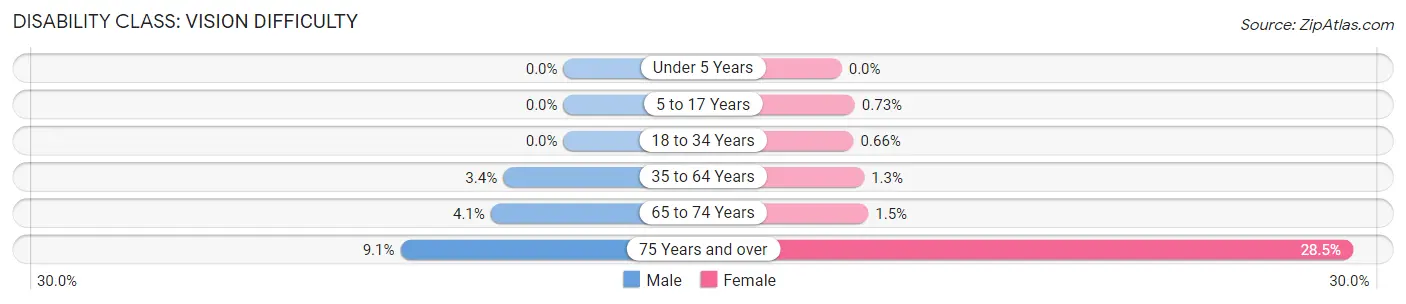
| Age Bracket | Male | Female |
| Under 5 Years | 0 (0.0%) | 0 (0.0%) |
| 5 to 17 Years | 0 (0.0%) | 16 (0.7%) |
| 18 to 34 Years | 0 (0.0%) | 27 (0.7%) |
| 35 to 64 Years | 235 (3.4%) | 78 (1.3%) |
| 65 to 74 Years | 50 (4.1%) | 21 (1.5%) |
| 75 Years and over | 74 (9.1%) | 307 (28.4%) |
Disability Class: Cognitive Difficulty
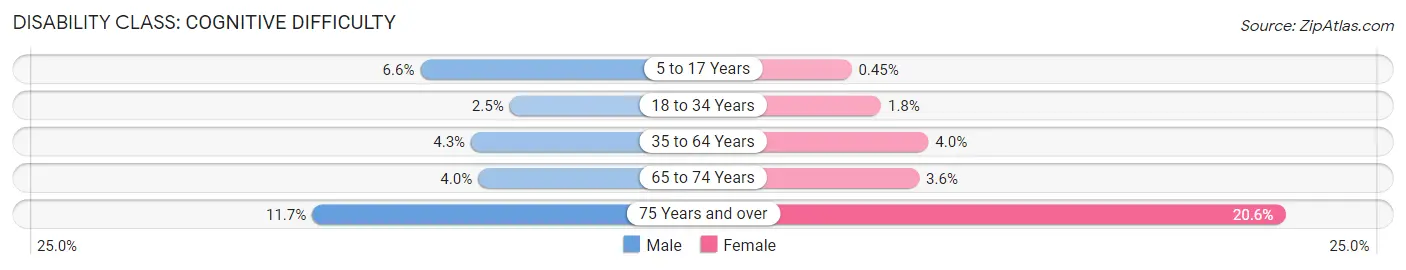
| Age Bracket | Male | Female |
| 5 to 17 Years | 149 (6.6%) | 10 (0.4%) |
| 18 to 34 Years | 106 (2.5%) | 74 (1.8%) |
| 35 to 64 Years | 300 (4.3%) | 251 (4.0%) |
| 65 to 74 Years | 49 (4.0%) | 51 (3.6%) |
| 75 Years and over | 95 (11.7%) | 222 (20.6%) |
Disability Class: Ambulatory Difficulty
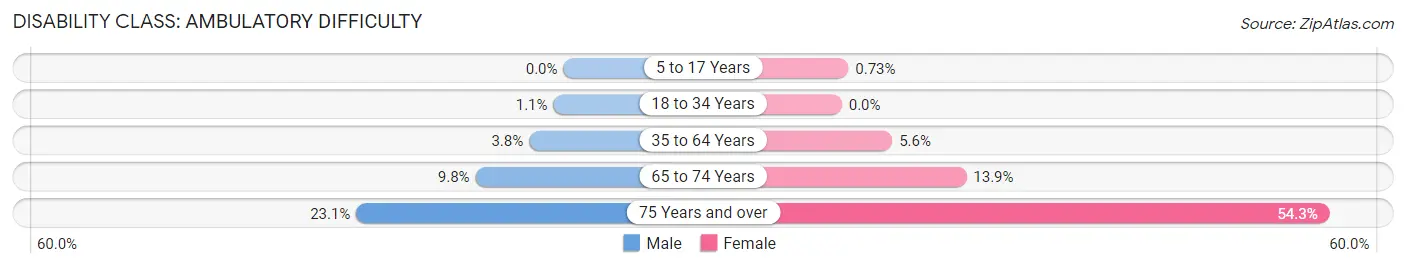
| Age Bracket | Male | Female |
| 5 to 17 Years | 0 (0.0%) | 16 (0.7%) |
| 18 to 34 Years | 47 (1.1%) | 0 (0.0%) |
| 35 to 64 Years | 267 (3.8%) | 351 (5.6%) |
| 65 to 74 Years | 121 (9.8%) | 197 (13.9%) |
| 75 Years and over | 188 (23.1%) | 586 (54.3%) |
Disability Class: Self-Care Difficulty
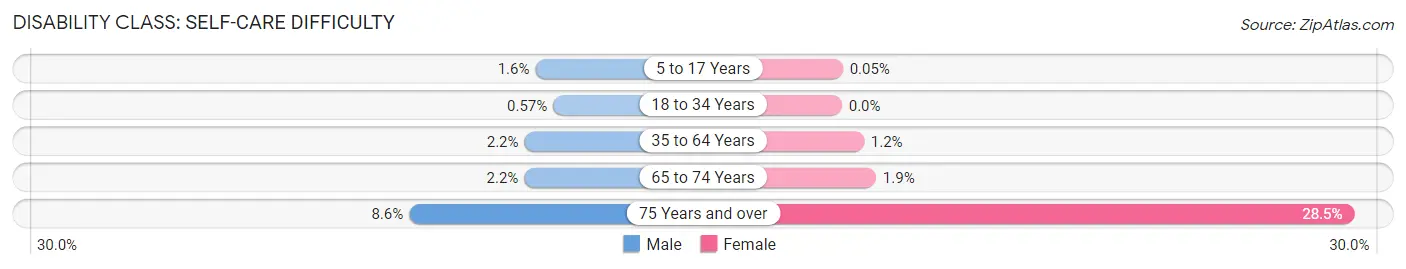
| Age Bracket | Male | Female |
| 5 to 17 Years | 35 (1.6%) | 1 (0.1%) |
| 18 to 34 Years | 24 (0.6%) | 0 (0.0%) |
| 35 to 64 Years | 152 (2.2%) | 77 (1.2%) |
| 65 to 74 Years | 27 (2.2%) | 27 (1.9%) |
| 75 Years and over | 70 (8.6%) | 308 (28.5%) |
Technology Access in Garfield
Computing Device Access in Garfield
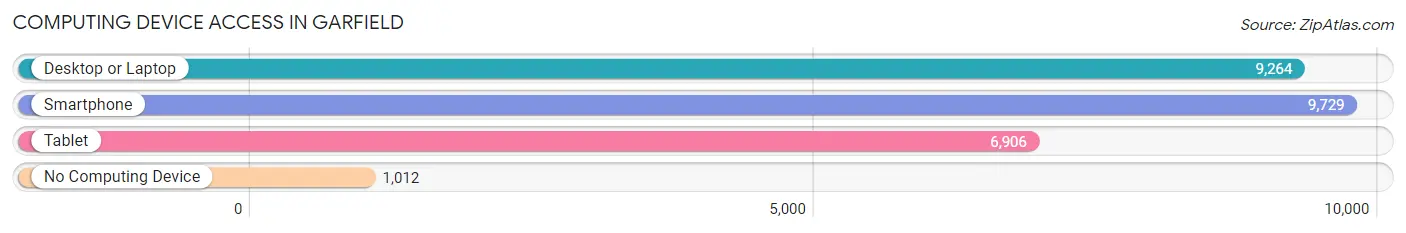
| Device Type | # Households | % Households |
| Desktop or Laptop | 9,264 | 80.2% |
| Smartphone | 9,729 | 84.3% |
| Tablet | 6,906 | 59.8% |
| No Computing Device | 1,012 | 8.8% |
| Total | 11,544 | 100.0% |
Internet Access in Garfield
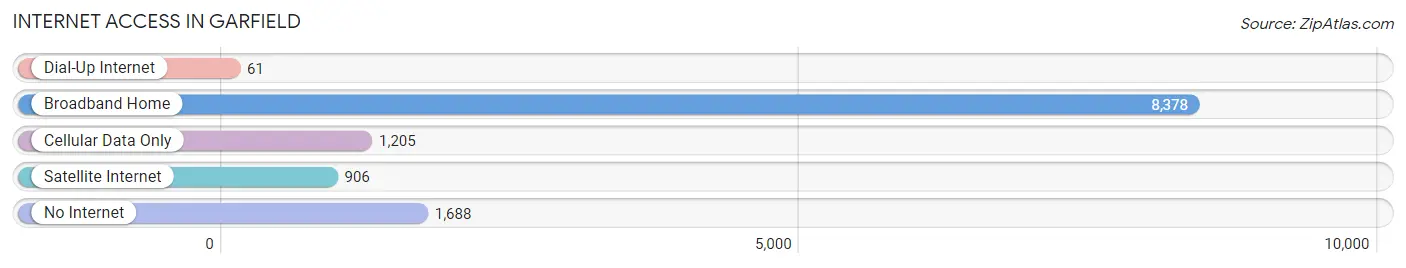
| Internet Type | # Households | % Households |
| Dial-Up Internet | 61 | 0.5% |
| Broadband Home | 8,378 | 72.6% |
| Cellular Data Only | 1,205 | 10.4% |
| Satellite Internet | 906 | 7.9% |
| No Internet | 1,688 | 14.6% |
| Total | 11,544 | 100.0% |
Garfield Summary
Garfield, NJ is a city located in Bergen County, New Jersey. It is situated approximately 15 miles northwest of New York City and is part of the New York metropolitan area. The city has a population of approximately 30,000 people and is known for its diverse population and vibrant culture.
Geography
Garfield is located in the northern part of Bergen County, New Jersey. It is situated on the Passaic River, which forms the border between Bergen and Passaic counties. The city is bordered by the towns of Elmwood Park, Saddle Brook, and Lodi. The city is approximately 5.5 square miles in size and is located at an elevation of approximately 50 feet above sea level.
Climate
Garfield has a humid subtropical climate, with hot and humid summers and cold winters. The average temperature in the summer is around 80 degrees Fahrenheit, while the average temperature in the winter is around 30 degrees Fahrenheit. The city receives an average of 44 inches of precipitation per year, with the majority of it falling in the summer months.
Demographics
As of the 2010 census, Garfield had a population of 30,487 people. The racial makeup of the city was 64.3% White, 4.3% African American, 0.4% Native American, 15.2% Asian, 0.1% Pacific Islander, and 15.7% from other races. Hispanic or Latino of any race were 37.2% of the population.
Economy
Garfield is home to a variety of businesses, including manufacturing, retail, and service industries. The city is also home to a number of corporate headquarters, including the headquarters of the United Parcel Service (UPS). The city is also home to a number of small businesses, including restaurants, bars, and shops.
The city is served by the Garfield Public School District, which consists of seven elementary schools, two middle schools, and one high school. The district also operates a number of special education programs.
Garfield is also home to a number of parks and recreational facilities, including the Garfield Park, which is the largest park in the city. The park features a variety of activities, including tennis courts, basketball courts, and a playground. The city also has a number of public libraries, including the Garfield Public Library.
Garfield is served by a number of major highways, including Interstate 80, the Garden State Parkway, and the New Jersey Turnpike. The city is also served by a number of public transportation options, including bus and rail service.
Conclusion
Garfield, NJ is a vibrant city located in Bergen County, New Jersey. It is situated approximately 15 miles northwest of New York City and is part of the New York metropolitan area. The city has a population of approximately 30,000 people and is known for its diverse population and vibrant culture. The city is home to a variety of businesses, including manufacturing, retail, and service industries. The city is also home to a number of parks and recreational facilities, including the Garfield Park, which is the largest park in the city. The city is served by a number of major highways, including Interstate 80, the Garden State Parkway, and the New Jersey Turnpike. The city is also served by a number of public transportation options, including bus and rail service.
Common Questions
What is Per Capita Income in Garfield?
Per Capita income in Garfield is $34,418.
What is the Median Family Income in Garfield?
Median Family Income in Garfield is $76,761.
What is the Median Household income in Garfield?
Median Household Income in Garfield is $72,026.
What is Income or Wage Gap in Garfield?
Income or Wage Gap in Garfield is 30.9%.
Women in Garfield earn 69.1 cents for every dollar earned by a man.
What is Family Income Deficit in Garfield?
Family Income Deficit in Garfield is $10,228.
Families that are below poverty line in Garfield earn $10,228 less on average than the poverty threshold level.
What is Inequality or Gini Index in Garfield?
Inequality or Gini Index in Garfield is 0.45.
What is the Total Population of Garfield?
Total Population of Garfield is 32,472.
What is the Total Male Population of Garfield?
Total Male Population of Garfield is 16,310.
What is the Total Female Population of Garfield?
Total Female Population of Garfield is 16,162.
What is the Ratio of Males per 100 Females in Garfield?
There are 100.92 Males per 100 Females in Garfield.
What is the Ratio of Females per 100 Males in Garfield?
There are 99.09 Females per 100 Males in Garfield.
What is the Median Population Age in Garfield?
Median Population Age in Garfield is 38.4 Years.
What is the Average Family Size in Garfield
Average Family Size in Garfield is 3.2 People.
What is the Average Household Size in Garfield
Average Household Size in Garfield is 2.8 People.
How Large is the Labor Force in Garfield?
There are 17,527 People in the Labor Forcein in Garfield.
What is the Percentage of People in the Labor Force in Garfield?
65.6% of People are in the Labor Force in Garfield.
What is the Unemployment Rate in Garfield?
Unemployment Rate in Garfield is 4.7%.