Cities with the Highest Percentage of Hispanic or Latino Population in Illinois
RELATED REPORTS & OPTIONS
Hispanic or Latino
Illinois
Compare Cities
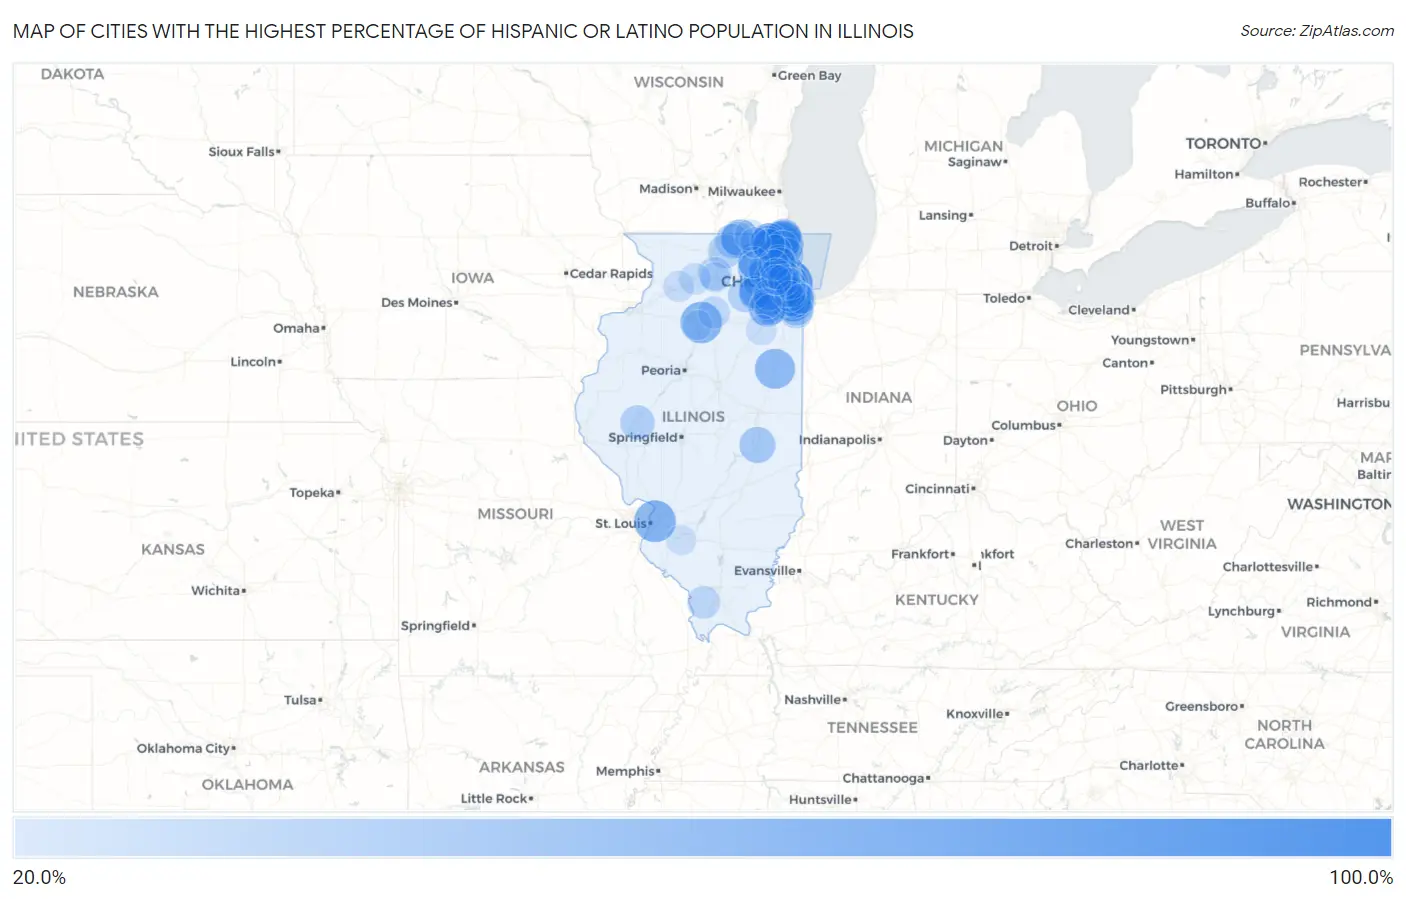
Map of Cities with the Highest Percentage of Hispanic or Latino Population in Illinois
0.0%
100.0%
Cities with the Highest Percentage of Hispanic or Latino Population in Illinois
| City | Hispanic or Latino | vs State | vs National | |
| 1. | Alden | 100.0% | 17.8%(+82.2)#1 | 18.7%(+81.3)#268 |
| 2. | Stone Park | 93.5% | 17.8%(+75.6)#2 | 18.7%(+74.8)#698 |
| 3. | Cicero | 87.9% | 17.8%(+70.0)#3 | 18.7%(+69.2)#835 |
| 4. | Harding | 85.5% | 17.8%(+67.6)#4 | 18.7%(+66.8)#883 |
| 5. | Melrose Park | 79.0% | 17.8%(+61.1)#5 | 18.7%(+60.3)#1,031 |
| 6. | Park City | 74.7% | 17.8%(+56.8)#6 | 18.7%(+56.0)#1,133 |
| 7. | Summit | 73.9% | 17.8%(+56.1)#7 | 18.7%(+55.3)#1,154 |
| 8. | Stickney | 71.2% | 17.8%(+53.3)#8 | 18.7%(+52.5)#1,224 |
| 9. | Posen | 69.6% | 17.8%(+51.8)#9 | 18.7%(+51.0)#1,265 |
| 10. | Ridgewood | 69.1% | 17.8%(+51.3)#10 | 18.7%(+50.4)#1,279 |
| 11. | Fairmont City | 65.4% | 17.8%(+47.5)#11 | 18.7%(+46.7)#1,394 |
| 12. | De Pue | 63.9% | 17.8%(+46.1)#12 | 18.7%(+45.3)#1,438 |
| 13. | Kings | 62.0% | 17.8%(+44.1)#13 | 18.7%(+43.3)#1,492 |
| 14. | Berwyn | 61.0% | 17.8%(+43.2)#14 | 18.7%(+42.4)#1,523 |
| 15. | Northlake | 60.8% | 17.8%(+43.0)#15 | 18.7%(+42.2)#1,531 |
| 16. | Onarga | 58.8% | 17.8%(+40.9)#16 | 18.7%(+40.1)#1,598 |
| 17. | Franklin Park | 58.3% | 17.8%(+40.4)#17 | 18.7%(+39.6)#1,618 |
| 18. | Dixmoor | 57.5% | 17.8%(+39.7)#18 | 18.7%(+38.9)#1,639 |
| 19. | Serena | 54.9% | 17.8%(+37.0)#19 | 18.7%(+36.2)#1,738 |
| 20. | Lyons | 54.7% | 17.8%(+36.9)#20 | 18.7%(+36.1)#1,747 |
| 21. | Carpentersville | 54.4% | 17.8%(+36.5)#21 | 18.7%(+35.7)#1,761 |
| 22. | Harvard | 53.5% | 17.8%(+35.6)#22 | 18.7%(+34.8)#1,809 |
| 23. | Waukegan | 52.6% | 17.8%(+34.8)#23 | 18.7%(+34.0)#1,847 |
| 24. | Round Lake Beach | 52.6% | 17.8%(+34.7)#24 | 18.7%(+33.9)#1,850 |
| 25. | Forest View | 49.4% | 17.8%(+31.6)#25 | 18.7%(+30.8)#1,981 |
| 26. | West Chicago | 48.5% | 17.8%(+30.6)#26 | 18.7%(+29.8)#2,037 |
| 27. | Round Lake Park | 47.6% | 17.8%(+29.7)#27 | 18.7%(+28.9)#2,082 |
| 28. | Burbank | 47.5% | 17.8%(+29.7)#28 | 18.7%(+28.9)#2,086 |
| 29. | Elgin | 47.3% | 17.8%(+29.5)#29 | 18.7%(+28.7)#2,099 |
| 30. | Bensenville | 47.0% | 17.8%(+29.1)#30 | 18.7%(+28.3)#2,111 |
| 31. | Berkeley | 46.7% | 17.8%(+28.8)#31 | 18.7%(+28.0)#2,128 |
| 32. | Beach Park | 46.3% | 17.8%(+28.5)#32 | 18.7%(+27.7)#2,141 |
| 33. | Rosemont | 45.8% | 17.8%(+28.0)#33 | 18.7%(+27.2)#2,168 |
| 34. | Hodgkins | 45.4% | 17.8%(+27.6)#34 | 18.7%(+26.7)#2,186 |
| 35. | Shirley | 45.2% | 17.8%(+27.3)#35 | 18.7%(+26.5)#2,199 |
| 36. | Mccook | 44.8% | 17.8%(+27.0)#36 | 18.7%(+26.2)#2,218 |
| 37. | Blue Island | 44.8% | 17.8%(+26.9)#37 | 18.7%(+26.1)#2,221 |
| 38. | Arcola | 44.8% | 17.8%(+26.9)#38 | 18.7%(+26.1)#2,222 |
| 39. | Round Lake Heights | 44.5% | 17.8%(+26.7)#39 | 18.7%(+25.9)#2,238 |
| 40. | Rockdale | 44.1% | 17.8%(+26.2)#40 | 18.7%(+25.4)#2,267 |
| 41. | Aurora | 42.3% | 17.8%(+24.5)#41 | 18.7%(+23.7)#2,371 |
| 42. | Addison | 40.9% | 17.8%(+23.1)#42 | 18.7%(+22.2)#2,449 |
| 43. | Bedford Park | 40.9% | 17.8%(+23.0)#43 | 18.7%(+22.2)#2,452 |
| 44. | Zion | 40.7% | 17.8%(+22.8)#44 | 18.7%(+22.0)#2,469 |
| 45. | Boulder Hill | 38.7% | 17.8%(+20.9)#45 | 18.7%(+20.1)#2,588 |
| 46. | Highwood | 38.7% | 17.8%(+20.8)#46 | 18.7%(+20.0)#2,596 |
| 47. | Beardstown | 38.6% | 17.8%(+20.7)#47 | 18.7%(+19.9)#2,604 |
| 48. | Hanover Park | 38.5% | 17.8%(+20.7)#48 | 18.7%(+19.9)#2,609 |
| 49. | Capron | 38.4% | 17.8%(+20.6)#49 | 18.7%(+19.8)#2,615 |
| 50. | South Chicago Heights | 37.8% | 17.8%(+19.9)#50 | 18.7%(+19.1)#2,666 |
| 51. | Plano | 37.8% | 17.8%(+19.9)#51 | 18.7%(+19.1)#2,667 |
| 52. | Belvidere | 37.0% | 17.8%(+19.2)#52 | 18.7%(+18.3)#2,712 |
| 53. | Chicago Heights | 36.6% | 17.8%(+18.8)#53 | 18.7%(+18.0)#2,747 |
| 54. | Long Lake | 36.5% | 17.8%(+18.6)#54 | 18.7%(+17.8)#2,760 |
| 55. | Streamwood | 36.3% | 17.8%(+18.4)#55 | 18.7%(+17.6)#2,780 |
| 56. | Fairmont | 36.2% | 17.8%(+18.4)#56 | 18.7%(+17.6)#2,785 |
| 57. | Chemung | 36.0% | 17.8%(+18.2)#57 | 18.7%(+17.4)#2,808 |
| 58. | North Chicago | 35.9% | 17.8%(+18.1)#58 | 18.7%(+17.3)#2,812 |
| 59. | Hillcrest | 35.2% | 17.8%(+17.4)#59 | 18.7%(+16.6)#2,871 |
| 60. | Romeoville | 35.2% | 17.8%(+17.4)#60 | 18.7%(+16.5)#2,873 |
| 61. | River Grove | 34.6% | 17.8%(+16.8)#61 | 18.7%(+15.9)#2,924 |
| 62. | Elmwood Park | 34.5% | 17.8%(+16.6)#62 | 18.7%(+15.8)#2,935 |
| 63. | Ingalls Park | 34.1% | 17.8%(+16.3)#63 | 18.7%(+15.5)#2,967 |
| 64. | Midlothian | 33.9% | 17.8%(+16.0)#64 | 18.7%(+15.2)#2,995 |
| 65. | Joliet | 33.5% | 17.8%(+15.7)#65 | 18.7%(+14.9)#3,015 |
| 66. | Mundelein | 33.4% | 17.8%(+15.5)#66 | 18.7%(+14.7)#3,028 |
| 67. | Glendale Heights | 33.3% | 17.8%(+15.5)#67 | 18.7%(+14.7)#3,044 |
| 68. | Cobden | 32.9% | 17.8%(+15.1)#68 | 18.7%(+14.3)#3,076 |
| 69. | Harvey | 32.7% | 17.8%(+14.8)#69 | 18.7%(+14.0)#3,096 |
| 70. | Schiller Park | 32.6% | 17.8%(+14.7)#70 | 18.7%(+13.9)#3,109 |
| 71. | Montgomery | 32.3% | 17.8%(+14.4)#71 | 18.7%(+13.6)#3,140 |
| 72. | Bridgeview | 32.0% | 17.8%(+14.2)#72 | 18.7%(+13.4)#3,168 |
| 73. | Riverside | 32.0% | 17.8%(+14.2)#73 | 18.7%(+13.3)#3,170 |
| 74. | Wheeling | 31.8% | 17.8%(+14.0)#74 | 18.7%(+13.2)#3,189 |
| 75. | Hometown | 31.8% | 17.8%(+14.0)#75 | 18.7%(+13.2)#3,190 |
| 76. | Prospect Heights | 31.8% | 17.8%(+13.9)#76 | 18.7%(+13.1)#3,195 |
| 77. | Hillside | 31.1% | 17.8%(+13.3)#77 | 18.7%(+12.5)#3,269 |
| 78. | Ritchie | 30.5% | 17.8%(+12.7)#78 | 18.7%(+11.9)#3,339 |
| 79. | Maywood | 30.5% | 17.8%(+12.7)#79 | 18.7%(+11.8)#3,342 |
| 80. | Troy Grove | 30.5% | 17.8%(+12.6)#80 | 18.7%(+11.8)#3,344 |
| 81. | Round Lake | 30.1% | 17.8%(+12.3)#81 | 18.7%(+11.4)#3,382 |
| 82. | Chicago | 29.0% | 17.8%(+11.1)#82 | 18.7%(+10.3)#3,513 |
| 83. | Gilberts | 28.8% | 17.8%(+11.0)#83 | 18.7%(+10.2)#3,526 |
| 84. | Grand Detour | 28.5% | 17.8%(+10.6)#84 | 18.7%(+9.82)#3,566 |
| 85. | Bolingbrook | 27.2% | 17.8%(+9.34)#85 | 18.7%(+8.52)#3,739 |
| 86. | Preston Heights | 26.9% | 17.8%(+9.08)#86 | 18.7%(+8.26)#3,777 |
| 87. | Hebron | 26.7% | 17.8%(+8.88)#87 | 18.7%(+8.07)#3,804 |
| 88. | Rolling Meadows | 26.7% | 17.8%(+8.82)#88 | 18.7%(+8.01)#3,811 |
| 89. | Wood Dale | 26.6% | 17.8%(+8.80)#89 | 18.7%(+7.99)#3,813 |
| 90. | Sterling | 26.6% | 17.8%(+8.79)#90 | 18.7%(+7.98)#3,815 |
| 91. | Alsip | 25.8% | 17.8%(+8.00)#91 | 18.7%(+7.19)#3,909 |
| 92. | Crystal Lawns | 25.6% | 17.8%(+7.76)#92 | 18.7%(+6.94)#3,940 |
| 93. | Braceville | 25.5% | 17.8%(+7.67)#93 | 18.7%(+6.86)#3,956 |
| 94. | Wonder Lake | 25.5% | 17.8%(+7.65)#94 | 18.7%(+6.84)#3,959 |
| 95. | Villa Park | 24.7% | 17.8%(+6.90)#95 | 18.7%(+6.08)#4,050 |
| 96. | Venedy | 24.1% | 17.8%(+6.22)#96 | 18.7%(+5.41)#4,179 |
| 97. | Rochelle | 23.8% | 17.8%(+5.99)#97 | 18.7%(+5.18)#4,217 |
| 98. | Sunnyland | 23.8% | 17.8%(+5.99)#98 | 18.7%(+5.18)#4,219 |
| 99. | Bureau Junction | 23.8% | 17.8%(+5.95)#99 | 18.7%(+5.14)#4,225 |
| 100. | Burnham | 23.8% | 17.8%(+5.95)#100 | 18.7%(+5.13)#4,226 |
Common Questions
What are the Top 10 Cities with the Highest Percentage of Hispanic or Latino Population in Illinois?
Top 10 Cities with the Highest Percentage of Hispanic or Latino Population in Illinois are:
#1
93.5%
#2
87.9%
#3
79.0%
#4
74.7%
#5
73.9%
#6
71.2%
#7
69.6%
#8
65.4%
#9
63.9%
#10
61.0%
What city has the Highest Percentage of Hispanic or Latino Population in Illinois?
Stone Park has the Highest Percentage of Hispanic or Latino Population in Illinois with 93.5%.
What is the Percentage of Hispanic or Latino Population in the State of Illinois?
Percentage of Hispanic or Latino Population in Illinois is 17.8%.
What is the Percentage of Hispanic or Latino Population in the United States?
Percentage of Hispanic or Latino Population in the United States is 18.7%.