Zip Codes with the Highest Percentage of Hispanic or Latino Population in Paterson, NJ
RELATED REPORTS & OPTIONS
Hispanic or Latino
Paterson
Compare Zip Codes
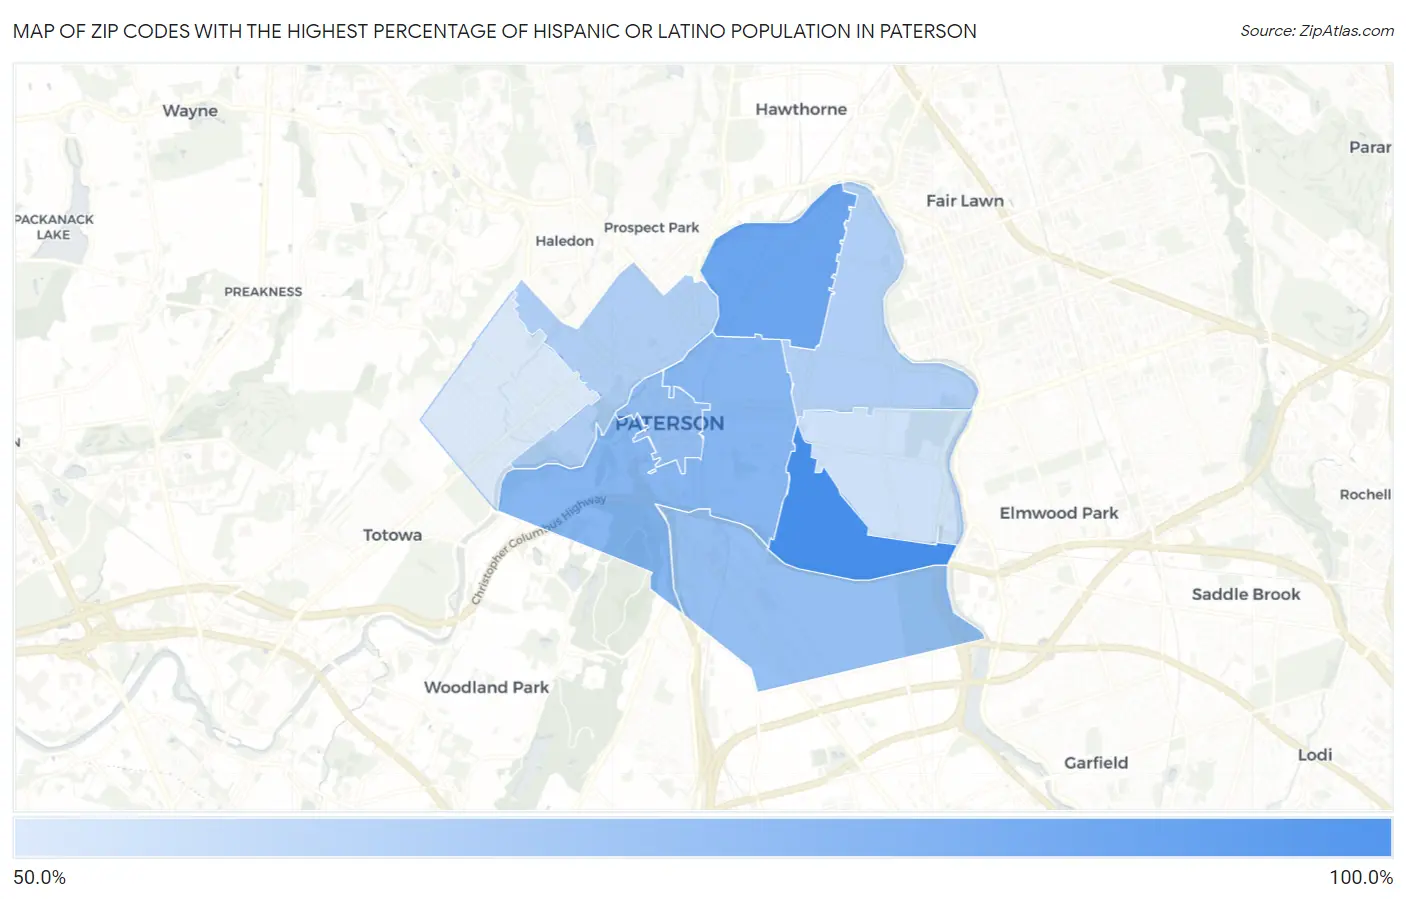
Map of Zip Codes with the Highest Percentage of Hispanic or Latino Population in Paterson
50.8%
80.4%
Zip Codes with the Highest Percentage of Hispanic or Latino Population in Paterson, NJ
| Zip Code | Hispanic or Latino | vs State | vs National | |
| 1. | 07513 | 80.4% | 21.2%(+59.2)#3 | 18.7%(+61.8)#536 |
| 2. | 07524 | 72.5% | 21.2%(+51.3)#8 | 18.7%(+53.9)#719 |
| 3. | 07501 | 67.2% | 21.2%(+46.0)#13 | 18.7%(+48.5)#880 |
| 4. | 07505 | 64.8% | 21.2%(+43.6)#15 | 18.7%(+46.2)#950 |
| 5. | 07503 | 64.1% | 21.2%(+42.9)#16 | 18.7%(+45.5)#968 |
| 6. | 07522 | 59.1% | 21.2%(+37.8)#23 | 18.7%(+40.4)#1,143 |
| 7. | 07514 | 58.9% | 21.2%(+37.7)#24 | 18.7%(+40.3)#1,150 |
| 8. | 07504 | 53.5% | 21.2%(+32.3)#32 | 18.7%(+34.8)#1,375 |
| 9. | 07502 | 50.8% | 21.2%(+29.5)#36 | 18.7%(+32.1)#1,495 |
1
Common Questions
What are the Top 5 Zip Codes with the Highest Percentage of Hispanic or Latino Population in Paterson, NJ?
Top 5 Zip Codes with the Highest Percentage of Hispanic or Latino Population in Paterson, NJ are:
What zip code has the Highest Percentage of Hispanic or Latino Population in Paterson, NJ?
07513 has the Highest Percentage of Hispanic or Latino Population in Paterson, NJ with 80.4%.
What is the Percentage of Hispanic or Latino Population in Paterson, NJ?
Percentage of Hispanic or Latino Population in Paterson is 63.1%.
What is the Percentage of Hispanic or Latino Population in New Jersey?
Percentage of Hispanic or Latino Population in New Jersey is 21.2%.
What is the Percentage of Hispanic or Latino Population in the United States?
Percentage of Hispanic or Latino Population in the United States is 18.7%.