South River borough, NJ Map & Demographics
South River borough Overview
$40,055
PER CAPITA INCOME
$104,092
AVG FAMILY INCOME
$95,981
AVG HOUSEHOLD INCOME
43.9%
WAGE / INCOME GAP [ % ]
56.1¢/ $1
WAGE / INCOME GAP [ $ ]
0.41
INEQUALITY / GINI INDEX
16,081
TOTAL POPULATION
8,126
MALE POPULATION
7,955
FEMALE POPULATION
102.15
MALES / 100 FEMALES
97.90
FEMALES / 100 MALES
37.1
MEDIAN AGE
3.3
AVG FAMILY SIZE
2.9
AVG HOUSEHOLD SIZE
8,780
LABOR FORCE [ PEOPLE ]
68.9%
PERCENT IN LABOR FORCE
10.3%
UNEMPLOYMENT RATE
Income in South River borough
Income Overview in South River borough
Per Capita Income in South River borough is $40,055, while median incomes of families and households are $104,092 and $95,981 respectively.
| Characteristic | Number | Measure |
| Per Capita Income | 16,081 | $40,055 |
| Median Family Income | 4,061 | $104,092 |
| Mean Family Income | 4,061 | $120,525 |
| Median Household Income | 5,555 | $95,981 |
| Mean Household Income | 5,555 | $114,857 |
| Income Deficit | 4,061 | $0 |
| Wage / Income Gap (%) | 16,081 | 43.86% |
| Wage / Income Gap ($) | 16,081 | 56.14¢ per $1 |
| Gini / Inequality Index | 16,081 | 0.41 |
Earnings by Sex in South River borough
Average Earnings in South River borough are $49,449, $60,114 for men and $33,750 for women, a difference of 43.9%.
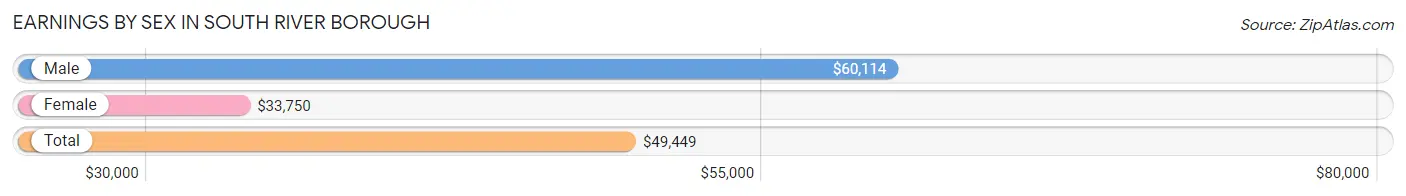
| Sex | Number | Average Earnings |
| Male | 4,911 (57.5%) | $60,114 |
| Female | 3,631 (42.5%) | $33,750 |
| Total | 8,542 (100.0%) | $49,449 |
Earnings by Sex by Income Bracket in South River borough
The most common earnings brackets in South River borough are $100,000+ for men (850 | 17.3%) and $30,000 to $34,999 for women (402 | 11.1%).
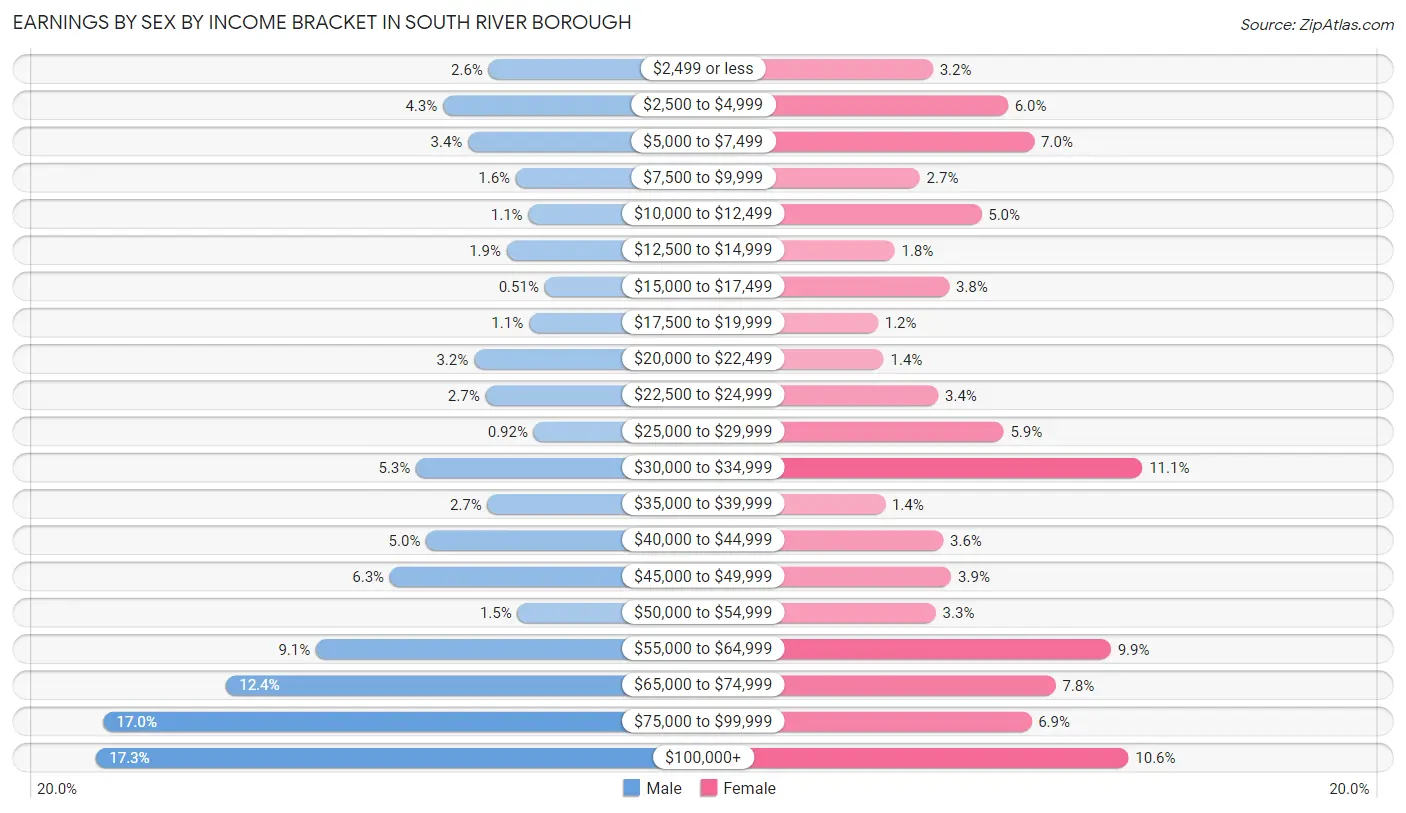
| Income | Male | Female |
| $2,499 or less | 128 (2.6%) | 117 (3.2%) |
| $2,500 to $4,999 | 212 (4.3%) | 219 (6.0%) |
| $5,000 to $7,499 | 166 (3.4%) | 255 (7.0%) |
| $7,500 to $9,999 | 78 (1.6%) | 99 (2.7%) |
| $10,000 to $12,499 | 55 (1.1%) | 183 (5.0%) |
| $12,500 to $14,999 | 95 (1.9%) | 65 (1.8%) |
| $15,000 to $17,499 | 25 (0.5%) | 139 (3.8%) |
| $17,500 to $19,999 | 54 (1.1%) | 42 (1.2%) |
| $20,000 to $22,499 | 155 (3.2%) | 50 (1.4%) |
| $22,500 to $24,999 | 134 (2.7%) | 124 (3.4%) |
| $25,000 to $29,999 | 45 (0.9%) | 213 (5.9%) |
| $30,000 to $34,999 | 262 (5.3%) | 402 (11.1%) |
| $35,000 to $39,999 | 130 (2.6%) | 52 (1.4%) |
| $40,000 to $44,999 | 243 (5.0%) | 131 (3.6%) |
| $45,000 to $49,999 | 310 (6.3%) | 142 (3.9%) |
| $50,000 to $54,999 | 75 (1.5%) | 121 (3.3%) |
| $55,000 to $64,999 | 446 (9.1%) | 359 (9.9%) |
| $65,000 to $74,999 | 611 (12.4%) | 284 (7.8%) |
| $75,000 to $99,999 | 837 (17.0%) | 251 (6.9%) |
| $100,000+ | 850 (17.3%) | 383 (10.5%) |
| Total | 4,911 (100.0%) | 3,631 (100.0%) |
Earnings by Sex by Educational Attainment in South River borough
Average earnings in South River borough are $66,632 for men and $41,846 for women, a difference of 37.2%. Men with an educational attainment of graduate degree enjoy the highest average annual earnings of $86,103, while those with high school diploma education earn the least with $57,176. Women with an educational attainment of graduate degree earn the most with the average annual earnings of $71,016, while those with less than high school education have the smallest earnings of $30,069.
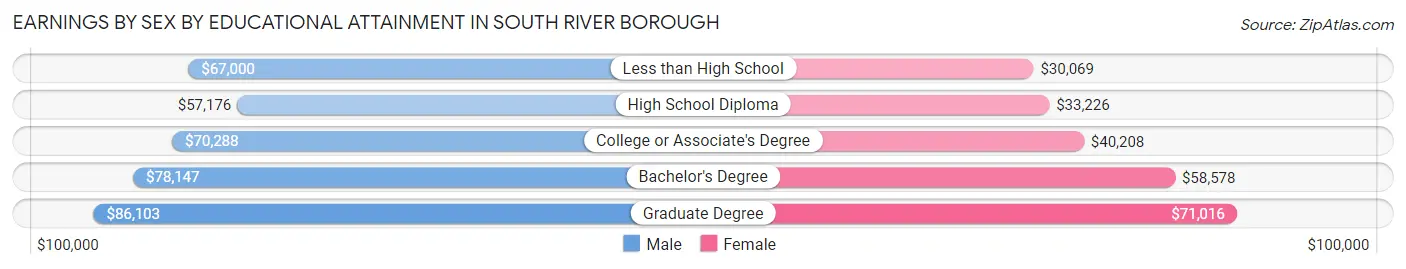
| Educational Attainment | Male Income | Female Income |
| Less than High School | $67,000 | $30,069 |
| High School Diploma | $57,176 | $33,226 |
| College or Associate's Degree | $70,288 | $40,208 |
| Bachelor's Degree | $78,147 | $58,578 |
| Graduate Degree | $86,103 | $71,016 |
| Total | $66,632 | $41,846 |
Family Income in South River borough
Family Income Brackets in South River borough
According to the South River borough family income data, there are 1,044 families falling into the $100,000 to $149,999 income range, which is the most common income bracket and makes up 25.7% of all families. Conversely, the $10,000 to $14,999 income bracket is the least frequent group with only 45 families (1.1%) belonging to this category.
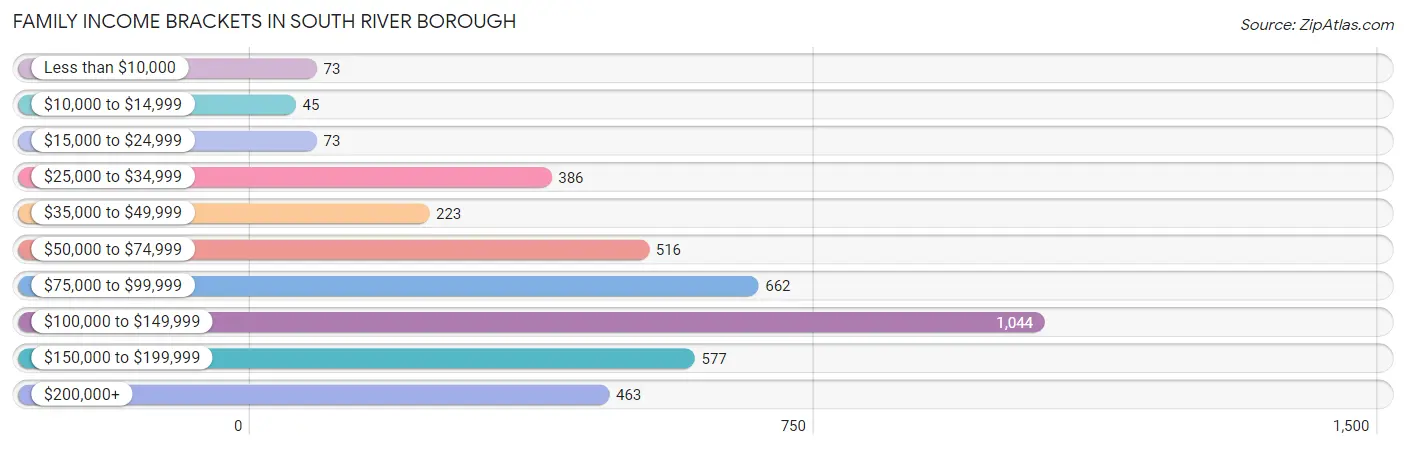
| Income Bracket | # Families | % Families |
| Less than $10,000 | 73 | 1.8% |
| $10,000 to $14,999 | 45 | 1.1% |
| $15,000 to $24,999 | 73 | 1.8% |
| $25,000 to $34,999 | 386 | 9.5% |
| $35,000 to $49,999 | 223 | 5.5% |
| $50,000 to $74,999 | 516 | 12.7% |
| $75,000 to $99,999 | 662 | 16.3% |
| $100,000 to $149,999 | 1,044 | 25.7% |
| $150,000 to $199,999 | 577 | 14.2% |
| $200,000+ | 463 | 11.4% |
Family Income by Famaliy Size in South River borough
6-person families (119 | 2.9%) account for the highest median family income in South River borough with $196,266 per family, while 2-person families (1,370 | 33.7%) have the highest median income of $44,343 per family member.
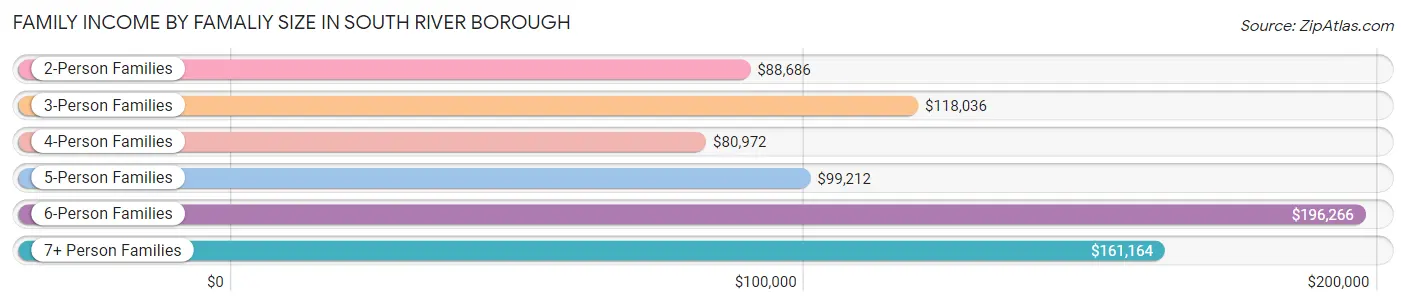
| Income Bracket | # Families | Median Income |
| 2-Person Families | 1,370 (33.7%) | $88,686 |
| 3-Person Families | 1,218 (30.0%) | $118,036 |
| 4-Person Families | 830 (20.4%) | $80,972 |
| 5-Person Families | 471 (11.6%) | $99,212 |
| 6-Person Families | 119 (2.9%) | $196,266 |
| 7+ Person Families | 53 (1.3%) | $161,164 |
| Total | 4,061 (100.0%) | $104,092 |
Family Income by Number of Earners in South River borough
The median family income in South River borough is $104,092, with families comprising 3+ earners (781) having the highest median family income of $166,844, while families with no earners (826) have the lowest median family income of $48,654, accounting for 19.2% and 20.3% of families, respectively.
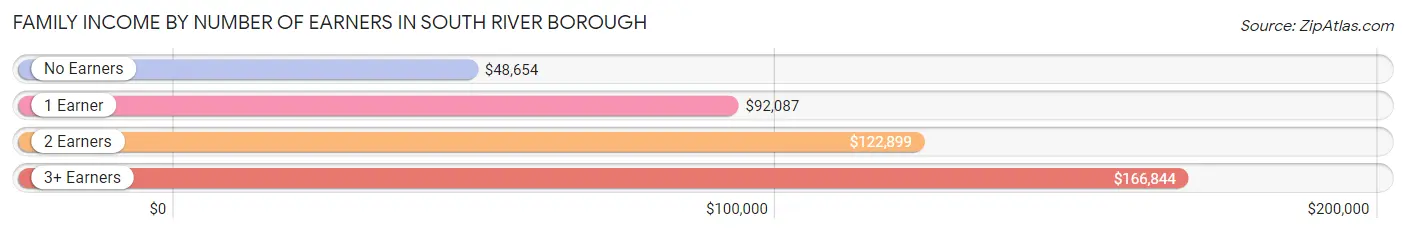
| Number of Earners | # Families | Median Income |
| No Earners | 826 (20.3%) | $48,654 |
| 1 Earner | 932 (23.0%) | $92,087 |
| 2 Earners | 1,522 (37.5%) | $122,899 |
| 3+ Earners | 781 (19.2%) | $166,844 |
| Total | 4,061 (100.0%) | $104,092 |
Household Income in South River borough
Household Income Brackets in South River borough
With 1,322 households falling in the category, the $100,000 to $149,999 income range is the most frequent in South River borough, accounting for 23.8% of all households. In contrast, only 106 households (1.9%) fall into the $10,000 to $14,999 income bracket, making it the least populous group.
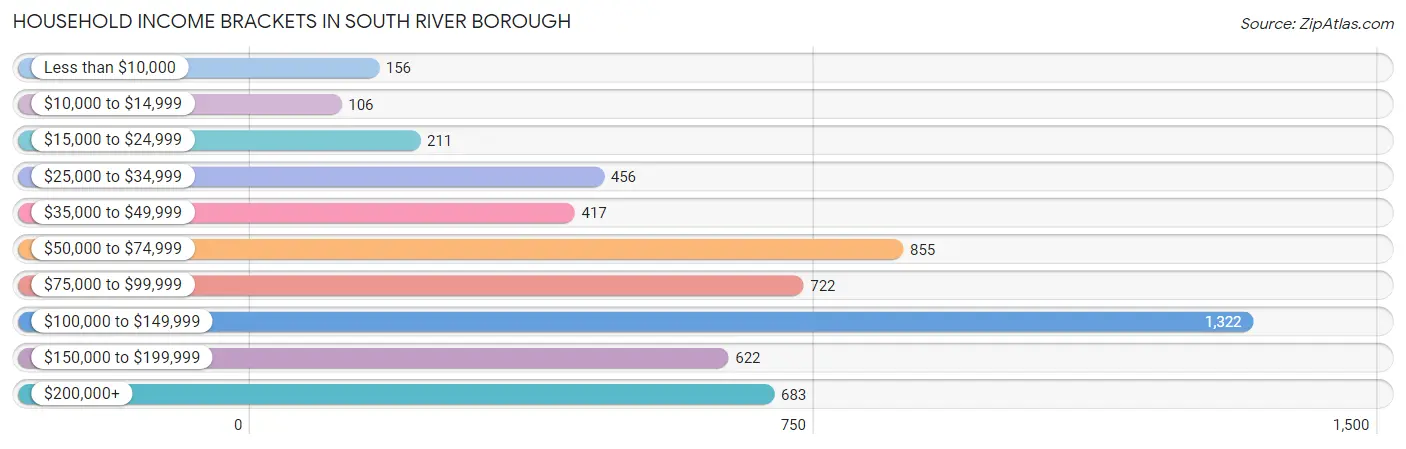
| Income Bracket | # Households | % Households |
| Less than $10,000 | 156 | 2.8% |
| $10,000 to $14,999 | 106 | 1.9% |
| $15,000 to $24,999 | 211 | 3.8% |
| $25,000 to $34,999 | 456 | 8.2% |
| $35,000 to $49,999 | 417 | 7.5% |
| $50,000 to $74,999 | 855 | 15.4% |
| $75,000 to $99,999 | 722 | 13.0% |
| $100,000 to $149,999 | 1,322 | 23.8% |
| $150,000 to $199,999 | 622 | 11.2% |
| $200,000+ | 683 | 12.3% |
Household Income by Householder Age in South River borough
The median household income in South River borough is $95,981, with the highest median household income of $105,000 found in the 45 to 64 years age bracket for the primary householder. A total of 2,224 households (40.0%) fall into this category. Meanwhile, the 15 to 24 years age bracket for the primary householder has the lowest median household income of $0, with 72 households (1.3%) in this group.
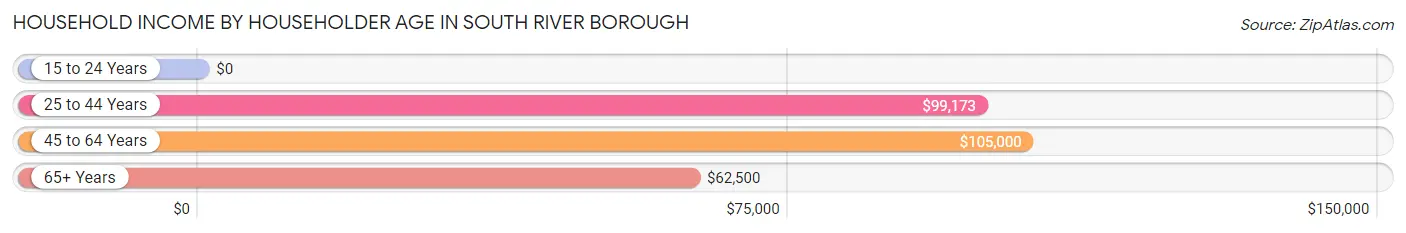
| Income Bracket | # Households | Median Income |
| 15 to 24 Years | 72 (1.3%) | $0 |
| 25 to 44 Years | 1,881 (33.9%) | $99,173 |
| 45 to 64 Years | 2,224 (40.0%) | $105,000 |
| 65+ Years | 1,378 (24.8%) | $62,500 |
| Total | 5,555 (100.0%) | $95,981 |
Poverty in South River borough
Income Below Poverty by Sex and Age in South River borough
With 13.0% poverty level for males and 11.5% for females among the residents of South River borough, 15 year old males and under 5 year old females are the most vulnerable to poverty, with 59 males (68.6%) and 186 females (28.9%) in their respective age groups living below the poverty level.
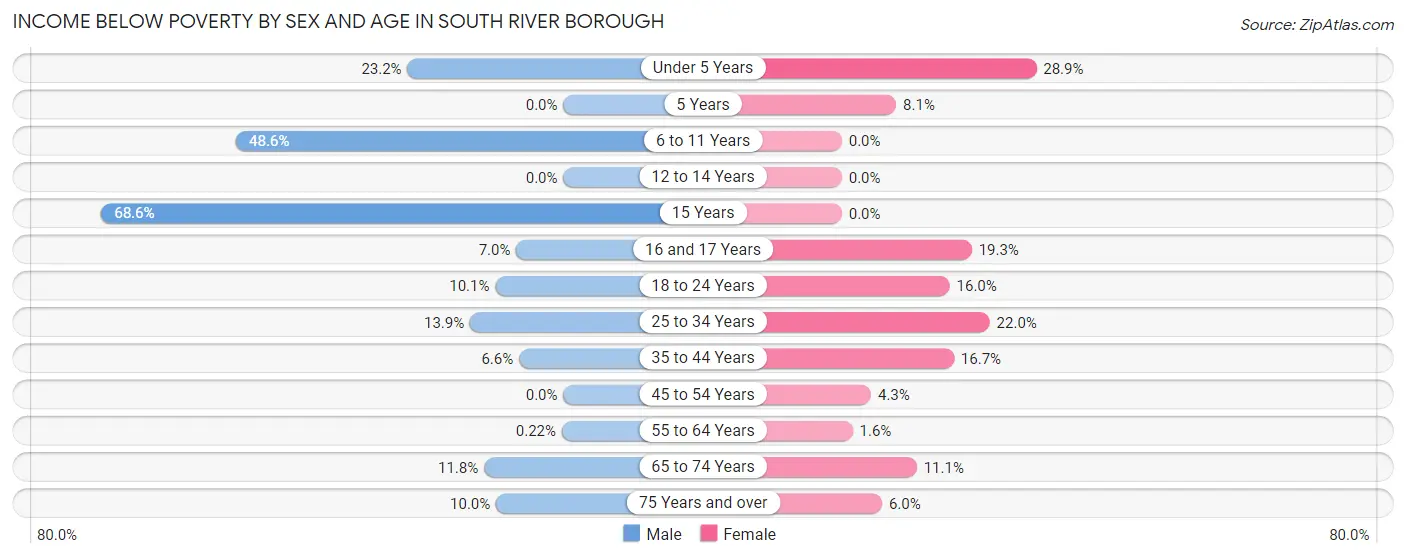
| Age Bracket | Male | Female |
| Under 5 Years | 116 (23.2%) | 186 (28.9%) |
| 5 Years | 0 (0.0%) | 13 (8.1%) |
| 6 to 11 Years | 413 (48.6%) | 0 (0.0%) |
| 12 to 14 Years | 0 (0.0%) | 0 (0.0%) |
| 15 Years | 59 (68.6%) | 0 (0.0%) |
| 16 and 17 Years | 16 (7.0%) | 54 (19.3%) |
| 18 to 24 Years | 65 (10.1%) | 65 (16.0%) |
| 25 to 34 Years | 172 (13.9%) | 237 (22.0%) |
| 35 to 44 Years | 91 (6.6%) | 191 (16.7%) |
| 45 to 54 Years | 0 (0.0%) | 40 (4.3%) |
| 55 to 64 Years | 2 (0.2%) | 20 (1.6%) |
| 65 to 74 Years | 67 (11.8%) | 70 (11.1%) |
| 75 Years and over | 44 (10.0%) | 37 (6.0%) |
| Total | 1,045 (13.0%) | 913 (11.5%) |
Income Above Poverty by Sex and Age in South River borough
According to the poverty statistics in South River borough, males aged 5 years and females aged 6 to 11 years are the age groups that are most secure financially, with 100.0% of males and 100.0% of females in these age groups living above the poverty line.
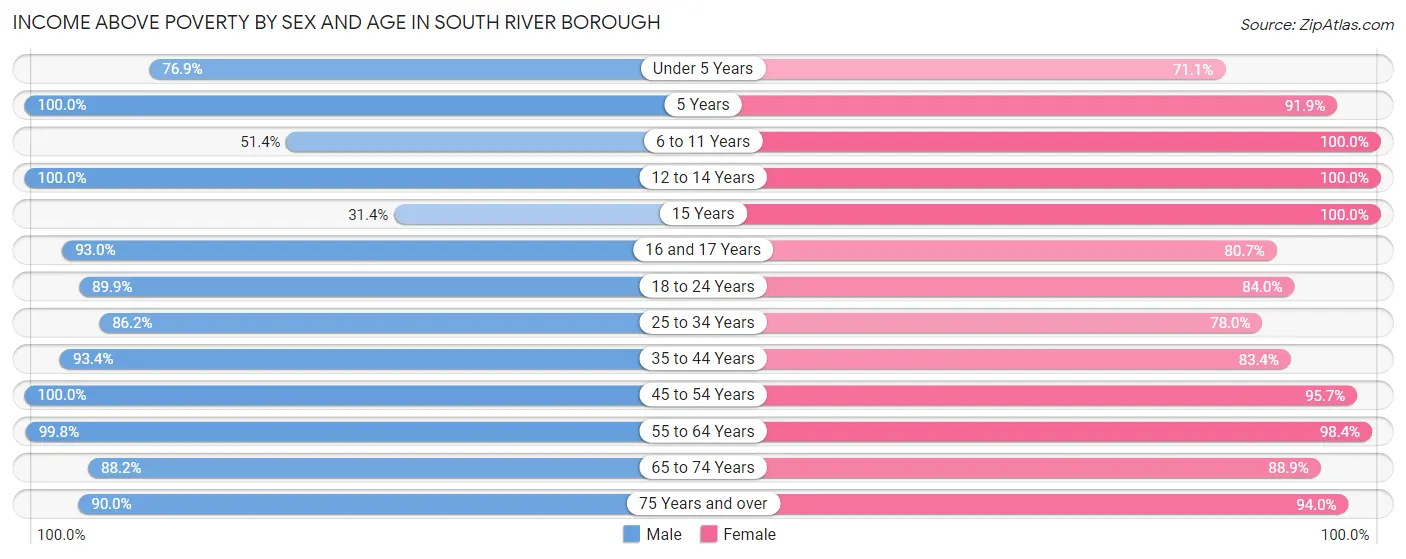
| Age Bracket | Male | Female |
| Under 5 Years | 385 (76.8%) | 458 (71.1%) |
| 5 Years | 11 (100.0%) | 148 (91.9%) |
| 6 to 11 Years | 437 (51.4%) | 665 (100.0%) |
| 12 to 14 Years | 185 (100.0%) | 90 (100.0%) |
| 15 Years | 27 (31.4%) | 60 (100.0%) |
| 16 and 17 Years | 213 (93.0%) | 226 (80.7%) |
| 18 to 24 Years | 578 (89.9%) | 341 (84.0%) |
| 25 to 34 Years | 1,070 (86.2%) | 842 (78.0%) |
| 35 to 44 Years | 1,291 (93.4%) | 956 (83.4%) |
| 45 to 54 Years | 1,007 (100.0%) | 882 (95.7%) |
| 55 to 64 Years | 893 (99.8%) | 1,231 (98.4%) |
| 65 to 74 Years | 502 (88.2%) | 559 (88.9%) |
| 75 Years and over | 397 (90.0%) | 584 (94.0%) |
| Total | 6,996 (87.0%) | 7,042 (88.5%) |
Income Below Poverty Among Married-Couple Families in South River borough
The poverty statistics for married-couple families in South River borough show that 2.7% or 76 of the total 2,825 families live below the poverty line. Families with no children have the highest poverty rate of 4.3%, comprising of 73 families. On the other hand, families with 3 or 4 children have the lowest poverty rate of 0.0%, which includes 0 families.
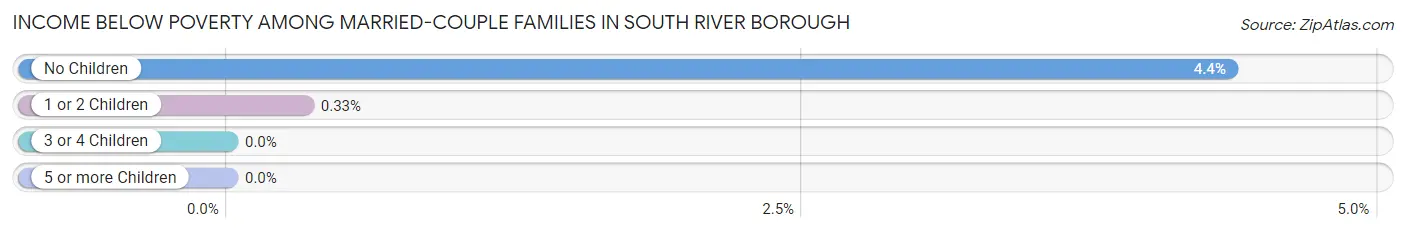
| Children | Above Poverty | Below Poverty |
| No Children | 1,606 (95.7%) | 73 (4.3%) |
| 1 or 2 Children | 910 (99.7%) | 3 (0.3%) |
| 3 or 4 Children | 204 (100.0%) | 0 (0.0%) |
| 5 or more Children | 29 (100.0%) | 0 (0.0%) |
| Total | 2,749 (97.3%) | 76 (2.7%) |
Income Below Poverty Among Single-Parent Households in South River borough
According to the poverty data in South River borough, 0.3% or 1 single-father households and 38.7% or 323 single-mother households are living below the poverty line. Among single-father households, those with no children have the highest poverty rate, with 1 households (0.5%) experiencing poverty. Likewise, among single-mother households, those with 3 or 4 children have the highest poverty rate, with 154 households (100.0%) falling below the poverty line.
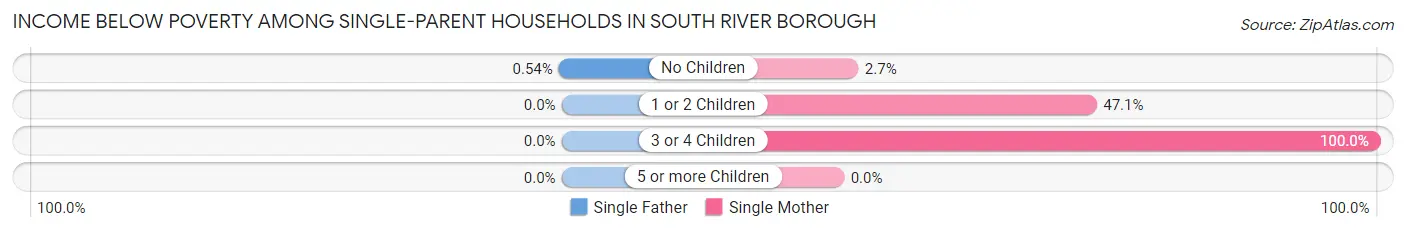
| Children | Single Father | Single Mother |
| No Children | 1 (0.5%) | 9 (2.6%) |
| 1 or 2 Children | 0 (0.0%) | 160 (47.1%) |
| 3 or 4 Children | 0 (0.0%) | 154 (100.0%) |
| 5 or more Children | 0 (0.0%) | 0 (0.0%) |
| Total | 1 (0.3%) | 323 (38.7%) |
Income Below Poverty Among Married-Couple vs Single-Parent Households in South River borough
The poverty data for South River borough shows that 76 of the married-couple family households (2.7%) and 324 of the single-parent households (26.2%) are living below the poverty level. Within the married-couple family households, those with no children have the highest poverty rate, with 73 households (4.3%) falling below the poverty line. Among the single-parent households, those with 3 or 4 children have the highest poverty rate, with 154 household (60.6%) living below poverty.
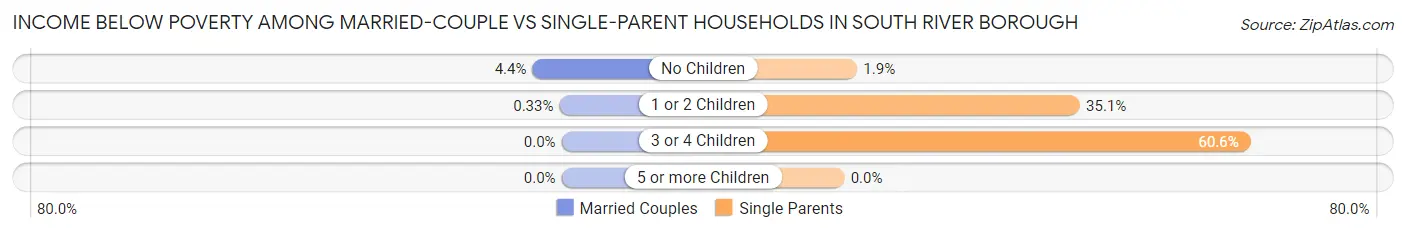
| Children | Married-Couple Families | Single-Parent Households |
| No Children | 73 (4.3%) | 10 (1.9%) |
| 1 or 2 Children | 3 (0.3%) | 160 (35.1%) |
| 3 or 4 Children | 0 (0.0%) | 154 (60.6%) |
| 5 or more Children | 0 (0.0%) | 0 (0.0%) |
| Total | 76 (2.7%) | 324 (26.2%) |
Race in South River borough
The most populous races in South River borough are White / Caucasian (10,434 | 64.9%), Hispanic or Latino (4,823 | 30.0%), and Some other Race (2,539 | 15.8%).
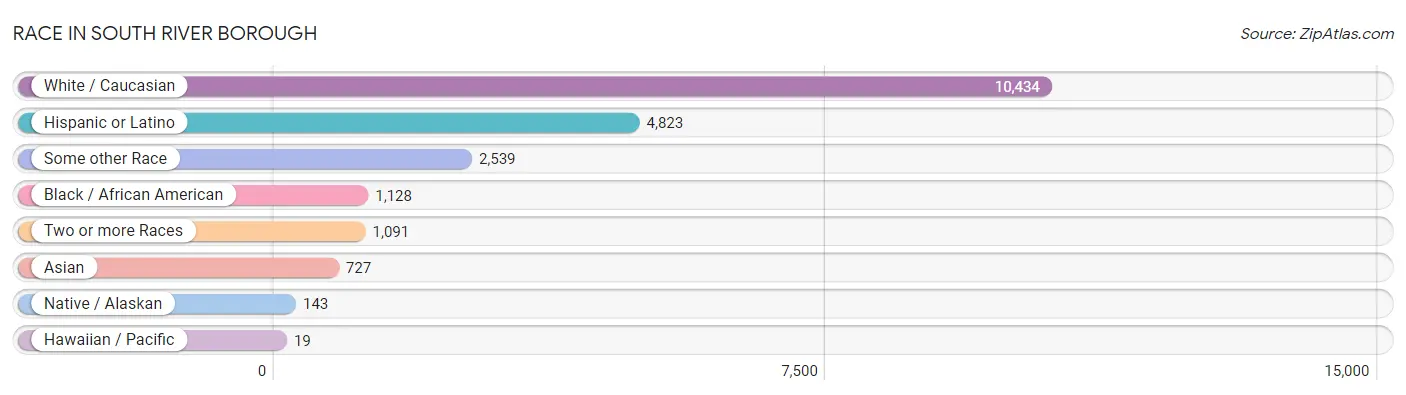
| Race | # Population | % Population |
| Asian | 727 | 4.5% |
| Black / African American | 1,128 | 7.0% |
| Hawaiian / Pacific | 19 | 0.1% |
| Hispanic or Latino | 4,823 | 30.0% |
| Native / Alaskan | 143 | 0.9% |
| White / Caucasian | 10,434 | 64.9% |
| Two or more Races | 1,091 | 6.8% |
| Some other Race | 2,539 | 15.8% |
| Total | 16,081 | 100.0% |
Ancestry in South River borough
The most populous ancestries reported in South River borough are Italian (1,931 | 12.0%), Portuguese (1,589 | 9.9%), Polish (1,560 | 9.7%), Irish (1,261 | 7.8%), and Central American (1,220 | 7.6%), together accounting for 47.0% of all South River borough residents.
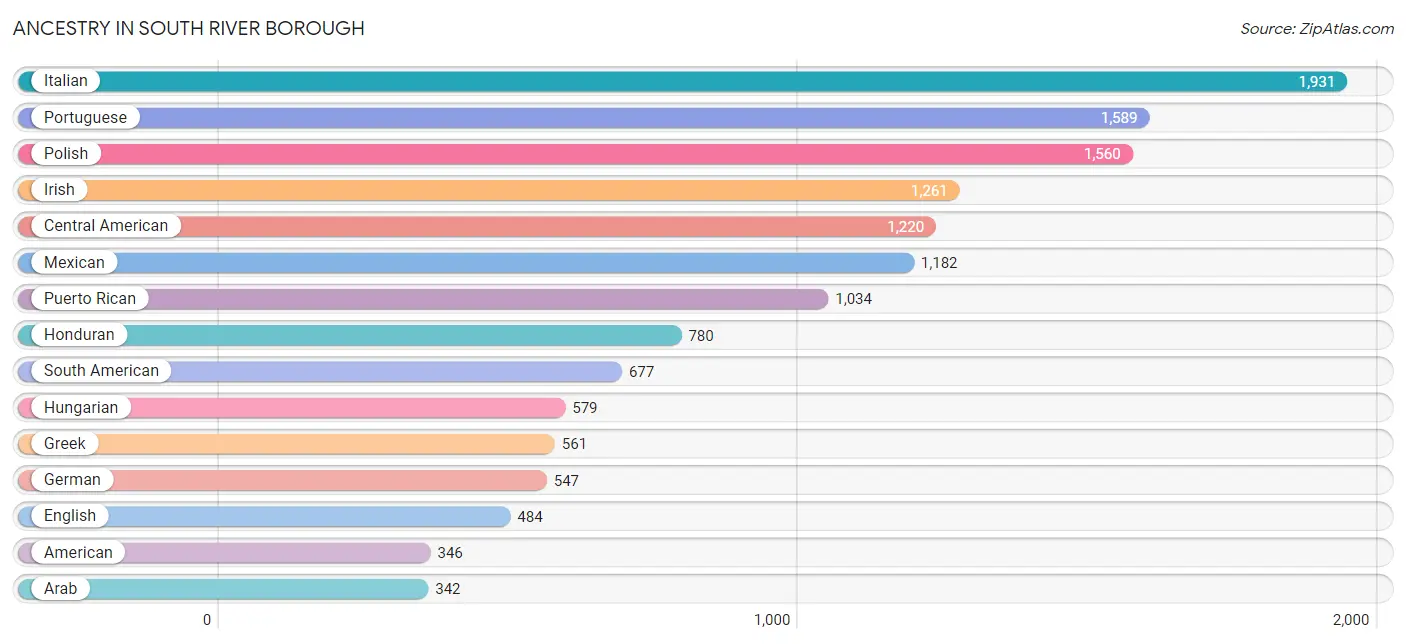
| Ancestry | # Population | % Population |
| African | 58 | 0.4% |
| American | 346 | 2.1% |
| Arab | 342 | 2.1% |
| Austrian | 79 | 0.5% |
| Bhutanese | 10 | 0.1% |
| Brazilian | 294 | 1.8% |
| Bulgarian | 27 | 0.2% |
| Canadian | 17 | 0.1% |
| Central American | 1,220 | 7.6% |
| Central American Indian | 9 | 0.1% |
| Colombian | 176 | 1.1% |
| Cuban | 86 | 0.5% |
| Czech | 10 | 0.1% |
| Czechoslovakian | 57 | 0.4% |
| Dominican | 174 | 1.1% |
| Dutch | 129 | 0.8% |
| Eastern European | 66 | 0.4% |
| Ecuadorian | 290 | 1.8% |
| Egyptian | 301 | 1.9% |
| English | 484 | 3.0% |
| European | 122 | 0.8% |
| French | 42 | 0.3% |
| German | 547 | 3.4% |
| Ghanaian | 15 | 0.1% |
| Greek | 561 | 3.5% |
| Guamanian / Chamorro | 19 | 0.1% |
| Guatemalan | 214 | 1.3% |
| Guyanese | 26 | 0.2% |
| Honduran | 780 | 4.9% |
| Hungarian | 579 | 3.6% |
| Indian (Asian) | 290 | 1.8% |
| Irish | 1,261 | 7.8% |
| Italian | 1,931 | 12.0% |
| Korean | 330 | 2.1% |
| Laotian | 21 | 0.1% |
| Lebanese | 25 | 0.2% |
| Lithuanian | 80 | 0.5% |
| Macedonian | 12 | 0.1% |
| Mexican | 1,182 | 7.3% |
| Mexican American Indian | 136 | 0.9% |
| Norwegian | 20 | 0.1% |
| Palestinian | 21 | 0.1% |
| Panamanian | 15 | 0.1% |
| Peruvian | 48 | 0.3% |
| Polish | 1,560 | 9.7% |
| Portuguese | 1,589 | 9.9% |
| Puerto Rican | 1,034 | 6.4% |
| Russian | 269 | 1.7% |
| Salvadoran | 211 | 1.3% |
| Scotch-Irish | 21 | 0.1% |
| Scottish | 44 | 0.3% |
| South American | 677 | 4.2% |
| South American Indian | 7 | 0.0% |
| Spanish | 31 | 0.2% |
| Subsaharan African | 88 | 0.5% |
| Syrian | 20 | 0.1% |
| Thai | 63 | 0.4% |
| Ukrainian | 312 | 1.9% |
| Venezuelan | 163 | 1.0% |
| Welsh | 78 | 0.5% |
| Yugoslavian | 21 | 0.1% | View All 61 Rows |
Immigrants in South River borough
The most numerous immigrant groups reported in South River borough came from Latin America (2,476 | 15.4%), Central America (1,612 | 10.0%), Europe (1,286 | 8.0%), Southern Europe (784 | 4.9%), and Mexico (739 | 4.6%), together accounting for 42.9% of all South River borough residents.
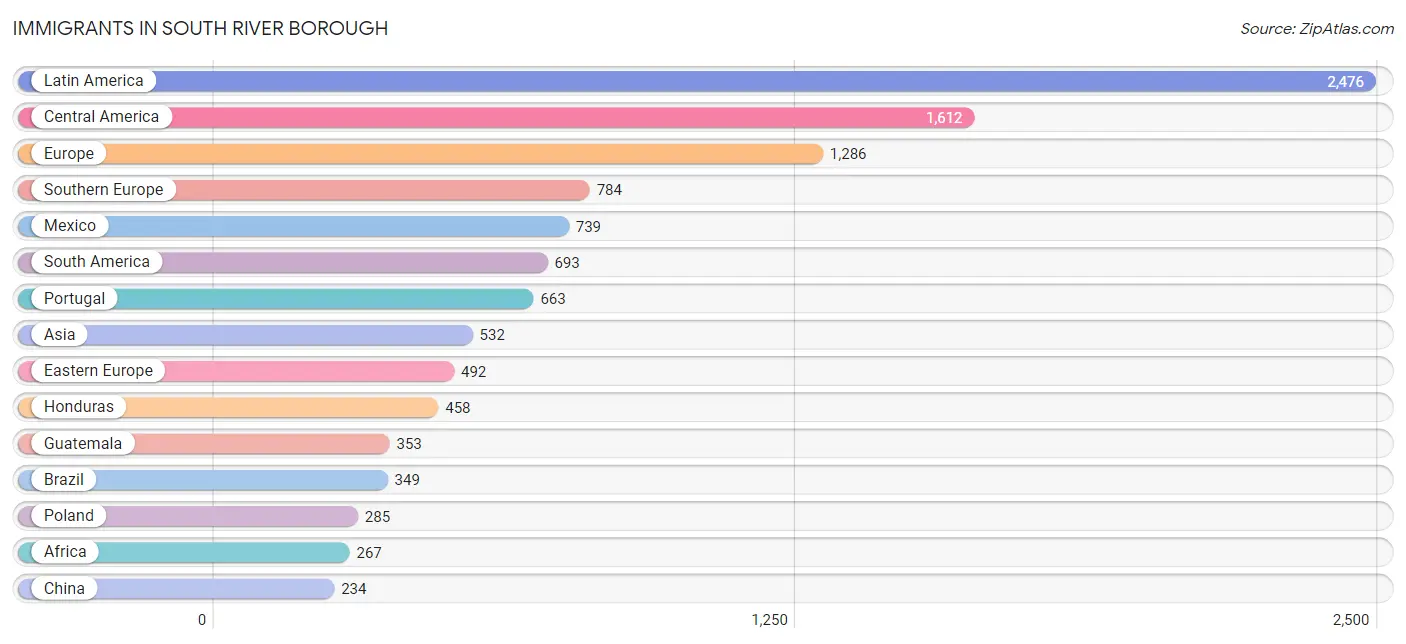
| Immigration Origin | # Population | % Population |
| Africa | 267 | 1.7% |
| Argentina | 14 | 0.1% |
| Asia | 532 | 3.3% |
| Belarus | 13 | 0.1% |
| Brazil | 349 | 2.2% |
| Bulgaria | 27 | 0.2% |
| Caribbean | 171 | 1.1% |
| Central America | 1,612 | 10.0% |
| China | 234 | 1.5% |
| Colombia | 54 | 0.3% |
| Cuba | 22 | 0.1% |
| Dominican Republic | 149 | 0.9% |
| Eastern Asia | 234 | 1.5% |
| Eastern Europe | 492 | 3.1% |
| Ecuador | 185 | 1.1% |
| Egypt | 223 | 1.4% |
| El Salvador | 62 | 0.4% |
| Europe | 1,286 | 8.0% |
| France | 10 | 0.1% |
| Ghana | 44 | 0.3% |
| Greece | 107 | 0.7% |
| Guatemala | 353 | 2.2% |
| Guyana | 43 | 0.3% |
| Honduras | 458 | 2.9% |
| Hong Kong | 17 | 0.1% |
| Hungary | 50 | 0.3% |
| India | 19 | 0.1% |
| Indonesia | 14 | 0.1% |
| Italy | 14 | 0.1% |
| Latin America | 2,476 | 15.4% |
| Mexico | 739 | 4.6% |
| Northern Africa | 223 | 1.4% |
| Pakistan | 46 | 0.3% |
| Peru | 48 | 0.3% |
| Philippines | 210 | 1.3% |
| Poland | 285 | 1.8% |
| Portugal | 663 | 4.1% |
| South America | 693 | 4.3% |
| South Central Asia | 65 | 0.4% |
| South Eastern Asia | 224 | 1.4% |
| Southern Europe | 784 | 4.9% |
| Syria | 9 | 0.1% |
| Ukraine | 117 | 0.7% |
| Western Africa | 44 | 0.3% |
| Western Asia | 9 | 0.1% |
| Western Europe | 10 | 0.1% | View All 46 Rows |
Sex and Age in South River borough
Sex and Age in South River borough
The most populous age groups in South River borough are 35 to 39 Years (905 | 11.1%) for men and 55 to 59 Years (718 | 9.0%) for women.
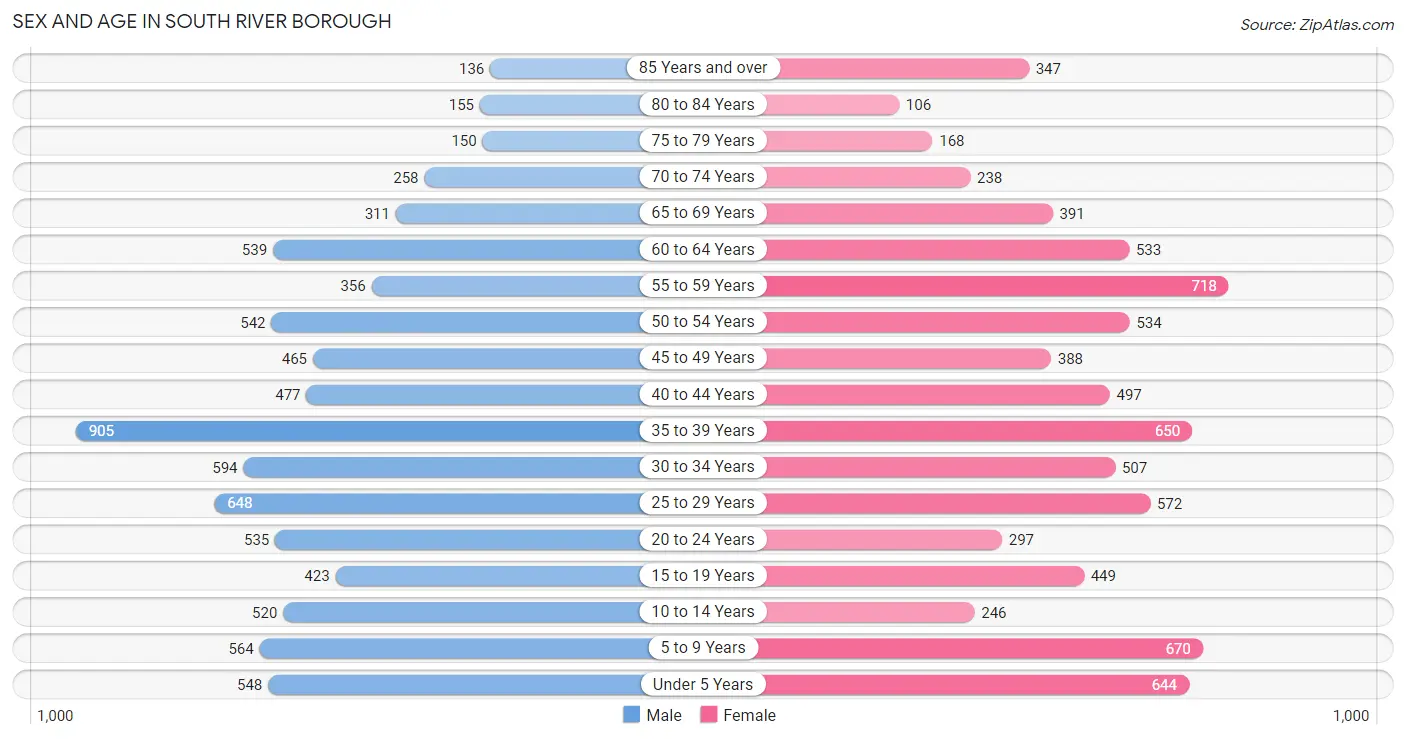
| Age Bracket | Male | Female |
| Under 5 Years | 548 (6.7%) | 644 (8.1%) |
| 5 to 9 Years | 564 (6.9%) | 670 (8.4%) |
| 10 to 14 Years | 520 (6.4%) | 246 (3.1%) |
| 15 to 19 Years | 423 (5.2%) | 449 (5.6%) |
| 20 to 24 Years | 535 (6.6%) | 297 (3.7%) |
| 25 to 29 Years | 648 (8.0%) | 572 (7.2%) |
| 30 to 34 Years | 594 (7.3%) | 507 (6.4%) |
| 35 to 39 Years | 905 (11.1%) | 650 (8.2%) |
| 40 to 44 Years | 477 (5.9%) | 497 (6.2%) |
| 45 to 49 Years | 465 (5.7%) | 388 (4.9%) |
| 50 to 54 Years | 542 (6.7%) | 534 (6.7%) |
| 55 to 59 Years | 356 (4.4%) | 718 (9.0%) |
| 60 to 64 Years | 539 (6.6%) | 533 (6.7%) |
| 65 to 69 Years | 311 (3.8%) | 391 (4.9%) |
| 70 to 74 Years | 258 (3.2%) | 238 (3.0%) |
| 75 to 79 Years | 150 (1.8%) | 168 (2.1%) |
| 80 to 84 Years | 155 (1.9%) | 106 (1.3%) |
| 85 Years and over | 136 (1.7%) | 347 (4.4%) |
| Total | 8,126 (100.0%) | 7,955 (100.0%) |
Families and Households in South River borough
Median Family Size in South River borough
The median family size in South River borough is 3.27 persons per family, with single female/mother families (834 | 20.5%) accounting for the largest median family size of 3.42 persons per family. On the other hand, single male/father families (402 | 9.9%) represent the smallest median family size with 3.06 persons per family.
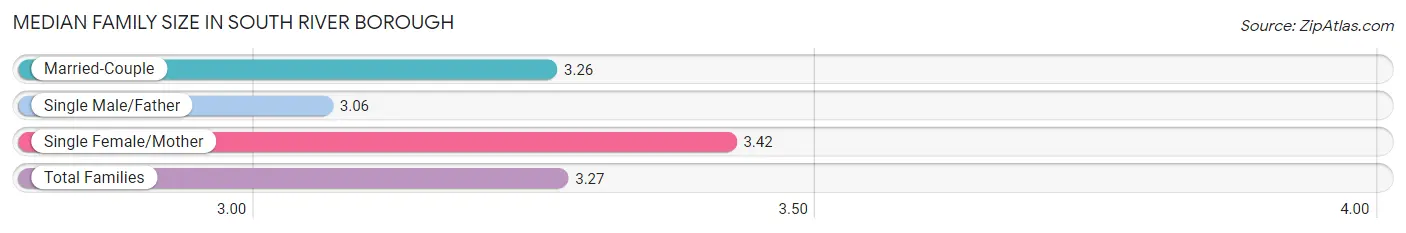
| Family Type | # Families | Family Size |
| Married-Couple | 2,825 (69.6%) | 3.26 |
| Single Male/Father | 402 (9.9%) | 3.06 |
| Single Female/Mother | 834 (20.5%) | 3.42 |
| Total Families | 4,061 (100.0%) | 3.27 |
Median Household Size in South River borough
The median household size in South River borough is 2.89 persons per household, with single male/father households (402 | 7.2%) accounting for the largest median household size of 3.68 persons per household. non-family households (1,494 | 26.9%) represent the smallest median household size with 1.41 persons per household.
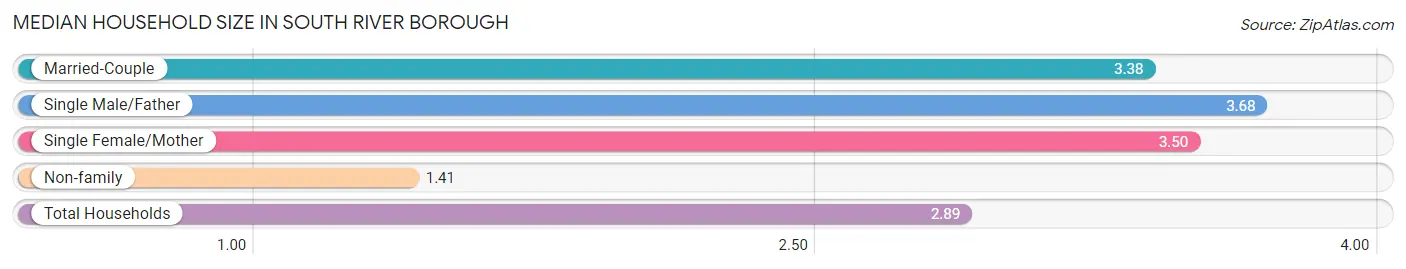
| Household Type | # Households | Household Size |
| Married-Couple | 2,825 (50.9%) | 3.38 |
| Single Male/Father | 402 (7.2%) | 3.68 |
| Single Female/Mother | 834 (15.0%) | 3.50 |
| Non-family | 1,494 (26.9%) | 1.41 |
| Total Households | 5,555 (100.0%) | 2.89 |
Household Size by Marriage Status in South River borough
Out of a total of 5,555 households in South River borough, 4,061 (73.1%) are family households, while 1,494 (26.9%) are nonfamily households. The most numerous type of family households are 2-person households, comprising 1,350, and the most common type of nonfamily households are 1-person households, comprising 1,188.
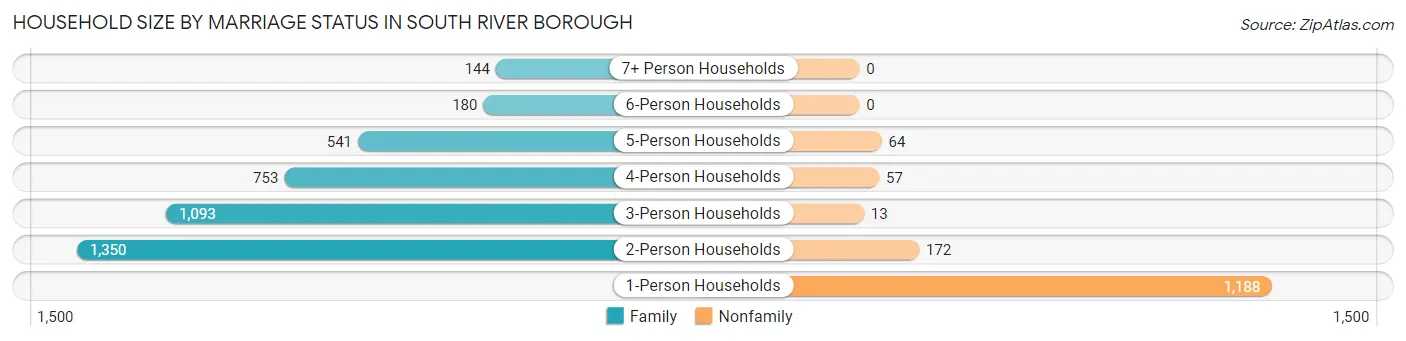
| Household Size | Family Households | Nonfamily Households |
| 1-Person Households | - | 1,188 (21.4%) |
| 2-Person Households | 1,350 (24.3%) | 172 (3.1%) |
| 3-Person Households | 1,093 (19.7%) | 13 (0.2%) |
| 4-Person Households | 753 (13.6%) | 57 (1.0%) |
| 5-Person Households | 541 (9.7%) | 64 (1.1%) |
| 6-Person Households | 180 (3.2%) | 0 (0.0%) |
| 7+ Person Households | 144 (2.6%) | 0 (0.0%) |
| Total | 4,061 (73.1%) | 1,494 (26.9%) |
Female Fertility in South River borough
Fertility by Age in South River borough
Average fertility rate in South River borough is 130.0 births per 1,000 women. Women in the age bracket of 20 to 34 years have the highest fertility rate with 234.0 births per 1,000 women. Women in the age bracket of 20 to 34 years acount for 73.4% of all women with births.
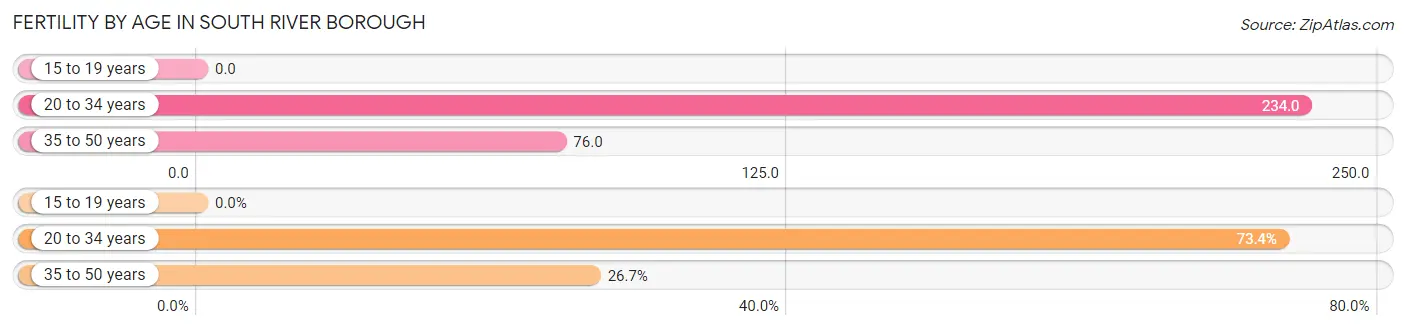
| Age Bracket | Women with Births | Births / 1,000 Women |
| 15 to 19 years | 0 (0.0%) | 0.0 |
| 20 to 34 years | 322 (73.4%) | 234.0 |
| 35 to 50 years | 117 (26.7%) | 76.0 |
| Total | 439 (100.0%) | 130.0 |
Fertility by Age by Marriage Status in South River borough
52.6% of women with births (439) in South River borough are married. The highest percentage of unmarried women with births falls into 20 to 34 years age bracket with 64.6% of them unmarried at the time of birth, while the lowest percentage of unmarried women with births belong to 35 to 50 years age bracket with 0.0% of them unmarried.
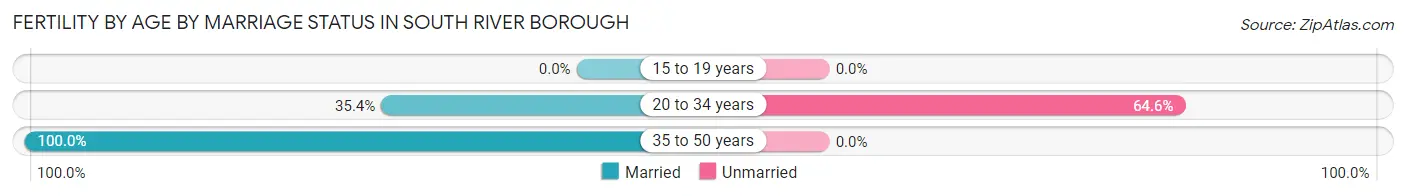
| Age Bracket | Married | Unmarried |
| 15 to 19 years | 0 (0.0%) | 0 (0.0%) |
| 20 to 34 years | 114 (35.4%) | 208 (64.6%) |
| 35 to 50 years | 117 (100.0%) | 0 (0.0%) |
| Total | 231 (52.6%) | 208 (47.4%) |
Fertility by Education in South River borough
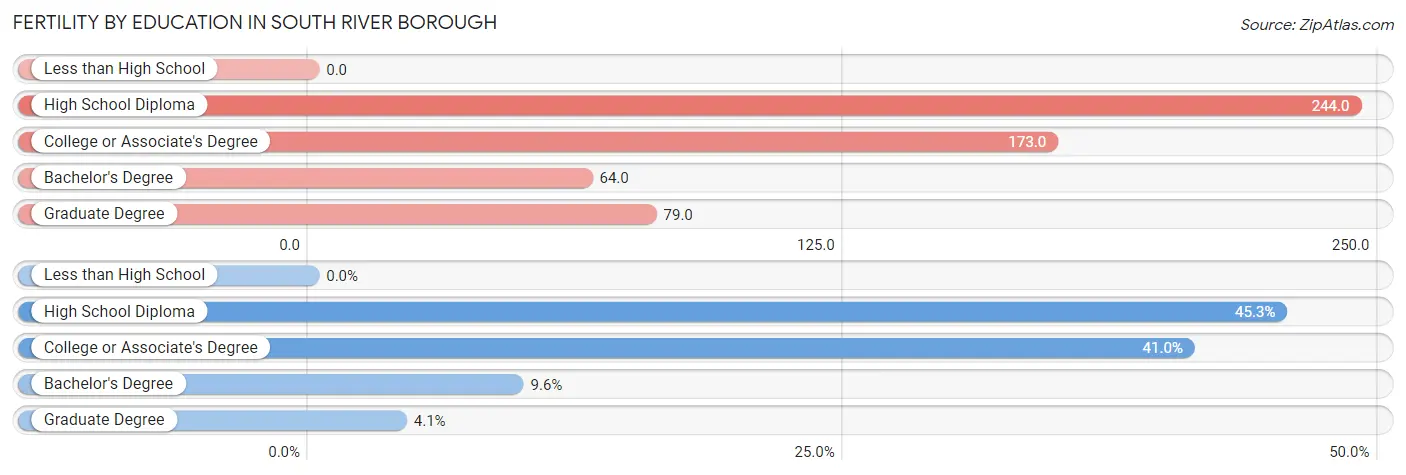
| Educational Attainment | Women with Births | Births / 1,000 Women |
| Less than High School | 0 (0.0%) | 0.0 |
| High School Diploma | 199 (45.3%) | 244.0 |
| College or Associate's Degree | 180 (41.0%) | 173.0 |
| Bachelor's Degree | 42 (9.6%) | 64.0 |
| Graduate Degree | 18 (4.1%) | 79.0 |
| Total | 439 (100.0%) | 130.0 |
Fertility by Education by Marriage Status in South River borough
47.4% of women with births in South River borough are unmarried. Women with the educational attainment of bachelor's degree are most likely to be married with 100.0% of them married at childbirth, while women with the educational attainment of high school diploma are least likely to be married with 77.4% of them unmarried at childbirth.
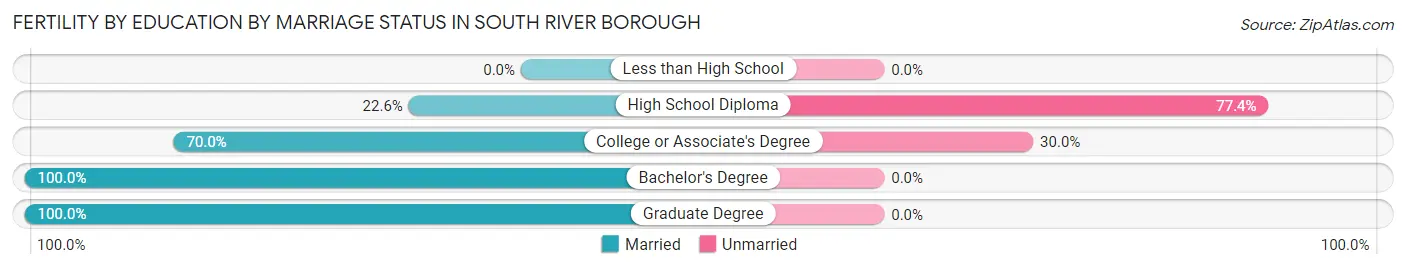
| Educational Attainment | Married | Unmarried |
| Less than High School | 0 (0.0%) | 0 (0.0%) |
| High School Diploma | 45 (22.6%) | 154 (77.4%) |
| College or Associate's Degree | 126 (70.0%) | 54 (30.0%) |
| Bachelor's Degree | 42 (100.0%) | 0 (0.0%) |
| Graduate Degree | 18 (100.0%) | 0 (0.0%) |
| Total | 231 (52.6%) | 208 (47.4%) |
Employment Characteristics in South River borough
Employment by Class of Employer in South River borough
Among the 7,704 employed individuals in South River borough, private company employees (5,308 | 68.9%), local government employees (789 | 10.2%), and self-employed (not incorporated) (426 | 5.5%) make up the most common classes of employment.
| Employer Class | # Employees | % Employees |
| Private Company Employees | 5,308 | 68.9% |
| Self-Employed (Incorporated) | 302 | 3.9% |
| Self-Employed (Not Incorporated) | 426 | 5.5% |
| Not-for-profit Organizations | 353 | 4.6% |
| Local Government Employees | 789 | 10.2% |
| State Government Employees | 354 | 4.6% |
| Federal Government Employees | 115 | 1.5% |
| Unpaid Family Workers | 57 | 0.7% |
| Total | 7,704 | 100.0% |
Employment Status by Age in South River borough
According to the labor force statistics for South River borough, out of the total population over 16 years of age (12,743), 68.9% or 8,780 individuals are in the labor force, with 10.3% or 904 of them unemployed. The age group with the highest labor force participation rate is 25 to 29 years, with 92.4% or 1,127 individuals in the labor force. Within the labor force, the 25 to 29 years age range has the highest percentage of unemployed individuals, with 30.1% or 339 of them being unemployed.
| Age Bracket | In Labor Force | Unemployed |
| 16 to 19 Years | 340 (46.8%) | 100 (29.4%) |
| 20 to 24 Years | 620 (74.5%) | 44 (7.1%) |
| 25 to 29 Years | 1,127 (92.4%) | 339 (30.1%) |
| 30 to 34 Years | 929 (84.4%) | 26 (2.8%) |
| 35 to 44 Years | 2,097 (82.9%) | 187 (8.9%) |
| 45 to 54 Years | 1,657 (85.9%) | 129 (7.8%) |
| 55 to 59 Years | 756 (70.4%) | 0 (0.0%) |
| 60 to 64 Years | 851 (79.4%) | 54 (6.3%) |
| 65 to 74 Years | 353 (29.5%) | 28 (7.9%) |
| 75 Years and over | 49 (4.6%) | 0 (0.0%) |
| Total | 8,780 (68.9%) | 904 (10.3%) |
Employment Status by Educational Attainment in South River borough
According to labor force statistics for South River borough, 83.1% of individuals (7,417) out of the total population between 25 and 64 years of age (8,925) are in the labor force, with 9.9% or 734 of them being unemployed. The group with the highest labor force participation rate are those with the educational attainment of high school diploma, with 89.1% or 2,358 individuals in the labor force. Within the labor force, individuals with high school diploma education have the highest percentage of unemployment, with 17.1% or 403 of them being unemployed.
| Educational Attainment | In Labor Force | Unemployed |
| Less than High School | 934 (71.1%) | 39 (3.0%) |
| High School Diploma | 2,358 (89.1%) | 453 (17.1%) |
| College / Associate Degree | 2,126 (83.5%) | 270 (10.6%) |
| Bachelor's Degree or higher | 1,998 (82.6%) | 92 (3.8%) |
| Total | 7,417 (83.1%) | 884 (9.9%) |
Employment Occupations by Sex in South River borough
Management, Business, Science and Arts Occupations
The most common Management, Business, Science and Arts occupations in South River borough are Management (908 | 11.5%), Community & Social Service (771 | 9.8%), Education Instruction & Library (547 | 7.0%), Computers, Engineering & Science (457 | 5.8%), and Health Diagnosing & Treating (423 | 5.4%).
Management, Business, Science and Arts Occupations by Sex
Within the Management, Business, Science and Arts occupations in South River borough, the most male-oriented occupations are Computers & Mathematics (100.0%), Legal Services & Support (86.3%), and Business & Financial (77.3%), while the most female-oriented occupations are Health Technologists (100.0%), Arts, Media & Entertainment (80.4%), and Health Diagnosing & Treating (79.7%).
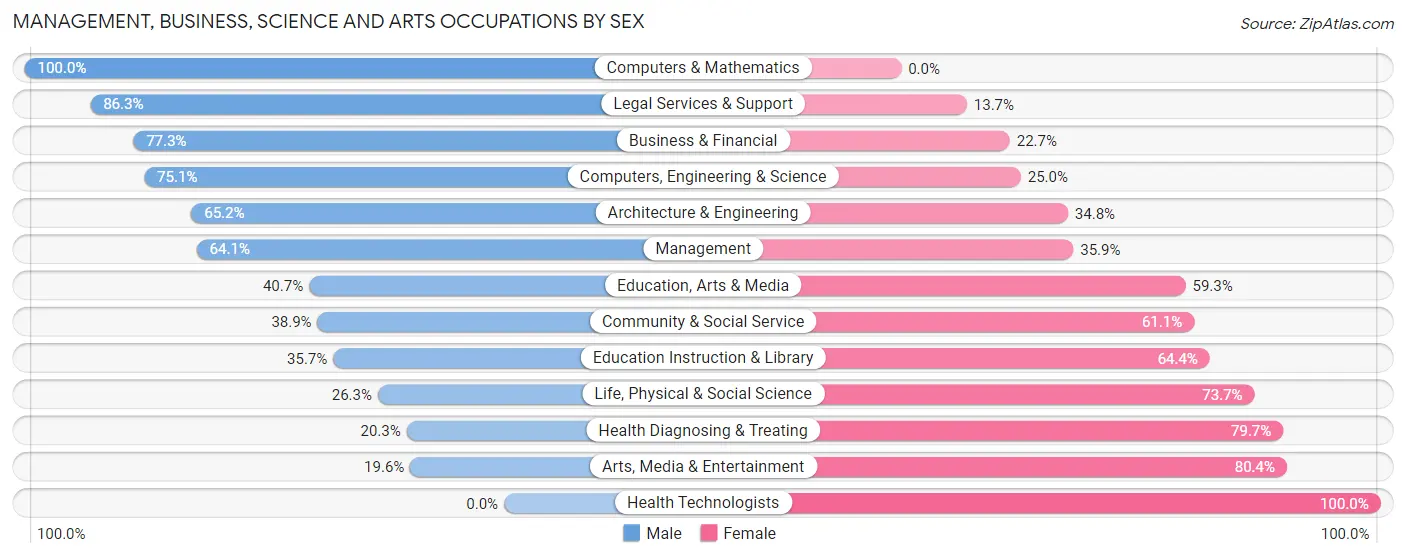
| Occupation | Male | Female |
| Management | 582 (64.1%) | 326 (35.9%) |
| Business & Financial | 198 (77.3%) | 58 (22.7%) |
| Computers, Engineering & Science | 343 (75.0%) | 114 (24.9%) |
| Computers & Mathematics | 193 (100.0%) | 0 (0.0%) |
| Architecture & Engineering | 135 (65.2%) | 72 (34.8%) |
| Life, Physical & Social Science | 15 (26.3%) | 42 (73.7%) |
| Community & Social Service | 300 (38.9%) | 471 (61.1%) |
| Education, Arts & Media | 24 (40.7%) | 35 (59.3%) |
| Legal Services & Support | 63 (86.3%) | 10 (13.7%) |
| Education Instruction & Library | 195 (35.6%) | 352 (64.3%) |
| Arts, Media & Entertainment | 18 (19.6%) | 74 (80.4%) |
| Health Diagnosing & Treating | 86 (20.3%) | 337 (79.7%) |
| Health Technologists | 0 (0.0%) | 270 (100.0%) |
| Total (Category) | 1,509 (53.6%) | 1,306 (46.4%) |
| Total (Overall) | 4,556 (57.9%) | 3,317 (42.1%) |
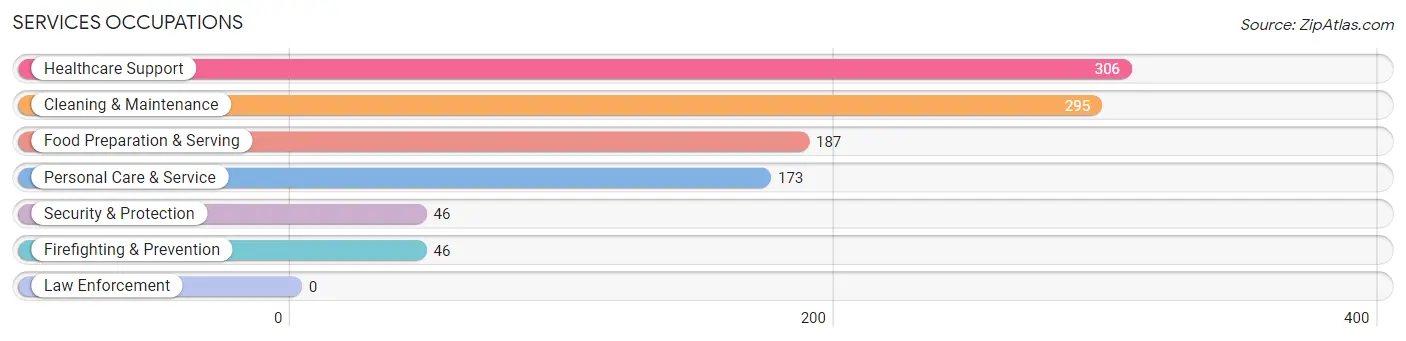
Services Occupations
The most common Services occupations in South River borough are Healthcare Support (306 | 3.9%), Cleaning & Maintenance (295 | 3.7%), Food Preparation & Serving (187 | 2.4%), Personal Care & Service (173 | 2.2%), and Security & Protection (46 | 0.6%).
Services Occupations by Sex
Within the Services occupations in South River borough, the most male-oriented occupations are Security & Protection (65.2%), Firefighting & Prevention (65.2%), and Food Preparation & Serving (54.0%), while the most female-oriented occupations are Healthcare Support (86.6%), Cleaning & Maintenance (55.9%), and Personal Care & Service (52.0%).
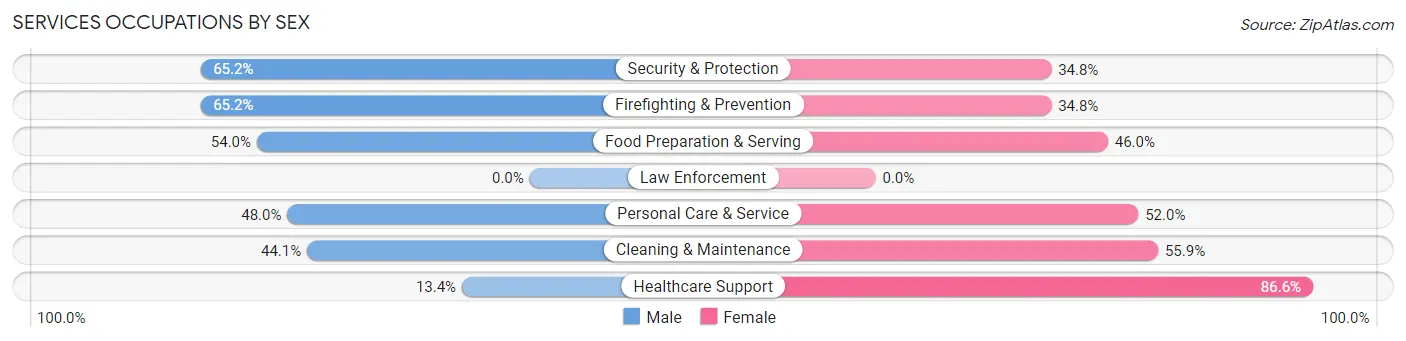
| Occupation | Male | Female |
| Healthcare Support | 41 (13.4%) | 265 (86.6%) |
| Security & Protection | 30 (65.2%) | 16 (34.8%) |
| Firefighting & Prevention | 30 (65.2%) | 16 (34.8%) |
| Law Enforcement | 0 (0.0%) | 0 (0.0%) |
| Food Preparation & Serving | 101 (54.0%) | 86 (46.0%) |
| Cleaning & Maintenance | 130 (44.1%) | 165 (55.9%) |
| Personal Care & Service | 83 (48.0%) | 90 (52.0%) |
| Total (Category) | 385 (38.2%) | 622 (61.8%) |
| Total (Overall) | 4,556 (57.9%) | 3,317 (42.1%) |
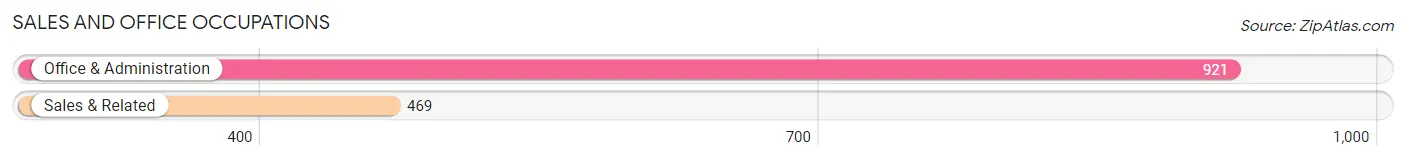
Sales and Office Occupations
The most common Sales and Office occupations in South River borough are Office & Administration (921 | 11.7%), and Sales & Related (469 | 6.0%).
Sales and Office Occupations by Sex
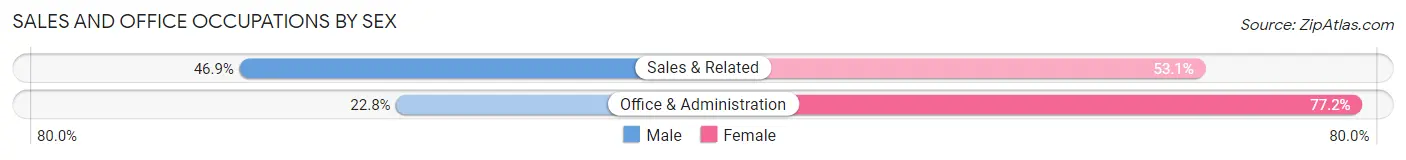
| Occupation | Male | Female |
| Sales & Related | 220 (46.9%) | 249 (53.1%) |
| Office & Administration | 210 (22.8%) | 711 (77.2%) |
| Total (Category) | 430 (30.9%) | 960 (69.1%) |
| Total (Overall) | 4,556 (57.9%) | 3,317 (42.1%) |
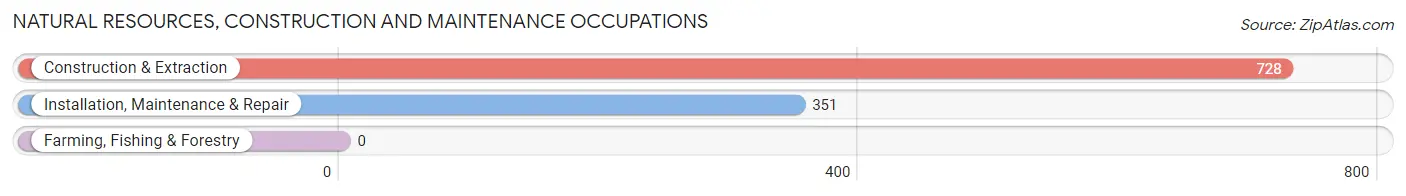
Natural Resources, Construction and Maintenance Occupations
The most common Natural Resources, Construction and Maintenance occupations in South River borough are Construction & Extraction (728 | 9.2%), and Installation, Maintenance & Repair (351 | 4.5%).
Natural Resources, Construction and Maintenance Occupations by Sex
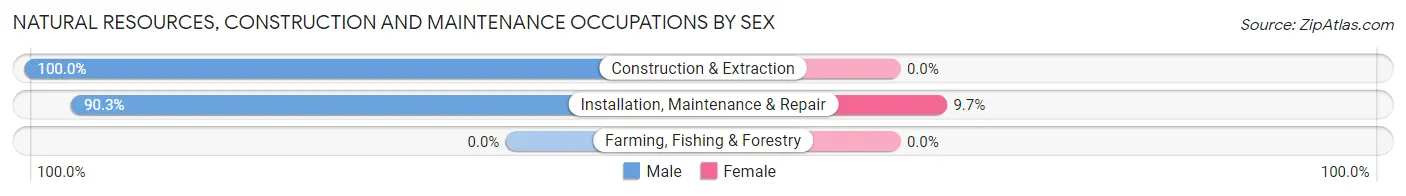
| Occupation | Male | Female |
| Farming, Fishing & Forestry | 0 (0.0%) | 0 (0.0%) |
| Construction & Extraction | 728 (100.0%) | 0 (0.0%) |
| Installation, Maintenance & Repair | 317 (90.3%) | 34 (9.7%) |
| Total (Category) | 1,045 (96.9%) | 34 (3.2%) |
| Total (Overall) | 4,556 (57.9%) | 3,317 (42.1%) |
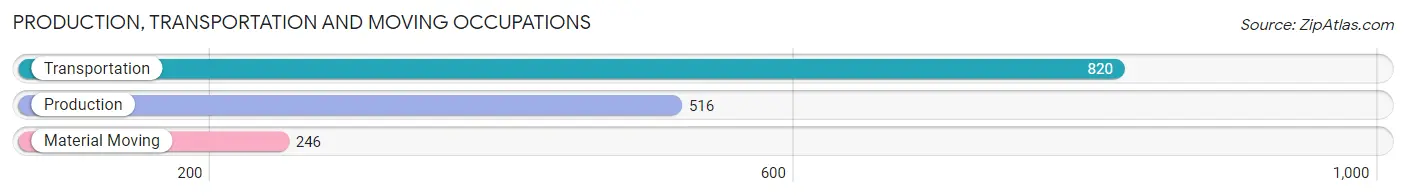
Production, Transportation and Moving Occupations
The most common Production, Transportation and Moving occupations in South River borough are Transportation (820 | 10.4%), Production (516 | 6.6%), and Material Moving (246 | 3.1%).
Production, Transportation and Moving Occupations by Sex
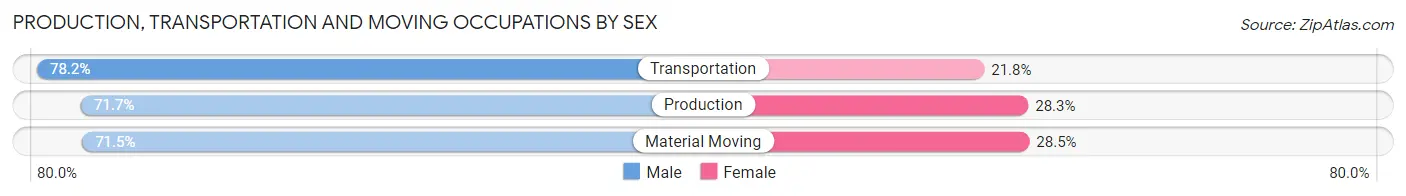
| Occupation | Male | Female |
| Production | 370 (71.7%) | 146 (28.3%) |
| Transportation | 641 (78.2%) | 179 (21.8%) |
| Material Moving | 176 (71.5%) | 70 (28.5%) |
| Total (Category) | 1,187 (75.0%) | 395 (25.0%) |
| Total (Overall) | 4,556 (57.9%) | 3,317 (42.1%) |
Employment Industries by Sex in South River borough
Employment Industries in South River borough
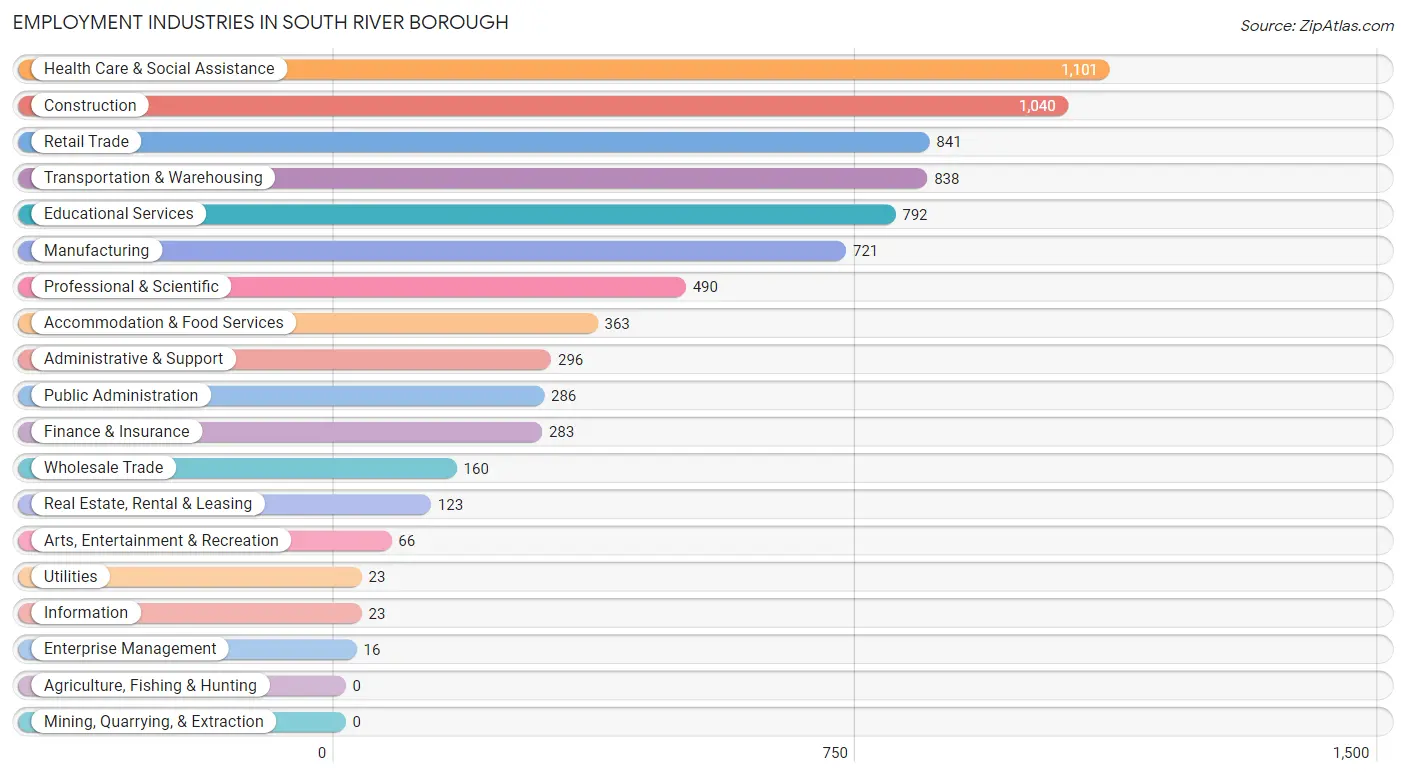
The major employment industries in South River borough include Health Care & Social Assistance (1,101 | 14.0%), Construction (1,040 | 13.2%), Retail Trade (841 | 10.7%), Transportation & Warehousing (838 | 10.6%), and Educational Services (792 | 10.1%).
Employment Industries by Sex in South River borough
The South River borough industries that see more men than women are Utilities (100.0%), Information (100.0%), and Enterprise Management (100.0%), whereas the industries that tend to have a higher number of women are Health Care & Social Assistance (72.4%), Educational Services (67.5%), and Finance & Insurance (60.8%).
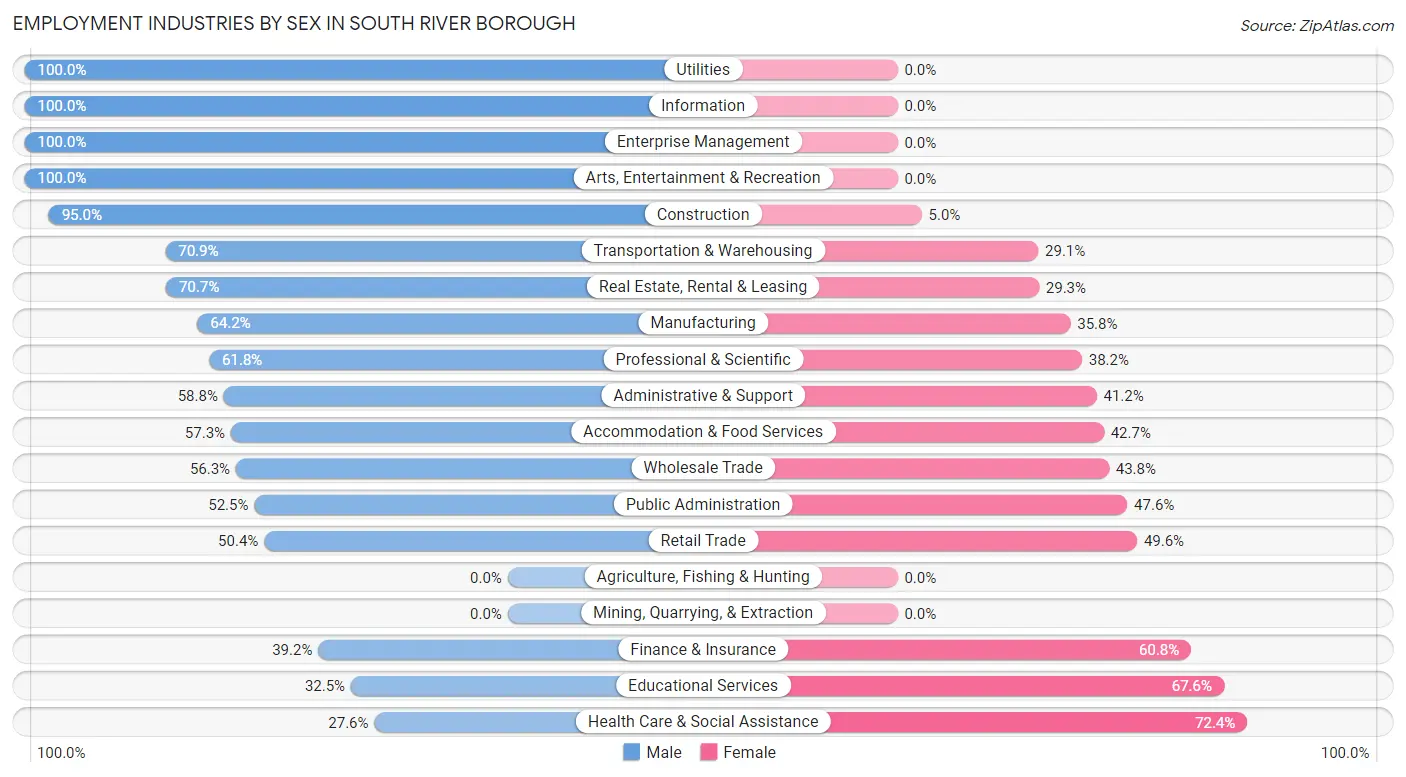
| Industry | Male | Female |
| Agriculture, Fishing & Hunting | 0 (0.0%) | 0 (0.0%) |
| Mining, Quarrying, & Extraction | 0 (0.0%) | 0 (0.0%) |
| Construction | 988 (95.0%) | 52 (5.0%) |
| Manufacturing | 463 (64.2%) | 258 (35.8%) |
| Wholesale Trade | 90 (56.2%) | 70 (43.8%) |
| Retail Trade | 424 (50.4%) | 417 (49.6%) |
| Transportation & Warehousing | 594 (70.9%) | 244 (29.1%) |
| Utilities | 23 (100.0%) | 0 (0.0%) |
| Information | 23 (100.0%) | 0 (0.0%) |
| Finance & Insurance | 111 (39.2%) | 172 (60.8%) |
| Real Estate, Rental & Leasing | 87 (70.7%) | 36 (29.3%) |
| Professional & Scientific | 303 (61.8%) | 187 (38.2%) |
| Enterprise Management | 16 (100.0%) | 0 (0.0%) |
| Administrative & Support | 174 (58.8%) | 122 (41.2%) |
| Educational Services | 257 (32.5%) | 535 (67.5%) |
| Health Care & Social Assistance | 304 (27.6%) | 797 (72.4%) |
| Arts, Entertainment & Recreation | 66 (100.0%) | 0 (0.0%) |
| Accommodation & Food Services | 208 (57.3%) | 155 (42.7%) |
| Public Administration | 150 (52.4%) | 136 (47.5%) |
| Total | 4,556 (57.9%) | 3,317 (42.1%) |
Education in South River borough
School Enrollment in South River borough
The most common levels of schooling among the 3,500 students in South River borough are elementary school (1,011 | 28.9%), high school (677 | 19.3%), and college / undergraduate (645 | 18.4%).
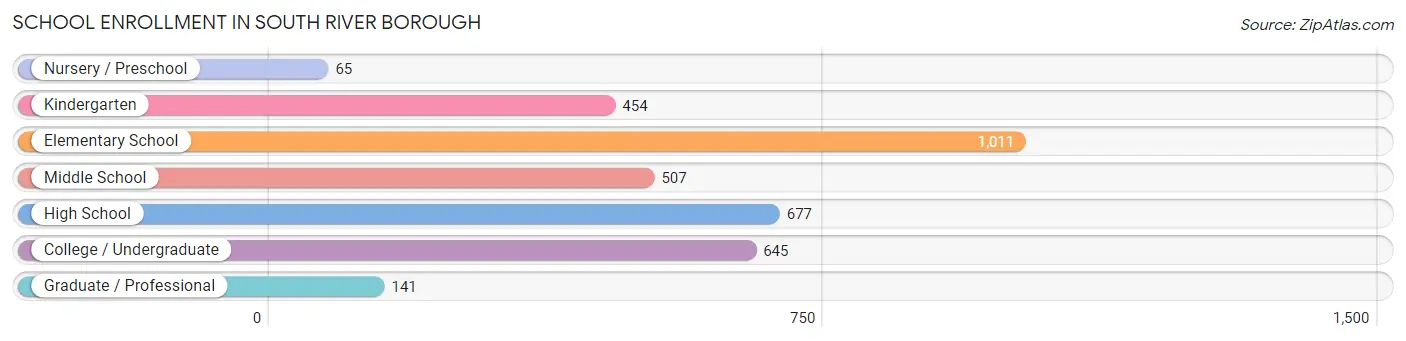
| School Level | # Students | % Students |
| Nursery / Preschool | 65 | 1.9% |
| Kindergarten | 454 | 13.0% |
| Elementary School | 1,011 | 28.9% |
| Middle School | 507 | 14.5% |
| High School | 677 | 19.3% |
| College / Undergraduate | 645 | 18.4% |
| Graduate / Professional | 141 | 4.0% |
| Total | 3,500 | 100.0% |
School Enrollment by Age by Funding Source in South River borough
Out of a total of 3,500 students who are enrolled in schools in South River borough, 602 (17.2%) attend a private institution, while the remaining 2,898 (82.8%) are enrolled in public schools. The age group of 35 years and over has the highest likelihood of being enrolled in private schools, with 85 (66.4% in the age bracket) enrolled. Conversely, the age group of 10 to 14 year olds has the lowest likelihood of being enrolled in a private school, with 717 (93.6% in the age bracket) attending a public institution.
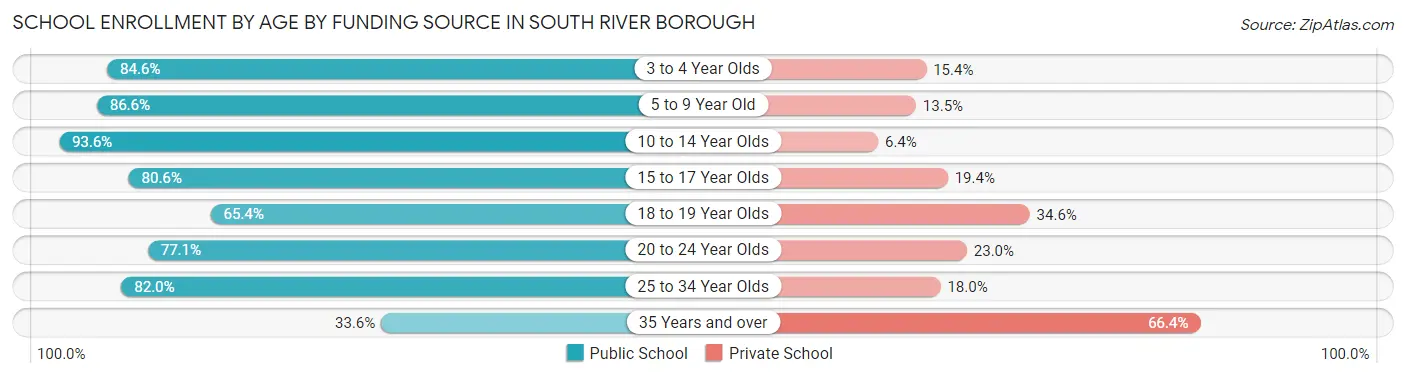
| Age Bracket | Public School | Private School |
| 3 to 4 Year Olds | 55 (84.6%) | 10 (15.4%) |
| 5 to 9 Year Old | 1,068 (86.6%) | 166 (13.5%) |
| 10 to 14 Year Olds | 717 (93.6%) | 49 (6.4%) |
| 15 to 17 Year Olds | 516 (80.6%) | 124 (19.4%) |
| 18 to 19 Year Olds | 117 (65.4%) | 62 (34.6%) |
| 20 to 24 Year Olds | 282 (77.0%) | 84 (23.0%) |
| 25 to 34 Year Olds | 100 (82.0%) | 22 (18.0%) |
| 35 Years and over | 43 (33.6%) | 85 (66.4%) |
| Total | 2,898 (82.8%) | 602 (17.2%) |
Educational Attainment by Field of Study in South River borough
Business (784 | 23.7%), education (362 | 10.9%), engineering (357 | 10.8%), science & technology (231 | 7.0%), and computers & mathematics (214 | 6.5%) are the most common fields of study among 3,310 individuals in South River borough who have obtained a bachelor's degree or higher.
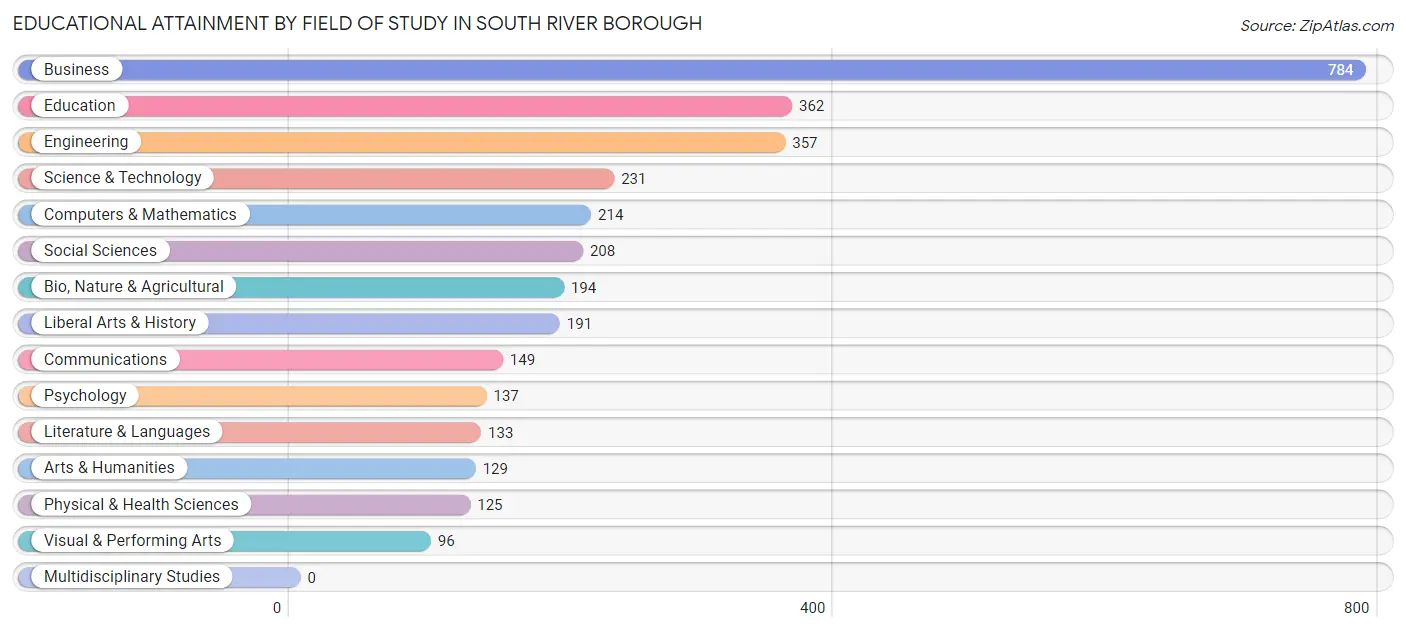
| Field of Study | # Graduates | % Graduates |
| Computers & Mathematics | 214 | 6.5% |
| Bio, Nature & Agricultural | 194 | 5.9% |
| Physical & Health Sciences | 125 | 3.8% |
| Psychology | 137 | 4.1% |
| Social Sciences | 208 | 6.3% |
| Engineering | 357 | 10.8% |
| Multidisciplinary Studies | 0 | 0.0% |
| Science & Technology | 231 | 7.0% |
| Business | 784 | 23.7% |
| Education | 362 | 10.9% |
| Literature & Languages | 133 | 4.0% |
| Liberal Arts & History | 191 | 5.8% |
| Visual & Performing Arts | 96 | 2.9% |
| Communications | 149 | 4.5% |
| Arts & Humanities | 129 | 3.9% |
| Total | 3,310 | 100.0% |
Transportation & Commute in South River borough
Vehicle Availability by Sex in South River borough
The most prevalent vehicle ownership categories in South River borough are males with 2 vehicles (1,622, accounting for 36.3%) and females with 2 vehicles (1,337, making up 50.1%).
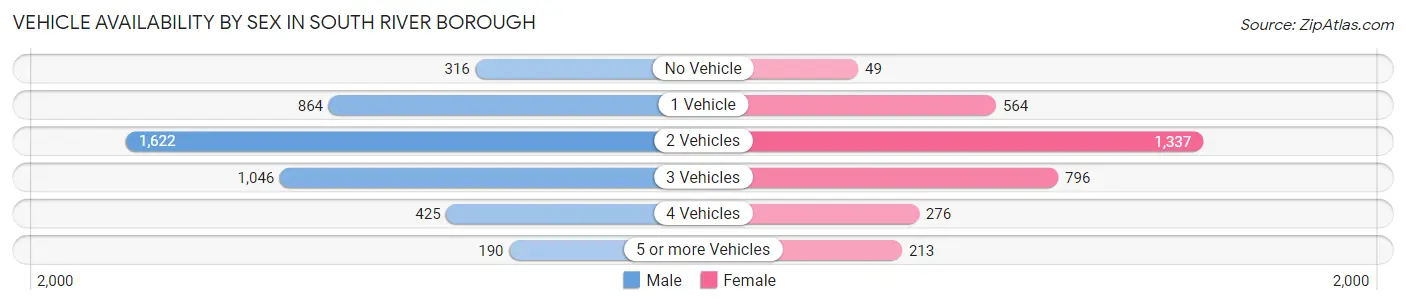
| Vehicles Available | Male | Female |
| No Vehicle | 316 (7.1%) | 49 (1.5%) |
| 1 Vehicle | 864 (19.4%) | 564 (17.4%) |
| 2 Vehicles | 1,622 (36.3%) | 1,337 (41.3%) |
| 3 Vehicles | 1,046 (23.4%) | 796 (24.6%) |
| 4 Vehicles | 425 (9.5%) | 276 (8.5%) |
| 5 or more Vehicles | 190 (4.3%) | 213 (6.6%) |
| Total | 4,463 (100.0%) | 3,235 (100.0%) |
Commute Time in South River borough
The most frequently occuring commute durations in South River borough are 30 to 34 minutes (1,186 commuters, 16.2%), 15 to 19 minutes (990 commuters, 13.6%), and 5 to 9 minutes (956 commuters, 13.1%).
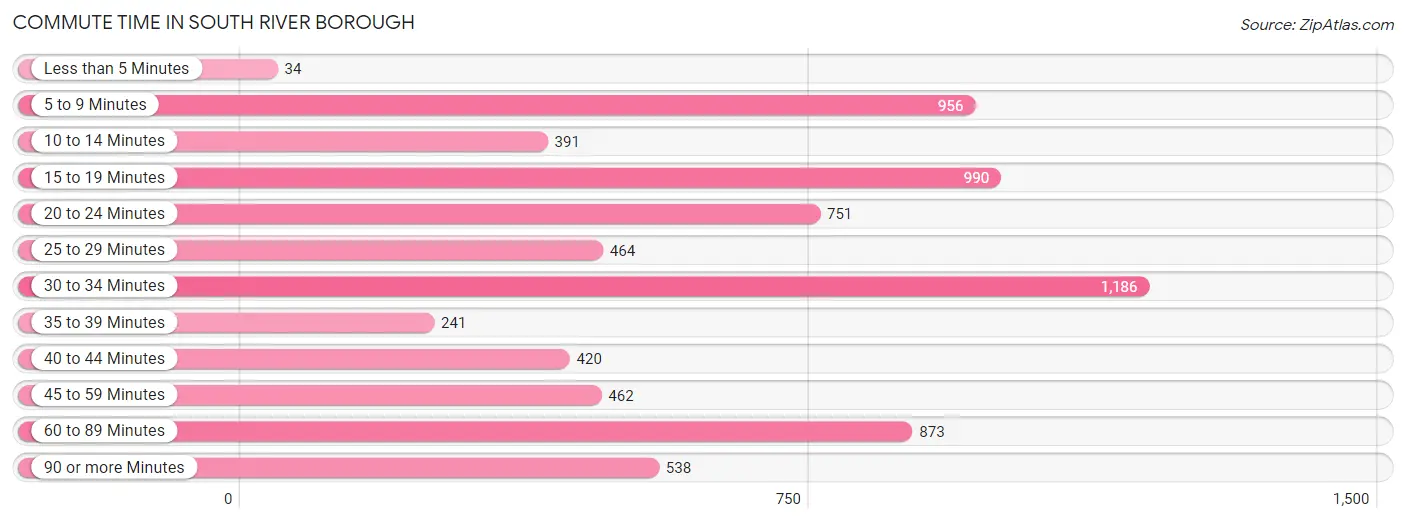
| Commute Time | # Commuters | % Commuters |
| Less than 5 Minutes | 34 | 0.5% |
| 5 to 9 Minutes | 956 | 13.1% |
| 10 to 14 Minutes | 391 | 5.3% |
| 15 to 19 Minutes | 990 | 13.6% |
| 20 to 24 Minutes | 751 | 10.3% |
| 25 to 29 Minutes | 464 | 6.4% |
| 30 to 34 Minutes | 1,186 | 16.2% |
| 35 to 39 Minutes | 241 | 3.3% |
| 40 to 44 Minutes | 420 | 5.8% |
| 45 to 59 Minutes | 462 | 6.3% |
| 60 to 89 Minutes | 873 | 11.9% |
| 90 or more Minutes | 538 | 7.4% |
Commute Time by Sex in South River borough
The most common commute times in South River borough are 60 to 89 minutes (714 commuters, 16.5%) for males and 30 to 34 minutes (612 commuters, 20.6%) for females.
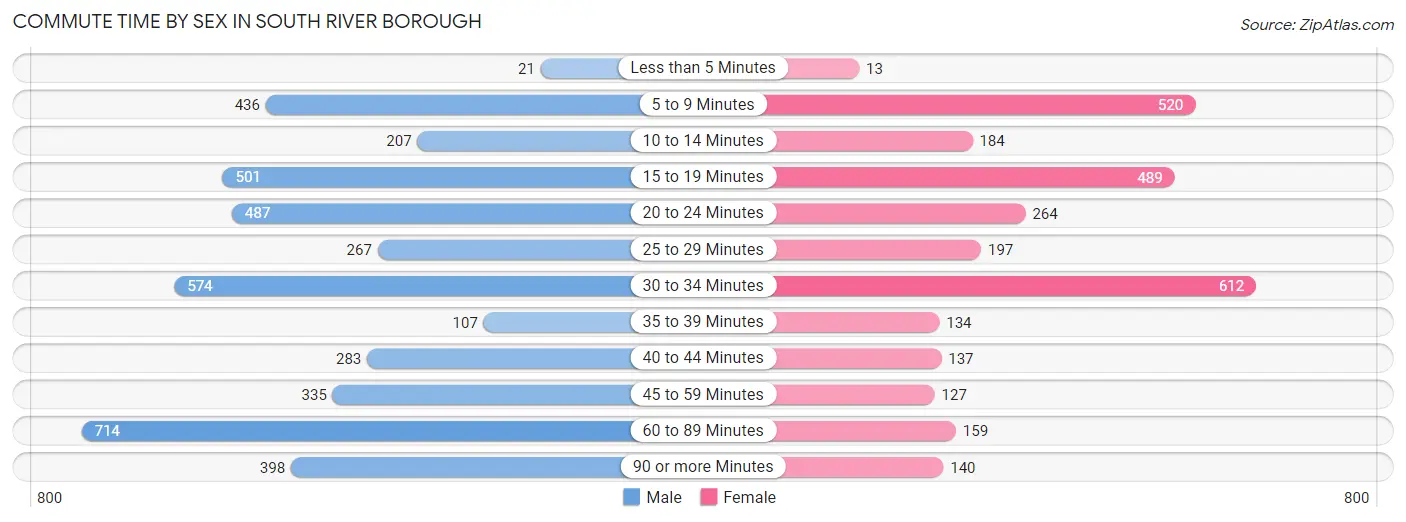
| Commute Time | Male | Female |
| Less than 5 Minutes | 21 (0.5%) | 13 (0.4%) |
| 5 to 9 Minutes | 436 (10.1%) | 520 (17.5%) |
| 10 to 14 Minutes | 207 (4.8%) | 184 (6.2%) |
| 15 to 19 Minutes | 501 (11.6%) | 489 (16.4%) |
| 20 to 24 Minutes | 487 (11.3%) | 264 (8.9%) |
| 25 to 29 Minutes | 267 (6.2%) | 197 (6.6%) |
| 30 to 34 Minutes | 574 (13.3%) | 612 (20.6%) |
| 35 to 39 Minutes | 107 (2.5%) | 134 (4.5%) |
| 40 to 44 Minutes | 283 (6.5%) | 137 (4.6%) |
| 45 to 59 Minutes | 335 (7.7%) | 127 (4.3%) |
| 60 to 89 Minutes | 714 (16.5%) | 159 (5.3%) |
| 90 or more Minutes | 398 (9.2%) | 140 (4.7%) |
Time of Departure to Work by Sex in South River borough
The most frequent times of departure to work in South River borough are 7:30 AM to 7:59 AM (595, 13.7%) for males and 7:30 AM to 7:59 AM (560, 18.8%) for females.
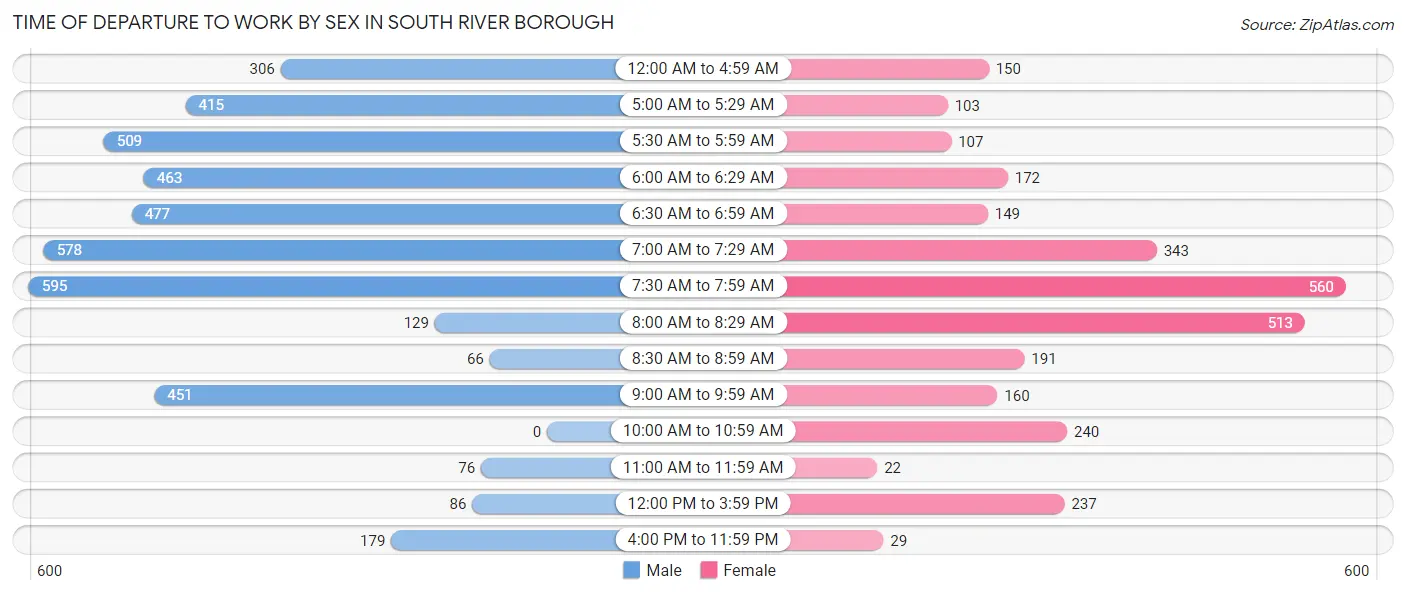
| Time of Departure | Male | Female |
| 12:00 AM to 4:59 AM | 306 (7.1%) | 150 (5.0%) |
| 5:00 AM to 5:29 AM | 415 (9.6%) | 103 (3.5%) |
| 5:30 AM to 5:59 AM | 509 (11.8%) | 107 (3.6%) |
| 6:00 AM to 6:29 AM | 463 (10.7%) | 172 (5.8%) |
| 6:30 AM to 6:59 AM | 477 (11.0%) | 149 (5.0%) |
| 7:00 AM to 7:29 AM | 578 (13.4%) | 343 (11.5%) |
| 7:30 AM to 7:59 AM | 595 (13.7%) | 560 (18.8%) |
| 8:00 AM to 8:29 AM | 129 (3.0%) | 513 (17.2%) |
| 8:30 AM to 8:59 AM | 66 (1.5%) | 191 (6.4%) |
| 9:00 AM to 9:59 AM | 451 (10.4%) | 160 (5.4%) |
| 10:00 AM to 10:59 AM | 0 (0.0%) | 240 (8.1%) |
| 11:00 AM to 11:59 AM | 76 (1.8%) | 22 (0.7%) |
| 12:00 PM to 3:59 PM | 86 (2.0%) | 237 (8.0%) |
| 4:00 PM to 11:59 PM | 179 (4.1%) | 29 (1.0%) |
| Total | 4,330 (100.0%) | 2,976 (100.0%) |
Housing Occupancy in South River borough
Occupancy by Ownership in South River borough
Of the total 5,555 dwellings in South River borough, owner-occupied units account for 3,624 (65.2%), while renter-occupied units make up 1,931 (34.8%).
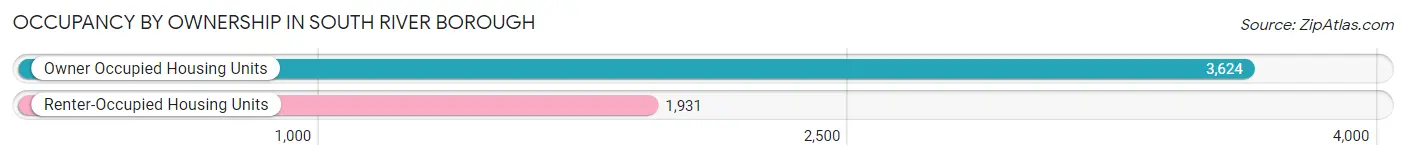
| Occupancy | # Housing Units | % Housing Units |
| Owner Occupied Housing Units | 3,624 | 65.2% |
| Renter-Occupied Housing Units | 1,931 | 34.8% |
| Total Occupied Housing Units | 5,555 | 100.0% |
Occupancy by Household Size in South River borough
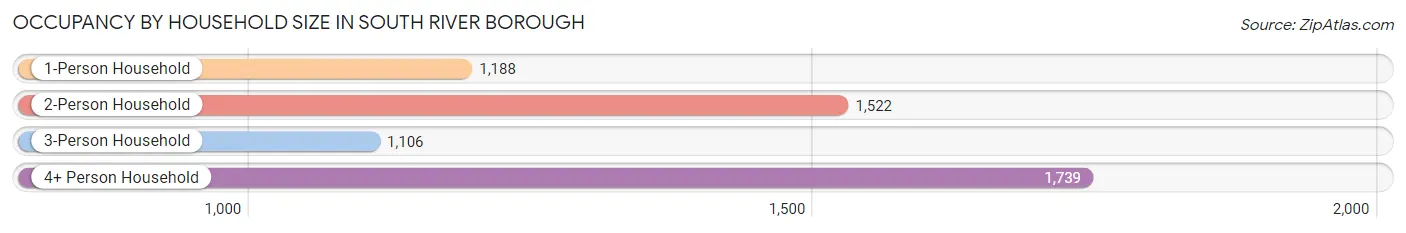
| Household Size | # Housing Units | % Housing Units |
| 1-Person Household | 1,188 | 21.4% |
| 2-Person Household | 1,522 | 27.4% |
| 3-Person Household | 1,106 | 19.9% |
| 4+ Person Household | 1,739 | 31.3% |
| Total Housing Units | 5,555 | 100.0% |
Occupancy by Ownership by Household Size in South River borough
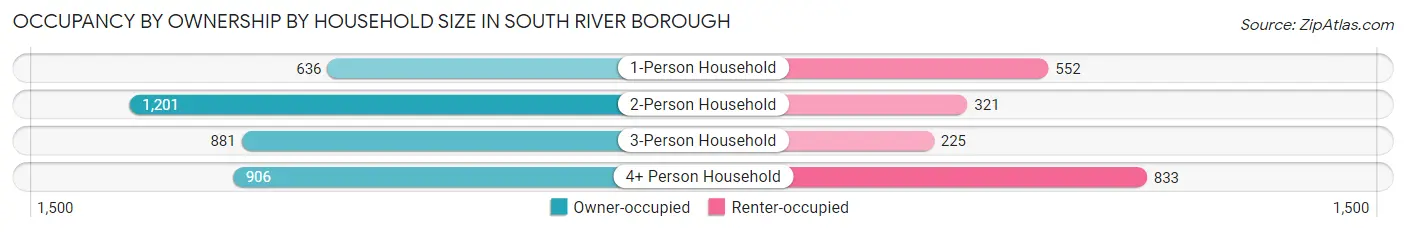
| Household Size | Owner-occupied | Renter-occupied |
| 1-Person Household | 636 (53.5%) | 552 (46.5%) |
| 2-Person Household | 1,201 (78.9%) | 321 (21.1%) |
| 3-Person Household | 881 (79.7%) | 225 (20.3%) |
| 4+ Person Household | 906 (52.1%) | 833 (47.9%) |
| Total Housing Units | 3,624 (65.2%) | 1,931 (34.8%) |
Occupancy by Educational Attainment in South River borough
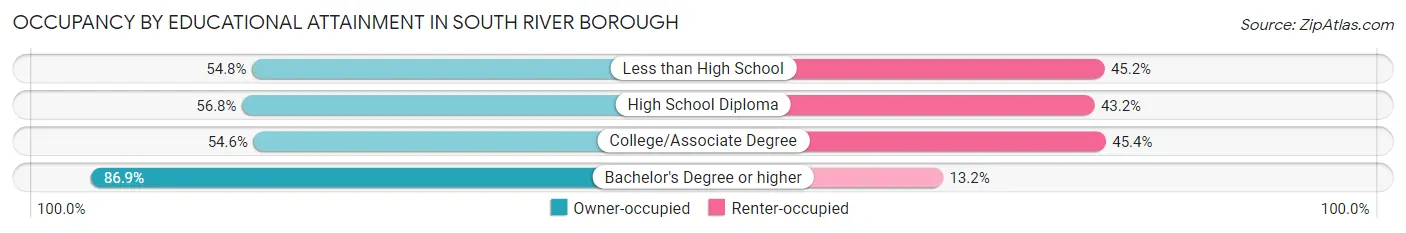
| Household Size | Owner-occupied | Renter-occupied |
| Less than High School | 436 (54.8%) | 359 (45.2%) |
| High School Diploma | 967 (56.8%) | 735 (43.2%) |
| College/Associate Degree | 735 (54.6%) | 612 (45.4%) |
| Bachelor's Degree or higher | 1,486 (86.9%) | 225 (13.2%) |
Occupancy by Age of Householder in South River borough
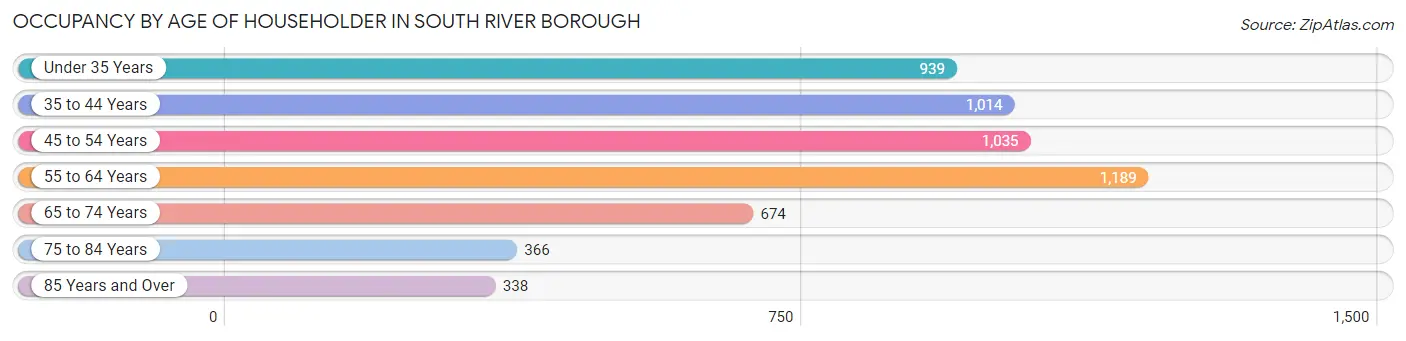
| Age Bracket | # Households | % Households |
| Under 35 Years | 939 | 16.9% |
| 35 to 44 Years | 1,014 | 18.2% |
| 45 to 54 Years | 1,035 | 18.6% |
| 55 to 64 Years | 1,189 | 21.4% |
| 65 to 74 Years | 674 | 12.1% |
| 75 to 84 Years | 366 | 6.6% |
| 85 Years and Over | 338 | 6.1% |
| Total | 5,555 | 100.0% |
Housing Finances in South River borough
Median Income by Occupancy in South River borough
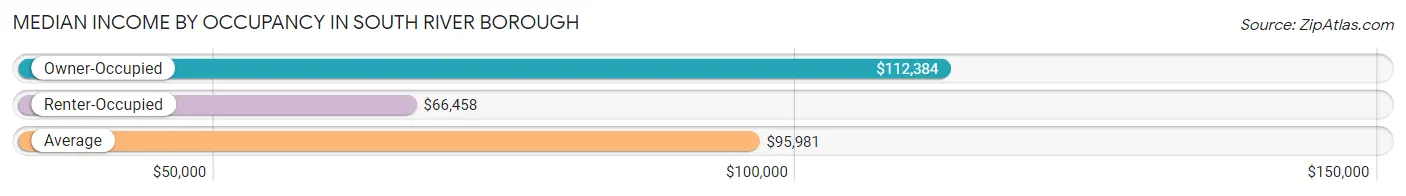
| Occupancy Type | # Households | Median Income |
| Owner-Occupied | 3,624 (65.2%) | $112,384 |
| Renter-Occupied | 1,931 (34.8%) | $66,458 |
| Average | 5,555 (100.0%) | $95,981 |
Occupancy by Householder Income Bracket in South River borough
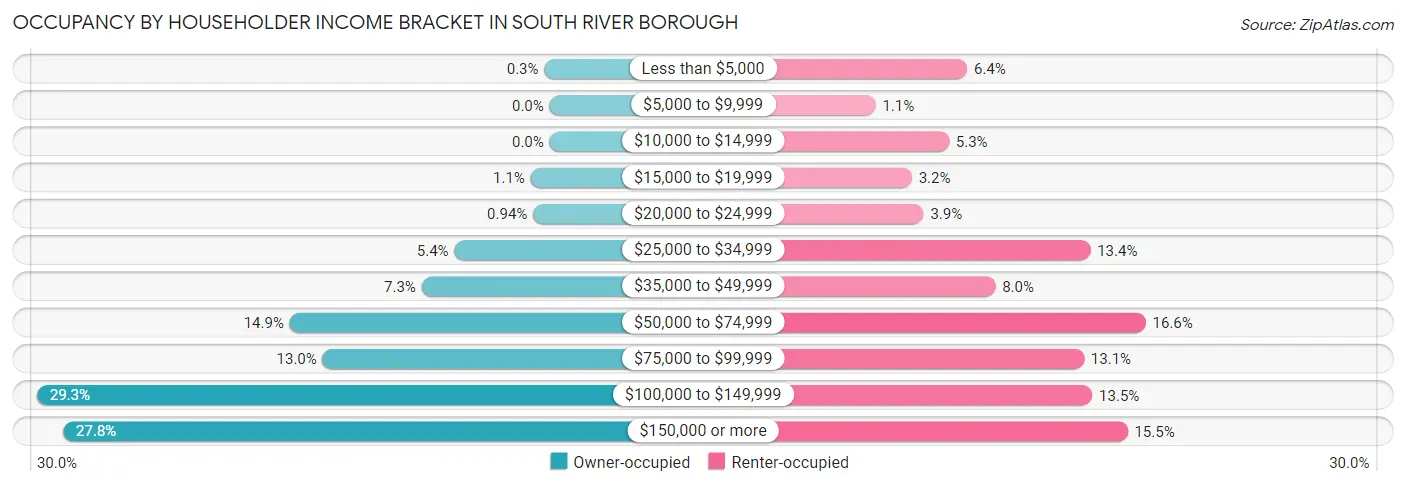
| Income Bracket | Owner-occupied | Renter-occupied |
| Less than $5,000 | 11 (0.3%) | 123 (6.4%) |
| $5,000 to $9,999 | 0 (0.0%) | 22 (1.1%) |
| $10,000 to $14,999 | 0 (0.0%) | 103 (5.3%) |
| $15,000 to $19,999 | 39 (1.1%) | 62 (3.2%) |
| $20,000 to $24,999 | 34 (0.9%) | 75 (3.9%) |
| $25,000 to $34,999 | 197 (5.4%) | 259 (13.4%) |
| $35,000 to $49,999 | 265 (7.3%) | 154 (8.0%) |
| $50,000 to $74,999 | 538 (14.8%) | 320 (16.6%) |
| $75,000 to $99,999 | 470 (13.0%) | 252 (13.1%) |
| $100,000 to $149,999 | 1,062 (29.3%) | 261 (13.5%) |
| $150,000 or more | 1,008 (27.8%) | 300 (15.5%) |
| Total | 3,624 (100.0%) | 1,931 (100.0%) |
Monthly Housing Cost Tiers in South River borough
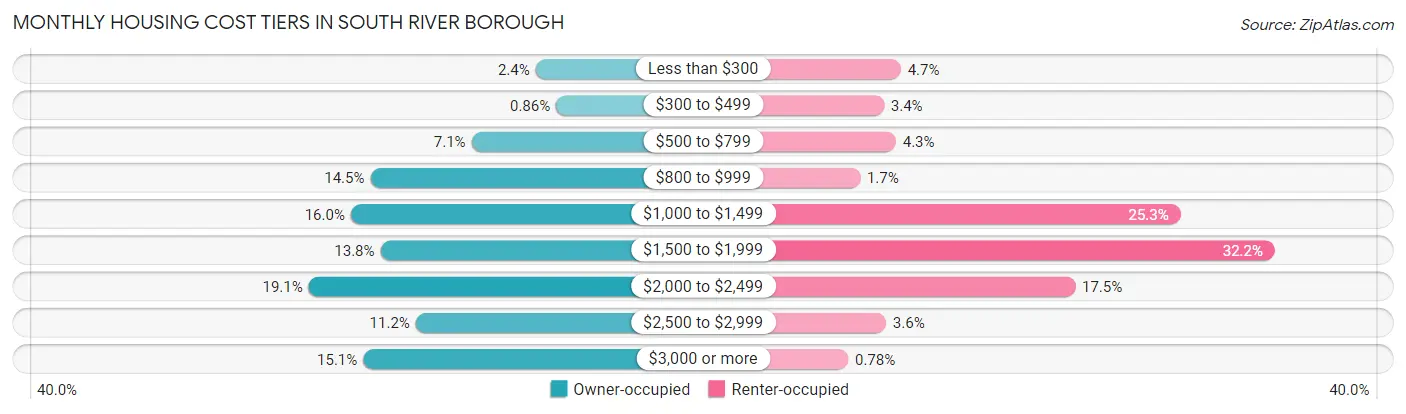
| Monthly Cost | Owner-occupied | Renter-occupied |
| Less than $300 | 86 (2.4%) | 90 (4.7%) |
| $300 to $499 | 31 (0.9%) | 66 (3.4%) |
| $500 to $799 | 257 (7.1%) | 83 (4.3%) |
| $800 to $999 | 527 (14.5%) | 32 (1.7%) |
| $1,000 to $1,499 | 579 (16.0%) | 488 (25.3%) |
| $1,500 to $1,999 | 500 (13.8%) | 622 (32.2%) |
| $2,000 to $2,499 | 692 (19.1%) | 338 (17.5%) |
| $2,500 to $2,999 | 406 (11.2%) | 69 (3.6%) |
| $3,000 or more | 546 (15.1%) | 15 (0.8%) |
| Total | 3,624 (100.0%) | 1,931 (100.0%) |
Physical Housing Characteristics in South River borough
Housing Structures in South River borough
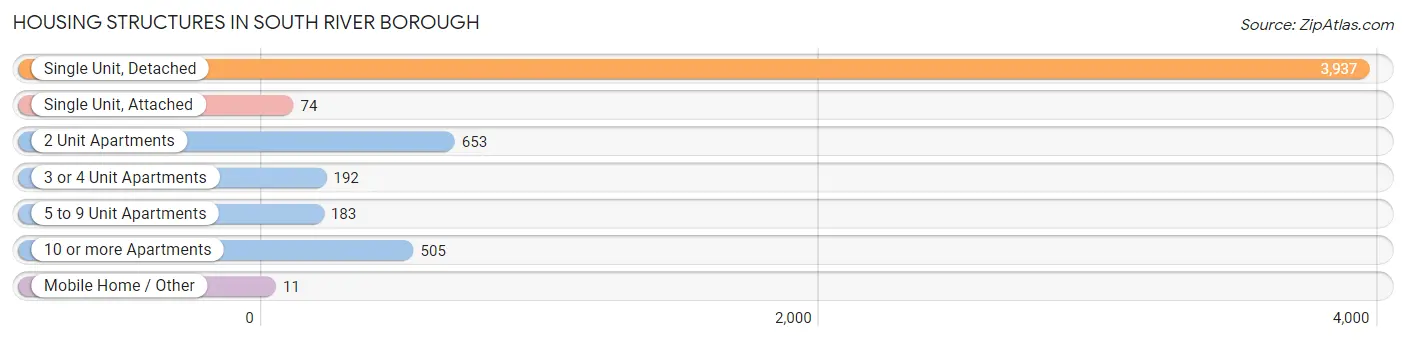
| Structure Type | # Housing Units | % Housing Units |
| Single Unit, Detached | 3,937 | 70.9% |
| Single Unit, Attached | 74 | 1.3% |
| 2 Unit Apartments | 653 | 11.8% |
| 3 or 4 Unit Apartments | 192 | 3.5% |
| 5 to 9 Unit Apartments | 183 | 3.3% |
| 10 or more Apartments | 505 | 9.1% |
| Mobile Home / Other | 11 | 0.2% |
| Total | 5,555 | 100.0% |
Housing Structures by Occupancy in South River borough
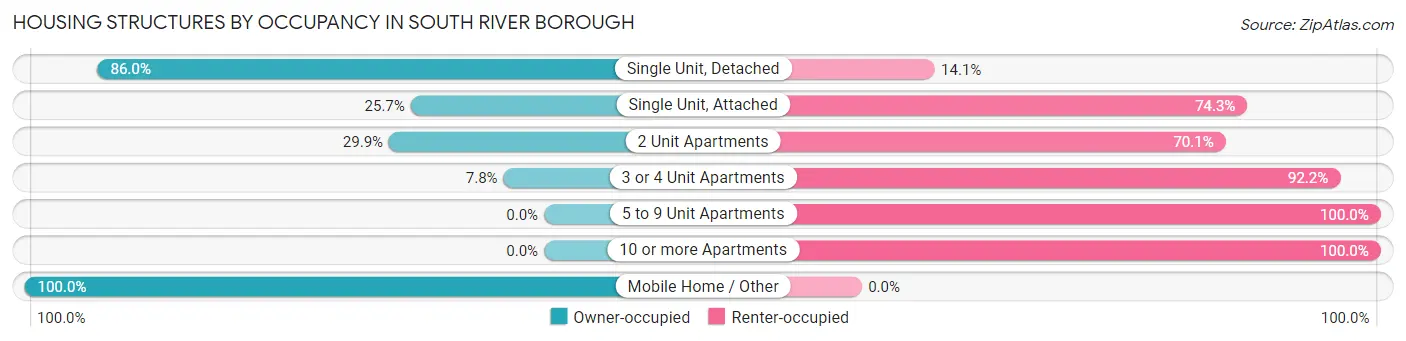
| Structure Type | Owner-occupied | Renter-occupied |
| Single Unit, Detached | 3,384 (86.0%) | 553 (14.1%) |
| Single Unit, Attached | 19 (25.7%) | 55 (74.3%) |
| 2 Unit Apartments | 195 (29.9%) | 458 (70.1%) |
| 3 or 4 Unit Apartments | 15 (7.8%) | 177 (92.2%) |
| 5 to 9 Unit Apartments | 0 (0.0%) | 183 (100.0%) |
| 10 or more Apartments | 0 (0.0%) | 505 (100.0%) |
| Mobile Home / Other | 11 (100.0%) | 0 (0.0%) |
| Total | 3,624 (65.2%) | 1,931 (34.8%) |
Housing Structures by Number of Rooms in South River borough
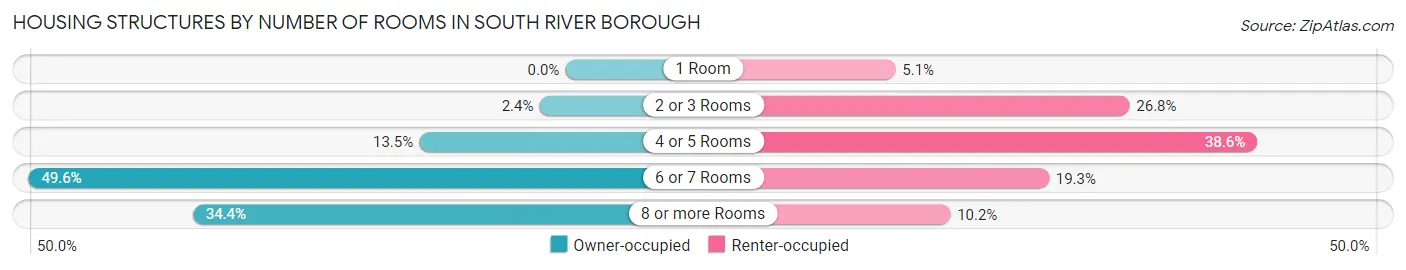
| Number of Rooms | Owner-occupied | Renter-occupied |
| 1 Room | 0 (0.0%) | 99 (5.1%) |
| 2 or 3 Rooms | 87 (2.4%) | 517 (26.8%) |
| 4 or 5 Rooms | 490 (13.5%) | 745 (38.6%) |
| 6 or 7 Rooms | 1,799 (49.6%) | 373 (19.3%) |
| 8 or more Rooms | 1,248 (34.4%) | 197 (10.2%) |
| Total | 3,624 (100.0%) | 1,931 (100.0%) |
Housing Structure by Heating Type in South River borough
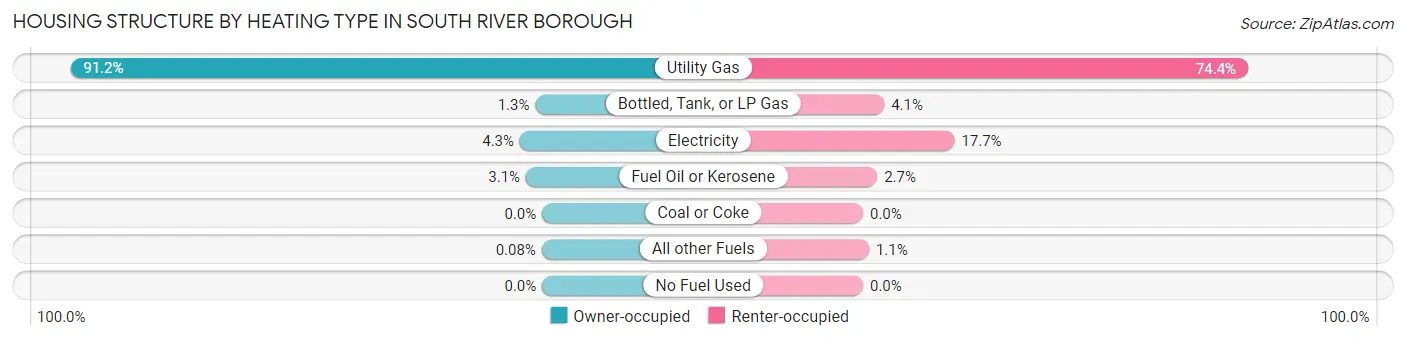
| Heating Type | Owner-occupied | Renter-occupied |
| Utility Gas | 3,304 (91.2%) | 1,436 (74.4%) |
| Bottled, Tank, or LP Gas | 48 (1.3%) | 79 (4.1%) |
| Electricity | 156 (4.3%) | 341 (17.7%) |
| Fuel Oil or Kerosene | 113 (3.1%) | 53 (2.7%) |
| Coal or Coke | 0 (0.0%) | 0 (0.0%) |
| All other Fuels | 3 (0.1%) | 22 (1.1%) |
| No Fuel Used | 0 (0.0%) | 0 (0.0%) |
| Total | 3,624 (100.0%) | 1,931 (100.0%) |
Household Vehicle Usage in South River borough
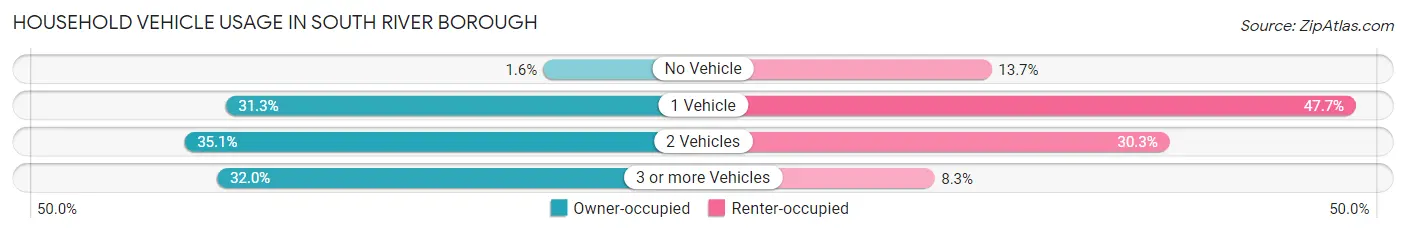
| Vehicles per Household | Owner-occupied | Renter-occupied |
| No Vehicle | 58 (1.6%) | 264 (13.7%) |
| 1 Vehicle | 1,133 (31.3%) | 921 (47.7%) |
| 2 Vehicles | 1,272 (35.1%) | 585 (30.3%) |
| 3 or more Vehicles | 1,161 (32.0%) | 161 (8.3%) |
| Total | 3,624 (100.0%) | 1,931 (100.0%) |
Real Estate & Mortgages in South River borough
Real Estate and Mortgage Overview in South River borough
| Characteristic | Without Mortgage | With Mortgage |
| Housing Units | 1,437 | 2,187 |
| Median Property Value | $343,600 | $374,200 |
| Median Household Income | $92,656 | $688 |
| Monthly Housing Costs | $951 | $546 |
| Real Estate Taxes | $7,342 | $37 |
Property Value by Mortgage Status in South River borough
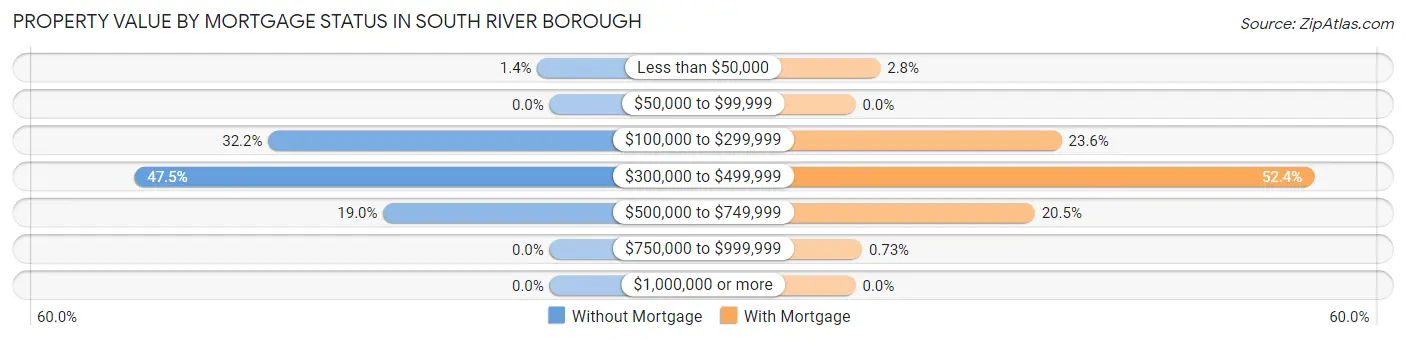
| Property Value | Without Mortgage | With Mortgage |
| Less than $50,000 | 20 (1.4%) | 62 (2.8%) |
| $50,000 to $99,999 | 0 (0.0%) | 0 (0.0%) |
| $100,000 to $299,999 | 462 (32.2%) | 515 (23.5%) |
| $300,000 to $499,999 | 682 (47.5%) | 1,146 (52.4%) |
| $500,000 to $749,999 | 273 (19.0%) | 448 (20.5%) |
| $750,000 to $999,999 | 0 (0.0%) | 16 (0.7%) |
| $1,000,000 or more | 0 (0.0%) | 0 (0.0%) |
| Total | 1,437 (100.0%) | 2,187 (100.0%) |
Household Income by Mortgage Status in South River borough
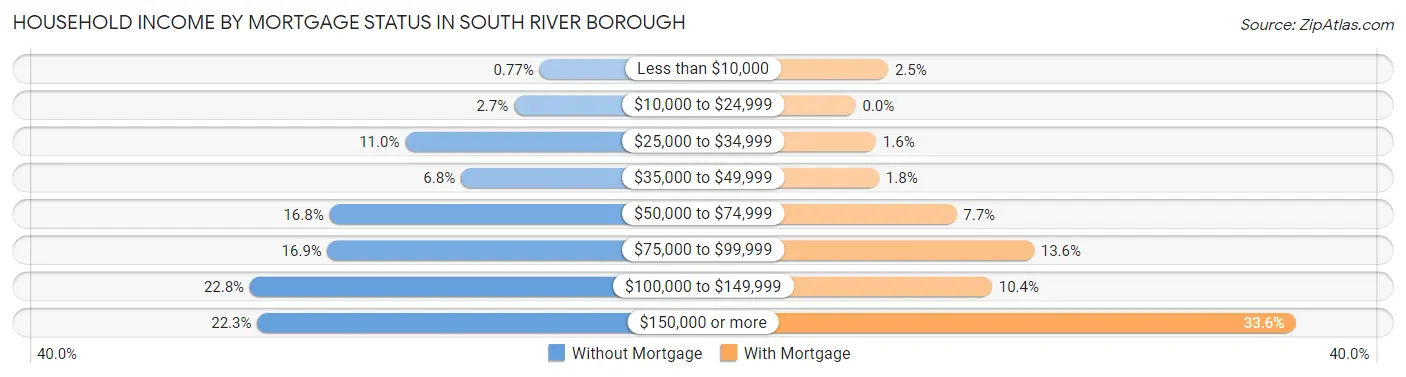
| Household Income | Without Mortgage | With Mortgage |
| Less than $10,000 | 11 (0.8%) | 54 (2.5%) |
| $10,000 to $24,999 | 39 (2.7%) | 0 (0.0%) |
| $25,000 to $34,999 | 158 (11.0%) | 34 (1.5%) |
| $35,000 to $49,999 | 97 (6.8%) | 39 (1.8%) |
| $50,000 to $74,999 | 241 (16.8%) | 168 (7.7%) |
| $75,000 to $99,999 | 243 (16.9%) | 297 (13.6%) |
| $100,000 to $149,999 | 328 (22.8%) | 227 (10.4%) |
| $150,000 or more | 320 (22.3%) | 734 (33.6%) |
| Total | 1,437 (100.0%) | 2,187 (100.0%) |
Property Value to Household Income Ratio in South River borough
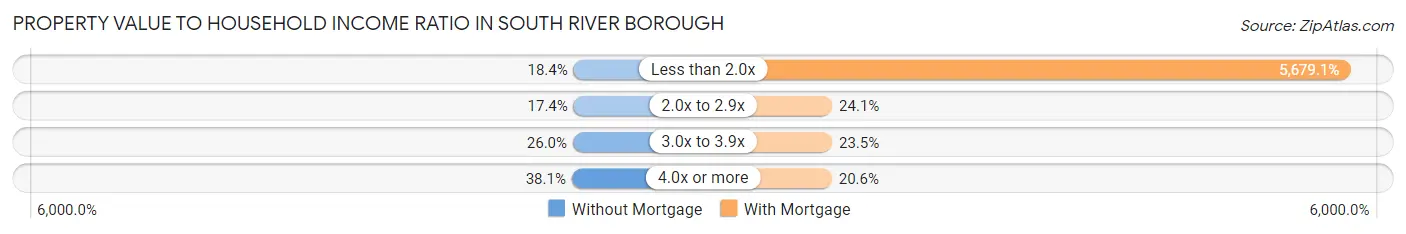
| Value-to-Income Ratio | Without Mortgage | With Mortgage |
| Less than 2.0x | 265 (18.4%) | 124,201 (5,679.1%) |
| 2.0x to 2.9x | 250 (17.4%) | 526 (24.0%) |
| 3.0x to 3.9x | 373 (26.0%) | 514 (23.5%) |
| 4.0x or more | 548 (38.1%) | 451 (20.6%) |
| Total | 1,437 (100.0%) | 2,187 (100.0%) |
Real Estate Taxes by Mortgage Status in South River borough
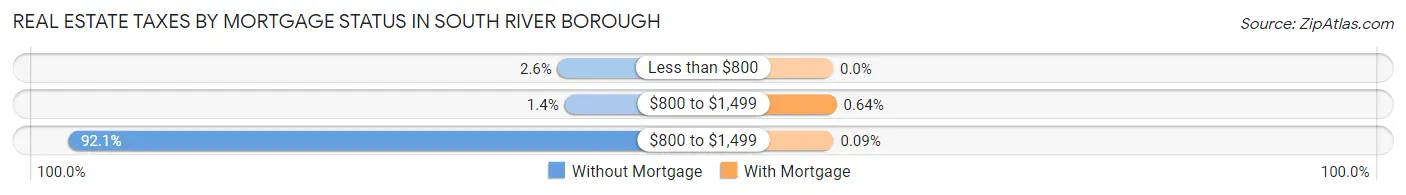
| Property Taxes | Without Mortgage | With Mortgage |
| Less than $800 | 38 (2.6%) | 0 (0.0%) |
| $800 to $1,499 | 20 (1.4%) | 14 (0.6%) |
| $800 to $1,499 | 1,323 (92.1%) | 2 (0.1%) |
| Total | 1,437 (100.0%) | 2,187 (100.0%) |
Health & Disability in South River borough
Health Insurance Coverage by Age in South River borough
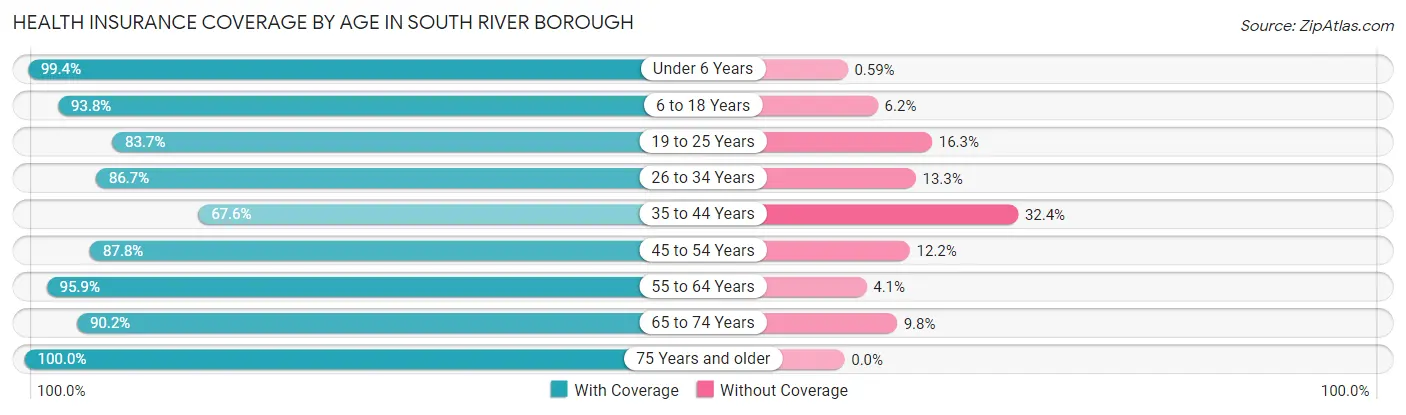
| Age Bracket | With Coverage | Without Coverage |
| Under 6 Years | 1,356 (99.4%) | 8 (0.6%) |
| 6 to 18 Years | 2,399 (93.8%) | 159 (6.2%) |
| 19 to 25 Years | 975 (83.7%) | 190 (16.3%) |
| 26 to 34 Years | 1,847 (86.7%) | 283 (13.3%) |
| 35 to 44 Years | 1,710 (67.6%) | 819 (32.4%) |
| 45 to 54 Years | 1,694 (87.8%) | 235 (12.2%) |
| 55 to 64 Years | 2,058 (95.9%) | 88 (4.1%) |
| 65 to 74 Years | 1,081 (90.2%) | 117 (9.8%) |
| 75 Years and older | 1,062 (100.0%) | 0 (0.0%) |
| Total | 14,182 (88.2%) | 1,899 (11.8%) |
Health Insurance Coverage by Citizenship Status in South River borough
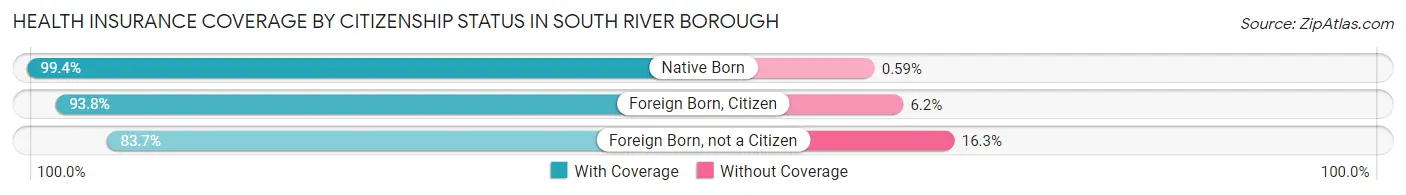
| Citizenship Status | With Coverage | Without Coverage |
| Native Born | 1,356 (99.4%) | 8 (0.6%) |
| Foreign Born, Citizen | 2,399 (93.8%) | 159 (6.2%) |
| Foreign Born, not a Citizen | 975 (83.7%) | 190 (16.3%) |
Health Insurance Coverage by Household Income in South River borough
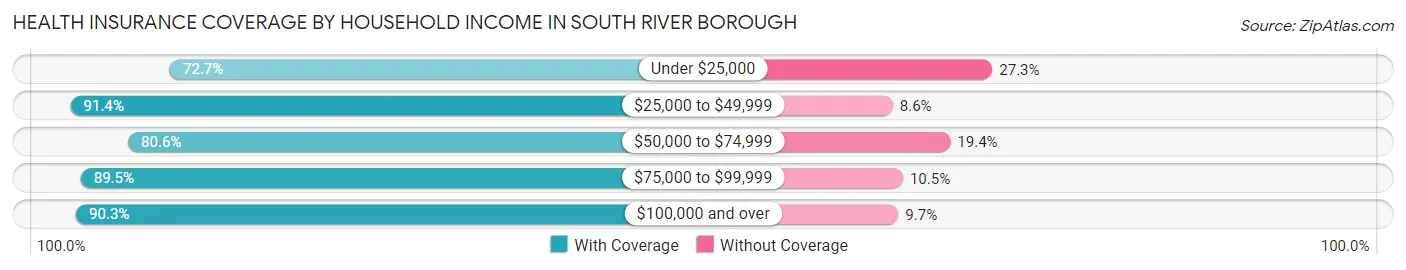
| Household Income | With Coverage | Without Coverage |
| Under $25,000 | 632 (72.7%) | 237 (27.3%) |
| $25,000 to $49,999 | 1,980 (91.4%) | 187 (8.6%) |
| $50,000 to $74,999 | 1,611 (80.6%) | 388 (19.4%) |
| $75,000 to $99,999 | 1,878 (89.5%) | 221 (10.5%) |
| $100,000 and over | 8,063 (90.3%) | 863 (9.7%) |
Public vs Private Health Insurance Coverage by Age in South River borough
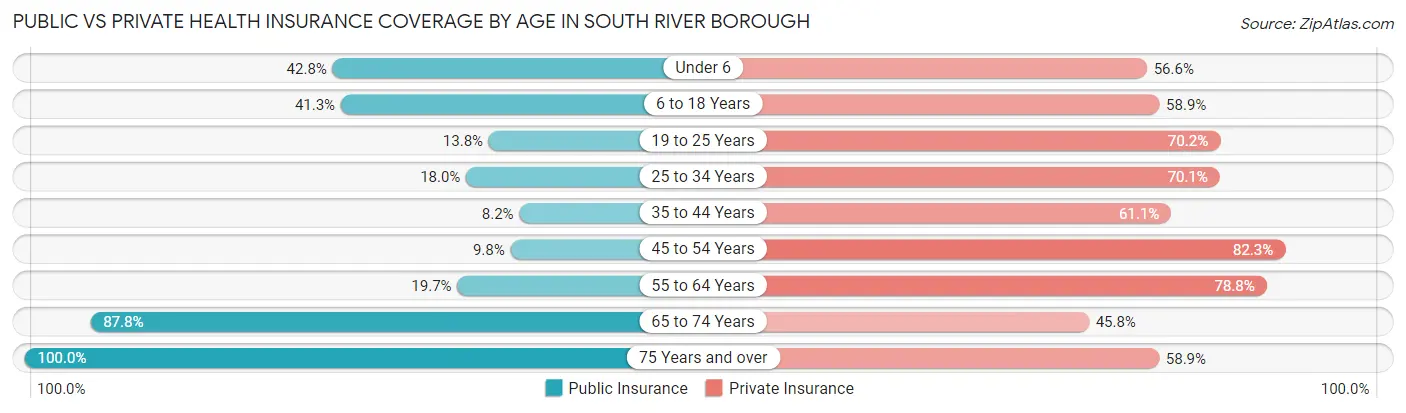
| Age Bracket | Public Insurance | Private Insurance |
| Under 6 | 584 (42.8%) | 772 (56.6%) |
| 6 to 18 Years | 1,056 (41.3%) | 1,507 (58.9%) |
| 19 to 25 Years | 161 (13.8%) | 818 (70.2%) |
| 25 to 34 Years | 384 (18.0%) | 1,494 (70.1%) |
| 35 to 44 Years | 206 (8.2%) | 1,546 (61.1%) |
| 45 to 54 Years | 189 (9.8%) | 1,587 (82.3%) |
| 55 to 64 Years | 422 (19.7%) | 1,692 (78.8%) |
| 65 to 74 Years | 1,052 (87.8%) | 549 (45.8%) |
| 75 Years and over | 1,062 (100.0%) | 625 (58.9%) |
| Total | 5,116 (31.8%) | 10,590 (65.8%) |
Disability Status by Sex by Age in South River borough
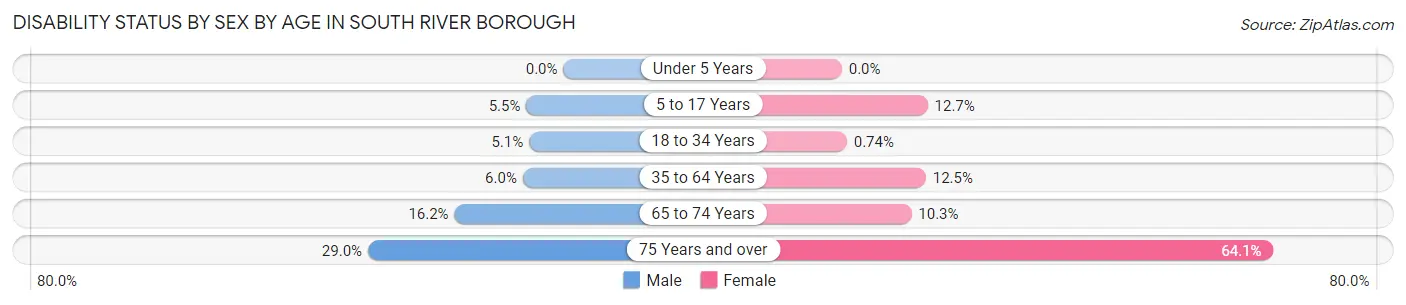
| Age Bracket | Male | Female |
| Under 5 Years | 0 (0.0%) | 0 (0.0%) |
| 5 to 17 Years | 77 (5.5%) | 160 (12.7%) |
| 18 to 34 Years | 96 (5.1%) | 11 (0.7%) |
| 35 to 64 Years | 198 (6.0%) | 414 (12.5%) |
| 65 to 74 Years | 92 (16.2%) | 65 (10.3%) |
| 75 Years and over | 128 (29.0%) | 398 (64.1%) |
Disability Class by Sex by Age in South River borough
Disability Class: Hearing Difficulty
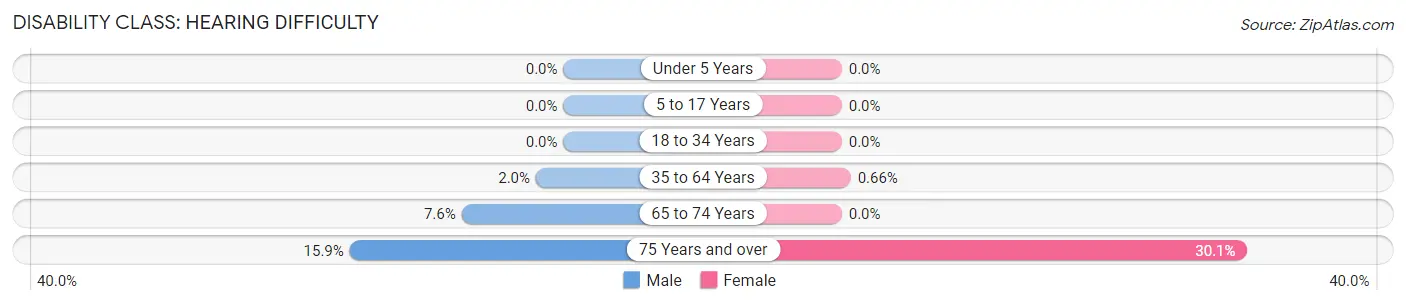
| Age Bracket | Male | Female |
| Under 5 Years | 0 (0.0%) | 0 (0.0%) |
| 5 to 17 Years | 0 (0.0%) | 0 (0.0%) |
| 18 to 34 Years | 0 (0.0%) | 0 (0.0%) |
| 35 to 64 Years | 67 (2.0%) | 22 (0.7%) |
| 65 to 74 Years | 43 (7.6%) | 0 (0.0%) |
| 75 Years and over | 70 (15.9%) | 187 (30.1%) |
Disability Class: Vision Difficulty
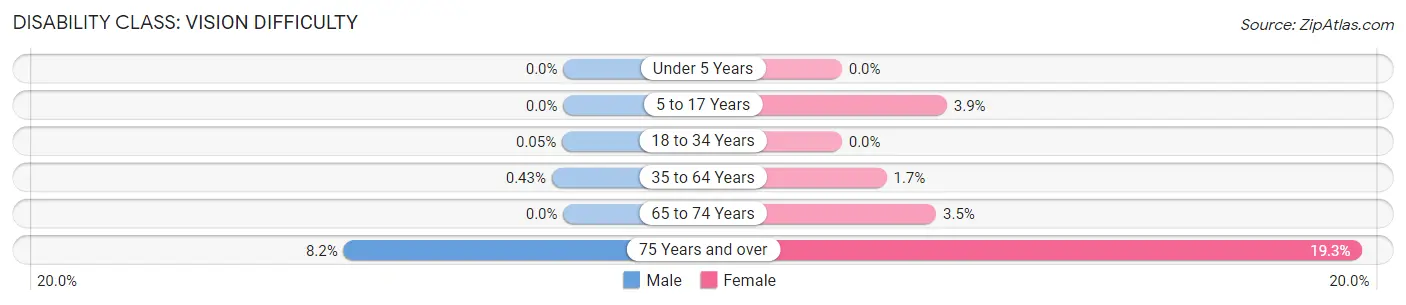
| Age Bracket | Male | Female |
| Under 5 Years | 0 (0.0%) | 0 (0.0%) |
| 5 to 17 Years | 0 (0.0%) | 49 (3.9%) |
| 18 to 34 Years | 1 (0.1%) | 0 (0.0%) |
| 35 to 64 Years | 14 (0.4%) | 55 (1.7%) |
| 65 to 74 Years | 0 (0.0%) | 22 (3.5%) |
| 75 Years and over | 36 (8.2%) | 120 (19.3%) |
Disability Class: Cognitive Difficulty
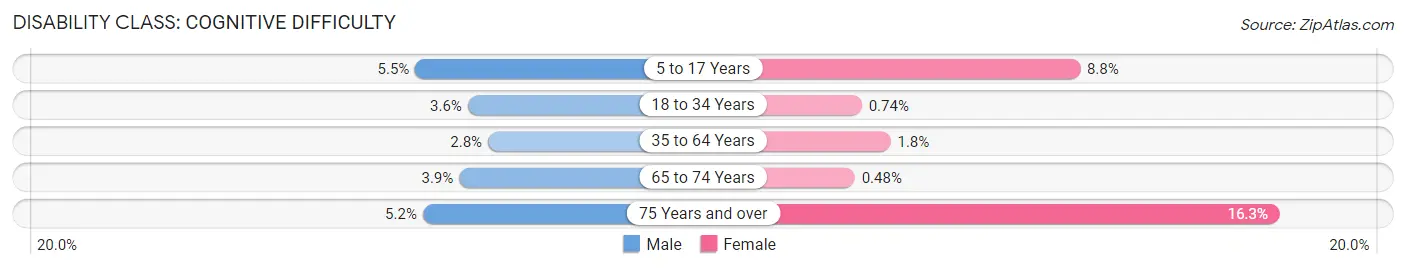
| Age Bracket | Male | Female |
| 5 to 17 Years | 77 (5.5%) | 111 (8.8%) |
| 18 to 34 Years | 67 (3.5%) | 11 (0.7%) |
| 35 to 64 Years | 92 (2.8%) | 60 (1.8%) |
| 65 to 74 Years | 22 (3.9%) | 3 (0.5%) |
| 75 Years and over | 23 (5.2%) | 101 (16.3%) |
Disability Class: Ambulatory Difficulty
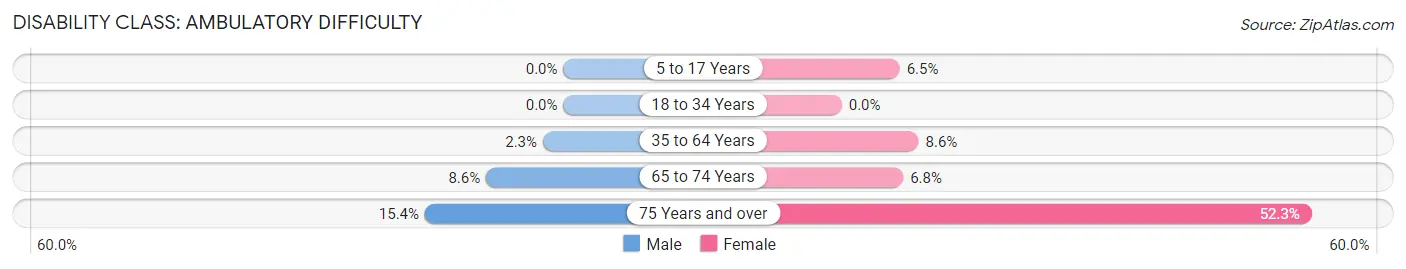
| Age Bracket | Male | Female |
| 5 to 17 Years | 0 (0.0%) | 81 (6.5%) |
| 18 to 34 Years | 0 (0.0%) | 0 (0.0%) |
| 35 to 64 Years | 75 (2.3%) | 284 (8.6%) |
| 65 to 74 Years | 49 (8.6%) | 43 (6.8%) |
| 75 Years and over | 68 (15.4%) | 325 (52.3%) |
Disability Class: Self-Care Difficulty
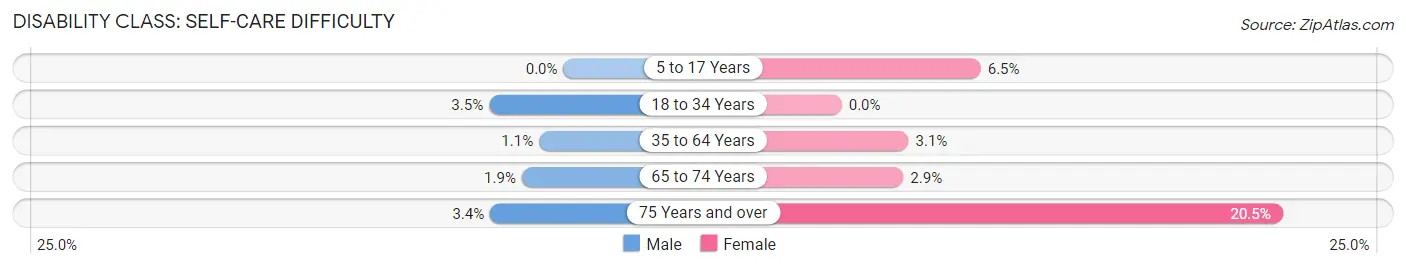
| Age Bracket | Male | Female |
| 5 to 17 Years | 0 (0.0%) | 81 (6.5%) |
| 18 to 34 Years | 65 (3.5%) | 0 (0.0%) |
| 35 to 64 Years | 37 (1.1%) | 103 (3.1%) |
| 65 to 74 Years | 11 (1.9%) | 18 (2.9%) |
| 75 Years and over | 15 (3.4%) | 127 (20.4%) |
Technology Access in South River borough
Computing Device Access in South River borough
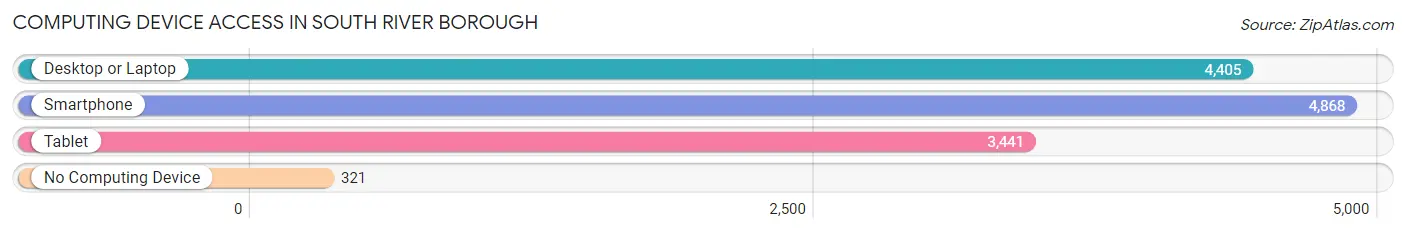
| Device Type | # Households | % Households |
| Desktop or Laptop | 4,405 | 79.3% |
| Smartphone | 4,868 | 87.6% |
| Tablet | 3,441 | 61.9% |
| No Computing Device | 321 | 5.8% |
| Total | 5,555 | 100.0% |
Internet Access in South River borough
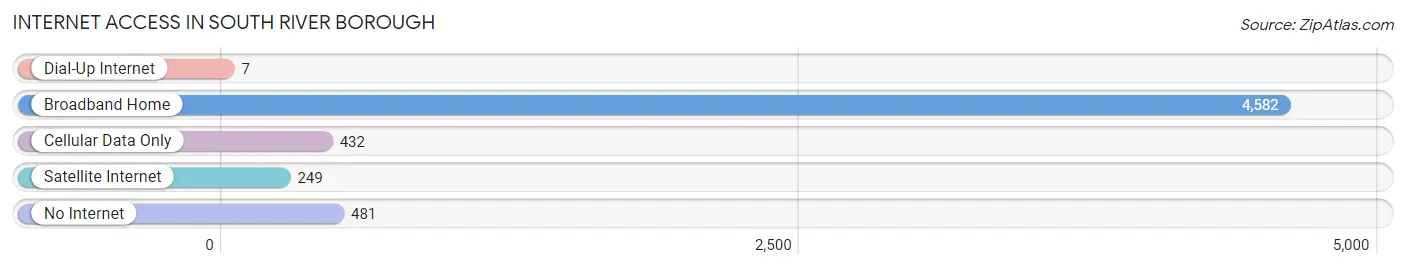
| Internet Type | # Households | % Households |
| Dial-Up Internet | 7 | 0.1% |
| Broadband Home | 4,582 | 82.5% |
| Cellular Data Only | 432 | 7.8% |
| Satellite Internet | 249 | 4.5% |
| No Internet | 481 | 8.7% |
| Total | 5,555 | 100.0% |
South River borough Summary
Introduction
South River Borough is a small borough located in Middlesex County, New Jersey. It is situated on the Raritan River, which is a major tributary of the Hudson River. The borough is home to a population of 16,008 people, according to the 2010 United States Census. South River Borough is a diverse community with a rich history and a vibrant economy.
History
South River Borough was originally inhabited by the Lenape Native Americans. The area was first settled by Europeans in the late 17th century. The first settlers were Dutch and English immigrants who established farms and mills along the Raritan River. The area was known as Washington, after General George Washington, who visited the area in 1777. In 1871, the area was incorporated as South River Borough.
The borough experienced significant growth in the late 19th and early 20th centuries. The population increased from 1,000 in 1880 to over 10,000 by 1920. This growth was due to the development of the area’s industrial and commercial sectors. The borough was home to several factories, including the South River Manufacturing Company, which produced textiles, and the South River Iron Works, which produced iron products.
Geography
South River Borough is located in central New Jersey, approximately 25 miles south of Newark. The borough is situated on the Raritan River, which is a major tributary of the Hudson River. The borough is bordered by East Brunswick Township to the north, Sayreville Borough to the south, and Old Bridge Township to the west. The borough covers an area of 2.7 square miles, with a population density of 5,945 people per square mile.
The borough is home to several parks and recreational areas, including the South River Park, which features a playground, picnic area, and walking trails. The borough also has several historic sites, including the South River Museum, which is housed in a former firehouse.
Economy
South River Borough has a diverse economy, with a mix of industrial, commercial, and residential businesses. The borough is home to several manufacturing companies, including the South River Manufacturing Company, which produces textiles, and the South River Iron Works, which produces iron products. The borough is also home to several retail stores, restaurants, and other businesses.
The borough’s largest employer is the South River Public School District, which employs over 1,000 people. Other major employers include the South River Police Department, the South River Fire Department, and the South River Municipal Utilities Authority.
Demographics
According to the 2010 United States Census, South River Borough has a population of 16,008 people. The population is racially diverse, with a majority of the population (62.3%) being white, followed by Hispanic or Latino (17.2%), African American (13.2%), and Asian (5.3%). The median household income is $60,945, and the median age is 40.7 years.
Conclusion
South River Borough is a small borough located in Middlesex County, New Jersey. It is situated on the Raritan River, which is a major tributary of the Hudson River. The borough is home to a population of 16,008 people, according to the 2010 United States Census. South River Borough is a diverse community with a rich history and a vibrant economy. The borough is home to several manufacturing companies, retail stores, restaurants, and other businesses. The population is racially diverse, with a majority of the population being white, followed by Hispanic or Latino, African American, and Asian. The median household income is $60,945, and the median age is 40.7 years.
Common Questions
What is Per Capita Income in South River borough?
Per Capita income in South River borough is $40,055.
What is the Median Family Income in South River borough?
Median Family Income in South River borough is $104,092.
What is the Median Household income in South River borough?
Median Household Income in South River borough is $95,981.
What is Income or Wage Gap in South River borough?
Income or Wage Gap in South River borough is 43.9%.
Women in South River borough earn 56.1 cents for every dollar earned by a man.
What is Inequality or Gini Index in South River borough?
Inequality or Gini Index in South River borough is 0.41.
What is the Total Population of South River borough?
Total Population of South River borough is 16,081.
What is the Total Male Population of South River borough?
Total Male Population of South River borough is 8,126.
What is the Total Female Population of South River borough?
Total Female Population of South River borough is 7,955.
What is the Ratio of Males per 100 Females in South River borough?
There are 102.15 Males per 100 Females in South River borough.
What is the Ratio of Females per 100 Males in South River borough?
There are 97.90 Females per 100 Males in South River borough.
What is the Median Population Age in South River borough?
Median Population Age in South River borough is 37.1 Years.
What is the Average Family Size in South River borough
Average Family Size in South River borough is 3.3 People.
What is the Average Household Size in South River borough
Average Household Size in South River borough is 2.9 People.
How Large is the Labor Force in South River borough?
There are 8,780 People in the Labor Forcein in South River borough.
What is the Percentage of People in the Labor Force in South River borough?
68.9% of People are in the Labor Force in South River borough.
What is the Unemployment Rate in South River borough?
Unemployment Rate in South River borough is 10.3%.