Bergenfield borough, NJ Map & Demographics
Bergenfield borough Overview
$44,580
PER CAPITA INCOME
$134,980
AVG FAMILY INCOME
$121,738
AVG HOUSEHOLD INCOME
32.2%
WAGE / INCOME GAP [ % ]
67.8¢/ $1
WAGE / INCOME GAP [ $ ]
0.41
INEQUALITY / GINI INDEX
28,223
TOTAL POPULATION
14,005
MALE POPULATION
14,218
FEMALE POPULATION
98.50
MALES / 100 FEMALES
101.52
FEMALES / 100 MALES
40.5
MEDIAN AGE
3.5
AVG FAMILY SIZE
3.0
AVG HOUSEHOLD SIZE
15,688
LABOR FORCE [ PEOPLE ]
68.7%
PERCENT IN LABOR FORCE
6.0%
UNEMPLOYMENT RATE
Income in Bergenfield borough
Income Overview in Bergenfield borough
Per Capita Income in Bergenfield borough is $44,580, while median incomes of families and households are $134,980 and $121,738 respectively.
| Characteristic | Number | Measure |
| Per Capita Income | 28,223 | $44,580 |
| Median Family Income | 7,129 | $134,980 |
| Mean Family Income | 7,129 | $151,980 |
| Median Household Income | 9,306 | $121,738 |
| Mean Household Income | 9,306 | $135,304 |
| Income Deficit | 7,129 | $0 |
| Wage / Income Gap (%) | 28,223 | 32.22% |
| Wage / Income Gap ($) | 28,223 | 67.78¢ per $1 |
| Gini / Inequality Index | 28,223 | 0.41 |
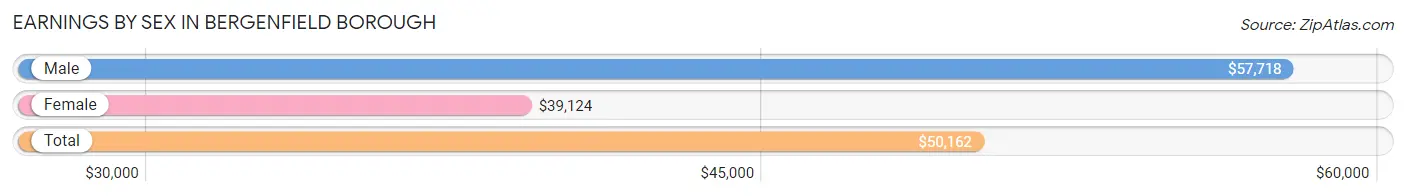
Earnings by Sex in Bergenfield borough
Average Earnings in Bergenfield borough are $50,162, $57,718 for men and $39,124 for women, a difference of 32.2%.
| Sex | Number | Average Earnings |
| Male | 8,565 (53.1%) | $57,718 |
| Female | 7,564 (46.9%) | $39,124 |
| Total | 16,129 (100.0%) | $50,162 |
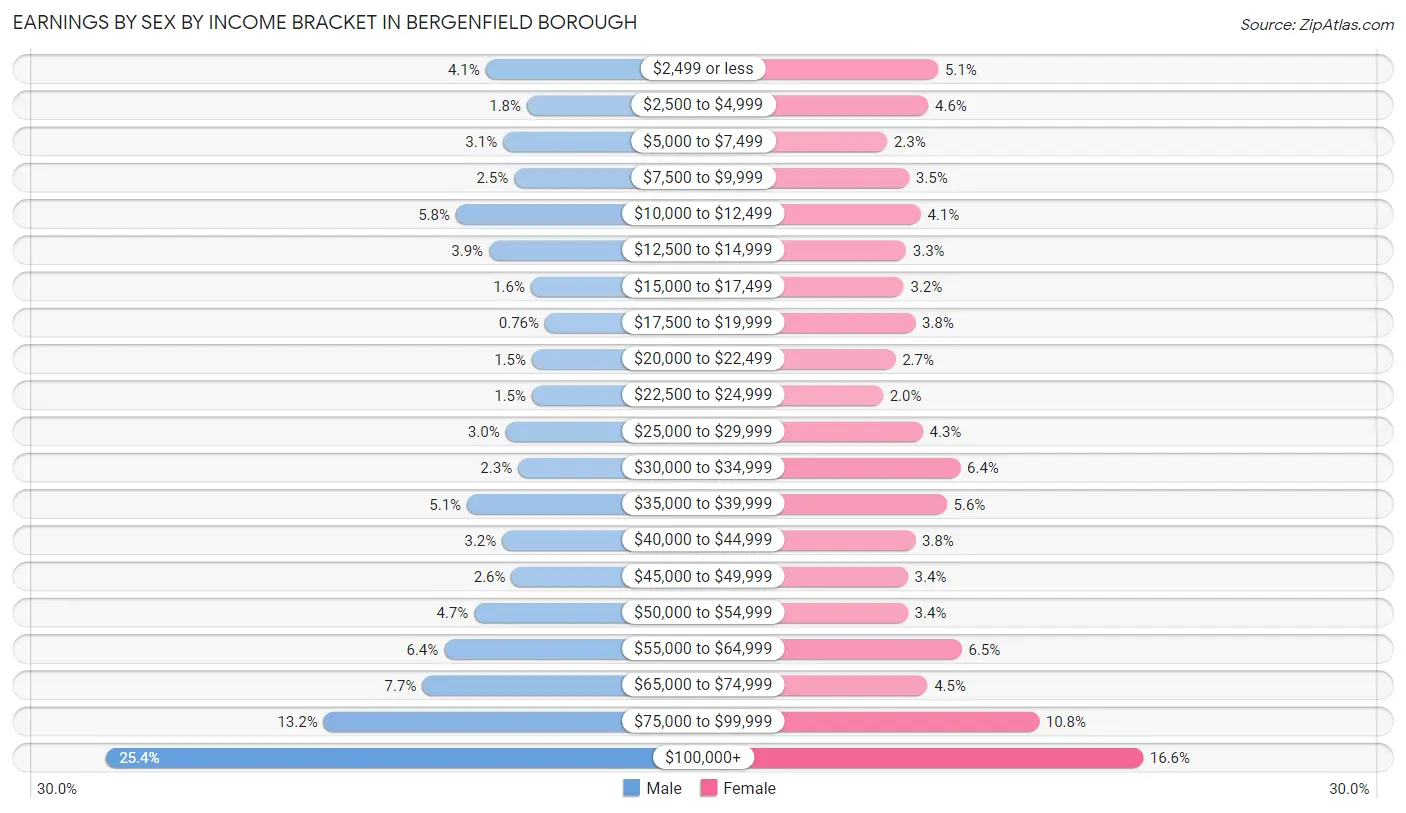
Earnings by Sex by Income Bracket in Bergenfield borough
The most common earnings brackets in Bergenfield borough are $100,000+ for men (2,176 | 25.4%) and $100,000+ for women (1,259 | 16.6%).
| Income | Male | Female |
| $2,499 or less | 350 (4.1%) | 388 (5.1%) |
| $2,500 to $4,999 | 152 (1.8%) | 346 (4.6%) |
| $5,000 to $7,499 | 266 (3.1%) | 171 (2.3%) |
| $7,500 to $9,999 | 213 (2.5%) | 264 (3.5%) |
| $10,000 to $12,499 | 493 (5.8%) | 313 (4.1%) |
| $12,500 to $14,999 | 334 (3.9%) | 251 (3.3%) |
| $15,000 to $17,499 | 133 (1.5%) | 241 (3.2%) |
| $17,500 to $19,999 | 65 (0.8%) | 290 (3.8%) |
| $20,000 to $22,499 | 128 (1.5%) | 206 (2.7%) |
| $22,500 to $24,999 | 128 (1.5%) | 153 (2.0%) |
| $25,000 to $29,999 | 254 (3.0%) | 322 (4.3%) |
| $30,000 to $34,999 | 194 (2.3%) | 482 (6.4%) |
| $35,000 to $39,999 | 440 (5.1%) | 424 (5.6%) |
| $40,000 to $44,999 | 271 (3.2%) | 290 (3.8%) |
| $45,000 to $49,999 | 226 (2.6%) | 259 (3.4%) |
| $50,000 to $54,999 | 406 (4.7%) | 259 (3.4%) |
| $55,000 to $64,999 | 550 (6.4%) | 488 (6.5%) |
| $65,000 to $74,999 | 655 (7.6%) | 342 (4.5%) |
| $75,000 to $99,999 | 1,131 (13.2%) | 816 (10.8%) |
| $100,000+ | 2,176 (25.4%) | 1,259 (16.6%) |
| Total | 8,565 (100.0%) | 7,564 (100.0%) |
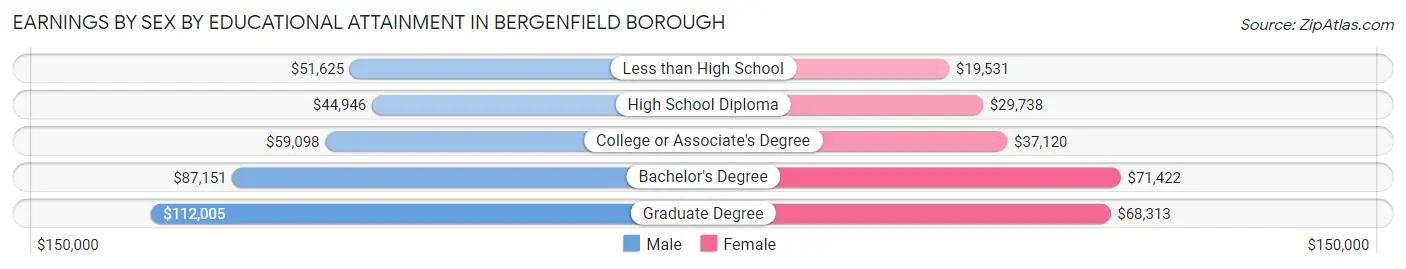
Earnings by Sex by Educational Attainment in Bergenfield borough
Average earnings in Bergenfield borough are $68,299 for men and $48,608 for women, a difference of 28.8%. Men with an educational attainment of graduate degree enjoy the highest average annual earnings of $112,005, while those with high school diploma education earn the least with $44,946. Women with an educational attainment of bachelor's degree earn the most with the average annual earnings of $71,422, while those with less than high school education have the smallest earnings of $19,531.
| Educational Attainment | Male Income | Female Income |
| Less than High School | $51,625 | $19,531 |
| High School Diploma | $44,946 | $29,738 |
| College or Associate's Degree | $59,098 | $37,120 |
| Bachelor's Degree | $87,151 | $71,422 |
| Graduate Degree | $112,005 | $68,313 |
| Total | $68,299 | $48,608 |
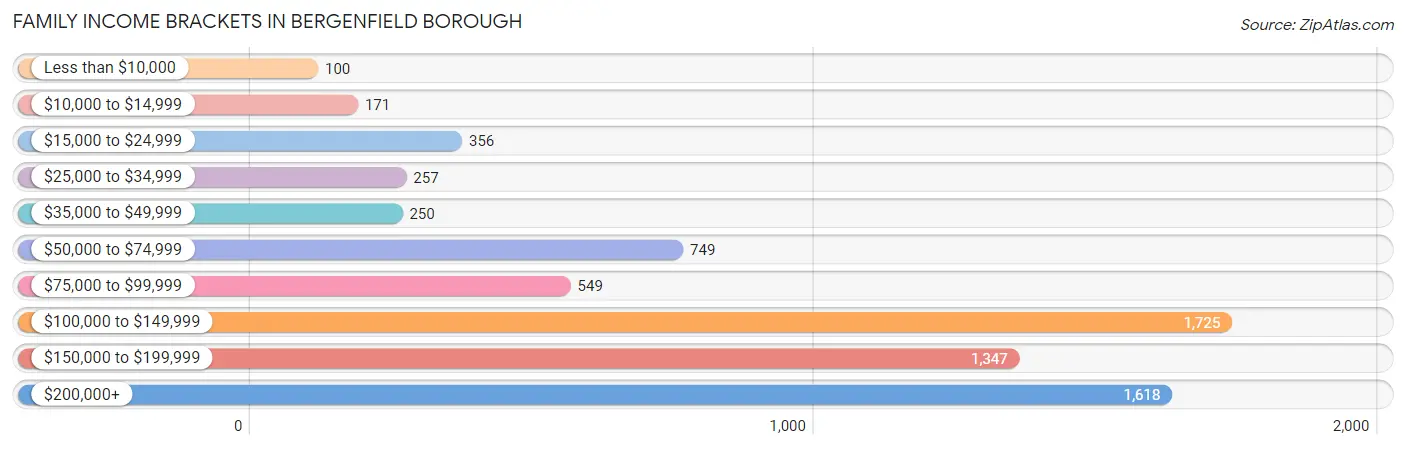
Family Income in Bergenfield borough
Family Income Brackets in Bergenfield borough
According to the Bergenfield borough family income data, there are 1,725 families falling into the $100,000 to $149,999 income range, which is the most common income bracket and makes up 24.2% of all families. Conversely, the less than $10,000 income bracket is the least frequent group with only 100 families (1.4%) belonging to this category.
| Income Bracket | # Families | % Families |
| Less than $10,000 | 100 | 1.4% |
| $10,000 to $14,999 | 171 | 2.4% |
| $15,000 to $24,999 | 356 | 5.0% |
| $25,000 to $34,999 | 257 | 3.6% |
| $35,000 to $49,999 | 250 | 3.5% |
| $50,000 to $74,999 | 749 | 10.5% |
| $75,000 to $99,999 | 549 | 7.7% |
| $100,000 to $149,999 | 1,725 | 24.2% |
| $150,000 to $199,999 | 1,347 | 18.9% |
| $200,000+ | 1,618 | 22.7% |
Family Income by Famaliy Size in Bergenfield borough
7+ person families (288 | 4.0%) account for the highest median family income in Bergenfield borough with $250,001 per family, while 2-person families (2,512 | 35.2%) have the highest median income of $44,905 per family member.
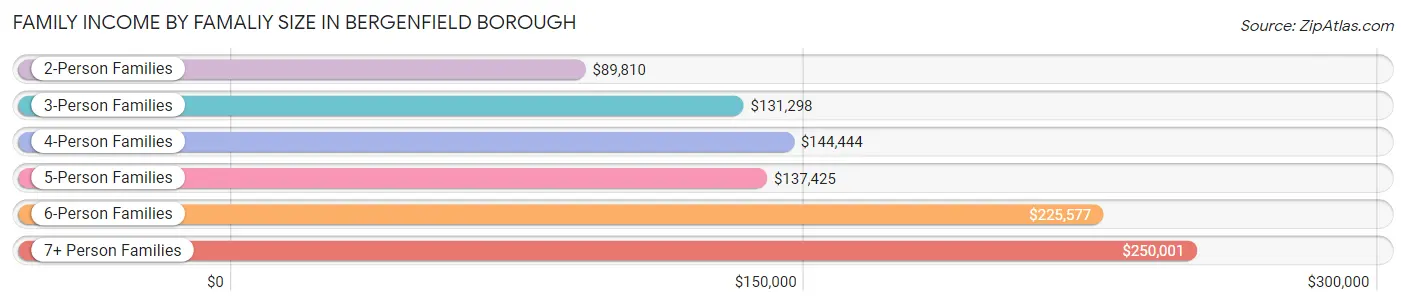
| Income Bracket | # Families | Median Income |
| 2-Person Families | 2,512 (35.2%) | $89,810 |
| 3-Person Families | 1,589 (22.3%) | $131,298 |
| 4-Person Families | 1,350 (18.9%) | $144,444 |
| 5-Person Families | 1,096 (15.4%) | $137,425 |
| 6-Person Families | 294 (4.1%) | $225,577 |
| 7+ Person Families | 288 (4.0%) | $250,001 |
| Total | 7,129 (100.0%) | $134,980 |
Family Income by Number of Earners in Bergenfield borough
The median family income in Bergenfield borough is $134,980, with families comprising 3+ earners (1,992) having the highest median family income of $181,761, while families with no earners (717) have the lowest median family income of $52,476, accounting for 27.9% and 10.1% of families, respectively.
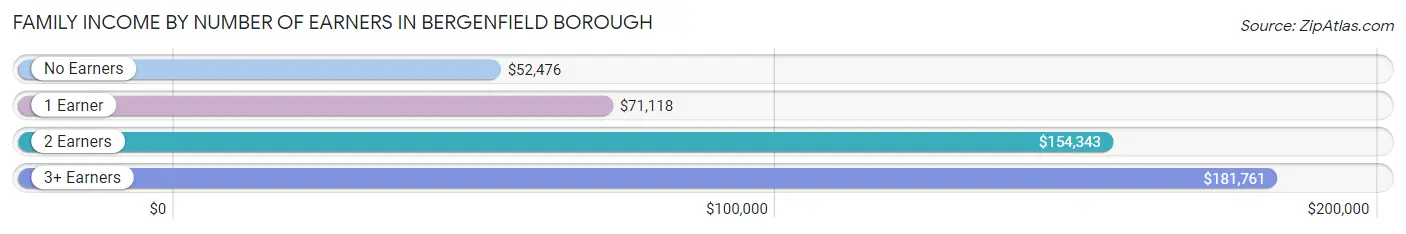
| Number of Earners | # Families | Median Income |
| No Earners | 717 (10.1%) | $52,476 |
| 1 Earner | 1,639 (23.0%) | $71,118 |
| 2 Earners | 2,781 (39.0%) | $154,343 |
| 3+ Earners | 1,992 (27.9%) | $181,761 |
| Total | 7,129 (100.0%) | $134,980 |
Household Income in Bergenfield borough
Household Income Brackets in Bergenfield borough
With 2,075 households falling in the category, the $100,000 to $149,999 income range is the most frequent in Bergenfield borough, accounting for 22.3% of all households. In contrast, only 168 households (1.8%) fall into the less than $10,000 income bracket, making it the least populous group.
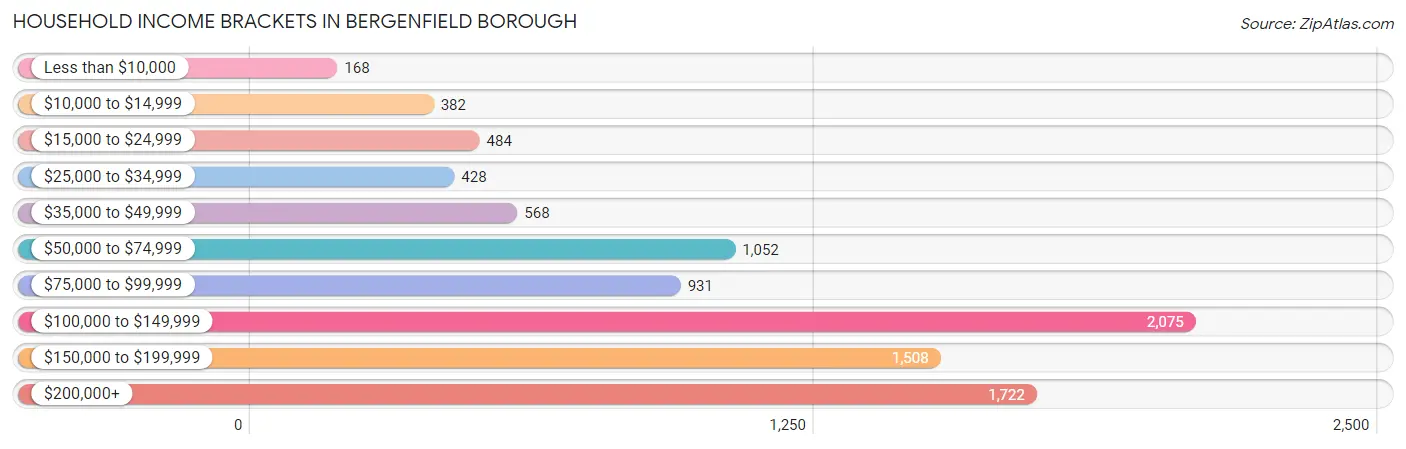
| Income Bracket | # Households | % Households |
| Less than $10,000 | 168 | 1.8% |
| $10,000 to $14,999 | 382 | 4.1% |
| $15,000 to $24,999 | 484 | 5.2% |
| $25,000 to $34,999 | 428 | 4.6% |
| $35,000 to $49,999 | 568 | 6.1% |
| $50,000 to $74,999 | 1,052 | 11.3% |
| $75,000 to $99,999 | 931 | 10.0% |
| $100,000 to $149,999 | 2,075 | 22.3% |
| $150,000 to $199,999 | 1,508 | 16.2% |
| $200,000+ | 1,722 | 18.5% |
Household Income by Householder Age in Bergenfield borough
The median household income in Bergenfield borough is $121,738, with the highest median household income of $135,369 found in the 45 to 64 years age bracket for the primary householder. A total of 3,755 households (40.4%) fall into this category. Meanwhile, the 15 to 24 years age bracket for the primary householder has the lowest median household income of $0, with 117 households (1.3%) in this group.
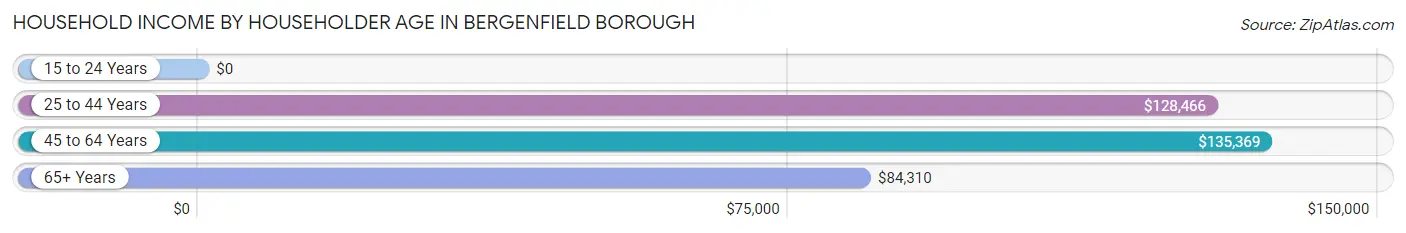
| Income Bracket | # Households | Median Income |
| 15 to 24 Years | 117 (1.3%) | $0 |
| 25 to 44 Years | 2,797 (30.1%) | $128,466 |
| 45 to 64 Years | 3,755 (40.4%) | $135,369 |
| 65+ Years | 2,637 (28.3%) | $84,310 |
| Total | 9,306 (100.0%) | $121,738 |
Poverty in Bergenfield borough
Income Below Poverty by Sex and Age in Bergenfield borough
With 4.2% poverty level for males and 8.9% for females among the residents of Bergenfield borough, 16 and 17 year old males and 5 year old females are the most vulnerable to poverty, with 40 males (11.7%) and 53 females (39.3%) in their respective age groups living below the poverty level.
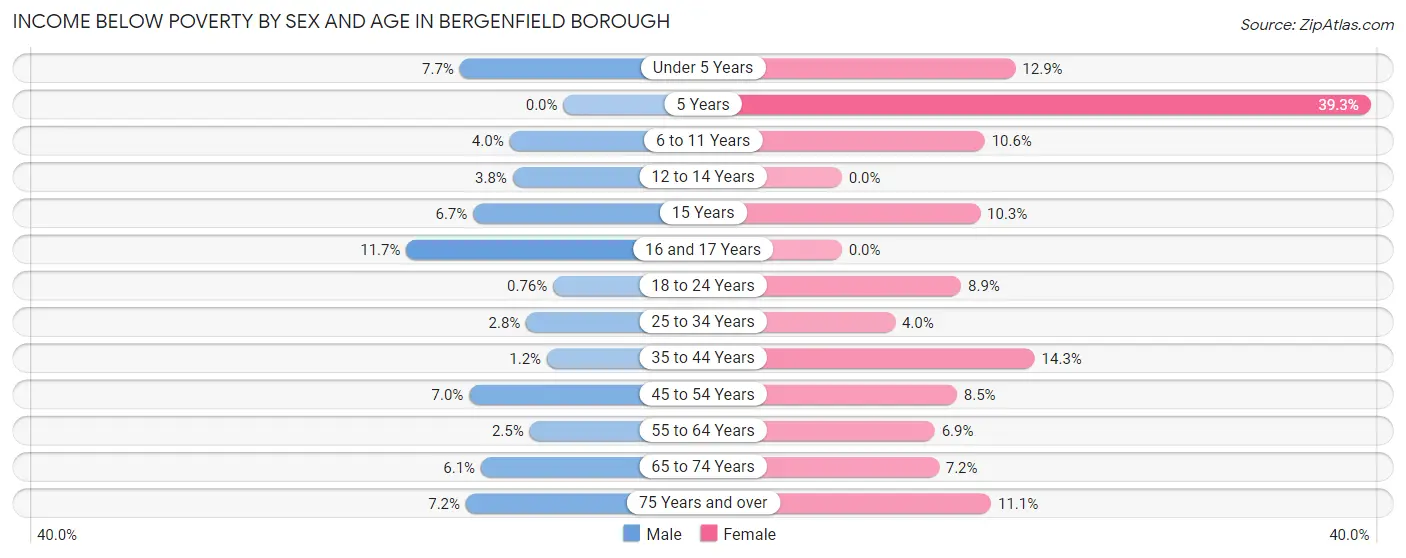
| Age Bracket | Male | Female |
| Under 5 Years | 81 (7.7%) | 90 (12.9%) |
| 5 Years | 0 (0.0%) | 53 (39.3%) |
| 6 to 11 Years | 34 (4.0%) | 104 (10.6%) |
| 12 to 14 Years | 21 (3.8%) | 0 (0.0%) |
| 15 Years | 15 (6.7%) | 19 (10.3%) |
| 16 and 17 Years | 40 (11.7%) | 0 (0.0%) |
| 18 to 24 Years | 10 (0.8%) | 134 (8.9%) |
| 25 to 34 Years | 51 (2.8%) | 63 (4.0%) |
| 35 to 44 Years | 21 (1.2%) | 272 (14.3%) |
| 45 to 54 Years | 118 (7.0%) | 146 (8.5%) |
| 55 to 64 Years | 51 (2.5%) | 145 (6.9%) |
| 65 to 74 Years | 85 (6.1%) | 122 (7.2%) |
| 75 Years and over | 51 (7.2%) | 118 (11.1%) |
| Total | 578 (4.2%) | 1,266 (8.9%) |
Income Above Poverty by Sex and Age in Bergenfield borough
According to the poverty statistics in Bergenfield borough, males aged 5 years and females aged 12 to 14 years are the age groups that are most secure financially, with 100.0% of males and 100.0% of females in these age groups living above the poverty line.
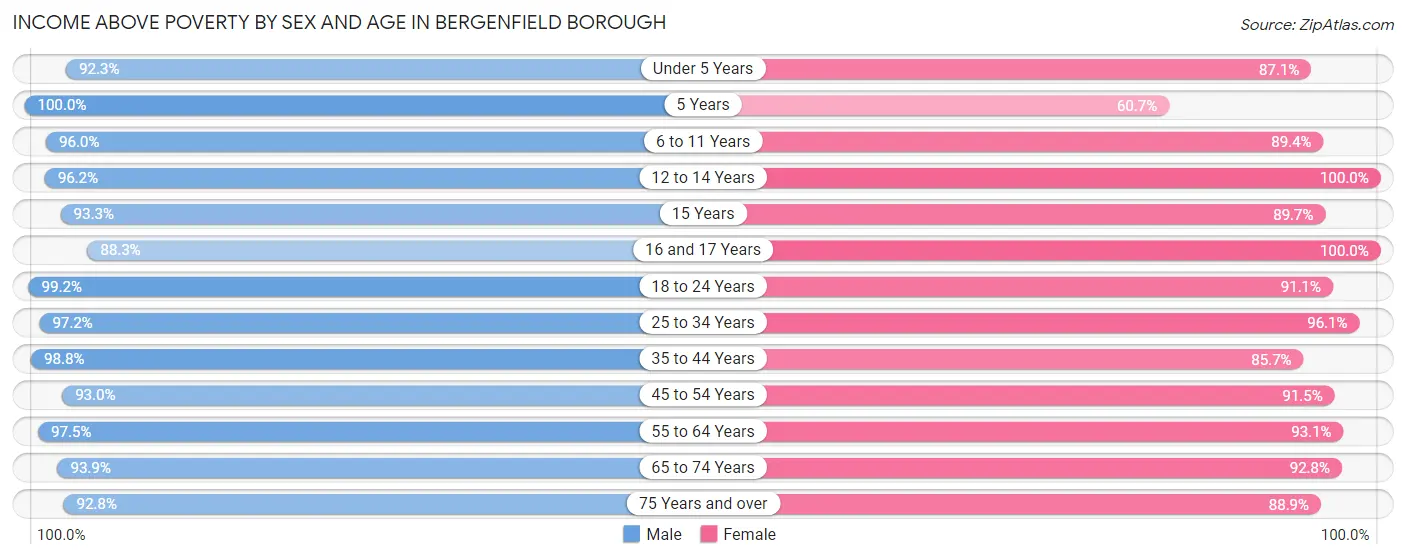
| Age Bracket | Male | Female |
| Under 5 Years | 971 (92.3%) | 608 (87.1%) |
| 5 Years | 206 (100.0%) | 82 (60.7%) |
| 6 to 11 Years | 815 (96.0%) | 876 (89.4%) |
| 12 to 14 Years | 538 (96.2%) | 412 (100.0%) |
| 15 Years | 209 (93.3%) | 166 (89.7%) |
| 16 and 17 Years | 303 (88.3%) | 204 (100.0%) |
| 18 to 24 Years | 1,308 (99.2%) | 1,379 (91.1%) |
| 25 to 34 Years | 1,799 (97.2%) | 1,532 (96.1%) |
| 35 to 44 Years | 1,706 (98.8%) | 1,628 (85.7%) |
| 45 to 54 Years | 1,571 (93.0%) | 1,563 (91.5%) |
| 55 to 64 Years | 1,983 (97.5%) | 1,957 (93.1%) |
| 65 to 74 Years | 1,304 (93.9%) | 1,572 (92.8%) |
| 75 Years and over | 653 (92.8%) | 947 (88.9%) |
| Total | 13,366 (95.9%) | 12,926 (91.1%) |
Income Below Poverty Among Married-Couple Families in Bergenfield borough
The poverty statistics for married-couple families in Bergenfield borough show that 3.4% or 186 of the total 5,411 families live below the poverty line. Families with 3 or 4 children have the highest poverty rate of 4.8%, comprising of 28 families. On the other hand, families with 5 or more children have the lowest poverty rate of 0.0%, which includes 0 families.
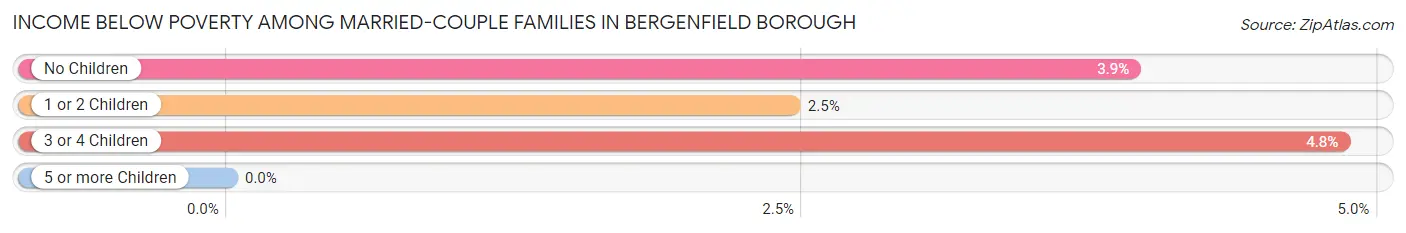
| Children | Above Poverty | Below Poverty |
| No Children | 2,665 (96.1%) | 109 (3.9%) |
| 1 or 2 Children | 1,948 (97.6%) | 49 (2.5%) |
| 3 or 4 Children | 551 (95.2%) | 28 (4.8%) |
| 5 or more Children | 61 (100.0%) | 0 (0.0%) |
| Total | 5,225 (96.6%) | 186 (3.4%) |
Income Below Poverty Among Single-Parent Households in Bergenfield borough
According to the poverty data in Bergenfield borough, 5.2% or 27 single-father households and 21.9% or 264 single-mother households are living below the poverty line. Among single-father households, those with no children have the highest poverty rate, with 27 households (7.5%) experiencing poverty. Likewise, among single-mother households, those with 1 or 2 children have the highest poverty rate, with 236 households (46.3%) falling below the poverty line.
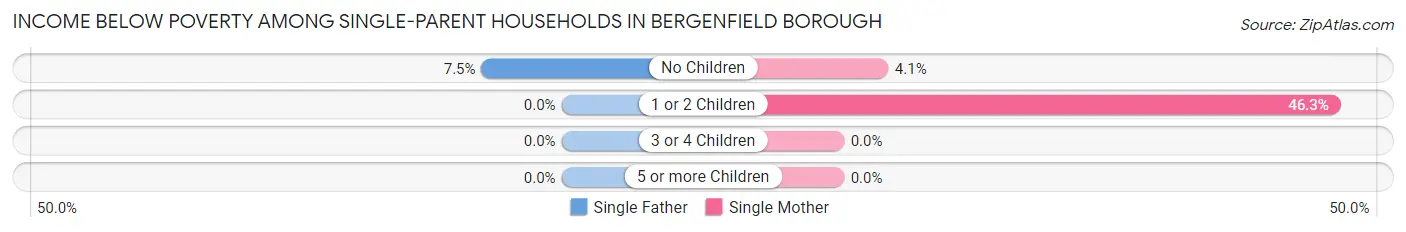
| Children | Single Father | Single Mother |
| No Children | 27 (7.5%) | 28 (4.1%) |
| 1 or 2 Children | 0 (0.0%) | 236 (46.3%) |
| 3 or 4 Children | 0 (0.0%) | 0 (0.0%) |
| 5 or more Children | 0 (0.0%) | 0 (0.0%) |
| Total | 27 (5.2%) | 264 (21.9%) |
Income Below Poverty Among Married-Couple vs Single-Parent Households in Bergenfield borough
The poverty data for Bergenfield borough shows that 186 of the married-couple family households (3.4%) and 291 of the single-parent households (16.9%) are living below the poverty level. Within the married-couple family households, those with 3 or 4 children have the highest poverty rate, with 28 households (4.8%) falling below the poverty line. Among the single-parent households, those with 1 or 2 children have the highest poverty rate, with 236 household (36.5%) living below poverty.
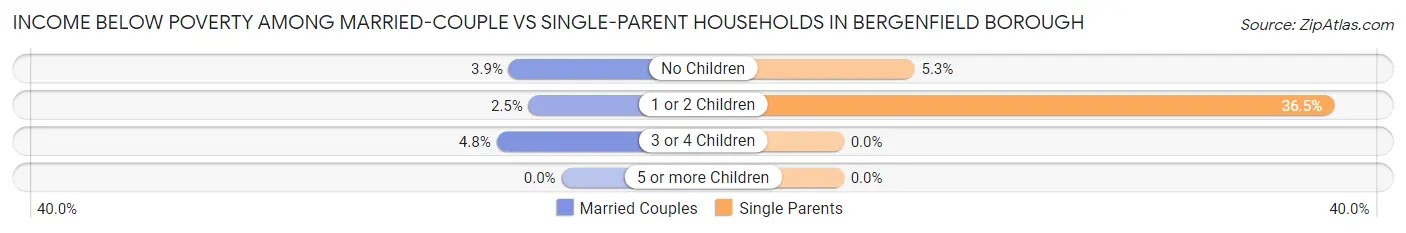
| Children | Married-Couple Families | Single-Parent Households |
| No Children | 109 (3.9%) | 55 (5.3%) |
| 1 or 2 Children | 49 (2.5%) | 236 (36.5%) |
| 3 or 4 Children | 28 (4.8%) | 0 (0.0%) |
| 5 or more Children | 0 (0.0%) | 0 (0.0%) |
| Total | 186 (3.4%) | 291 (16.9%) |
Race in Bergenfield borough
The most populous races in Bergenfield borough are White / Caucasian (13,237 | 46.9%), Hispanic or Latino (8,237 | 29.2%), and Asian (7,737 | 27.4%).
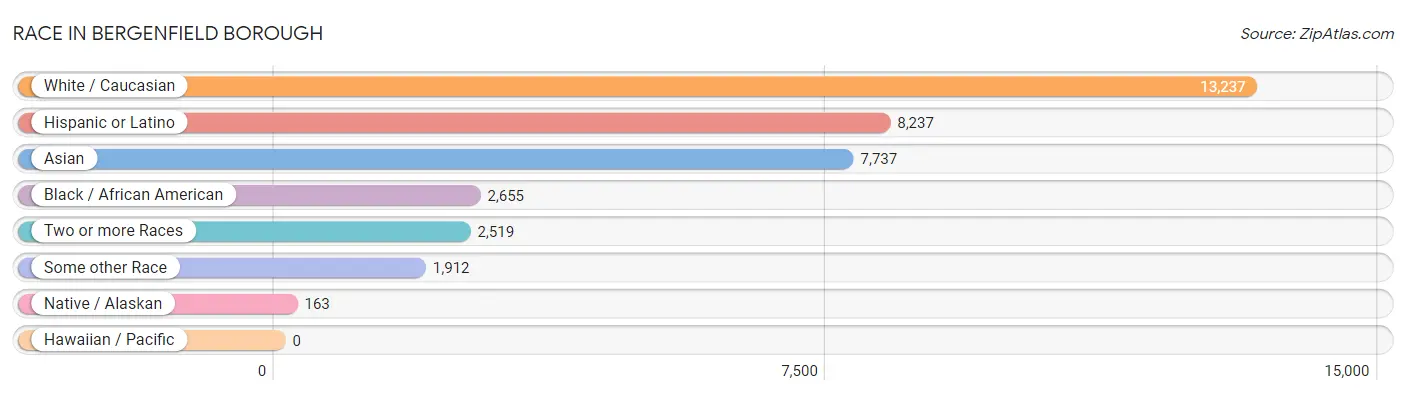
| Race | # Population | % Population |
| Asian | 7,737 | 27.4% |
| Black / African American | 2,655 | 9.4% |
| Hawaiian / Pacific | 0 | 0.0% |
| Hispanic or Latino | 8,237 | 29.2% |
| Native / Alaskan | 163 | 0.6% |
| White / Caucasian | 13,237 | 46.9% |
| Two or more Races | 2,519 | 8.9% |
| Some other Race | 1,912 | 6.8% |
| Total | 28,223 | 100.0% |
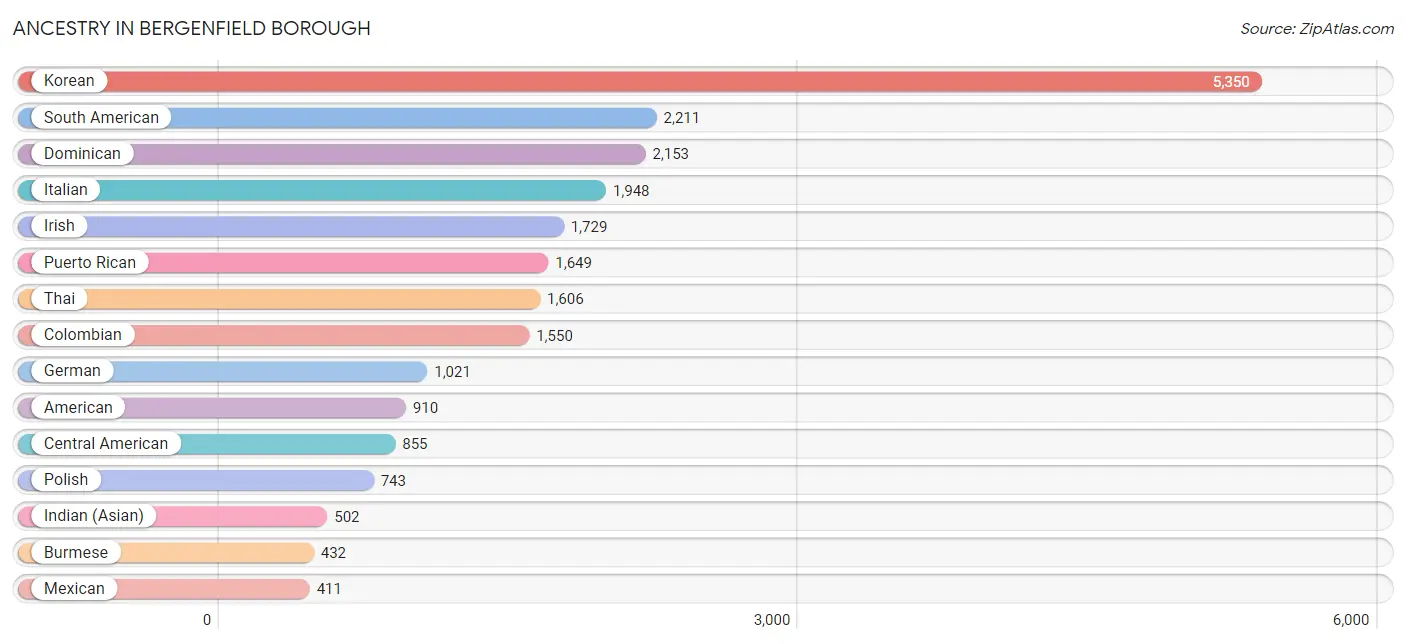
Ancestry in Bergenfield borough
The most populous ancestries reported in Bergenfield borough are Korean (5,350 | 19.0%), South American (2,211 | 7.8%), Dominican (2,153 | 7.6%), Italian (1,948 | 6.9%), and Irish (1,729 | 6.1%), together accounting for 47.4% of all Bergenfield borough residents.
| Ancestry | # Population | % Population |
| African | 172 | 0.6% |
| American | 910 | 3.2% |
| Arab | 27 | 0.1% |
| Argentinean | 59 | 0.2% |
| Armenian | 34 | 0.1% |
| Australian | 8 | 0.0% |
| Austrian | 72 | 0.3% |
| Barbadian | 40 | 0.1% |
| Belizean | 12 | 0.0% |
| Bhutanese | 42 | 0.2% |
| Blackfeet | 8 | 0.0% |
| Bolivian | 13 | 0.1% |
| Brazilian | 8 | 0.0% |
| British | 24 | 0.1% |
| Burmese | 432 | 1.5% |
| Canadian | 9 | 0.0% |
| Central American | 855 | 3.0% |
| Central American Indian | 66 | 0.2% |
| Cherokee | 8 | 0.0% |
| Chilean | 69 | 0.2% |
| Colombian | 1,550 | 5.5% |
| Costa Rican | 149 | 0.5% |
| Croatian | 28 | 0.1% |
| Cuban | 384 | 1.4% |
| Cypriot | 38 | 0.1% |
| Czech | 88 | 0.3% |
| Danish | 7 | 0.0% |
| Dominican | 2,153 | 7.6% |
| Dutch | 64 | 0.2% |
| Eastern European | 405 | 1.4% |
| Ecuadorian | 331 | 1.2% |
| English | 211 | 0.7% |
| European | 72 | 0.3% |
| Filipino | 47 | 0.2% |
| Finnish | 10 | 0.0% |
| French | 208 | 0.7% |
| French Canadian | 13 | 0.1% |
| German | 1,021 | 3.6% |
| Ghanaian | 57 | 0.2% |
| Greek | 78 | 0.3% |
| Guatemalan | 153 | 0.5% |
| Guyanese | 165 | 0.6% |
| Haitian | 113 | 0.4% |
| Honduran | 206 | 0.7% |
| Hungarian | 120 | 0.4% |
| Indian (Asian) | 502 | 1.8% |
| Indonesian | 14 | 0.1% |
| Irish | 1,729 | 6.1% |
| Israeli | 56 | 0.2% |
| Italian | 1,948 | 6.9% |
| Jamaican | 346 | 1.2% |
| Japanese | 58 | 0.2% |
| Jordanian | 9 | 0.0% |
| Korean | 5,350 | 19.0% |
| Latvian | 27 | 0.1% |
| Lithuanian | 15 | 0.1% |
| Lumbee | 96 | 0.3% |
| Mexican | 411 | 1.5% |
| Mexican American Indian | 11 | 0.0% |
| Native Hawaiian | 9 | 0.0% |
| Nicaraguan | 63 | 0.2% |
| Nigerian | 70 | 0.3% |
| Northern European | 34 | 0.1% |
| Norwegian | 45 | 0.2% |
| Pennsylvania German | 12 | 0.0% |
| Peruvian | 136 | 0.5% |
| Polish | 743 | 2.6% |
| Portuguese | 22 | 0.1% |
| Puerto Rican | 1,649 | 5.8% |
| Romanian | 43 | 0.2% |
| Russian | 376 | 1.3% |
| Salvadoran | 272 | 1.0% |
| Samoan | 19 | 0.1% |
| Scottish | 42 | 0.2% |
| Slavic | 33 | 0.1% |
| South American | 2,211 | 7.8% |
| South American Indian | 50 | 0.2% |
| Spaniard | 40 | 0.1% |
| Spanish | 90 | 0.3% |
| Sri Lankan | 71 | 0.3% |
| Subsaharan African | 302 | 1.1% |
| Swedish | 31 | 0.1% |
| Swiss | 53 | 0.2% |
| Thai | 1,606 | 5.7% |
| Trinidadian and Tobagonian | 111 | 0.4% |
| Turkish | 20 | 0.1% |
| Ukrainian | 165 | 0.6% |
| Venezuelan | 28 | 0.1% |
| Welsh | 32 | 0.1% |
| West Indian | 107 | 0.4% |
| Yugoslavian | 5 | 0.0% | View All 91 Rows |
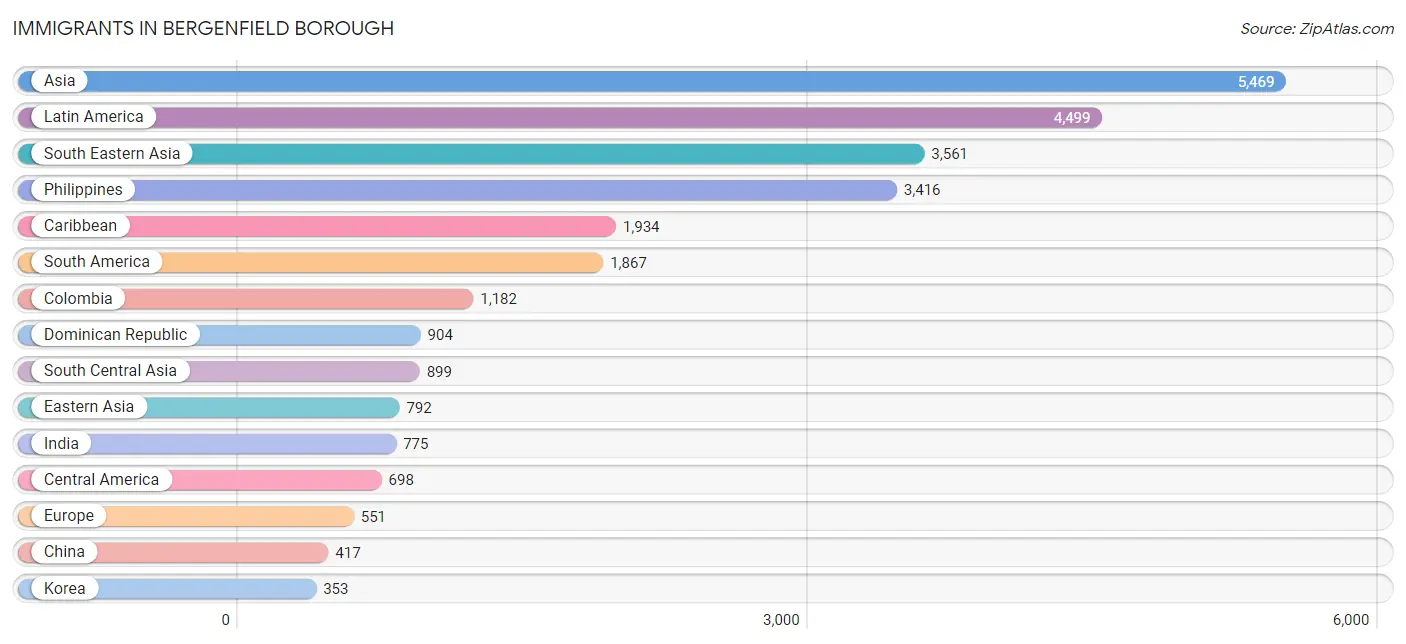
Immigrants in Bergenfield borough
The most numerous immigrant groups reported in Bergenfield borough came from Asia (5,469 | 19.4%), Latin America (4,499 | 15.9%), South Eastern Asia (3,561 | 12.6%), Philippines (3,416 | 12.1%), and Caribbean (1,934 | 6.9%), together accounting for 66.9% of all Bergenfield borough residents.
| Immigration Origin | # Population | % Population |
| Africa | 320 | 1.1% |
| Argentina | 39 | 0.1% |
| Asia | 5,469 | 19.4% |
| Australia | 25 | 0.1% |
| Austria | 43 | 0.2% |
| Belize | 12 | 0.0% |
| Brazil | 70 | 0.3% |
| Cambodia | 58 | 0.2% |
| Canada | 70 | 0.3% |
| Caribbean | 1,934 | 6.9% |
| Central America | 698 | 2.5% |
| Chile | 69 | 0.2% |
| China | 417 | 1.5% |
| Colombia | 1,182 | 4.2% |
| Costa Rica | 68 | 0.2% |
| Croatia | 5 | 0.0% |
| Cuba | 274 | 1.0% |
| Dominica | 119 | 0.4% |
| Dominican Republic | 904 | 3.2% |
| Eastern Africa | 43 | 0.2% |
| Eastern Asia | 792 | 2.8% |
| Eastern Europe | 271 | 1.0% |
| Ecuador | 160 | 0.6% |
| El Salvador | 121 | 0.4% |
| England | 55 | 0.2% |
| Europe | 551 | 1.9% |
| France | 5 | 0.0% |
| Germany | 4 | 0.0% |
| Ghana | 72 | 0.3% |
| Greece | 16 | 0.1% |
| Guatemala | 155 | 0.5% |
| Guyana | 169 | 0.6% |
| Haiti | 58 | 0.2% |
| Honduras | 119 | 0.4% |
| Hong Kong | 23 | 0.1% |
| Hungary | 19 | 0.1% |
| India | 775 | 2.8% |
| Iraq | 35 | 0.1% |
| Ireland | 87 | 0.3% |
| Israel | 78 | 0.3% |
| Italy | 11 | 0.0% |
| Jamaica | 217 | 0.8% |
| Japan | 22 | 0.1% |
| Jordan | 4 | 0.0% |
| Kenya | 18 | 0.1% |
| Korea | 353 | 1.3% |
| Latin America | 4,499 | 15.9% |
| Lebanon | 26 | 0.1% |
| Malaysia | 13 | 0.1% |
| Mexico | 192 | 0.7% |
| Nepal | 10 | 0.0% |
| Nicaragua | 31 | 0.1% |
| Nigeria | 177 | 0.6% |
| Northern Europe | 189 | 0.7% |
| Norway | 15 | 0.1% |
| Oceania | 25 | 0.1% |
| Pakistan | 114 | 0.4% |
| Peru | 120 | 0.4% |
| Philippines | 3,416 | 12.1% |
| Poland | 8 | 0.0% |
| Romania | 22 | 0.1% |
| Russia | 63 | 0.2% |
| Scotland | 32 | 0.1% |
| South Africa | 12 | 0.0% |
| South America | 1,867 | 6.6% |
| South Central Asia | 899 | 3.2% |
| South Eastern Asia | 3,561 | 12.6% |
| Southern Europe | 39 | 0.1% |
| Spain | 12 | 0.0% |
| Taiwan | 88 | 0.3% |
| Trinidad and Tobago | 238 | 0.8% |
| Turkey | 20 | 0.1% |
| Uganda | 13 | 0.1% |
| Ukraine | 137 | 0.5% |
| Venezuela | 28 | 0.1% |
| Vietnam | 33 | 0.1% |
| West Indies | 124 | 0.4% |
| Western Africa | 249 | 0.9% |
| Western Asia | 217 | 0.8% |
| Western Europe | 52 | 0.2% | View All 80 Rows |
Sex and Age in Bergenfield borough
Sex and Age in Bergenfield borough
The most populous age groups in Bergenfield borough are 60 to 64 Years (1,108 | 7.9%) for men and 65 to 69 Years (1,171 | 8.2%) for women.
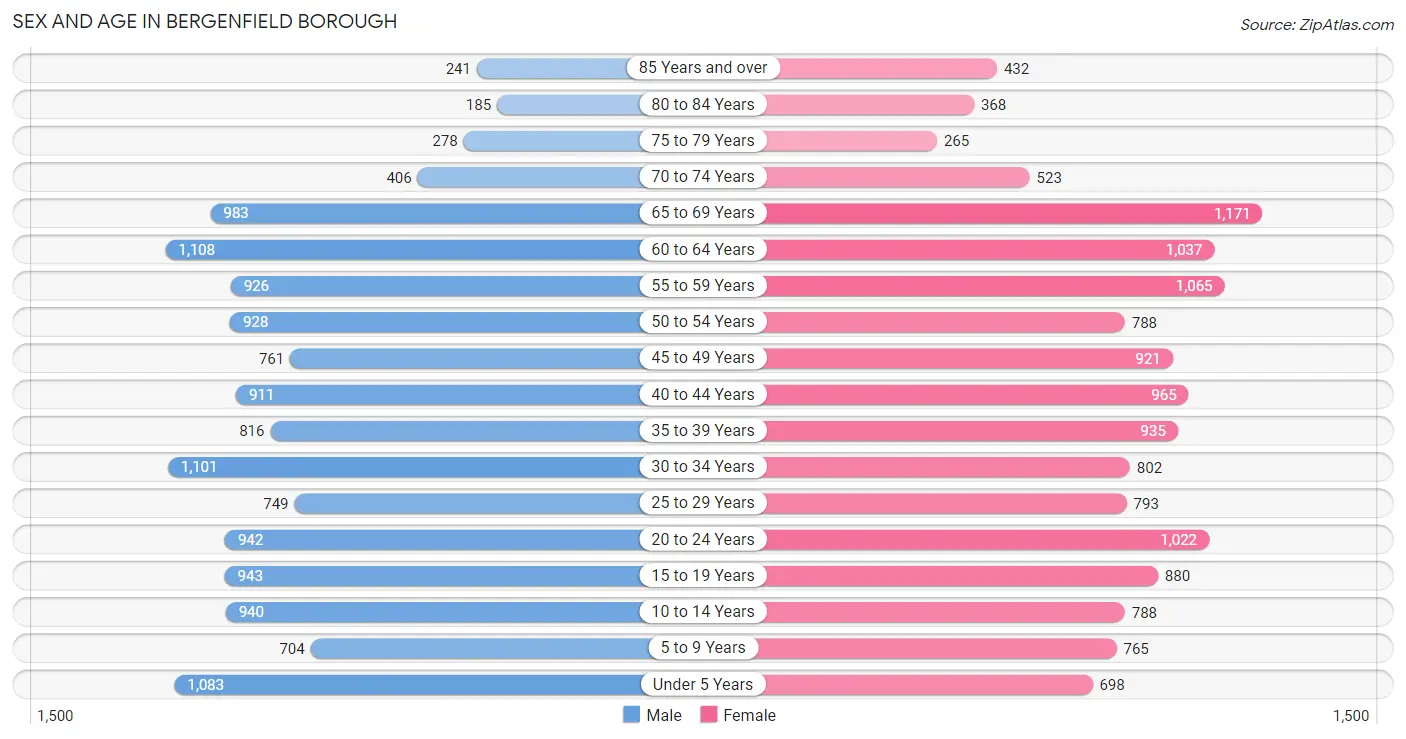
| Age Bracket | Male | Female |
| Under 5 Years | 1,083 (7.7%) | 698 (4.9%) |
| 5 to 9 Years | 704 (5.0%) | 765 (5.4%) |
| 10 to 14 Years | 940 (6.7%) | 788 (5.5%) |
| 15 to 19 Years | 943 (6.7%) | 880 (6.2%) |
| 20 to 24 Years | 942 (6.7%) | 1,022 (7.2%) |
| 25 to 29 Years | 749 (5.3%) | 793 (5.6%) |
| 30 to 34 Years | 1,101 (7.9%) | 802 (5.6%) |
| 35 to 39 Years | 816 (5.8%) | 935 (6.6%) |
| 40 to 44 Years | 911 (6.5%) | 965 (6.8%) |
| 45 to 49 Years | 761 (5.4%) | 921 (6.5%) |
| 50 to 54 Years | 928 (6.6%) | 788 (5.5%) |
| 55 to 59 Years | 926 (6.6%) | 1,065 (7.5%) |
| 60 to 64 Years | 1,108 (7.9%) | 1,037 (7.3%) |
| 65 to 69 Years | 983 (7.0%) | 1,171 (8.2%) |
| 70 to 74 Years | 406 (2.9%) | 523 (3.7%) |
| 75 to 79 Years | 278 (2.0%) | 265 (1.9%) |
| 80 to 84 Years | 185 (1.3%) | 368 (2.6%) |
| 85 Years and over | 241 (1.7%) | 432 (3.0%) |
| Total | 14,005 (100.0%) | 14,218 (100.0%) |
Families and Households in Bergenfield borough
Median Family Size in Bergenfield borough
The median family size in Bergenfield borough is 3.50 persons per family, with married-couple families (5,411 | 75.9%) accounting for the largest median family size of 3.74 persons per family. On the other hand, single male/father families (514 | 7.2%) represent the smallest median family size with 2.62 persons per family.
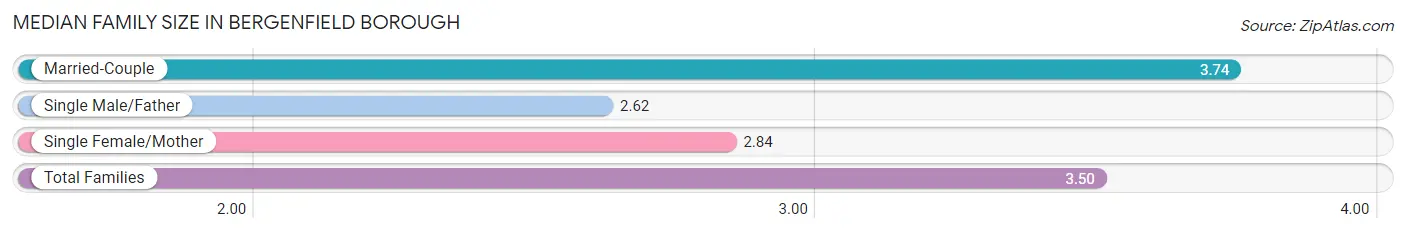
| Family Type | # Families | Family Size |
| Married-Couple | 5,411 (75.9%) | 3.74 |
| Single Male/Father | 514 (7.2%) | 2.62 |
| Single Female/Mother | 1,204 (16.9%) | 2.84 |
| Total Families | 7,129 (100.0%) | 3.50 |
Median Household Size in Bergenfield borough
The median household size in Bergenfield borough is 3.03 persons per household, with married-couple households (5,411 | 58.2%) accounting for the largest median household size of 3.75 persons per household. non-family households (2,177 | 23.4%) represent the smallest median household size with 1.30 persons per household.
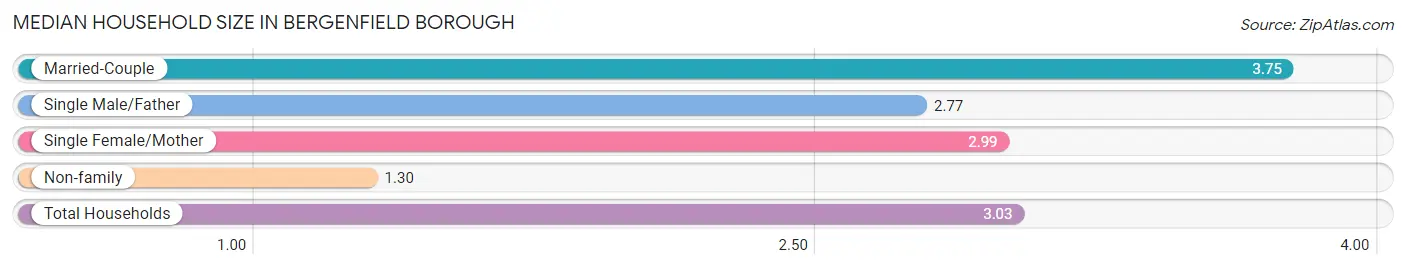
| Household Type | # Households | Household Size |
| Married-Couple | 5,411 (58.2%) | 3.75 |
| Single Male/Father | 514 (5.5%) | 2.77 |
| Single Female/Mother | 1,204 (12.9%) | 2.99 |
| Non-family | 2,177 (23.4%) | 1.30 |
| Total Households | 9,306 (100.0%) | 3.03 |
Household Size by Marriage Status in Bergenfield borough
Out of a total of 9,306 households in Bergenfield borough, 7,129 (76.6%) are family households, while 2,177 (23.4%) are nonfamily households. The most numerous type of family households are 2-person households, comprising 2,440, and the most common type of nonfamily households are 1-person households, comprising 1,711.
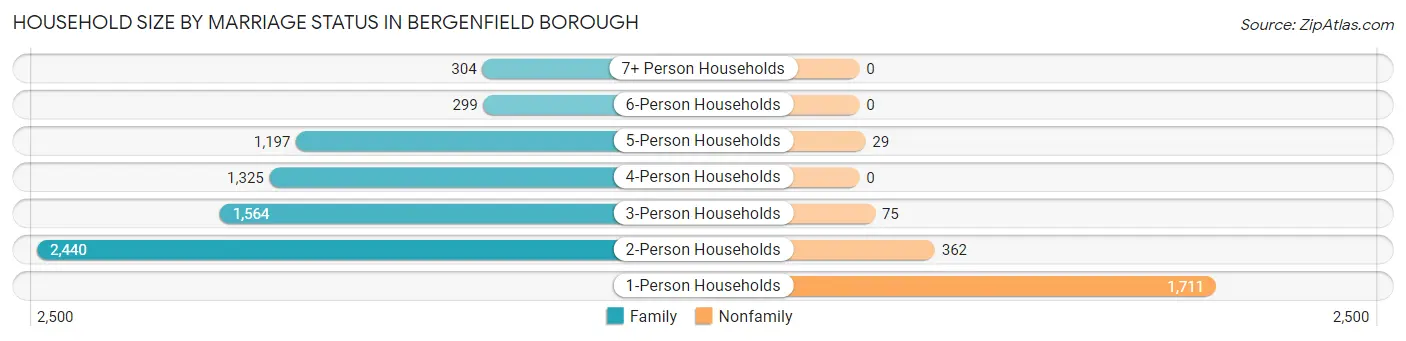
| Household Size | Family Households | Nonfamily Households |
| 1-Person Households | - | 1,711 (18.4%) |
| 2-Person Households | 2,440 (26.2%) | 362 (3.9%) |
| 3-Person Households | 1,564 (16.8%) | 75 (0.8%) |
| 4-Person Households | 1,325 (14.2%) | 0 (0.0%) |
| 5-Person Households | 1,197 (12.9%) | 29 (0.3%) |
| 6-Person Households | 299 (3.2%) | 0 (0.0%) |
| 7+ Person Households | 304 (3.3%) | 0 (0.0%) |
| Total | 7,129 (76.6%) | 2,177 (23.4%) |
Female Fertility in Bergenfield borough
Fertility by Age in Bergenfield borough
Average fertility rate in Bergenfield borough is 37.0 births per 1,000 women. Women in the age bracket of 20 to 34 years have the highest fertility rate with 53.0 births per 1,000 women. Women in the age bracket of 20 to 34 years acount for 57.4% of all women with births.
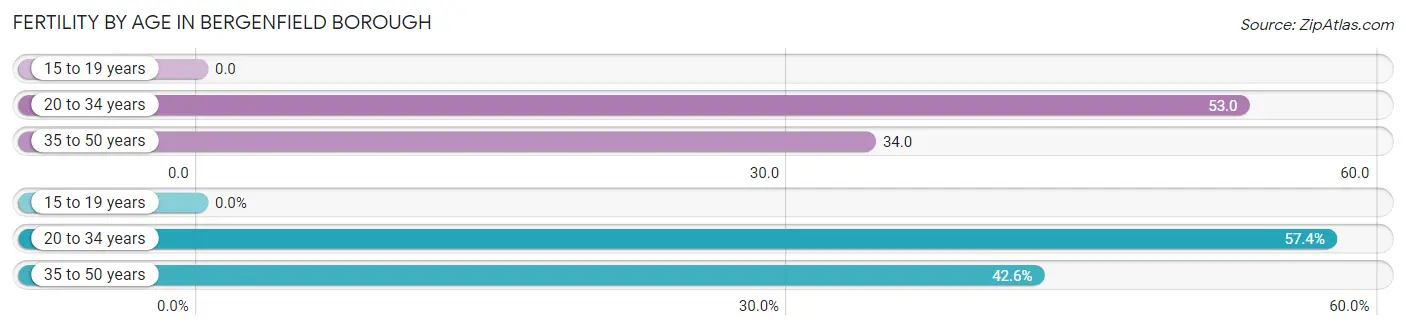
| Age Bracket | Women with Births | Births / 1,000 Women |
| 15 to 19 years | 0 (0.0%) | 0.0 |
| 20 to 34 years | 139 (57.4%) | 53.0 |
| 35 to 50 years | 103 (42.6%) | 34.0 |
| Total | 242 (100.0%) | 37.0 |
Fertility by Age by Marriage Status in Bergenfield borough
93.4% of women with births (242) in Bergenfield borough are married. The highest percentage of unmarried women with births falls into 35 to 50 years age bracket with 15.5% of them unmarried at the time of birth, while the lowest percentage of unmarried women with births belong to 20 to 34 years age bracket with 0.0% of them unmarried.
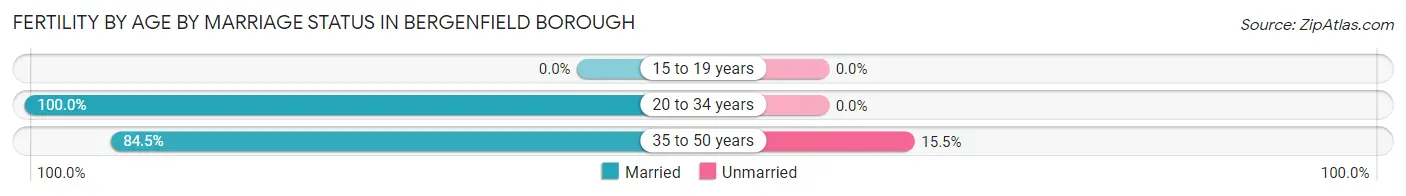
| Age Bracket | Married | Unmarried |
| 15 to 19 years | 0 (0.0%) | 0 (0.0%) |
| 20 to 34 years | 139 (100.0%) | 0 (0.0%) |
| 35 to 50 years | 87 (84.5%) | 16 (15.5%) |
| Total | 226 (93.4%) | 16 (6.6%) |
Fertility by Education in Bergenfield borough
Average fertility rate in Bergenfield borough is 37.0 births per 1,000 women. Women with the education attainment of graduate degree have the highest fertility rate of 180.0 births per 1,000 women, while women with the education attainment of bachelor's degree have the lowest fertility at 6.0 births per 1,000 women. Women with the education attainment of graduate degree represent 61.2% of all women with births.
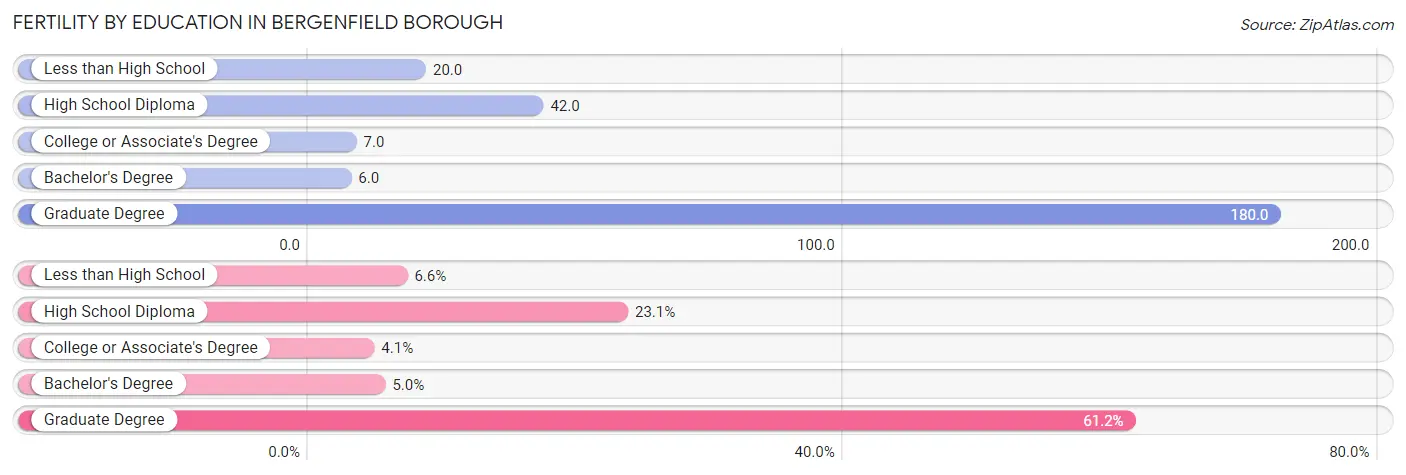
| Educational Attainment | Women with Births | Births / 1,000 Women |
| Less than High School | 16 (6.6%) | 20.0 |
| High School Diploma | 56 (23.1%) | 42.0 |
| College or Associate's Degree | 10 (4.1%) | 7.0 |
| Bachelor's Degree | 12 (5.0%) | 6.0 |
| Graduate Degree | 148 (61.2%) | 180.0 |
| Total | 242 (100.0%) | 37.0 |
Fertility by Education by Marriage Status in Bergenfield borough
6.6% of women with births in Bergenfield borough are unmarried. Women with the educational attainment of high school diploma are most likely to be married with 100.0% of them married at childbirth, while women with the educational attainment of less than high school are least likely to be married with 100.0% of them unmarried at childbirth.
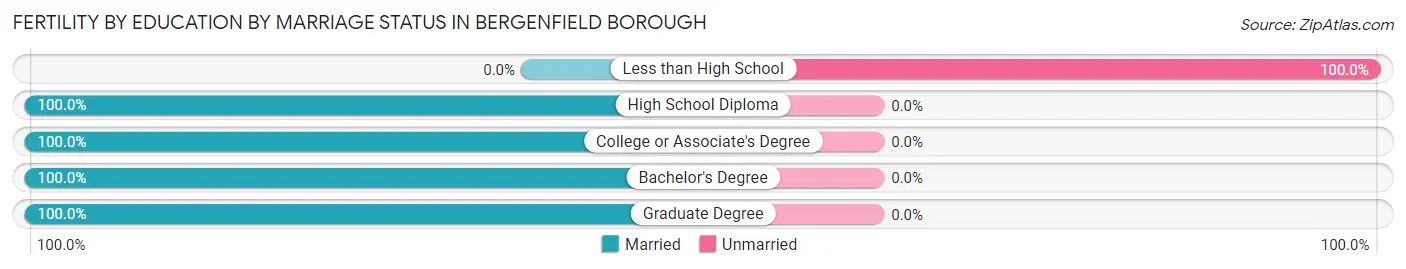
| Educational Attainment | Married | Unmarried |
| Less than High School | 0 (0.0%) | 16 (100.0%) |
| High School Diploma | 56 (100.0%) | 0 (0.0%) |
| College or Associate's Degree | 10 (100.0%) | 0 (0.0%) |
| Bachelor's Degree | 12 (100.0%) | 0 (0.0%) |
| Graduate Degree | 148 (100.0%) | 0 (0.0%) |
| Total | 226 (93.4%) | 16 (6.6%) |
Employment Characteristics in Bergenfield borough
Employment by Class of Employer in Bergenfield borough
Among the 14,430 employed individuals in Bergenfield borough, private company employees (10,165 | 70.4%), not-for-profit organizations (1,341 | 9.3%), and local government employees (1,302 | 9.0%) make up the most common classes of employment.
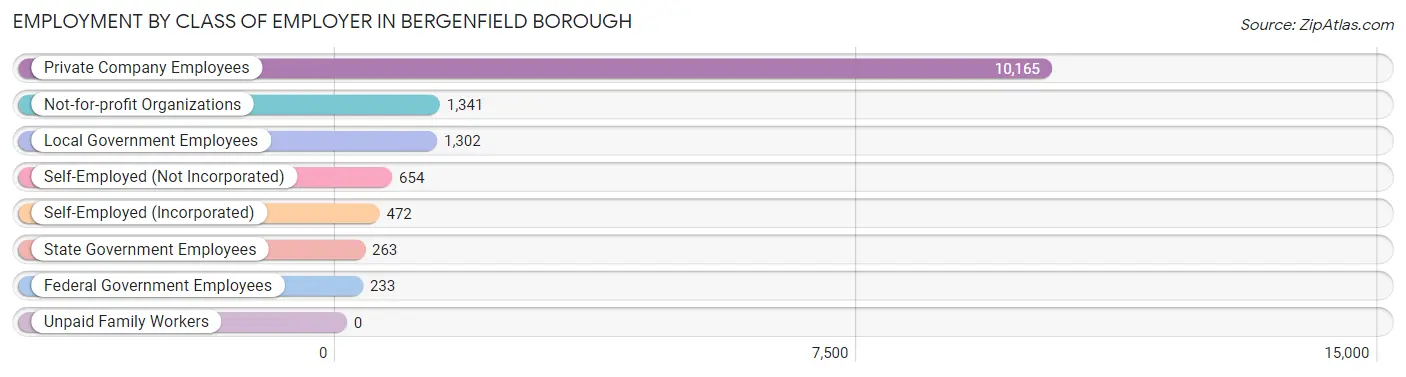
| Employer Class | # Employees | % Employees |
| Private Company Employees | 10,165 | 70.4% |
| Self-Employed (Incorporated) | 472 | 3.3% |
| Self-Employed (Not Incorporated) | 654 | 4.5% |
| Not-for-profit Organizations | 1,341 | 9.3% |
| Local Government Employees | 1,302 | 9.0% |
| State Government Employees | 263 | 1.8% |
| Federal Government Employees | 233 | 1.6% |
| Unpaid Family Workers | 0 | 0.0% |
| Total | 14,430 | 100.0% |
Employment Status by Age in Bergenfield borough
According to the labor force statistics for Bergenfield borough, out of the total population over 16 years of age (22,836), 68.7% or 15,688 individuals are in the labor force, with 6.0% or 941 of them unemployed. The age group with the highest labor force participation rate is 30 to 34 years, with 93.0% or 1,770 individuals in the labor force. Within the labor force, the 20 to 24 years age range has the highest percentage of unemployed individuals, with 17.8% or 248 of them being unemployed.
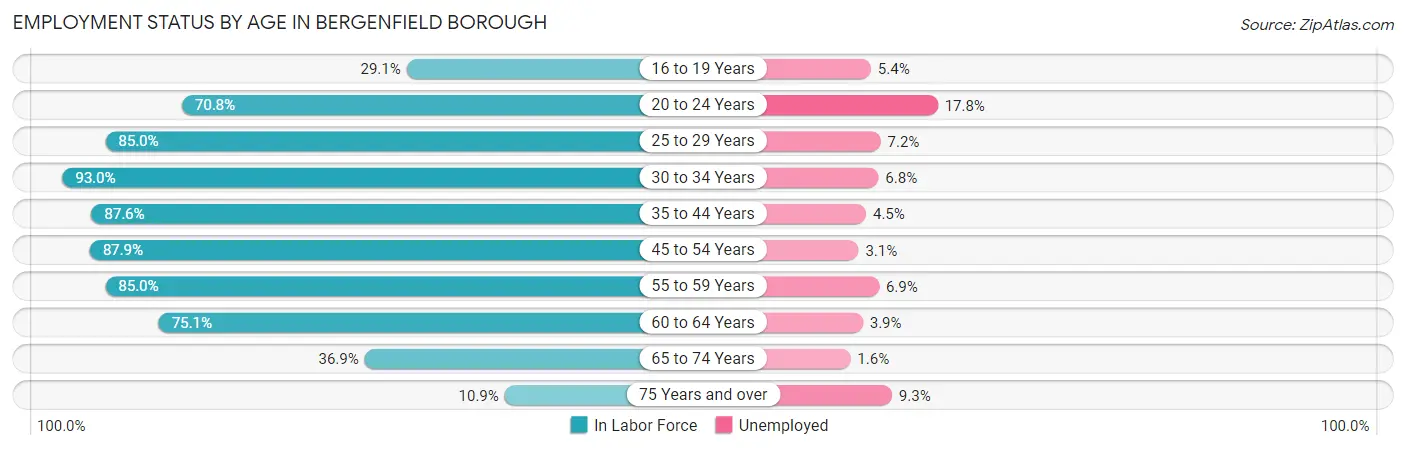
| Age Bracket | In Labor Force | Unemployed |
| 16 to 19 Years | 411 (29.1%) | 22 (5.4%) |
| 20 to 24 Years | 1,391 (70.8%) | 248 (17.8%) |
| 25 to 29 Years | 1,311 (85.0%) | 94 (7.2%) |
| 30 to 34 Years | 1,770 (93.0%) | 120 (6.8%) |
| 35 to 44 Years | 3,177 (87.6%) | 143 (4.5%) |
| 45 to 54 Years | 2,987 (87.9%) | 93 (3.1%) |
| 55 to 59 Years | 1,692 (85.0%) | 117 (6.9%) |
| 60 to 64 Years | 1,611 (75.1%) | 63 (3.9%) |
| 65 to 74 Years | 1,138 (36.9%) | 18 (1.6%) |
| 75 Years and over | 193 (10.9%) | 18 (9.3%) |
| Total | 15,688 (68.7%) | 941 (6.0%) |
Employment Status by Educational Attainment in Bergenfield borough
According to labor force statistics for Bergenfield borough, 85.9% of individuals (12,547) out of the total population between 25 and 64 years of age (14,606) are in the labor force, with 5.0% or 627 of them being unemployed. The group with the highest labor force participation rate are those with the educational attainment of bachelor's degree or higher, with 88.9% or 6,396 individuals in the labor force. Within the labor force, individuals with less than high school education have the highest percentage of unemployment, with 14.7% or 90 of them being unemployed.
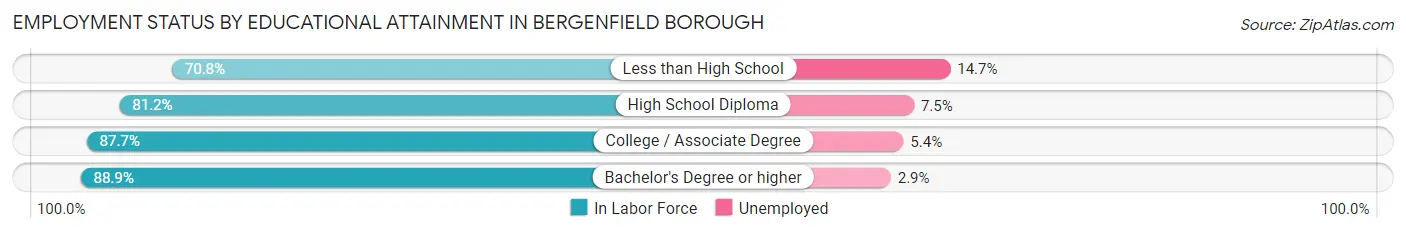
| Educational Attainment | In Labor Force | Unemployed |
| Less than High School | 611 (70.8%) | 127 (14.7%) |
| High School Diploma | 2,482 (81.2%) | 229 (7.5%) |
| College / Associate Degree | 3,062 (87.7%) | 189 (5.4%) |
| Bachelor's Degree or higher | 6,396 (88.9%) | 209 (2.9%) |
| Total | 12,547 (85.9%) | 730 (5.0%) |
Employment Occupations by Sex in Bergenfield borough
Management, Business, Science and Arts Occupations
The most common Management, Business, Science and Arts occupations in Bergenfield borough are Health Diagnosing & Treating (2,092 | 14.2%), Health Technologists (1,602 | 10.9%), Management (1,381 | 9.4%), Community & Social Service (1,374 | 9.3%), and Computers, Engineering & Science (1,177 | 8.0%).
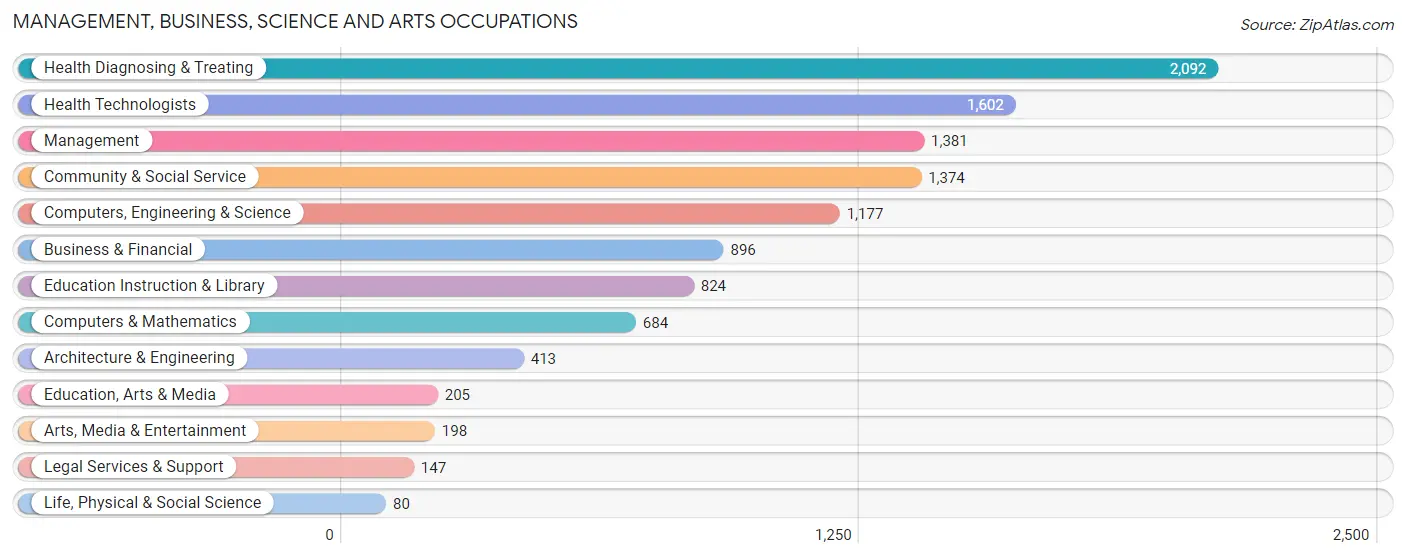
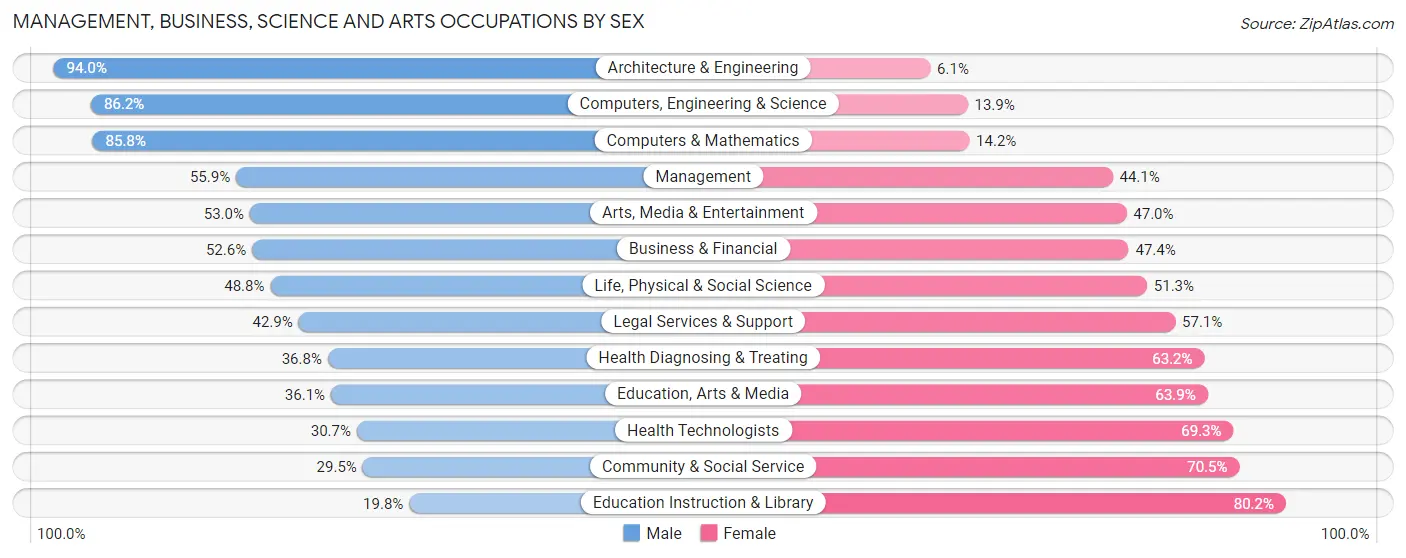
Management, Business, Science and Arts Occupations by Sex
Within the Management, Business, Science and Arts occupations in Bergenfield borough, the most male-oriented occupations are Architecture & Engineering (94.0%), Computers, Engineering & Science (86.2%), and Computers & Mathematics (85.8%), while the most female-oriented occupations are Education Instruction & Library (80.2%), Community & Social Service (70.5%), and Health Technologists (69.3%).
| Occupation | Male | Female |
| Management | 772 (55.9%) | 609 (44.1%) |
| Business & Financial | 471 (52.6%) | 425 (47.4%) |
| Computers, Engineering & Science | 1,014 (86.2%) | 163 (13.9%) |
| Computers & Mathematics | 587 (85.8%) | 97 (14.2%) |
| Architecture & Engineering | 388 (94.0%) | 25 (6.0%) |
| Life, Physical & Social Science | 39 (48.7%) | 41 (51.2%) |
| Community & Social Service | 405 (29.5%) | 969 (70.5%) |
| Education, Arts & Media | 74 (36.1%) | 131 (63.9%) |
| Legal Services & Support | 63 (42.9%) | 84 (57.1%) |
| Education Instruction & Library | 163 (19.8%) | 661 (80.2%) |
| Arts, Media & Entertainment | 105 (53.0%) | 93 (47.0%) |
| Health Diagnosing & Treating | 769 (36.8%) | 1,323 (63.2%) |
| Health Technologists | 492 (30.7%) | 1,110 (69.3%) |
| Total (Category) | 3,431 (49.6%) | 3,489 (50.4%) |
| Total (Overall) | 7,780 (52.8%) | 6,966 (47.2%) |
Services Occupations
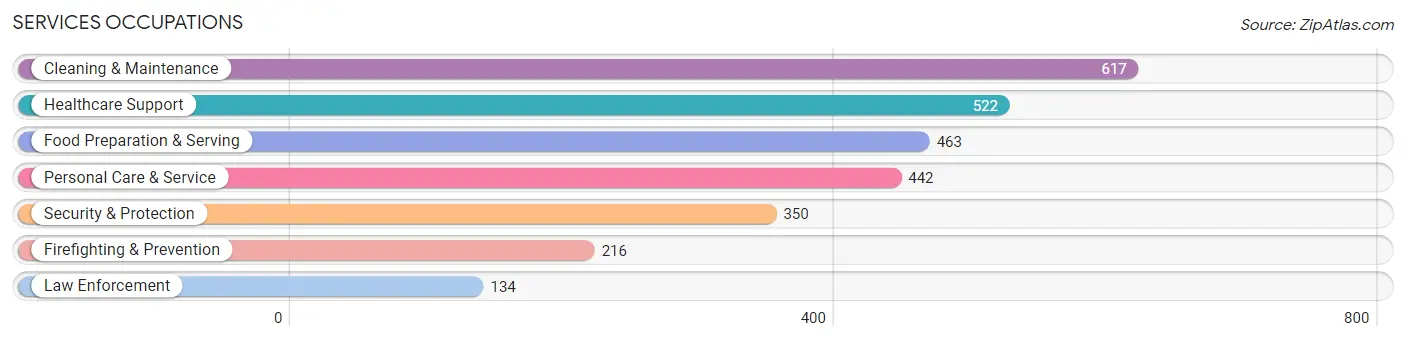
The most common Services occupations in Bergenfield borough are Cleaning & Maintenance (617 | 4.2%), Healthcare Support (522 | 3.5%), Food Preparation & Serving (463 | 3.1%), Personal Care & Service (442 | 3.0%), and Security & Protection (350 | 2.4%).
Services Occupations by Sex
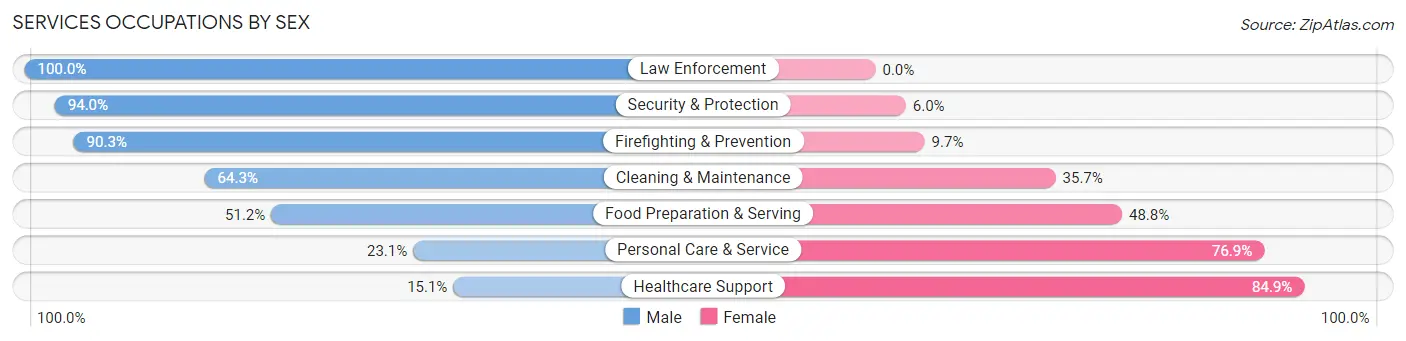
Within the Services occupations in Bergenfield borough, the most male-oriented occupations are Law Enforcement (100.0%), Security & Protection (94.0%), and Firefighting & Prevention (90.3%), while the most female-oriented occupations are Healthcare Support (84.9%), Personal Care & Service (76.9%), and Food Preparation & Serving (48.8%).
| Occupation | Male | Female |
| Healthcare Support | 79 (15.1%) | 443 (84.9%) |
| Security & Protection | 329 (94.0%) | 21 (6.0%) |
| Firefighting & Prevention | 195 (90.3%) | 21 (9.7%) |
| Law Enforcement | 134 (100.0%) | 0 (0.0%) |
| Food Preparation & Serving | 237 (51.2%) | 226 (48.8%) |
| Cleaning & Maintenance | 397 (64.3%) | 220 (35.7%) |
| Personal Care & Service | 102 (23.1%) | 340 (76.9%) |
| Total (Category) | 1,144 (47.8%) | 1,250 (52.2%) |
| Total (Overall) | 7,780 (52.8%) | 6,966 (47.2%) |
Sales and Office Occupations
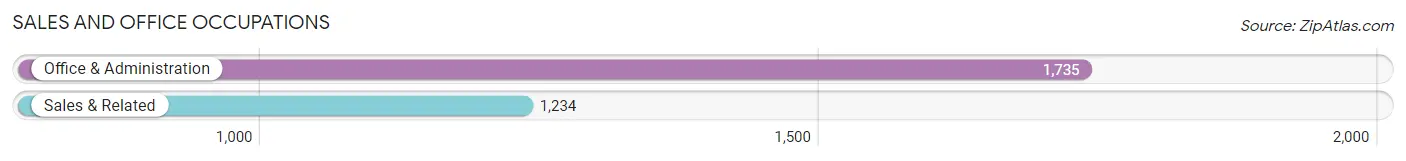
The most common Sales and Office occupations in Bergenfield borough are Office & Administration (1,735 | 11.8%), and Sales & Related (1,234 | 8.4%).
Sales and Office Occupations by Sex
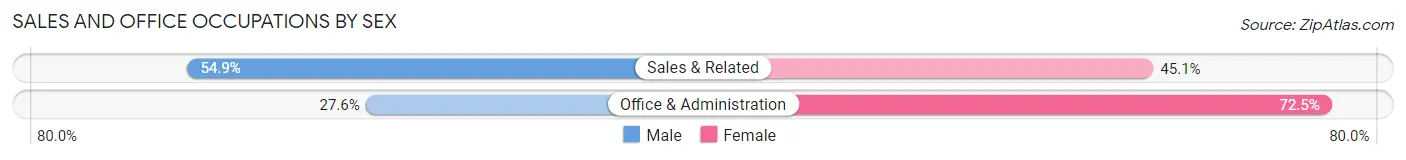
| Occupation | Male | Female |
| Sales & Related | 678 (54.9%) | 556 (45.1%) |
| Office & Administration | 478 (27.6%) | 1,257 (72.5%) |
| Total (Category) | 1,156 (38.9%) | 1,813 (61.1%) |
| Total (Overall) | 7,780 (52.8%) | 6,966 (47.2%) |
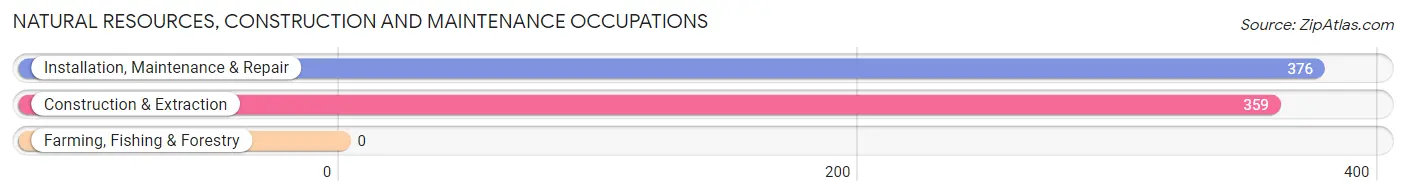
Natural Resources, Construction and Maintenance Occupations
The most common Natural Resources, Construction and Maintenance occupations in Bergenfield borough are Installation, Maintenance & Repair (376 | 2.5%), and Construction & Extraction (359 | 2.4%).
Natural Resources, Construction and Maintenance Occupations by Sex
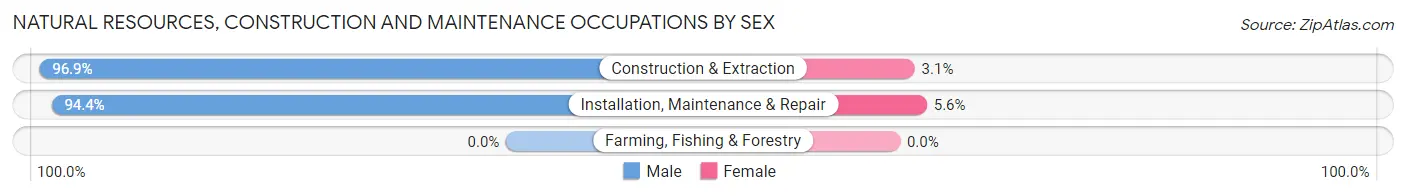
| Occupation | Male | Female |
| Farming, Fishing & Forestry | 0 (0.0%) | 0 (0.0%) |
| Construction & Extraction | 348 (96.9%) | 11 (3.1%) |
| Installation, Maintenance & Repair | 355 (94.4%) | 21 (5.6%) |
| Total (Category) | 703 (95.7%) | 32 (4.3%) |
| Total (Overall) | 7,780 (52.8%) | 6,966 (47.2%) |
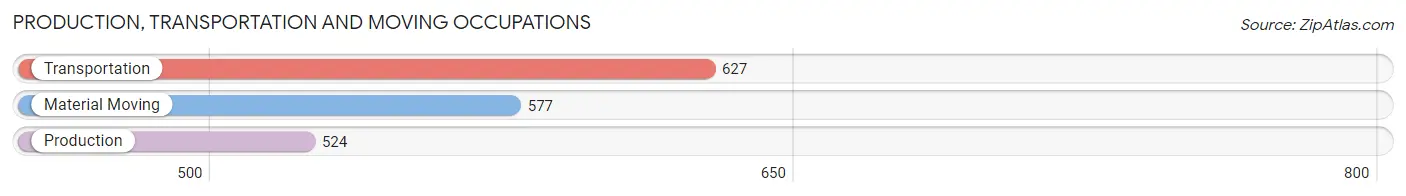
Production, Transportation and Moving Occupations
The most common Production, Transportation and Moving occupations in Bergenfield borough are Transportation (627 | 4.3%), Material Moving (577 | 3.9%), and Production (524 | 3.5%).
Production, Transportation and Moving Occupations by Sex
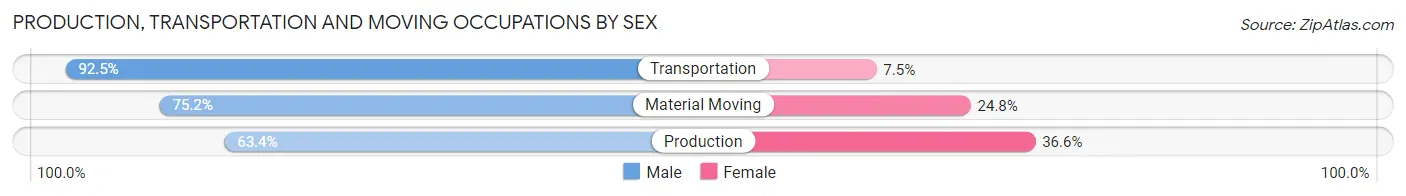
| Occupation | Male | Female |
| Production | 332 (63.4%) | 192 (36.6%) |
| Transportation | 580 (92.5%) | 47 (7.5%) |
| Material Moving | 434 (75.2%) | 143 (24.8%) |
| Total (Category) | 1,346 (77.9%) | 382 (22.1%) |
| Total (Overall) | 7,780 (52.8%) | 6,966 (47.2%) |
Employment Industries by Sex in Bergenfield borough
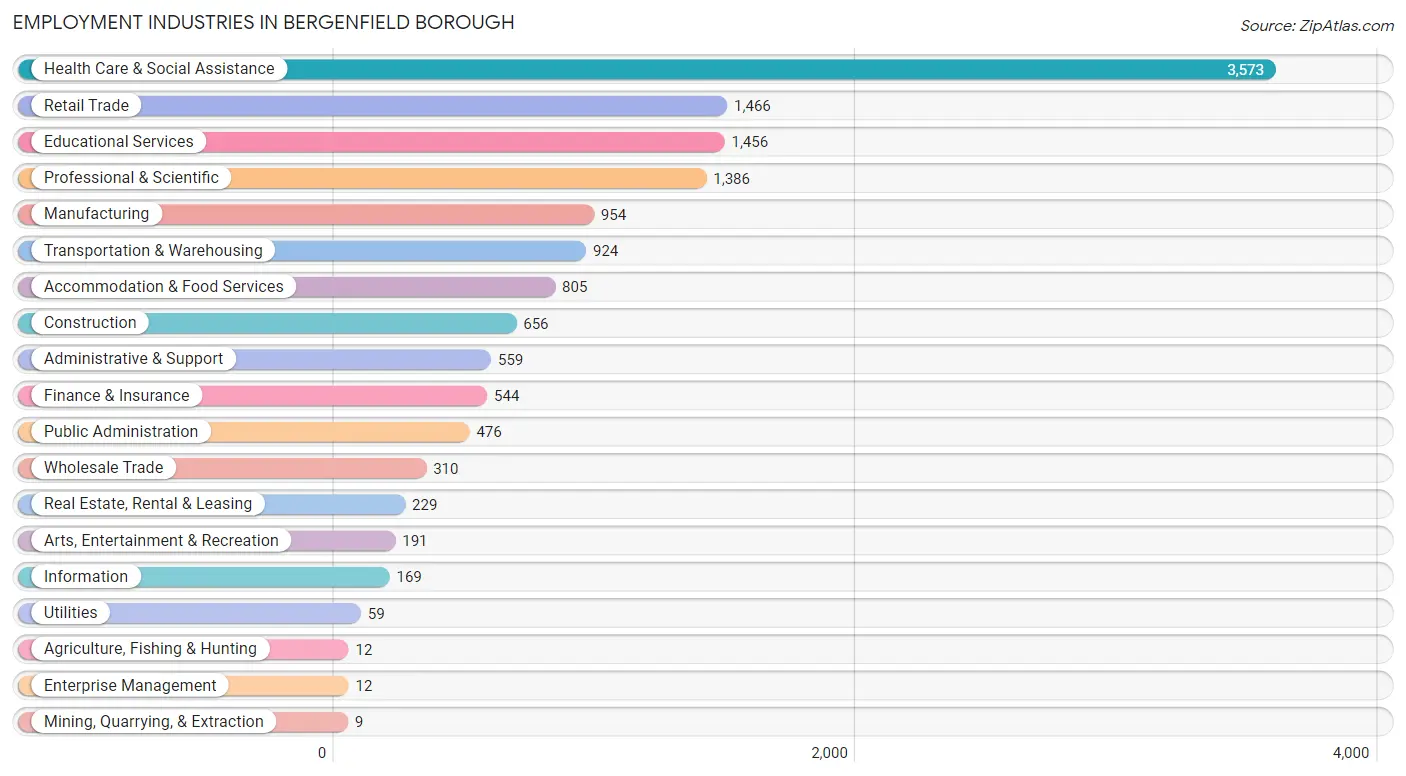
Employment Industries in Bergenfield borough
The major employment industries in Bergenfield borough include Health Care & Social Assistance (3,573 | 24.2%), Retail Trade (1,466 | 9.9%), Educational Services (1,456 | 9.9%), Professional & Scientific (1,386 | 9.4%), and Manufacturing (954 | 6.5%).
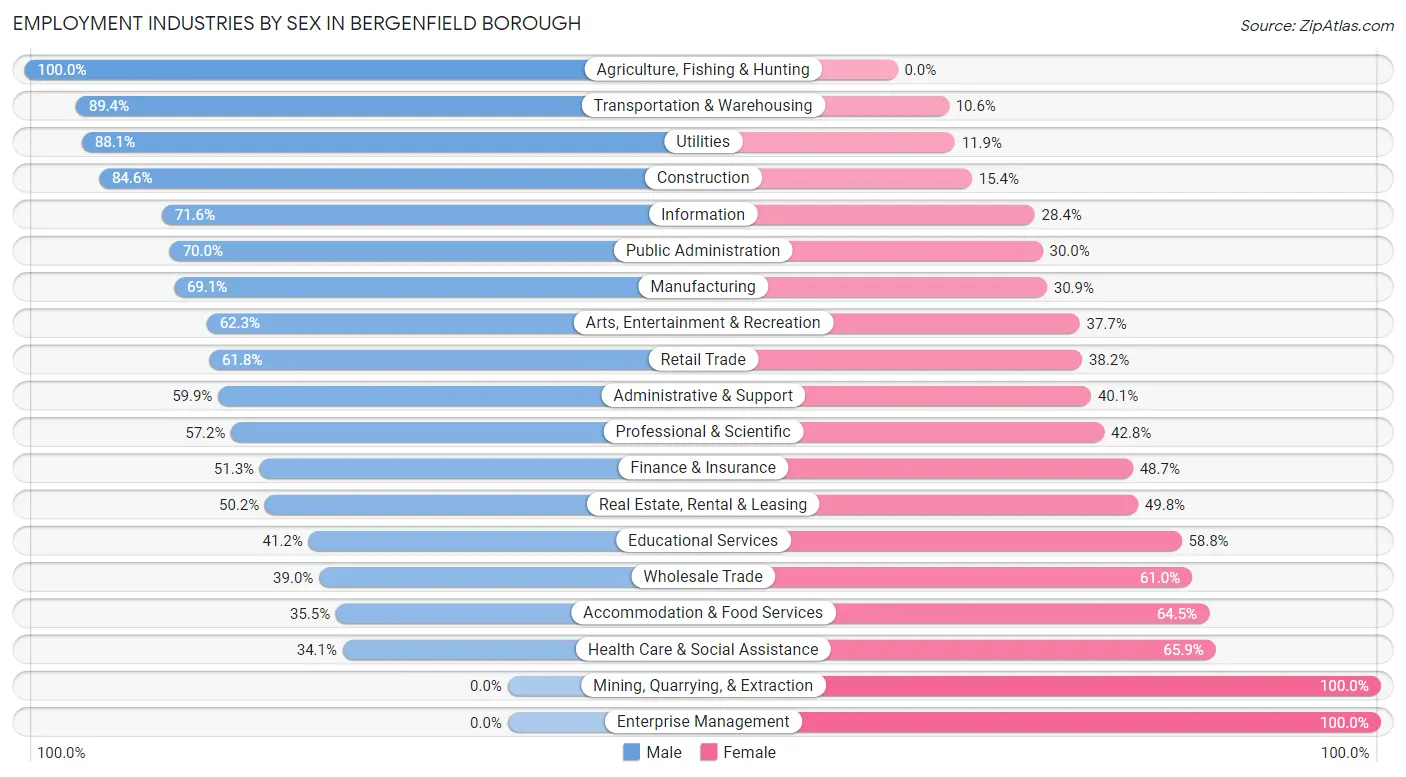
Employment Industries by Sex in Bergenfield borough
The Bergenfield borough industries that see more men than women are Agriculture, Fishing & Hunting (100.0%), Transportation & Warehousing (89.4%), and Utilities (88.1%), whereas the industries that tend to have a higher number of women are Mining, Quarrying, & Extraction (100.0%), Enterprise Management (100.0%), and Health Care & Social Assistance (65.9%).
| Industry | Male | Female |
| Agriculture, Fishing & Hunting | 12 (100.0%) | 0 (0.0%) |
| Mining, Quarrying, & Extraction | 0 (0.0%) | 9 (100.0%) |
| Construction | 555 (84.6%) | 101 (15.4%) |
| Manufacturing | 659 (69.1%) | 295 (30.9%) |
| Wholesale Trade | 121 (39.0%) | 189 (61.0%) |
| Retail Trade | 906 (61.8%) | 560 (38.2%) |
| Transportation & Warehousing | 826 (89.4%) | 98 (10.6%) |
| Utilities | 52 (88.1%) | 7 (11.9%) |
| Information | 121 (71.6%) | 48 (28.4%) |
| Finance & Insurance | 279 (51.3%) | 265 (48.7%) |
| Real Estate, Rental & Leasing | 115 (50.2%) | 114 (49.8%) |
| Professional & Scientific | 793 (57.2%) | 593 (42.8%) |
| Enterprise Management | 0 (0.0%) | 12 (100.0%) |
| Administrative & Support | 335 (59.9%) | 224 (40.1%) |
| Educational Services | 600 (41.2%) | 856 (58.8%) |
| Health Care & Social Assistance | 1,220 (34.1%) | 2,353 (65.9%) |
| Arts, Entertainment & Recreation | 119 (62.3%) | 72 (37.7%) |
| Accommodation & Food Services | 286 (35.5%) | 519 (64.5%) |
| Public Administration | 333 (70.0%) | 143 (30.0%) |
| Total | 7,780 (52.8%) | 6,966 (47.2%) |
Education in Bergenfield borough
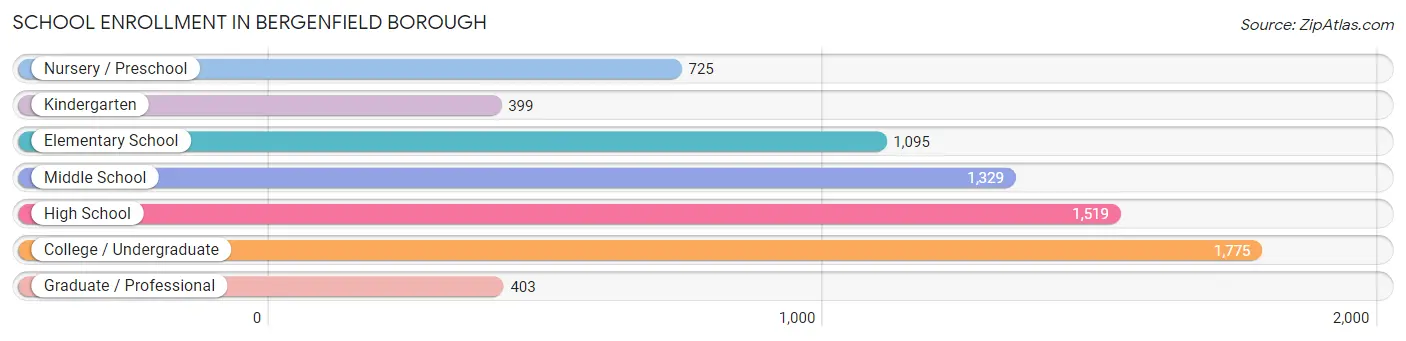
School Enrollment in Bergenfield borough
The most common levels of schooling among the 7,245 students in Bergenfield borough are college / undergraduate (1,775 | 24.5%), high school (1,519 | 21.0%), and middle school (1,329 | 18.3%).
| School Level | # Students | % Students |
| Nursery / Preschool | 725 | 10.0% |
| Kindergarten | 399 | 5.5% |
| Elementary School | 1,095 | 15.1% |
| Middle School | 1,329 | 18.3% |
| High School | 1,519 | 21.0% |
| College / Undergraduate | 1,775 | 24.5% |
| Graduate / Professional | 403 | 5.6% |
| Total | 7,245 | 100.0% |
School Enrollment by Age by Funding Source in Bergenfield borough
Out of a total of 7,245 students who are enrolled in schools in Bergenfield borough, 2,391 (33.0%) attend a private institution, while the remaining 4,854 (67.0%) are enrolled in public schools. The age group of 3 to 4 year olds has the highest likelihood of being enrolled in private schools, with 432 (59.9% in the age bracket) enrolled. Conversely, the age group of 15 to 17 year olds has the lowest likelihood of being enrolled in a private school, with 815 (85.3% in the age bracket) attending a public institution.
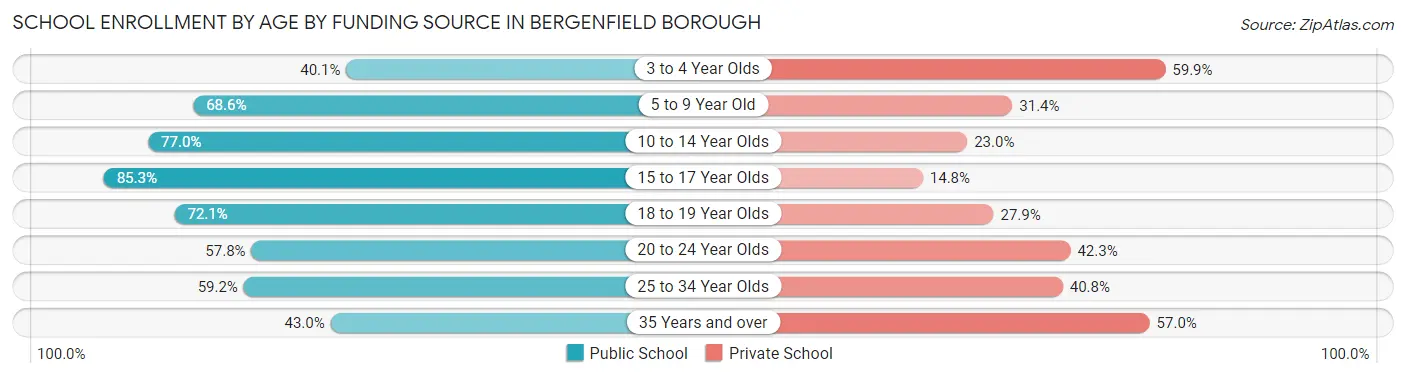
| Age Bracket | Public School | Private School |
| 3 to 4 Year Olds | 289 (40.1%) | 432 (59.9%) |
| 5 to 9 Year Old | 954 (68.6%) | 437 (31.4%) |
| 10 to 14 Year Olds | 1,294 (77.0%) | 387 (23.0%) |
| 15 to 17 Year Olds | 815 (85.3%) | 141 (14.7%) |
| 18 to 19 Year Olds | 475 (72.1%) | 184 (27.9%) |
| 20 to 24 Year Olds | 682 (57.8%) | 499 (42.2%) |
| 25 to 34 Year Olds | 219 (59.2%) | 151 (40.8%) |
| 35 Years and over | 123 (43.0%) | 163 (57.0%) |
| Total | 4,854 (67.0%) | 2,391 (33.0%) |
Educational Attainment by Field of Study in Bergenfield borough
Business (2,188 | 23.9%), science & technology (1,922 | 21.0%), engineering (755 | 8.3%), psychology (736 | 8.0%), and education (669 | 7.3%) are the most common fields of study among 9,153 individuals in Bergenfield borough who have obtained a bachelor's degree or higher.
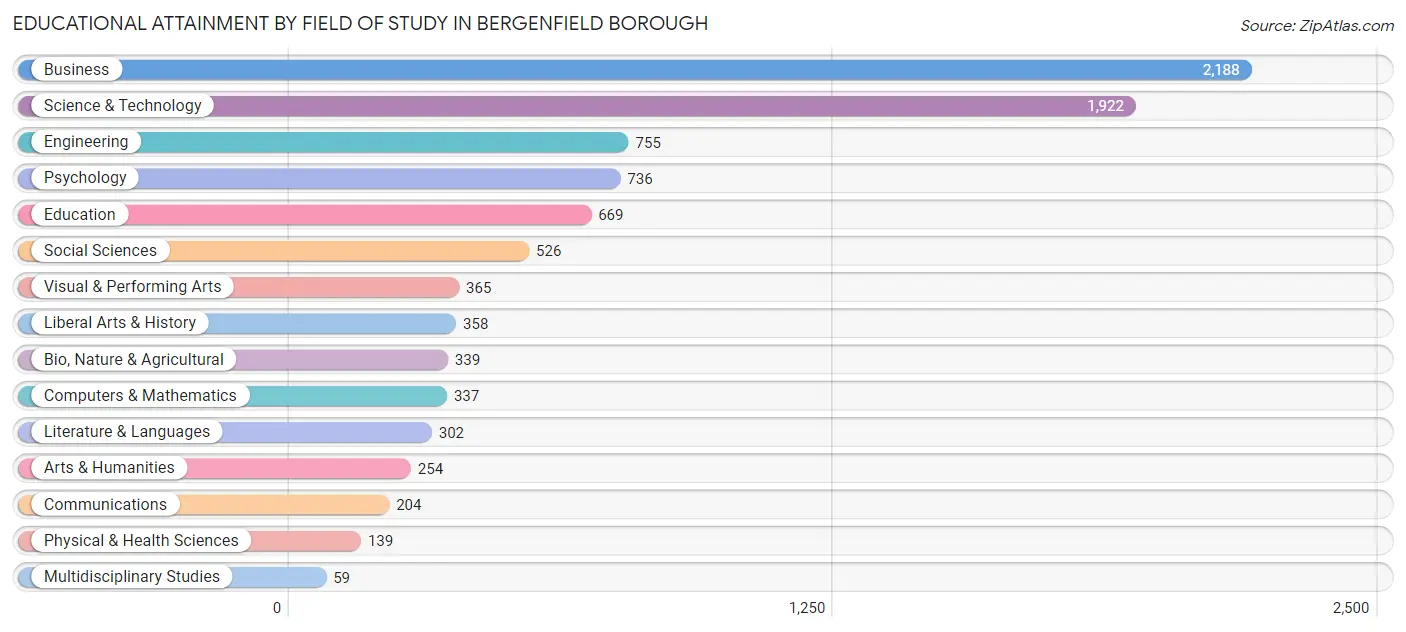
| Field of Study | # Graduates | % Graduates |
| Computers & Mathematics | 337 | 3.7% |
| Bio, Nature & Agricultural | 339 | 3.7% |
| Physical & Health Sciences | 139 | 1.5% |
| Psychology | 736 | 8.0% |
| Social Sciences | 526 | 5.8% |
| Engineering | 755 | 8.3% |
| Multidisciplinary Studies | 59 | 0.6% |
| Science & Technology | 1,922 | 21.0% |
| Business | 2,188 | 23.9% |
| Education | 669 | 7.3% |
| Literature & Languages | 302 | 3.3% |
| Liberal Arts & History | 358 | 3.9% |
| Visual & Performing Arts | 365 | 4.0% |
| Communications | 204 | 2.2% |
| Arts & Humanities | 254 | 2.8% |
| Total | 9,153 | 100.0% |
Transportation & Commute in Bergenfield borough
Vehicle Availability by Sex in Bergenfield borough
The most prevalent vehicle ownership categories in Bergenfield borough are males with 2 vehicles (3,114, accounting for 40.6%) and females with 2 vehicles (2,881, making up 46.1%).
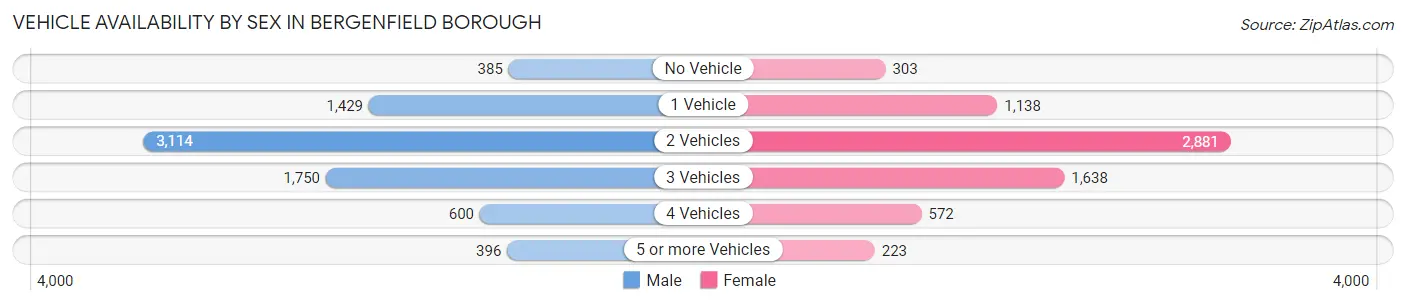
| Vehicles Available | Male | Female |
| No Vehicle | 385 (5.0%) | 303 (4.5%) |
| 1 Vehicle | 1,429 (18.6%) | 1,138 (16.9%) |
| 2 Vehicles | 3,114 (40.6%) | 2,881 (42.6%) |
| 3 Vehicles | 1,750 (22.8%) | 1,638 (24.2%) |
| 4 Vehicles | 600 (7.8%) | 572 (8.5%) |
| 5 or more Vehicles | 396 (5.2%) | 223 (3.3%) |
| Total | 7,674 (100.0%) | 6,755 (100.0%) |
Commute Time in Bergenfield borough
The most frequently occuring commute durations in Bergenfield borough are 20 to 24 minutes (2,075 commuters, 15.3%), 30 to 34 minutes (1,796 commuters, 13.3%), and 15 to 19 minutes (1,706 commuters, 12.6%).
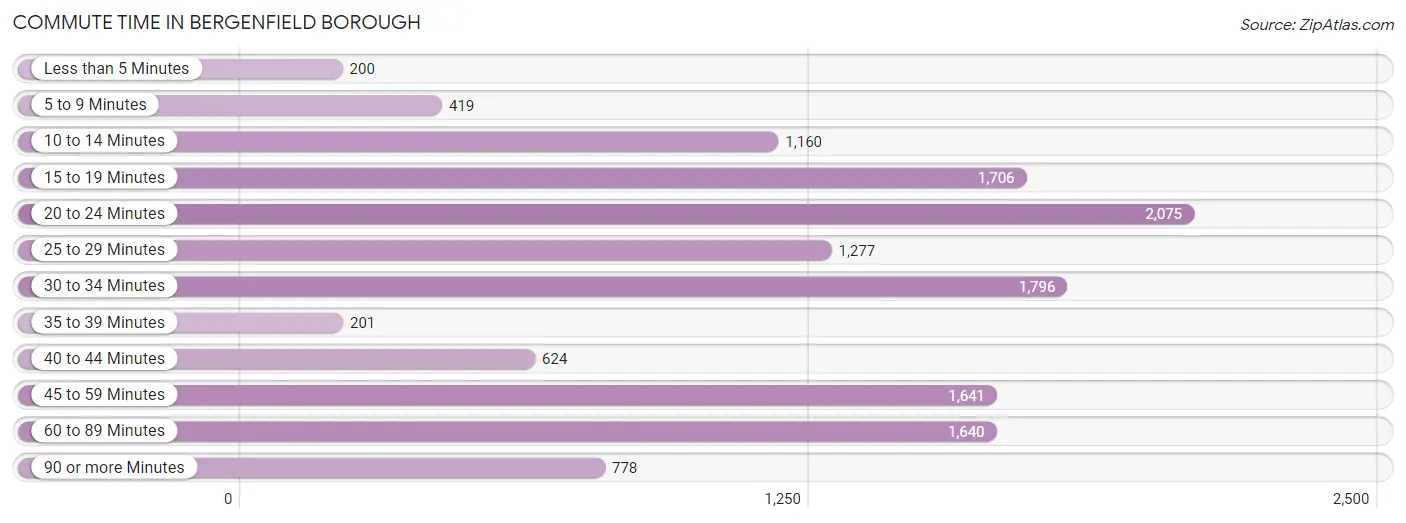
| Commute Time | # Commuters | % Commuters |
| Less than 5 Minutes | 200 | 1.5% |
| 5 to 9 Minutes | 419 | 3.1% |
| 10 to 14 Minutes | 1,160 | 8.6% |
| 15 to 19 Minutes | 1,706 | 12.6% |
| 20 to 24 Minutes | 2,075 | 15.3% |
| 25 to 29 Minutes | 1,277 | 9.5% |
| 30 to 34 Minutes | 1,796 | 13.3% |
| 35 to 39 Minutes | 201 | 1.5% |
| 40 to 44 Minutes | 624 | 4.6% |
| 45 to 59 Minutes | 1,641 | 12.1% |
| 60 to 89 Minutes | 1,640 | 12.1% |
| 90 or more Minutes | 778 | 5.8% |
Commute Time by Sex in Bergenfield borough
The most common commute times in Bergenfield borough are 45 to 59 minutes (1,150 commuters, 15.9%) for males and 20 to 24 minutes (1,037 commuters, 16.5%) for females.
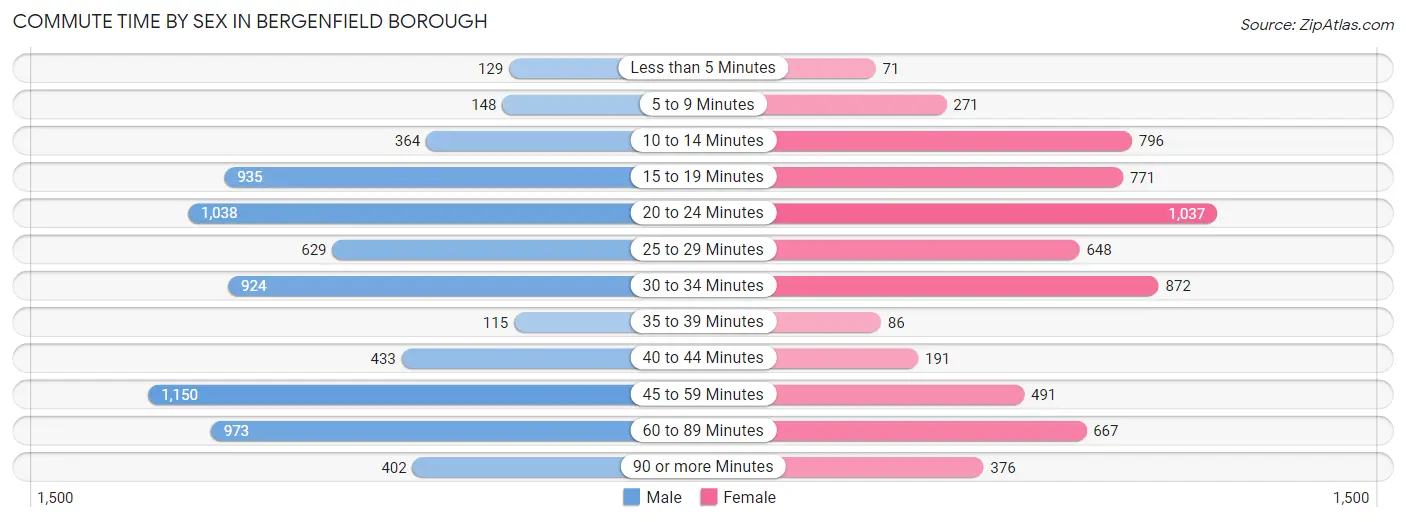
| Commute Time | Male | Female |
| Less than 5 Minutes | 129 (1.8%) | 71 (1.1%) |
| 5 to 9 Minutes | 148 (2.0%) | 271 (4.3%) |
| 10 to 14 Minutes | 364 (5.0%) | 796 (12.7%) |
| 15 to 19 Minutes | 935 (12.9%) | 771 (12.3%) |
| 20 to 24 Minutes | 1,038 (14.3%) | 1,037 (16.5%) |
| 25 to 29 Minutes | 629 (8.7%) | 648 (10.3%) |
| 30 to 34 Minutes | 924 (12.8%) | 872 (13.9%) |
| 35 to 39 Minutes | 115 (1.6%) | 86 (1.4%) |
| 40 to 44 Minutes | 433 (6.0%) | 191 (3.0%) |
| 45 to 59 Minutes | 1,150 (15.9%) | 491 (7.8%) |
| 60 to 89 Minutes | 973 (13.4%) | 667 (10.6%) |
| 90 or more Minutes | 402 (5.6%) | 376 (6.0%) |
Time of Departure to Work by Sex in Bergenfield borough
The most frequent times of departure to work in Bergenfield borough are 8:00 AM to 8:29 AM (1,400, 19.3%) for males and 8:00 AM to 8:29 AM (1,348, 21.5%) for females.
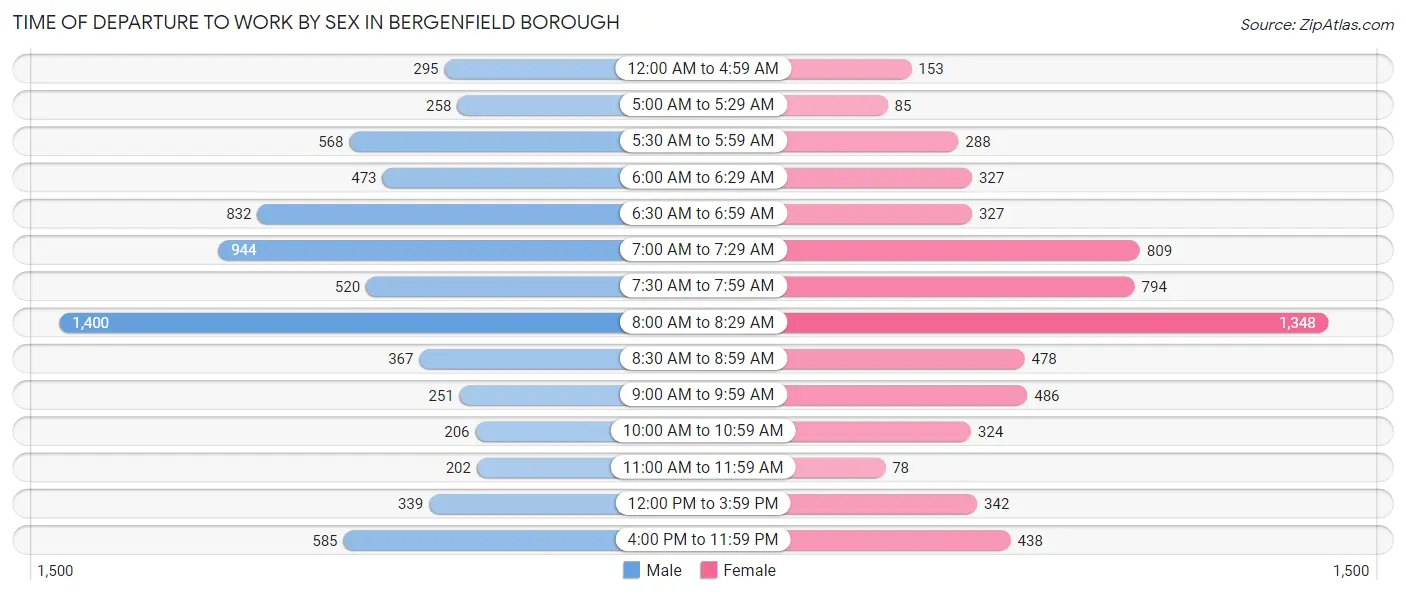
| Time of Departure | Male | Female |
| 12:00 AM to 4:59 AM | 295 (4.1%) | 153 (2.4%) |
| 5:00 AM to 5:29 AM | 258 (3.6%) | 85 (1.3%) |
| 5:30 AM to 5:59 AM | 568 (7.9%) | 288 (4.6%) |
| 6:00 AM to 6:29 AM | 473 (6.5%) | 327 (5.2%) |
| 6:30 AM to 6:59 AM | 832 (11.5%) | 327 (5.2%) |
| 7:00 AM to 7:29 AM | 944 (13.0%) | 809 (12.9%) |
| 7:30 AM to 7:59 AM | 520 (7.2%) | 794 (12.7%) |
| 8:00 AM to 8:29 AM | 1,400 (19.3%) | 1,348 (21.5%) |
| 8:30 AM to 8:59 AM | 367 (5.1%) | 478 (7.6%) |
| 9:00 AM to 9:59 AM | 251 (3.5%) | 486 (7.7%) |
| 10:00 AM to 10:59 AM | 206 (2.9%) | 324 (5.2%) |
| 11:00 AM to 11:59 AM | 202 (2.8%) | 78 (1.2%) |
| 12:00 PM to 3:59 PM | 339 (4.7%) | 342 (5.4%) |
| 4:00 PM to 11:59 PM | 585 (8.1%) | 438 (7.0%) |
| Total | 7,240 (100.0%) | 6,277 (100.0%) |
Housing Occupancy in Bergenfield borough
Occupancy by Ownership in Bergenfield borough
Of the total 9,306 dwellings in Bergenfield borough, owner-occupied units account for 6,473 (69.6%), while renter-occupied units make up 2,833 (30.4%).
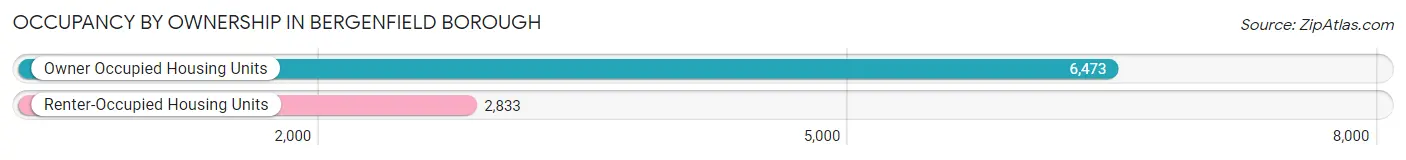
| Occupancy | # Housing Units | % Housing Units |
| Owner Occupied Housing Units | 6,473 | 69.6% |
| Renter-Occupied Housing Units | 2,833 | 30.4% |
| Total Occupied Housing Units | 9,306 | 100.0% |
Occupancy by Household Size in Bergenfield borough
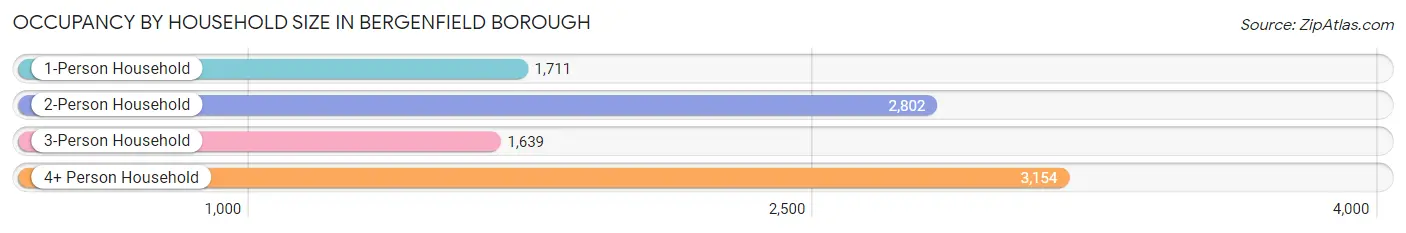
| Household Size | # Housing Units | % Housing Units |
| 1-Person Household | 1,711 | 18.4% |
| 2-Person Household | 2,802 | 30.1% |
| 3-Person Household | 1,639 | 17.6% |
| 4+ Person Household | 3,154 | 33.9% |
| Total Housing Units | 9,306 | 100.0% |
Occupancy by Ownership by Household Size in Bergenfield borough
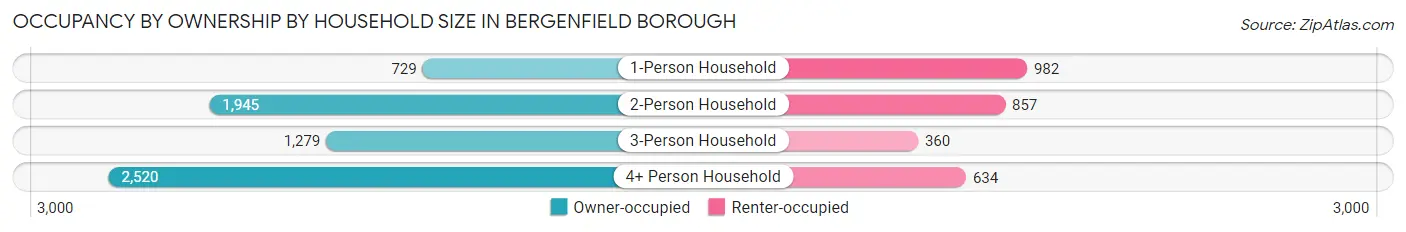
| Household Size | Owner-occupied | Renter-occupied |
| 1-Person Household | 729 (42.6%) | 982 (57.4%) |
| 2-Person Household | 1,945 (69.4%) | 857 (30.6%) |
| 3-Person Household | 1,279 (78.0%) | 360 (22.0%) |
| 4+ Person Household | 2,520 (79.9%) | 634 (20.1%) |
| Total Housing Units | 6,473 (69.6%) | 2,833 (30.4%) |
Occupancy by Educational Attainment in Bergenfield borough
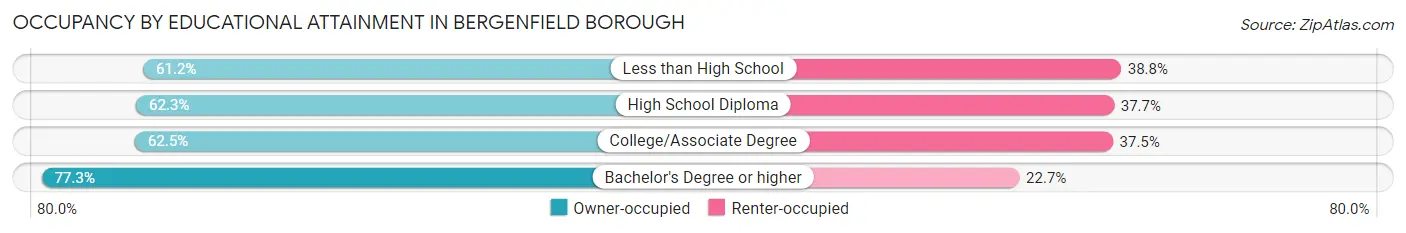
| Household Size | Owner-occupied | Renter-occupied |
| Less than High School | 347 (61.2%) | 220 (38.8%) |
| High School Diploma | 1,217 (62.3%) | 736 (37.7%) |
| College/Associate Degree | 1,425 (62.5%) | 855 (37.5%) |
| Bachelor's Degree or higher | 3,484 (77.3%) | 1,022 (22.7%) |
Occupancy by Age of Householder in Bergenfield borough
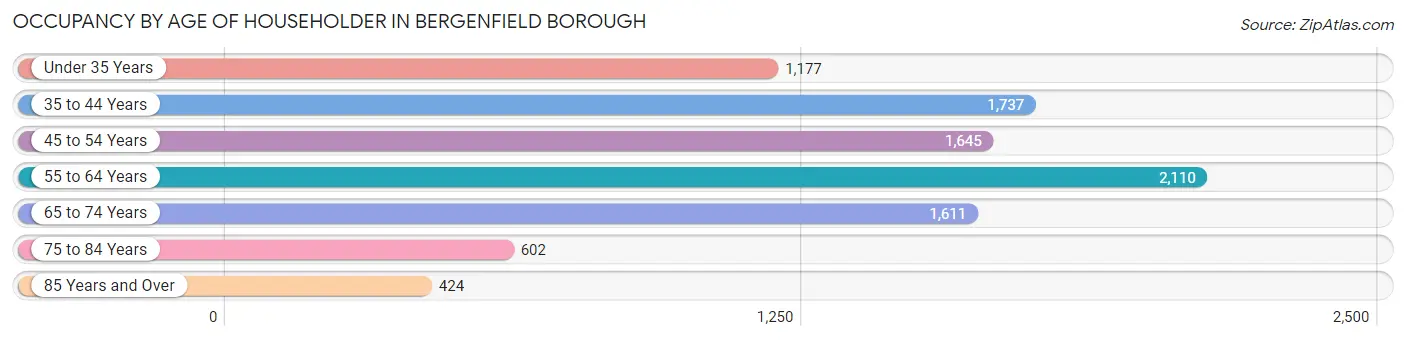
| Age Bracket | # Households | % Households |
| Under 35 Years | 1,177 | 12.7% |
| 35 to 44 Years | 1,737 | 18.7% |
| 45 to 54 Years | 1,645 | 17.7% |
| 55 to 64 Years | 2,110 | 22.7% |
| 65 to 74 Years | 1,611 | 17.3% |
| 75 to 84 Years | 602 | 6.5% |
| 85 Years and Over | 424 | 4.6% |
| Total | 9,306 | 100.0% |
Housing Finances in Bergenfield borough
Median Income by Occupancy in Bergenfield borough
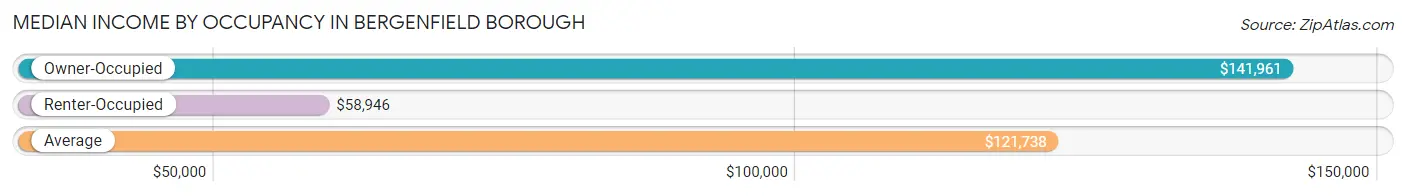
| Occupancy Type | # Households | Median Income |
| Owner-Occupied | 6,473 (69.6%) | $141,961 |
| Renter-Occupied | 2,833 (30.4%) | $58,946 |
| Average | 9,306 (100.0%) | $121,738 |
Occupancy by Householder Income Bracket in Bergenfield borough
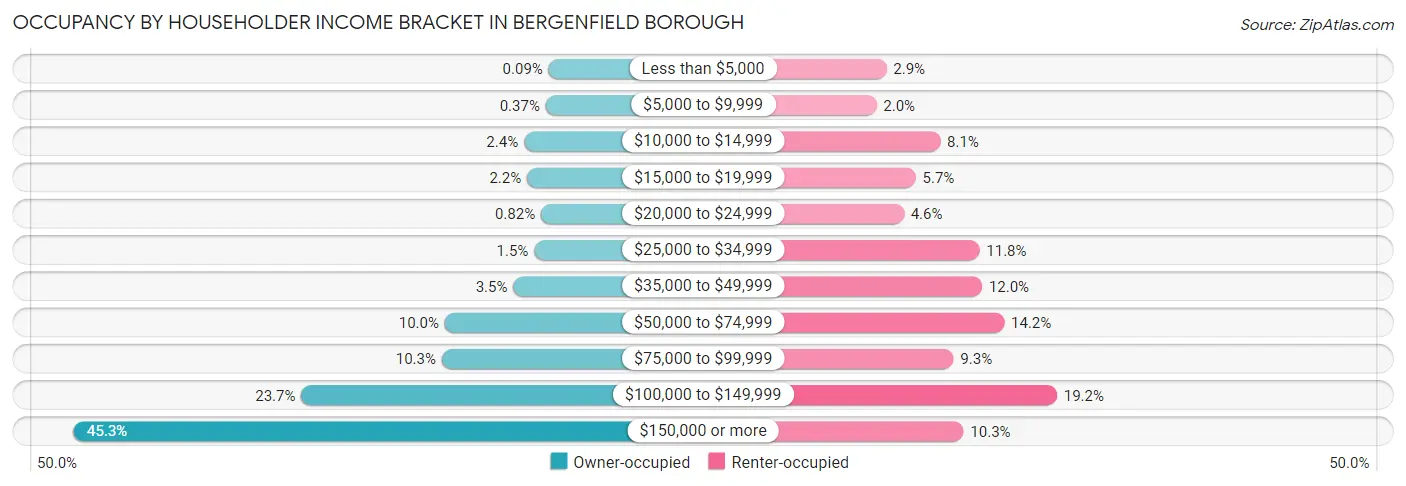
| Income Bracket | Owner-occupied | Renter-occupied |
| Less than $5,000 | 6 (0.1%) | 83 (2.9%) |
| $5,000 to $9,999 | 24 (0.4%) | 56 (2.0%) |
| $10,000 to $14,999 | 158 (2.4%) | 228 (8.1%) |
| $15,000 to $19,999 | 139 (2.1%) | 162 (5.7%) |
| $20,000 to $24,999 | 53 (0.8%) | 130 (4.6%) |
| $25,000 to $34,999 | 95 (1.5%) | 334 (11.8%) |
| $35,000 to $49,999 | 224 (3.5%) | 341 (12.0%) |
| $50,000 to $74,999 | 646 (10.0%) | 401 (14.1%) |
| $75,000 to $99,999 | 665 (10.3%) | 264 (9.3%) |
| $100,000 to $149,999 | 1,531 (23.6%) | 543 (19.2%) |
| $150,000 or more | 2,932 (45.3%) | 291 (10.3%) |
| Total | 6,473 (100.0%) | 2,833 (100.0%) |
Monthly Housing Cost Tiers in Bergenfield borough
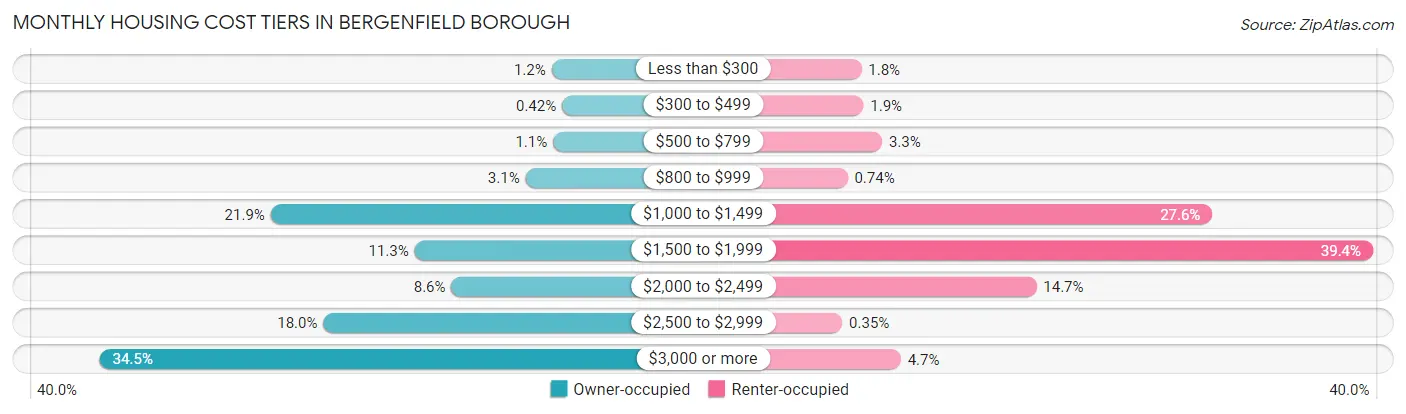
| Monthly Cost | Owner-occupied | Renter-occupied |
| Less than $300 | 77 (1.2%) | 50 (1.8%) |
| $300 to $499 | 27 (0.4%) | 54 (1.9%) |
| $500 to $799 | 70 (1.1%) | 93 (3.3%) |
| $800 to $999 | 201 (3.1%) | 21 (0.7%) |
| $1,000 to $1,499 | 1,416 (21.9%) | 782 (27.6%) |
| $1,500 to $1,999 | 730 (11.3%) | 1,117 (39.4%) |
| $2,000 to $2,499 | 555 (8.6%) | 415 (14.6%) |
| $2,500 to $2,999 | 1,165 (18.0%) | 10 (0.4%) |
| $3,000 or more | 2,232 (34.5%) | 132 (4.7%) |
| Total | 6,473 (100.0%) | 2,833 (100.0%) |
Physical Housing Characteristics in Bergenfield borough
Housing Structures in Bergenfield borough
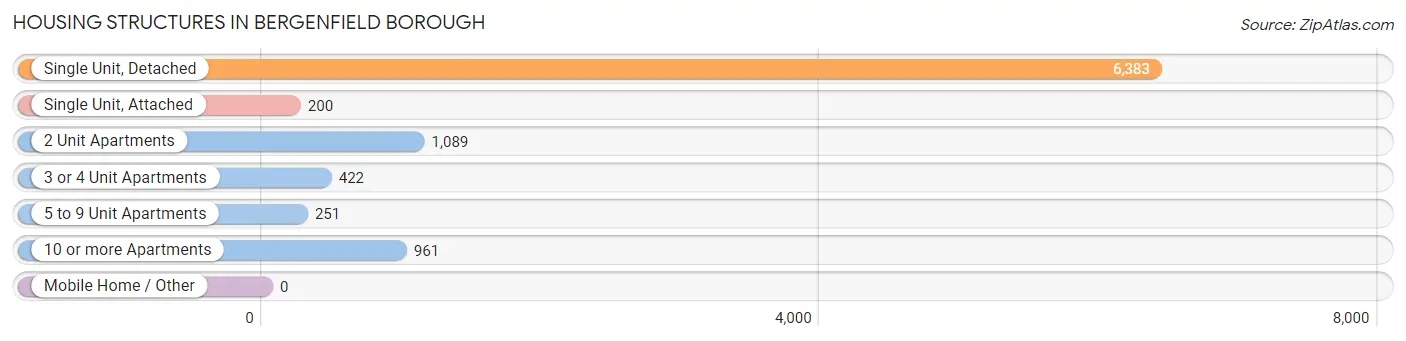
| Structure Type | # Housing Units | % Housing Units |
| Single Unit, Detached | 6,383 | 68.6% |
| Single Unit, Attached | 200 | 2.1% |
| 2 Unit Apartments | 1,089 | 11.7% |
| 3 or 4 Unit Apartments | 422 | 4.5% |
| 5 to 9 Unit Apartments | 251 | 2.7% |
| 10 or more Apartments | 961 | 10.3% |
| Mobile Home / Other | 0 | 0.0% |
| Total | 9,306 | 100.0% |
Housing Structures by Occupancy in Bergenfield borough
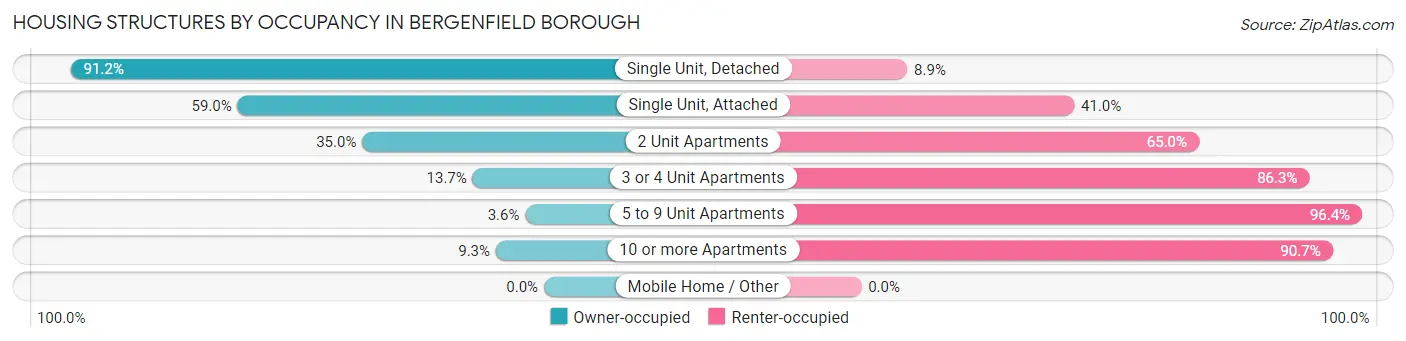
| Structure Type | Owner-occupied | Renter-occupied |
| Single Unit, Detached | 5,818 (91.1%) | 565 (8.8%) |
| Single Unit, Attached | 118 (59.0%) | 82 (41.0%) |
| 2 Unit Apartments | 381 (35.0%) | 708 (65.0%) |
| 3 or 4 Unit Apartments | 58 (13.7%) | 364 (86.3%) |
| 5 to 9 Unit Apartments | 9 (3.6%) | 242 (96.4%) |
| 10 or more Apartments | 89 (9.3%) | 872 (90.7%) |
| Mobile Home / Other | 0 (0.0%) | 0 (0.0%) |
| Total | 6,473 (69.6%) | 2,833 (30.4%) |
Housing Structures by Number of Rooms in Bergenfield borough
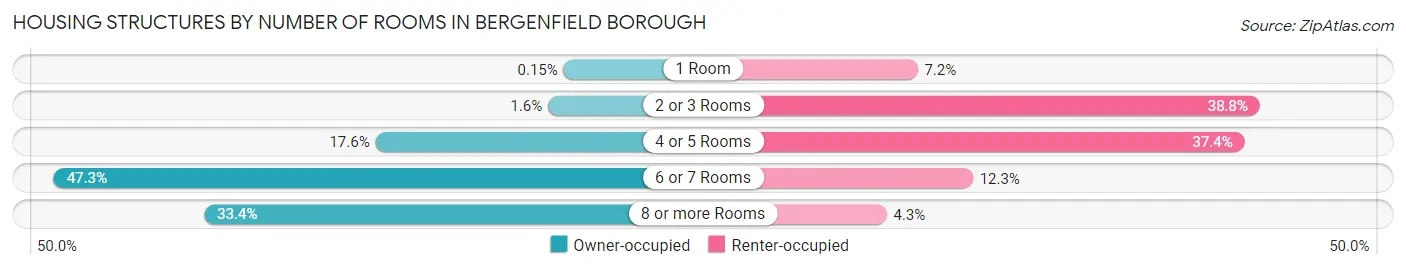
| Number of Rooms | Owner-occupied | Renter-occupied |
| 1 Room | 10 (0.2%) | 203 (7.2%) |
| 2 or 3 Rooms | 103 (1.6%) | 1,100 (38.8%) |
| 4 or 5 Rooms | 1,136 (17.5%) | 1,060 (37.4%) |
| 6 or 7 Rooms | 3,062 (47.3%) | 348 (12.3%) |
| 8 or more Rooms | 2,162 (33.4%) | 122 (4.3%) |
| Total | 6,473 (100.0%) | 2,833 (100.0%) |
Housing Structure by Heating Type in Bergenfield borough
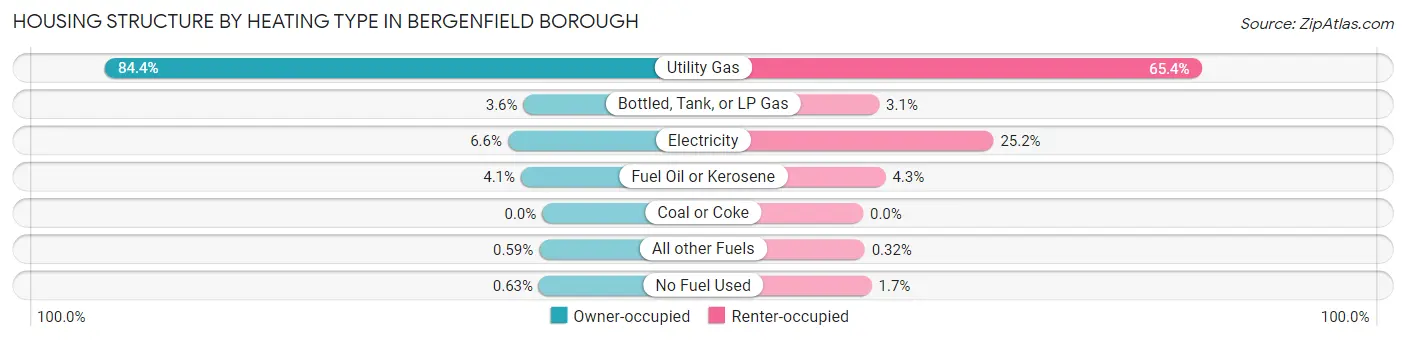
| Heating Type | Owner-occupied | Renter-occupied |
| Utility Gas | 5,465 (84.4%) | 1,852 (65.4%) |
| Bottled, Tank, or LP Gas | 234 (3.6%) | 88 (3.1%) |
| Electricity | 429 (6.6%) | 714 (25.2%) |
| Fuel Oil or Kerosene | 266 (4.1%) | 123 (4.3%) |
| Coal or Coke | 0 (0.0%) | 0 (0.0%) |
| All other Fuels | 38 (0.6%) | 9 (0.3%) |
| No Fuel Used | 41 (0.6%) | 47 (1.7%) |
| Total | 6,473 (100.0%) | 2,833 (100.0%) |
Household Vehicle Usage in Bergenfield borough
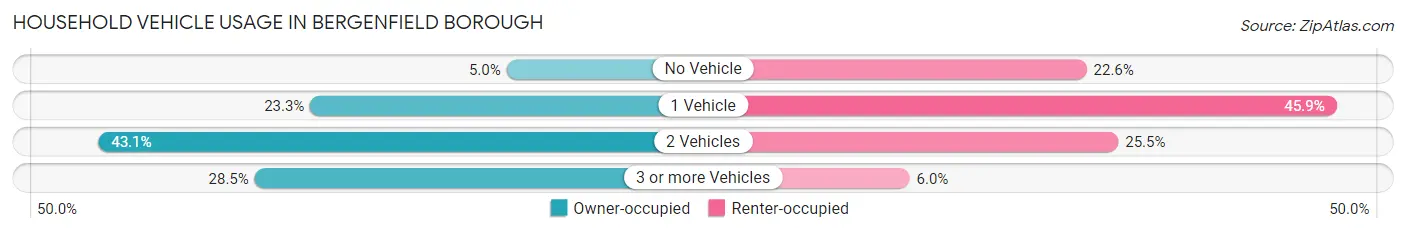
| Vehicles per Household | Owner-occupied | Renter-occupied |
| No Vehicle | 324 (5.0%) | 639 (22.6%) |
| 1 Vehicle | 1,511 (23.3%) | 1,300 (45.9%) |
| 2 Vehicles | 2,791 (43.1%) | 723 (25.5%) |
| 3 or more Vehicles | 1,847 (28.5%) | 171 (6.0%) |
| Total | 6,473 (100.0%) | 2,833 (100.0%) |
Real Estate & Mortgages in Bergenfield borough
Real Estate and Mortgage Overview in Bergenfield borough
| Characteristic | Without Mortgage | With Mortgage |
| Housing Units | 2,079 | 4,394 |
| Median Property Value | $428,700 | $441,700 |
| Median Household Income | $103,990 | $2,365 |
| Monthly Housing Costs | $1,310 | $2,232 |
| Real Estate Taxes | $10,001 | $59 |
Property Value by Mortgage Status in Bergenfield borough
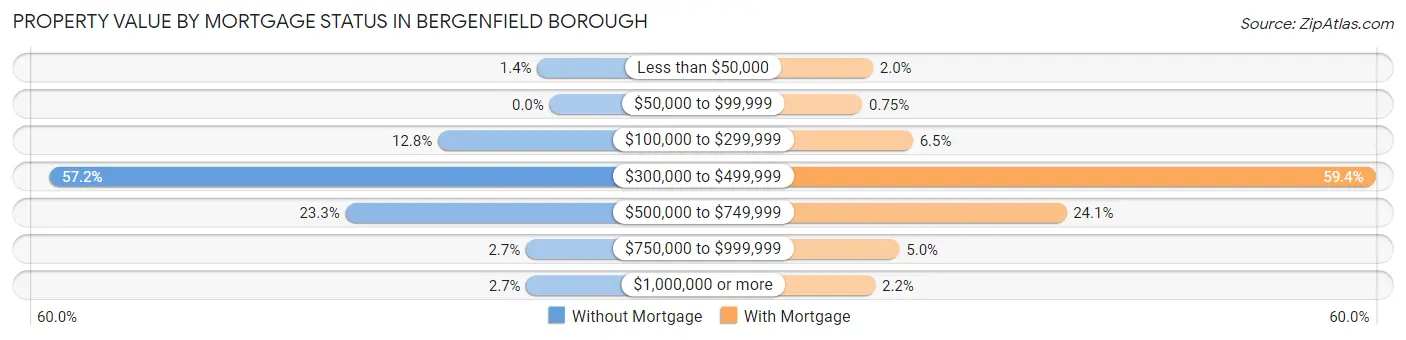
| Property Value | Without Mortgage | With Mortgage |
| Less than $50,000 | 29 (1.4%) | 87 (2.0%) |
| $50,000 to $99,999 | 0 (0.0%) | 33 (0.7%) |
| $100,000 to $299,999 | 265 (12.8%) | 287 (6.5%) |
| $300,000 to $499,999 | 1,189 (57.2%) | 2,611 (59.4%) |
| $500,000 to $749,999 | 485 (23.3%) | 1,058 (24.1%) |
| $750,000 to $999,999 | 56 (2.7%) | 220 (5.0%) |
| $1,000,000 or more | 55 (2.6%) | 98 (2.2%) |
| Total | 2,079 (100.0%) | 4,394 (100.0%) |
Household Income by Mortgage Status in Bergenfield borough
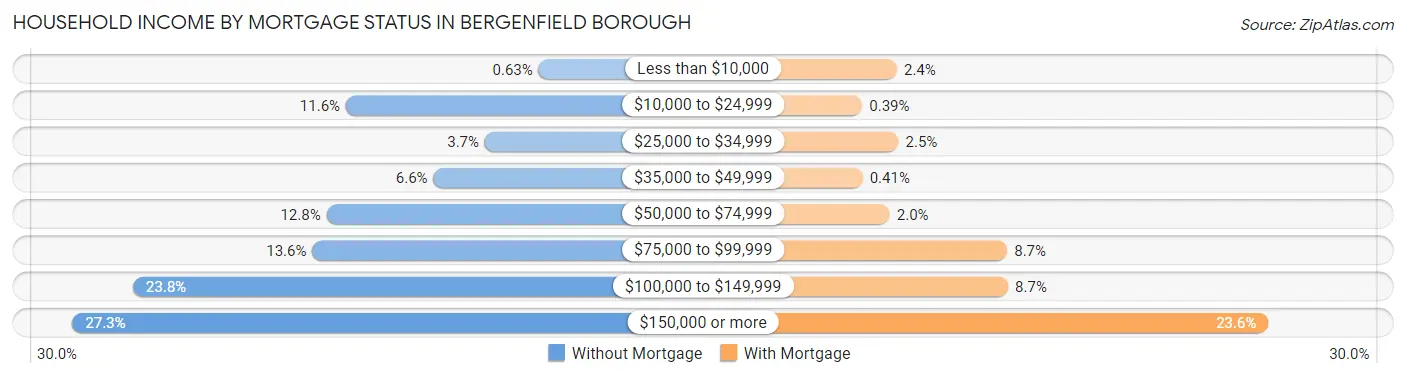
| Household Income | Without Mortgage | With Mortgage |
| Less than $10,000 | 13 (0.6%) | 104 (2.4%) |
| $10,000 to $24,999 | 242 (11.6%) | 17 (0.4%) |
| $25,000 to $34,999 | 77 (3.7%) | 108 (2.5%) |
| $35,000 to $49,999 | 138 (6.6%) | 18 (0.4%) |
| $50,000 to $74,999 | 265 (12.8%) | 86 (2.0%) |
| $75,000 to $99,999 | 282 (13.6%) | 381 (8.7%) |
| $100,000 to $149,999 | 495 (23.8%) | 383 (8.7%) |
| $150,000 or more | 567 (27.3%) | 1,036 (23.6%) |
| Total | 2,079 (100.0%) | 4,394 (100.0%) |
Property Value to Household Income Ratio in Bergenfield borough
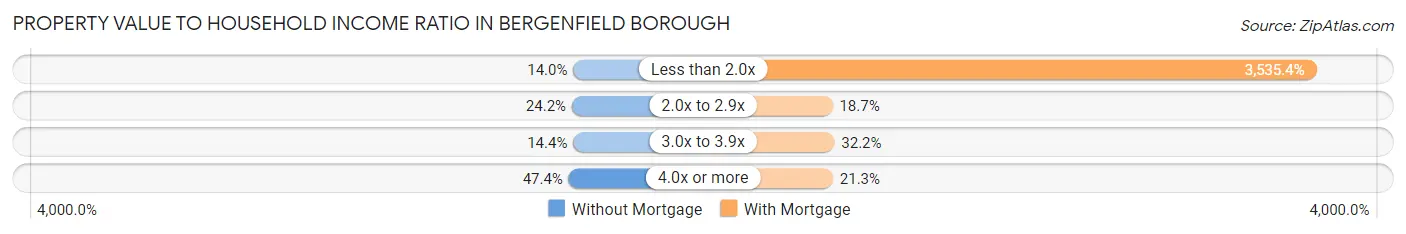
| Value-to-Income Ratio | Without Mortgage | With Mortgage |
| Less than 2.0x | 290 (14.0%) | 155,346 (3,535.4%) |
| 2.0x to 2.9x | 503 (24.2%) | 820 (18.7%) |
| 3.0x to 3.9x | 300 (14.4%) | 1,415 (32.2%) |
| 4.0x or more | 986 (47.4%) | 936 (21.3%) |
| Total | 2,079 (100.0%) | 4,394 (100.0%) |
Real Estate Taxes by Mortgage Status in Bergenfield borough
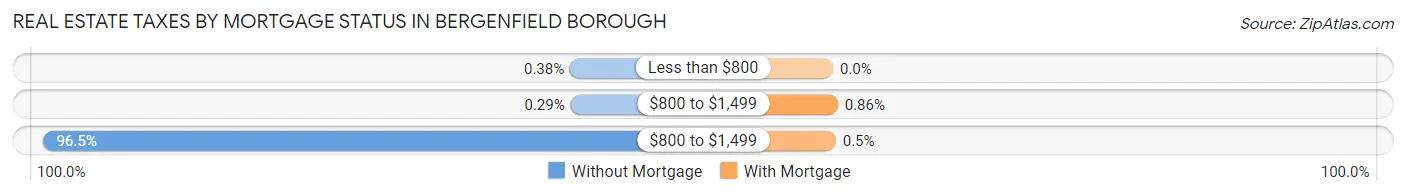
| Property Taxes | Without Mortgage | With Mortgage |
| Less than $800 | 8 (0.4%) | 0 (0.0%) |
| $800 to $1,499 | 6 (0.3%) | 38 (0.9%) |
| $800 to $1,499 | 2,007 (96.5%) | 22 (0.5%) |
| Total | 2,079 (100.0%) | 4,394 (100.0%) |
Health & Disability in Bergenfield borough
Health Insurance Coverage by Age in Bergenfield borough
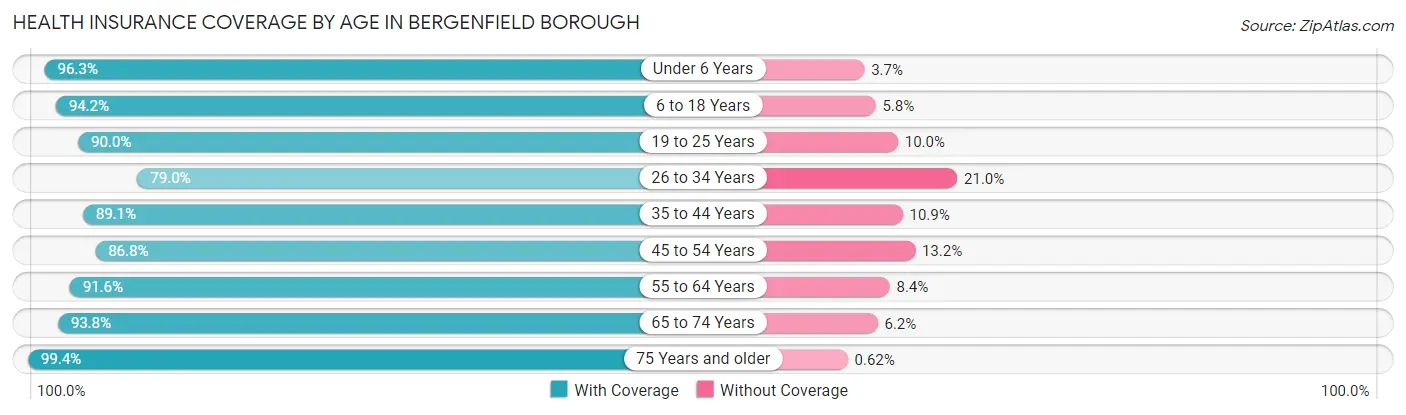
| Age Bracket | With Coverage | Without Coverage |
| Under 6 Years | 2,043 (96.3%) | 79 (3.7%) |
| 6 to 18 Years | 3,965 (94.2%) | 245 (5.8%) |
| 19 to 25 Years | 2,446 (90.0%) | 271 (10.0%) |
| 26 to 34 Years | 2,496 (79.0%) | 665 (21.0%) |
| 35 to 44 Years | 3,233 (89.1%) | 394 (10.9%) |
| 45 to 54 Years | 2,950 (86.8%) | 448 (13.2%) |
| 55 to 64 Years | 3,787 (91.6%) | 349 (8.4%) |
| 65 to 74 Years | 2,892 (93.8%) | 191 (6.2%) |
| 75 Years and older | 1,758 (99.4%) | 11 (0.6%) |
| Total | 25,570 (90.6%) | 2,653 (9.4%) |
Health Insurance Coverage by Citizenship Status in Bergenfield borough
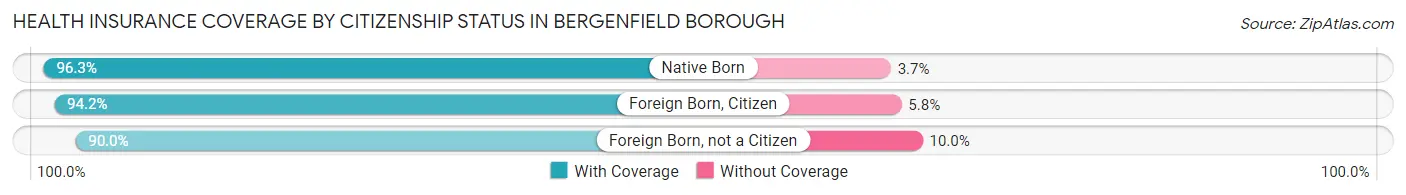
| Citizenship Status | With Coverage | Without Coverage |
| Native Born | 2,043 (96.3%) | 79 (3.7%) |
| Foreign Born, Citizen | 3,965 (94.2%) | 245 (5.8%) |
| Foreign Born, not a Citizen | 2,446 (90.0%) | 271 (10.0%) |
Health Insurance Coverage by Household Income in Bergenfield borough
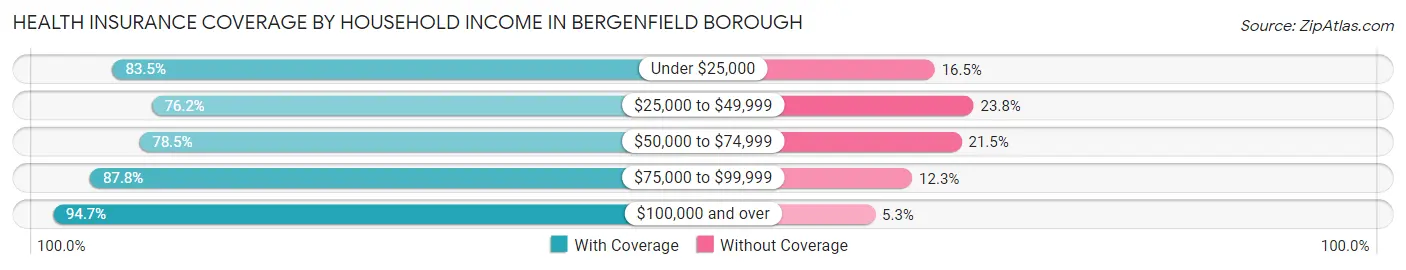
| Household Income | With Coverage | Without Coverage |
| Under $25,000 | 1,597 (83.5%) | 315 (16.5%) |
| $25,000 to $49,999 | 1,648 (76.2%) | 514 (23.8%) |
| $50,000 to $74,999 | 1,913 (78.5%) | 524 (21.5%) |
| $75,000 to $99,999 | 1,919 (87.7%) | 268 (12.2%) |
| $100,000 and over | 18,428 (94.7%) | 1,031 (5.3%) |
Public vs Private Health Insurance Coverage by Age in Bergenfield borough
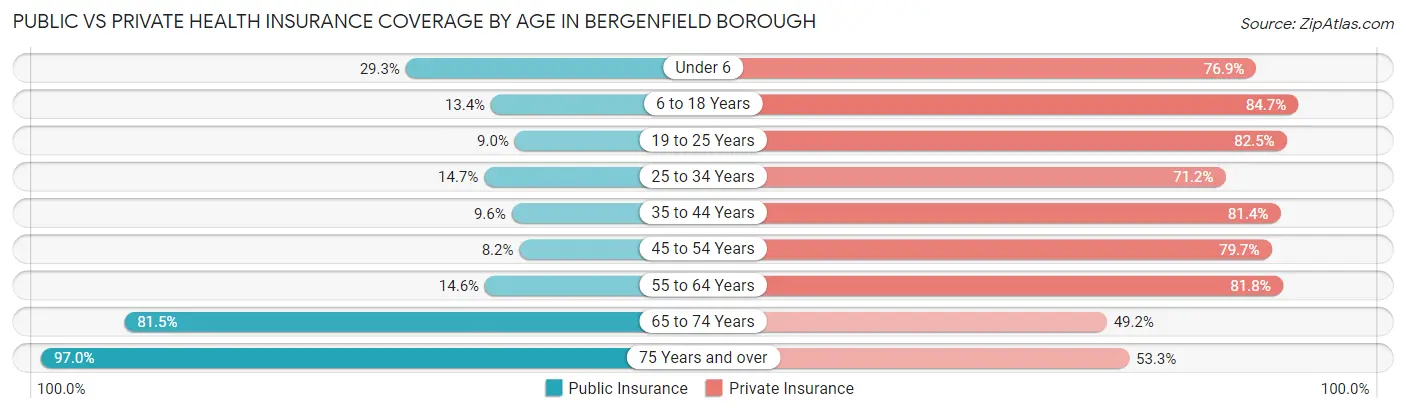
| Age Bracket | Public Insurance | Private Insurance |
| Under 6 | 621 (29.3%) | 1,632 (76.9%) |
| 6 to 18 Years | 566 (13.4%) | 3,565 (84.7%) |
| 19 to 25 Years | 245 (9.0%) | 2,242 (82.5%) |
| 25 to 34 Years | 465 (14.7%) | 2,250 (71.2%) |
| 35 to 44 Years | 349 (9.6%) | 2,951 (81.4%) |
| 45 to 54 Years | 278 (8.2%) | 2,709 (79.7%) |
| 55 to 64 Years | 602 (14.6%) | 3,383 (81.8%) |
| 65 to 74 Years | 2,513 (81.5%) | 1,516 (49.2%) |
| 75 Years and over | 1,715 (97.0%) | 943 (53.3%) |
| Total | 7,354 (26.1%) | 21,191 (75.1%) |
Disability Status by Sex by Age in Bergenfield borough
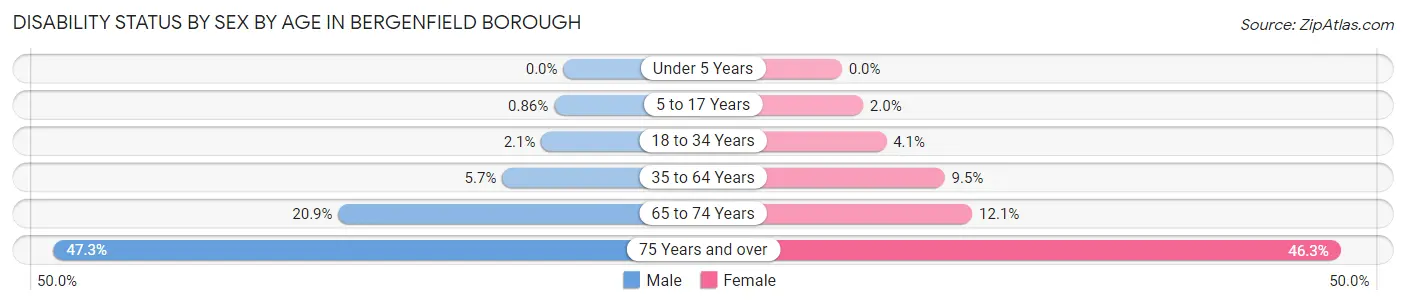
| Age Bracket | Male | Female |
| Under 5 Years | 0 (0.0%) | 0 (0.0%) |
| 5 to 17 Years | 19 (0.9%) | 38 (2.0%) |
| 18 to 34 Years | 65 (2.1%) | 128 (4.1%) |
| 35 to 64 Years | 309 (5.7%) | 545 (9.5%) |
| 65 to 74 Years | 290 (20.9%) | 205 (12.1%) |
| 75 Years and over | 333 (47.3%) | 493 (46.3%) |
Disability Class by Sex by Age in Bergenfield borough
Disability Class: Hearing Difficulty
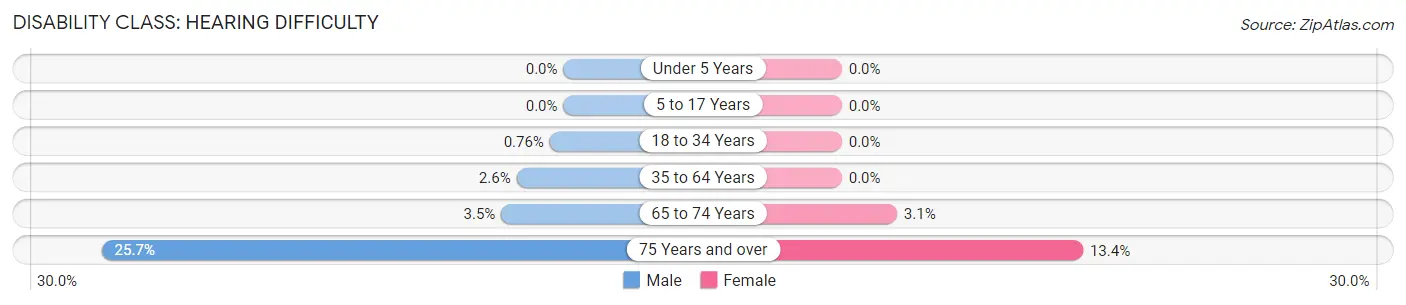
| Age Bracket | Male | Female |
| Under 5 Years | 0 (0.0%) | 0 (0.0%) |
| 5 to 17 Years | 0 (0.0%) | 0 (0.0%) |
| 18 to 34 Years | 24 (0.8%) | 0 (0.0%) |
| 35 to 64 Years | 142 (2.6%) | 0 (0.0%) |
| 65 to 74 Years | 48 (3.5%) | 52 (3.1%) |
| 75 Years and over | 181 (25.7%) | 143 (13.4%) |
Disability Class: Vision Difficulty
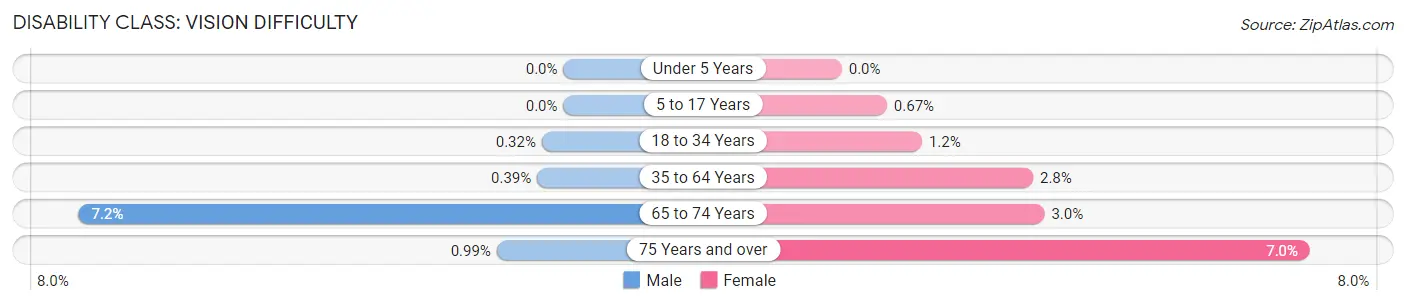
| Age Bracket | Male | Female |
| Under 5 Years | 0 (0.0%) | 0 (0.0%) |
| 5 to 17 Years | 0 (0.0%) | 13 (0.7%) |
| 18 to 34 Years | 10 (0.3%) | 37 (1.2%) |
| 35 to 64 Years | 21 (0.4%) | 162 (2.8%) |
| 65 to 74 Years | 100 (7.2%) | 51 (3.0%) |
| 75 Years and over | 7 (1.0%) | 74 (7.0%) |
Disability Class: Cognitive Difficulty
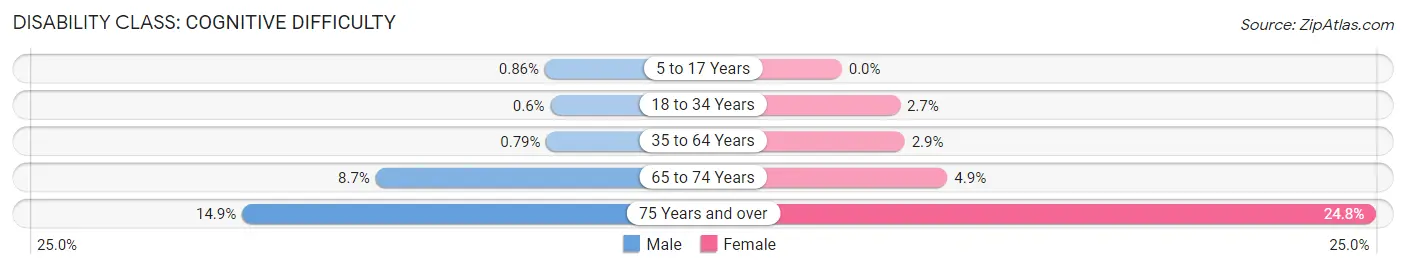
| Age Bracket | Male | Female |
| 5 to 17 Years | 19 (0.9%) | 0 (0.0%) |
| 18 to 34 Years | 19 (0.6%) | 84 (2.7%) |
| 35 to 64 Years | 43 (0.8%) | 167 (2.9%) |
| 65 to 74 Years | 121 (8.7%) | 83 (4.9%) |
| 75 Years and over | 105 (14.9%) | 264 (24.8%) |
Disability Class: Ambulatory Difficulty
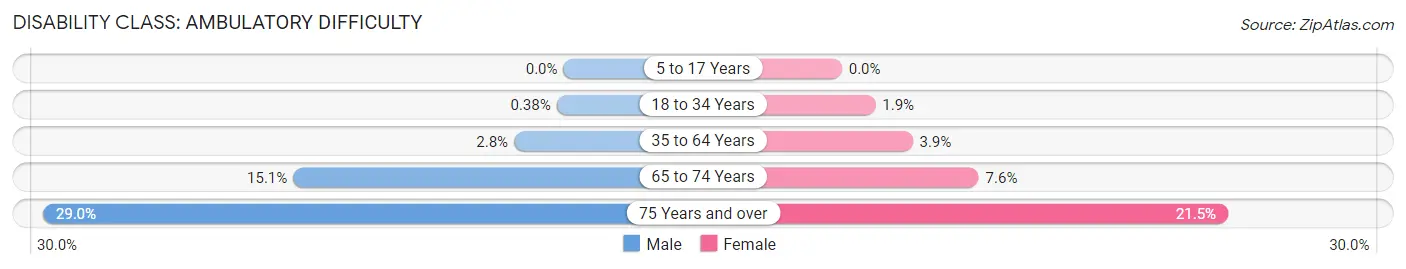
| Age Bracket | Male | Female |
| 5 to 17 Years | 0 (0.0%) | 0 (0.0%) |
| 18 to 34 Years | 12 (0.4%) | 58 (1.9%) |
| 35 to 64 Years | 150 (2.8%) | 225 (3.9%) |
| 65 to 74 Years | 209 (15.0%) | 129 (7.6%) |
| 75 Years and over | 204 (29.0%) | 229 (21.5%) |
Disability Class: Self-Care Difficulty
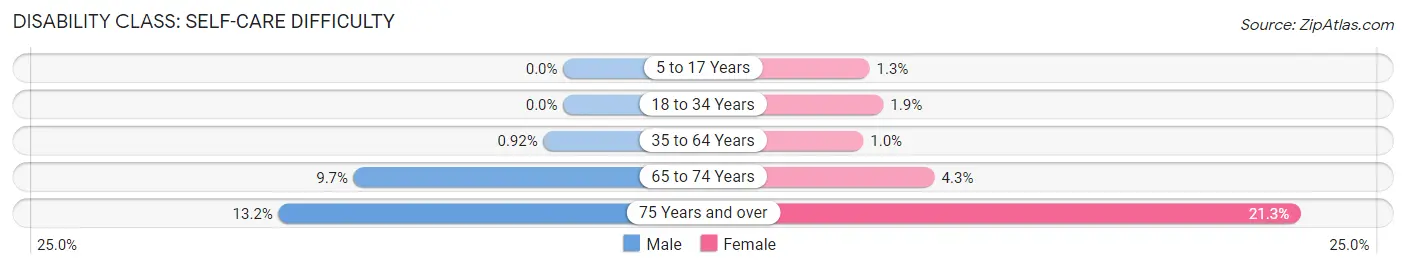
| Age Bracket | Male | Female |
| 5 to 17 Years | 0 (0.0%) | 25 (1.3%) |
| 18 to 34 Years | 0 (0.0%) | 60 (1.9%) |
| 35 to 64 Years | 50 (0.9%) | 57 (1.0%) |
| 65 to 74 Years | 135 (9.7%) | 73 (4.3%) |
| 75 Years and over | 93 (13.2%) | 227 (21.3%) |
Technology Access in Bergenfield borough
Computing Device Access in Bergenfield borough
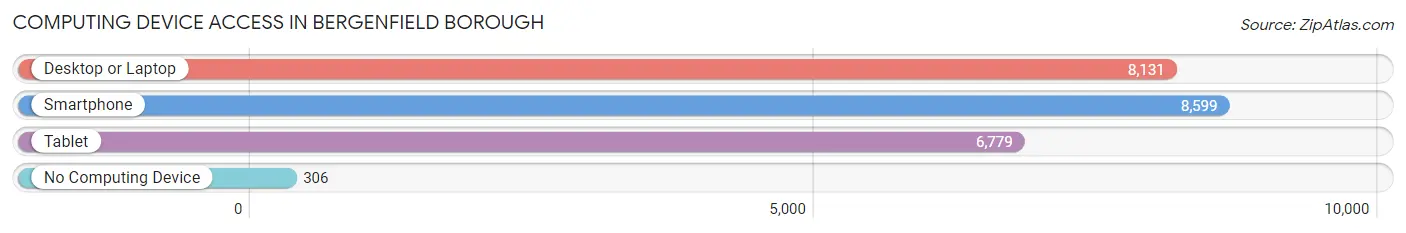
| Device Type | # Households | % Households |
| Desktop or Laptop | 8,131 | 87.4% |
| Smartphone | 8,599 | 92.4% |
| Tablet | 6,779 | 72.9% |
| No Computing Device | 306 | 3.3% |
| Total | 9,306 | 100.0% |
Internet Access in Bergenfield borough
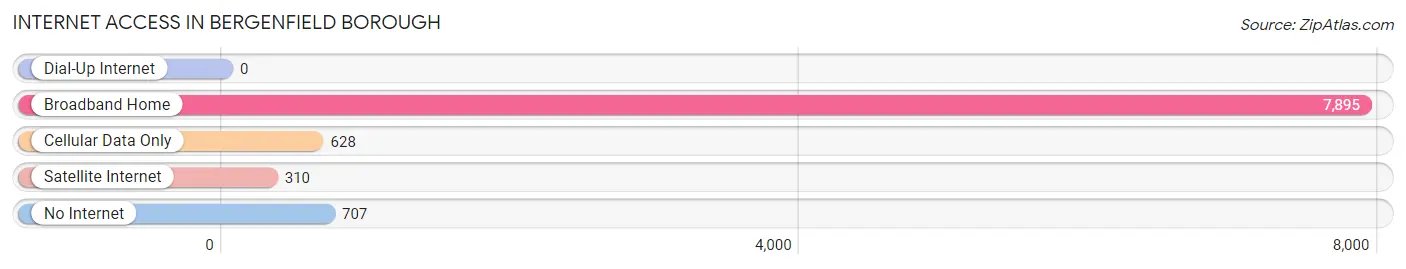
| Internet Type | # Households | % Households |
| Dial-Up Internet | 0 | 0.0% |
| Broadband Home | 7,895 | 84.8% |
| Cellular Data Only | 628 | 6.8% |
| Satellite Internet | 310 | 3.3% |
| No Internet | 707 | 7.6% |
| Total | 9,306 | 100.0% |
Bergenfield borough Summary
Bergenfield Borough, NJ is a small town located in Bergen County, New Jersey. It is situated in the northeastern part of the state, just west of the Hudson River and north of New York City. The borough is home to a population of approximately 26,000 people, making it one of the most densely populated towns in the state.
History
Bergenfield Borough was first settled in 1661 by Dutch settlers, who named it New Bridge. The town was officially incorporated in 1894, and was named after the nearby Bergen County. The town was originally a farming community, but in the late 19th century, it began to develop into a residential area. The town was also home to a number of factories, including a silk mill, a paper mill, and a shoe factory.
Geography
Bergenfield Borough is located in the northeastern part of New Jersey, just west of the Hudson River and north of New York City. The borough is bordered by the towns of Teaneck, Englewood, and Tenafly. The borough is situated on a flat plain, with an elevation of approximately 20 feet above sea level. The borough is home to several parks, including the Bergenfield Park, which features a playground, a basketball court, and a baseball field.
Economy
Bergenfield Borough has a diverse economy, with a variety of businesses and industries. The borough is home to a number of retail stores, restaurants, and other businesses. The borough is also home to a number of manufacturing companies, including a paper mill, a printing company, and a shoe factory. The borough is also home to a number of medical facilities, including a hospital and several medical offices.
Demographics
As of the 2010 census, the population of Bergenfield Borough was 26,764. The population is predominantly white, with a small percentage of African Americans, Asians, and Hispanics. The median household income is $72,813, and the median home value is $420,000. The borough has a high rate of homeownership, with over 70% of residents owning their own homes.
Bergenfield Borough is a small town with a rich history and a diverse economy. The borough is home to a variety of businesses and industries, and is a popular destination for those looking for a quiet, suburban lifestyle. The borough is also home to a number of parks and recreational facilities, making it an ideal place to live for those who enjoy the outdoors.
Common Questions
What is Per Capita Income in Bergenfield borough?
Per Capita income in Bergenfield borough is $44,580.
What is the Median Family Income in Bergenfield borough?
Median Family Income in Bergenfield borough is $134,980.
What is the Median Household income in Bergenfield borough?
Median Household Income in Bergenfield borough is $121,738.
What is Income or Wage Gap in Bergenfield borough?
Income or Wage Gap in Bergenfield borough is 32.2%.
Women in Bergenfield borough earn 67.8 cents for every dollar earned by a man.
What is Inequality or Gini Index in Bergenfield borough?
Inequality or Gini Index in Bergenfield borough is 0.41.
What is the Total Population of Bergenfield borough?
Total Population of Bergenfield borough is 28,223.
What is the Total Male Population of Bergenfield borough?
Total Male Population of Bergenfield borough is 14,005.
What is the Total Female Population of Bergenfield borough?
Total Female Population of Bergenfield borough is 14,218.
What is the Ratio of Males per 100 Females in Bergenfield borough?
There are 98.50 Males per 100 Females in Bergenfield borough.
What is the Ratio of Females per 100 Males in Bergenfield borough?
There are 101.52 Females per 100 Males in Bergenfield borough.
What is the Median Population Age in Bergenfield borough?
Median Population Age in Bergenfield borough is 40.5 Years.
What is the Average Family Size in Bergenfield borough
Average Family Size in Bergenfield borough is 3.5 People.
What is the Average Household Size in Bergenfield borough
Average Household Size in Bergenfield borough is 3.0 People.
How Large is the Labor Force in Bergenfield borough?
There are 15,688 People in the Labor Forcein in Bergenfield borough.
What is the Percentage of People in the Labor Force in Bergenfield borough?
68.7% of People are in the Labor Force in Bergenfield borough.
What is the Unemployment Rate in Bergenfield borough?
Unemployment Rate in Bergenfield borough is 6.0%.