Harrison, NJ Map & Demographics
Harrison Map
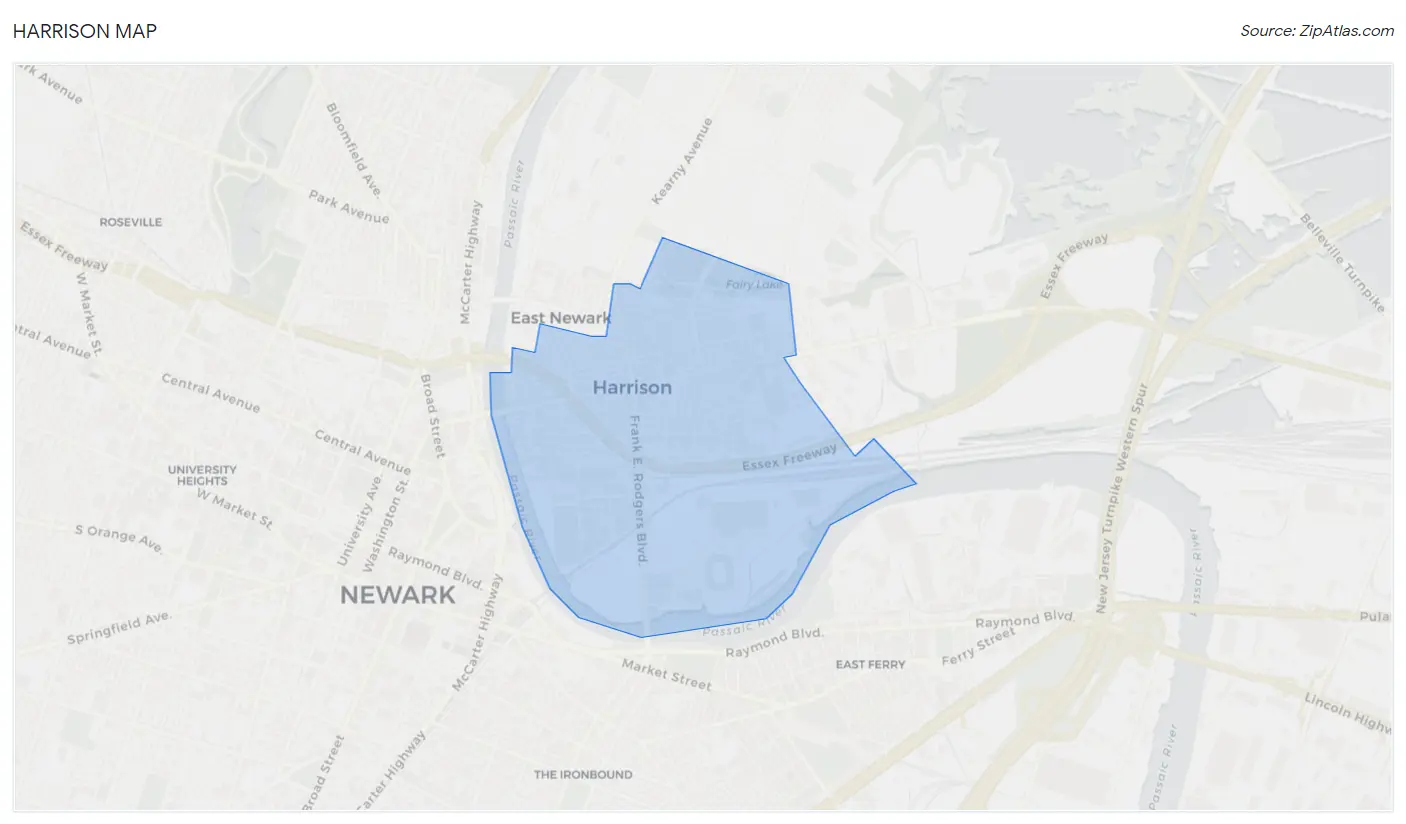
Harrison Overview
$43,699
PER CAPITA INCOME
$79,985
AVG FAMILY INCOME
$72,773
AVG HOUSEHOLD INCOME
35.2%
WAGE / INCOME GAP [ % ]
64.8¢/ $1
WAGE / INCOME GAP [ $ ]
$13,428
FAMILY INCOME DEFICIT
0.44
INEQUALITY / GINI INDEX
19,217
TOTAL POPULATION
10,082
MALE POPULATION
9,135
FEMALE POPULATION
110.37
MALES / 100 FEMALES
90.61
FEMALES / 100 MALES
33.7
MEDIAN AGE
2.9
AVG FAMILY SIZE
2.2
AVG HOUSEHOLD SIZE
11,413
LABOR FORCE [ PEOPLE ]
72.0%
PERCENT IN LABOR FORCE
5.0%
UNEMPLOYMENT RATE
Harrison Zip Codes
Income in Harrison
Income Overview in Harrison
Per Capita Income in Harrison is $43,699, while median incomes of families and households are $79,985 and $72,773 respectively.
| Characteristic | Number | Measure |
| Per Capita Income | 19,217 | $43,699 |
| Median Family Income | 4,787 | $79,985 |
| Mean Family Income | 4,787 | $109,450 |
| Median Household Income | 8,531 | $72,773 |
| Mean Household Income | 8,531 | $100,417 |
| Income Deficit | 4,787 | $13,428 |
| Wage / Income Gap (%) | 19,217 | 35.18% |
| Wage / Income Gap ($) | 19,217 | 64.82¢ per $1 |
| Gini / Inequality Index | 19,217 | 0.44 |
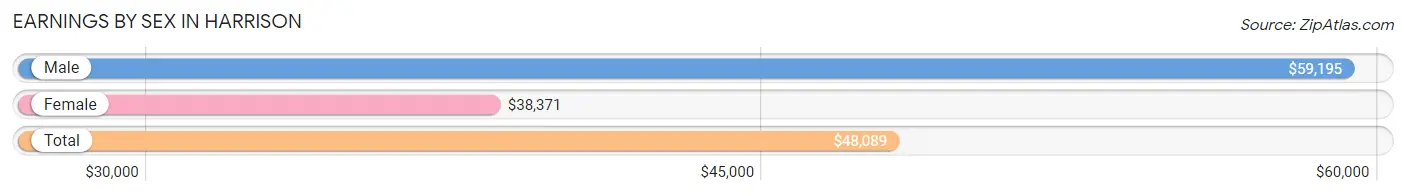
Earnings by Sex in Harrison
Average Earnings in Harrison are $48,089, $59,195 for men and $38,371 for women, a difference of 35.2%.
| Sex | Number | Average Earnings |
| Male | 6,826 (59.3%) | $59,195 |
| Female | 4,678 (40.7%) | $38,371 |
| Total | 11,504 (100.0%) | $48,089 |
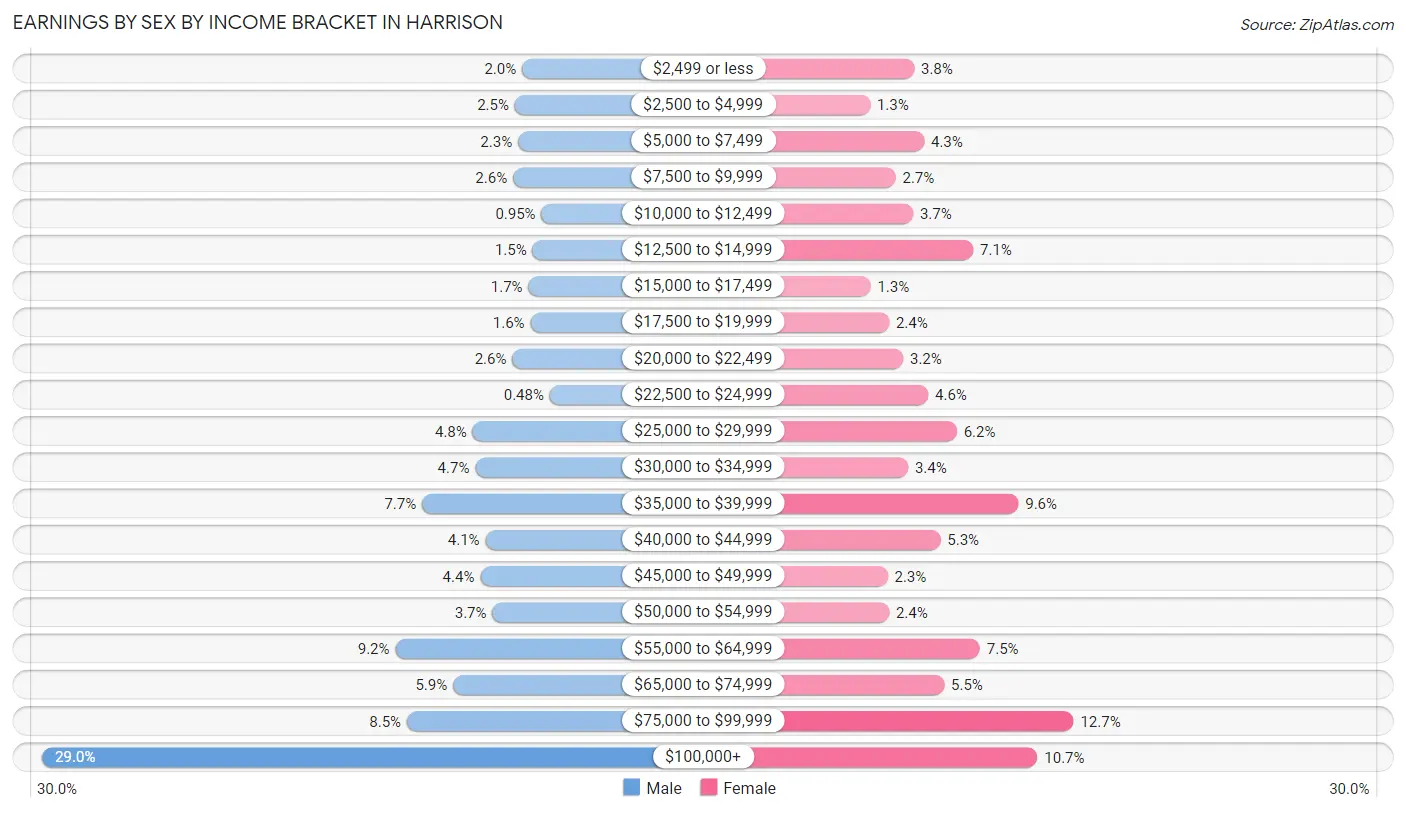
Earnings by Sex by Income Bracket in Harrison
The most common earnings brackets in Harrison are $100,000+ for men (1,981 | 29.0%) and $75,000 to $99,999 for women (596 | 12.7%).
| Income | Male | Female |
| $2,499 or less | 139 (2.0%) | 177 (3.8%) |
| $2,500 to $4,999 | 167 (2.5%) | 61 (1.3%) |
| $5,000 to $7,499 | 155 (2.3%) | 203 (4.3%) |
| $7,500 to $9,999 | 174 (2.5%) | 128 (2.7%) |
| $10,000 to $12,499 | 65 (0.9%) | 174 (3.7%) |
| $12,500 to $14,999 | 99 (1.5%) | 332 (7.1%) |
| $15,000 to $17,499 | 115 (1.7%) | 62 (1.3%) |
| $17,500 to $19,999 | 107 (1.6%) | 111 (2.4%) |
| $20,000 to $22,499 | 177 (2.6%) | 148 (3.2%) |
| $22,500 to $24,999 | 33 (0.5%) | 214 (4.6%) |
| $25,000 to $29,999 | 329 (4.8%) | 289 (6.2%) |
| $30,000 to $34,999 | 319 (4.7%) | 161 (3.4%) |
| $35,000 to $39,999 | 523 (7.7%) | 451 (9.6%) |
| $40,000 to $44,999 | 280 (4.1%) | 246 (5.3%) |
| $45,000 to $49,999 | 300 (4.4%) | 107 (2.3%) |
| $50,000 to $54,999 | 253 (3.7%) | 111 (2.4%) |
| $55,000 to $64,999 | 625 (9.2%) | 350 (7.5%) |
| $65,000 to $74,999 | 404 (5.9%) | 256 (5.5%) |
| $75,000 to $99,999 | 581 (8.5%) | 596 (12.7%) |
| $100,000+ | 1,981 (29.0%) | 501 (10.7%) |
| Total | 6,826 (100.0%) | 4,678 (100.0%) |
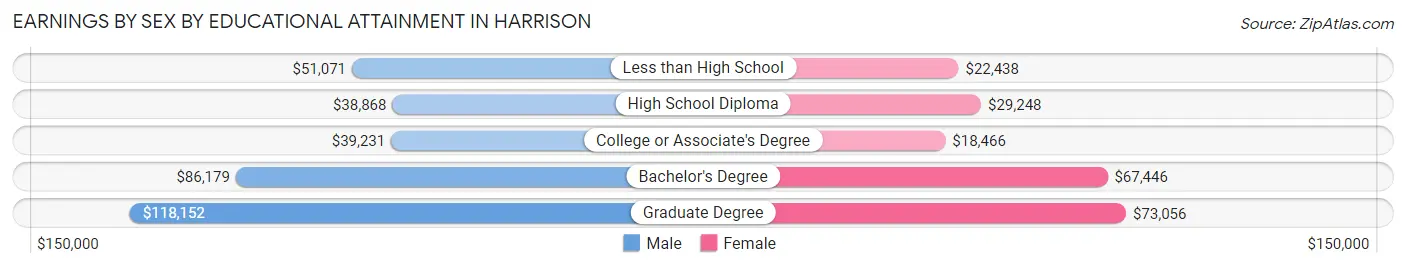
Earnings by Sex by Educational Attainment in Harrison
Average earnings in Harrison are $61,577 for men and $39,577 for women, a difference of 35.7%. Men with an educational attainment of graduate degree enjoy the highest average annual earnings of $118,152, while those with high school diploma education earn the least with $38,868. Women with an educational attainment of graduate degree earn the most with the average annual earnings of $73,056, while those with college or associate's degree education have the smallest earnings of $18,466.
| Educational Attainment | Male Income | Female Income |
| Less than High School | $51,071 | $22,438 |
| High School Diploma | $38,868 | $29,248 |
| College or Associate's Degree | $39,231 | $18,466 |
| Bachelor's Degree | $86,179 | $67,446 |
| Graduate Degree | $118,152 | $73,056 |
| Total | $61,577 | $39,577 |
Family Income in Harrison
Family Income Brackets in Harrison
According to the Harrison family income data, there are 1,063 families falling into the $50,000 to $74,999 income range, which is the most common income bracket and makes up 22.2% of all families. Conversely, the $10,000 to $14,999 income bracket is the least frequent group with only 134 families (2.8%) belonging to this category.
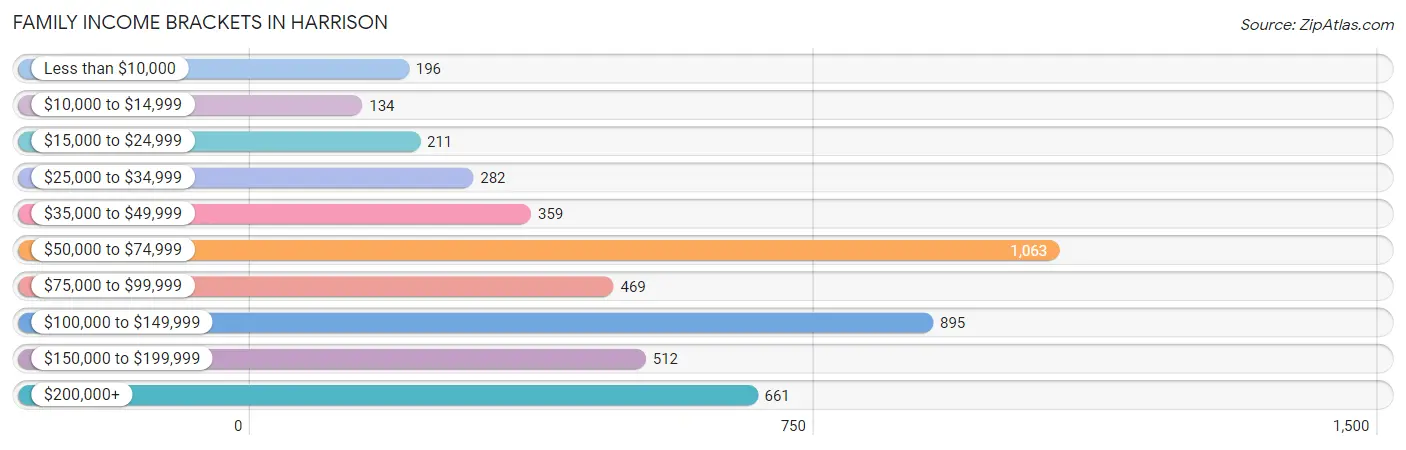
| Income Bracket | # Families | % Families |
| Less than $10,000 | 196 | 4.1% |
| $10,000 to $14,999 | 134 | 2.8% |
| $15,000 to $24,999 | 211 | 4.4% |
| $25,000 to $34,999 | 282 | 5.9% |
| $35,000 to $49,999 | 359 | 7.5% |
| $50,000 to $74,999 | 1,063 | 22.2% |
| $75,000 to $99,999 | 469 | 9.8% |
| $100,000 to $149,999 | 895 | 18.7% |
| $150,000 to $199,999 | 512 | 10.7% |
| $200,000+ | 661 | 13.8% |
Family Income by Famaliy Size in Harrison
2-person families (2,344 | 49.0%) account for the highest median family income in Harrison with $113,009 per family, while 2-person families (2,344 | 49.0%) have the highest median income of $56,504 per family member.
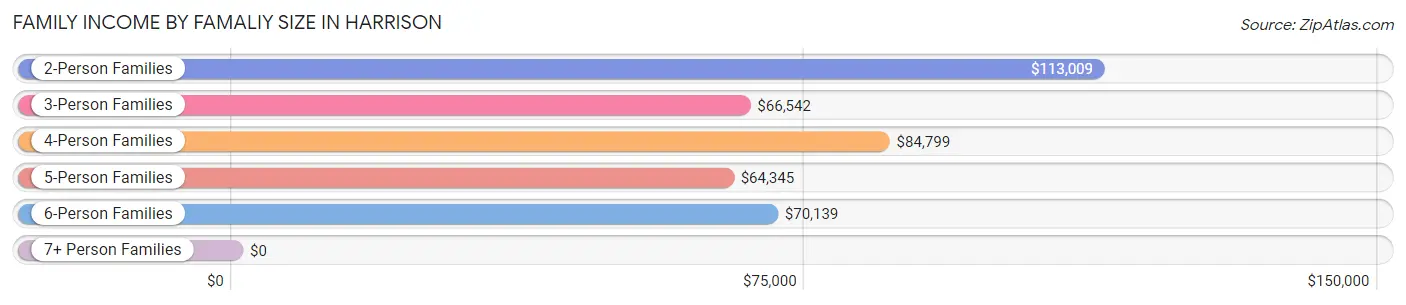
| Income Bracket | # Families | Median Income |
| 2-Person Families | 2,344 (49.0%) | $113,009 |
| 3-Person Families | 1,203 (25.1%) | $66,542 |
| 4-Person Families | 773 (16.2%) | $84,799 |
| 5-Person Families | 295 (6.2%) | $64,345 |
| 6-Person Families | 172 (3.6%) | $70,139 |
| 7+ Person Families | 0 (0.0%) | $0 |
| Total | 4,787 (100.0%) | $79,985 |
Family Income by Number of Earners in Harrison
The median family income in Harrison is $79,985, with families comprising 2 earners (2,496) having the highest median family income of $116,359, while families with no earners (498) have the lowest median family income of $19,875, accounting for 52.1% and 10.4% of families, respectively.
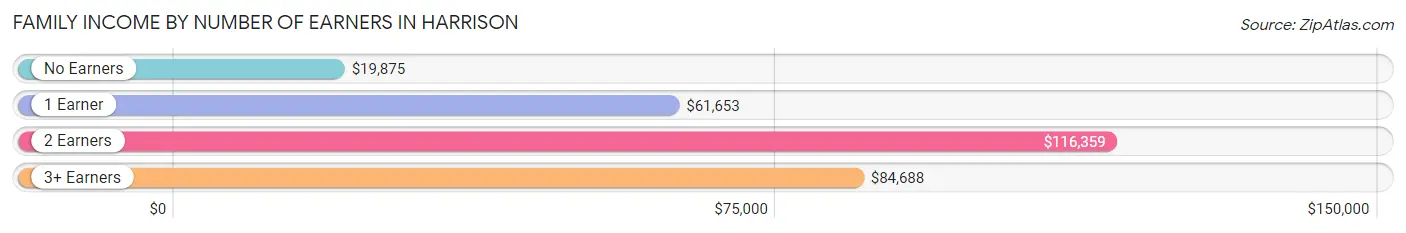
| Number of Earners | # Families | Median Income |
| No Earners | 498 (10.4%) | $19,875 |
| 1 Earner | 1,423 (29.7%) | $61,653 |
| 2 Earners | 2,496 (52.1%) | $116,359 |
| 3+ Earners | 370 (7.7%) | $84,688 |
| Total | 4,787 (100.0%) | $79,985 |
Household Income in Harrison
Household Income Brackets in Harrison
With 1,860 households falling in the category, the $50,000 to $74,999 income range is the most frequent in Harrison, accounting for 21.8% of all households. In contrast, only 358 households (4.2%) fall into the $10,000 to $14,999 income bracket, making it the least populous group.
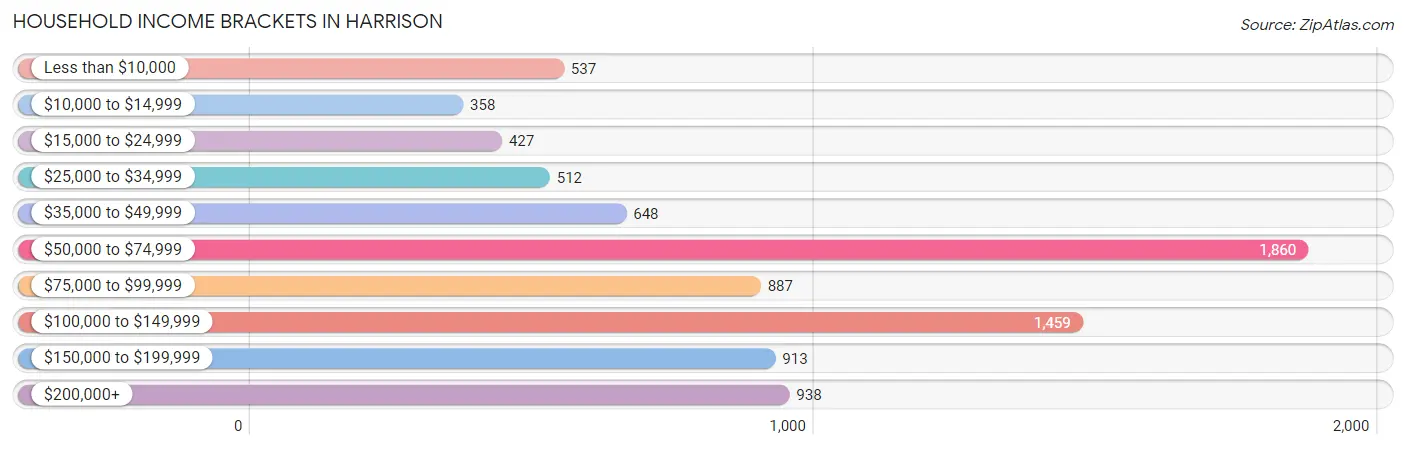
| Income Bracket | # Households | % Households |
| Less than $10,000 | 537 | 6.3% |
| $10,000 to $14,999 | 358 | 4.2% |
| $15,000 to $24,999 | 427 | 5.0% |
| $25,000 to $34,999 | 512 | 6.0% |
| $35,000 to $49,999 | 648 | 7.6% |
| $50,000 to $74,999 | 1,860 | 21.8% |
| $75,000 to $99,999 | 887 | 10.4% |
| $100,000 to $149,999 | 1,459 | 17.1% |
| $150,000 to $199,999 | 913 | 10.7% |
| $200,000+ | 938 | 11.0% |
Household Income by Householder Age in Harrison
The median household income in Harrison is $72,773, with the highest median household income of $90,923 found in the 25 to 44 years age bracket for the primary householder. A total of 4,564 households (53.5%) fall into this category. Meanwhile, the 65+ years age bracket for the primary householder has the lowest median household income of $31,813, with 1,304 households (15.3%) in this group.
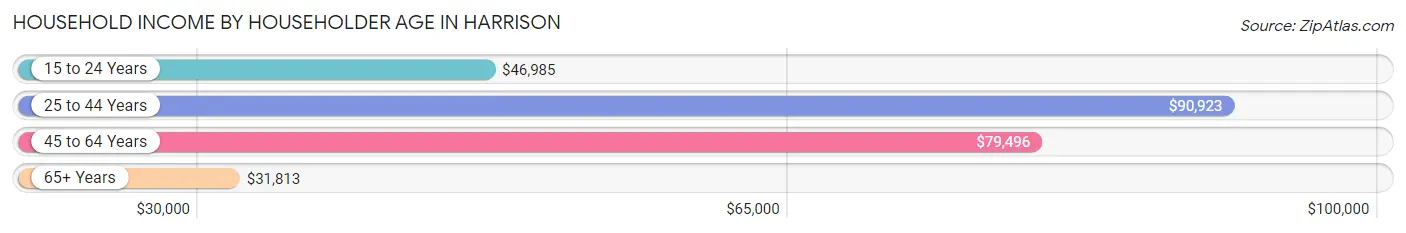
| Income Bracket | # Households | Median Income |
| 15 to 24 Years | 386 (4.5%) | $46,985 |
| 25 to 44 Years | 4,564 (53.5%) | $90,923 |
| 45 to 64 Years | 2,277 (26.7%) | $79,496 |
| 65+ Years | 1,304 (15.3%) | $31,813 |
| Total | 8,531 (100.0%) | $72,773 |
Poverty in Harrison
Income Below Poverty by Sex and Age in Harrison
With 13.8% poverty level for males and 14.6% for females among the residents of Harrison, 5 year old males and 5 year old females are the most vulnerable to poverty, with 50 males (44.6%) and 31 females (35.2%) in their respective age groups living below the poverty level.
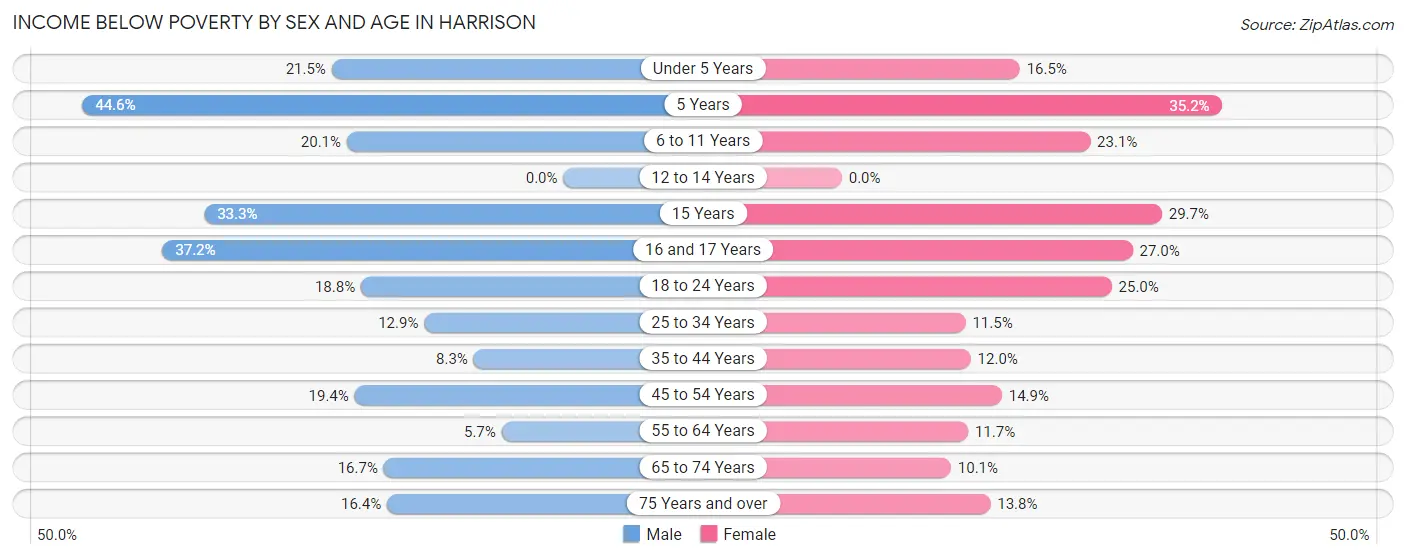
| Age Bracket | Male | Female |
| Under 5 Years | 115 (21.5%) | 107 (16.5%) |
| 5 Years | 50 (44.6%) | 31 (35.2%) |
| 6 to 11 Years | 89 (20.1%) | 136 (23.1%) |
| 12 to 14 Years | 0 (0.0%) | 0 (0.0%) |
| 15 Years | 12 (33.3%) | 49 (29.7%) |
| 16 and 17 Years | 48 (37.2%) | 58 (27.0%) |
| 18 to 24 Years | 129 (18.8%) | 152 (25.0%) |
| 25 to 34 Years | 410 (12.9%) | 279 (11.5%) |
| 35 to 44 Years | 117 (8.3%) | 138 (12.0%) |
| 45 to 54 Years | 202 (19.4%) | 139 (14.8%) |
| 55 to 64 Years | 61 (5.7%) | 110 (11.7%) |
| 65 to 74 Years | 109 (16.7%) | 67 (10.1%) |
| 75 Years and over | 44 (16.4%) | 66 (13.8%) |
| Total | 1,386 (13.8%) | 1,332 (14.6%) |
Income Above Poverty by Sex and Age in Harrison
According to the poverty statistics in Harrison, males aged 12 to 14 years and females aged 12 to 14 years are the age groups that are most secure financially, with 100.0% of males and 100.0% of females in these age groups living above the poverty line.
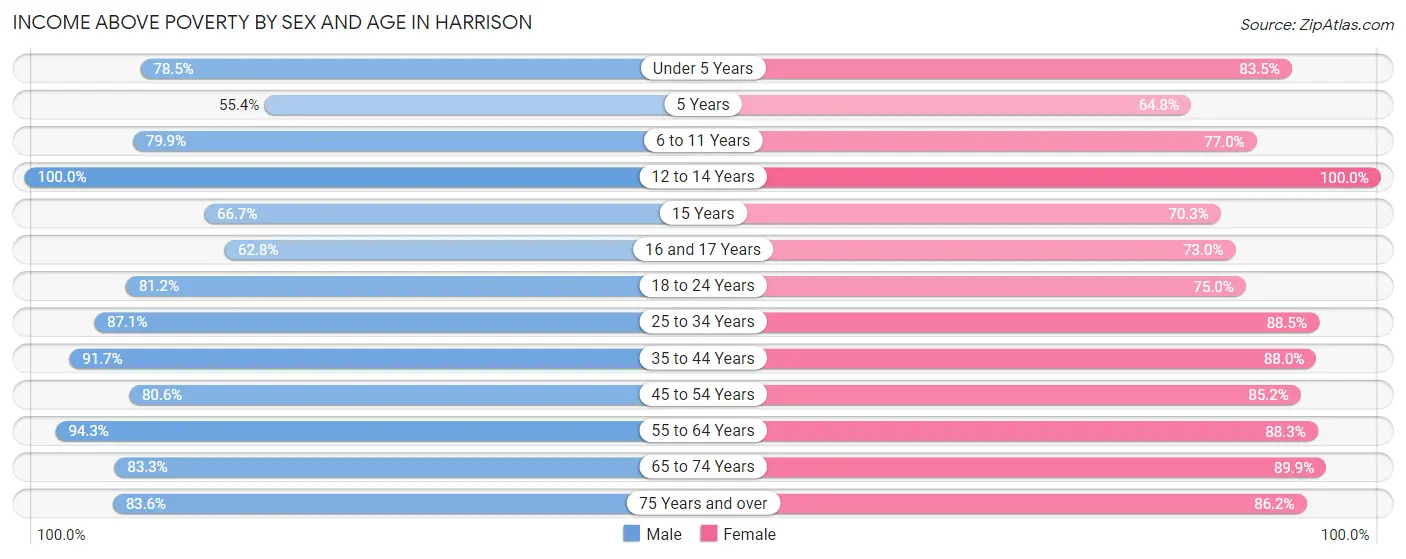
| Age Bracket | Male | Female |
| Under 5 Years | 420 (78.5%) | 541 (83.5%) |
| 5 Years | 62 (55.4%) | 57 (64.8%) |
| 6 to 11 Years | 354 (79.9%) | 454 (76.9%) |
| 12 to 14 Years | 528 (100.0%) | 221 (100.0%) |
| 15 Years | 24 (66.7%) | 116 (70.3%) |
| 16 and 17 Years | 81 (62.8%) | 157 (73.0%) |
| 18 to 24 Years | 558 (81.2%) | 455 (75.0%) |
| 25 to 34 Years | 2,766 (87.1%) | 2,152 (88.5%) |
| 35 to 44 Years | 1,289 (91.7%) | 1,016 (88.0%) |
| 45 to 54 Years | 841 (80.6%) | 797 (85.2%) |
| 55 to 64 Years | 1,003 (94.3%) | 829 (88.3%) |
| 65 to 74 Years | 545 (83.3%) | 595 (89.9%) |
| 75 Years and over | 225 (83.6%) | 413 (86.2%) |
| Total | 8,696 (86.3%) | 7,803 (85.4%) |
Income Below Poverty Among Married-Couple Families in Harrison
The poverty statistics for married-couple families in Harrison show that 5.5% or 196 of the total 3,547 families live below the poverty line. Families with 3 or 4 children have the highest poverty rate of 26.9%, comprising of 36 families. On the other hand, families with no children have the lowest poverty rate of 4.4%, which includes 90 families.
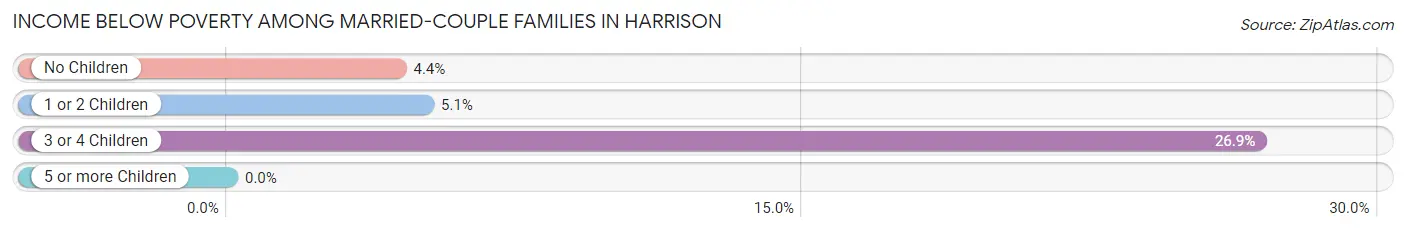
| Children | Above Poverty | Below Poverty |
| No Children | 1,955 (95.6%) | 90 (4.4%) |
| 1 or 2 Children | 1,298 (94.9%) | 70 (5.1%) |
| 3 or 4 Children | 98 (73.1%) | 36 (26.9%) |
| 5 or more Children | 0 (0.0%) | 0 (0.0%) |
| Total | 3,351 (94.5%) | 196 (5.5%) |
Income Below Poverty Among Single-Parent Households in Harrison
According to the poverty data in Harrison, 14.9% or 52 single-father households and 21.4% or 191 single-mother households are living below the poverty line. Among single-father households, those with 1 or 2 children have the highest poverty rate, with 34 households (31.5%) experiencing poverty. Likewise, among single-mother households, those with 1 or 2 children have the highest poverty rate, with 165 households (33.3%) falling below the poverty line.
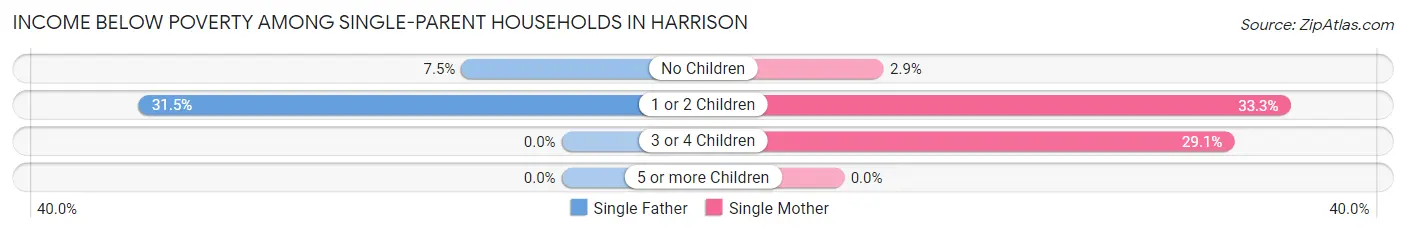
| Children | Single Father | Single Mother |
| No Children | 18 (7.5%) | 10 (2.9%) |
| 1 or 2 Children | 34 (31.5%) | 165 (33.3%) |
| 3 or 4 Children | 0 (0.0%) | 16 (29.1%) |
| 5 or more Children | 0 (0.0%) | 0 (0.0%) |
| Total | 52 (14.9%) | 191 (21.4%) |
Income Below Poverty Among Married-Couple vs Single-Parent Households in Harrison
The poverty data for Harrison shows that 196 of the married-couple family households (5.5%) and 243 of the single-parent households (19.6%) are living below the poverty level. Within the married-couple family households, those with 3 or 4 children have the highest poverty rate, with 36 households (26.9%) falling below the poverty line. Among the single-parent households, those with 1 or 2 children have the highest poverty rate, with 199 household (33.0%) living below poverty.
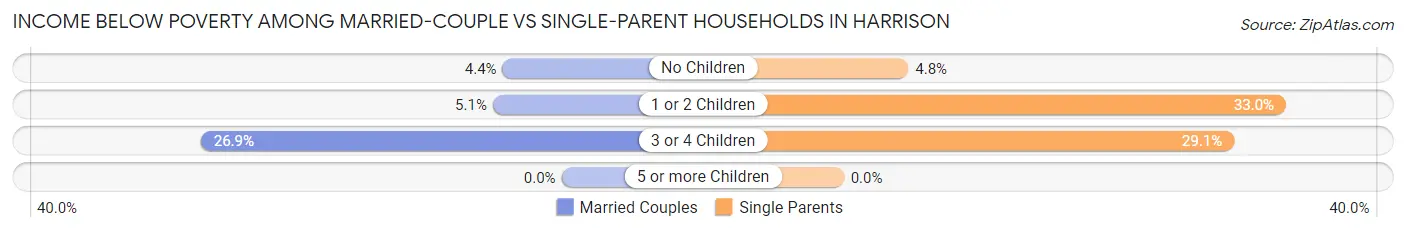
| Children | Married-Couple Families | Single-Parent Households |
| No Children | 90 (4.4%) | 28 (4.8%) |
| 1 or 2 Children | 70 (5.1%) | 199 (33.0%) |
| 3 or 4 Children | 36 (26.9%) | 16 (29.1%) |
| 5 or more Children | 0 (0.0%) | 0 (0.0%) |
| Total | 196 (5.5%) | 243 (19.6%) |
Race in Harrison
The most populous races in Harrison are Hispanic or Latino (9,004 | 46.9%), White / Caucasian (6,972 | 36.3%), and Some other Race (3,943 | 20.5%).
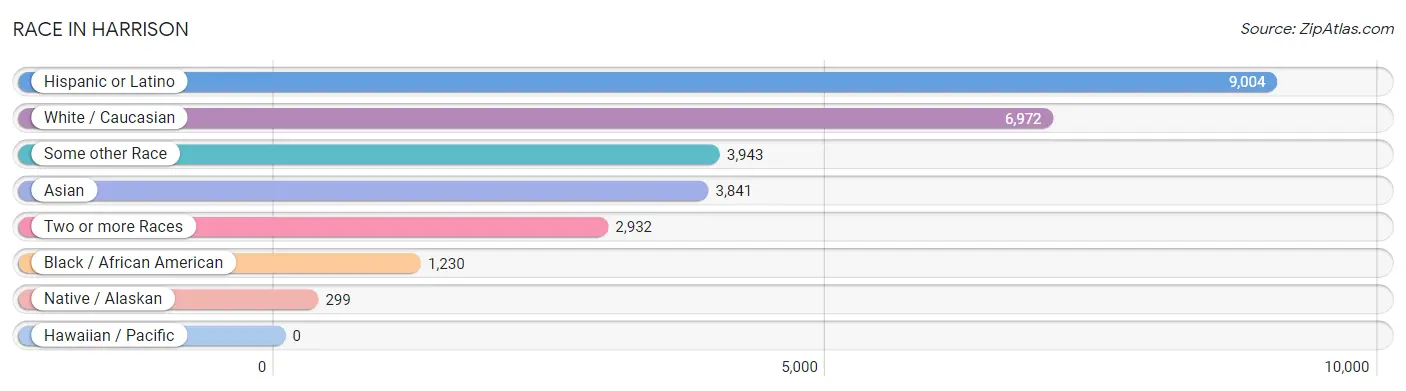
| Race | # Population | % Population |
| Asian | 3,841 | 20.0% |
| Black / African American | 1,230 | 6.4% |
| Hawaiian / Pacific | 0 | 0.0% |
| Hispanic or Latino | 9,004 | 46.9% |
| Native / Alaskan | 299 | 1.6% |
| White / Caucasian | 6,972 | 36.3% |
| Two or more Races | 2,932 | 15.3% |
| Some other Race | 3,943 | 20.5% |
| Total | 19,217 | 100.0% |
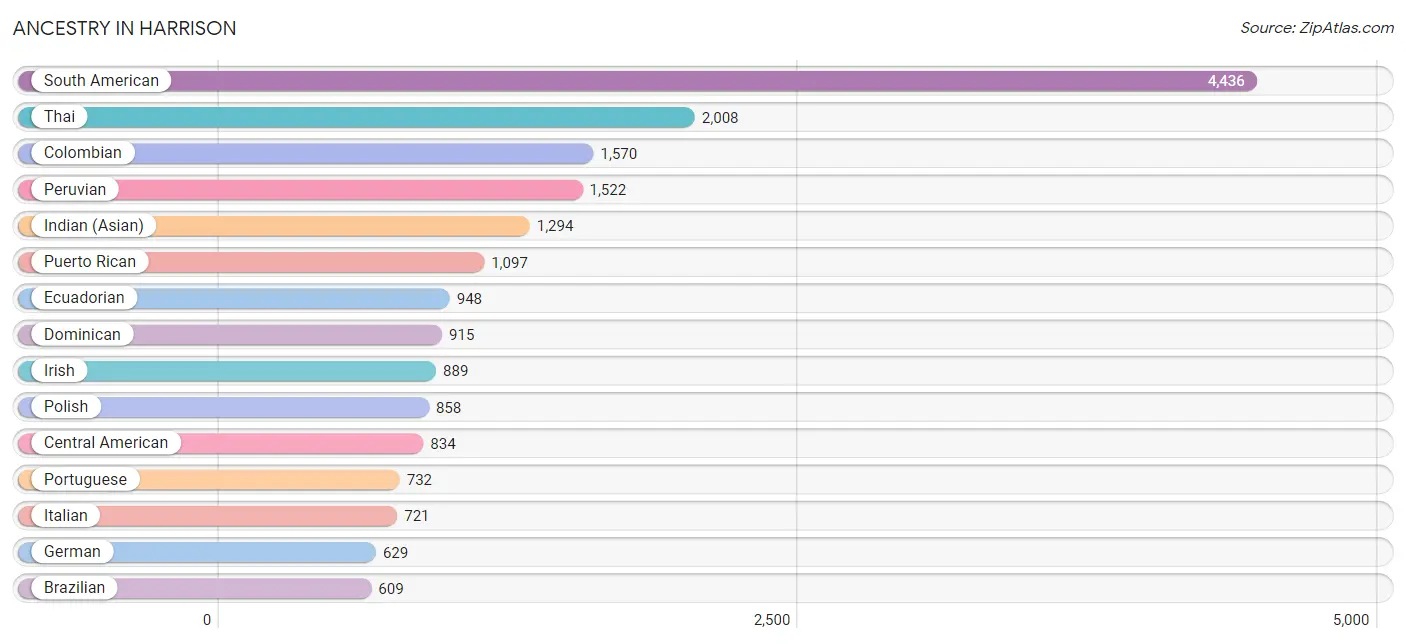
Ancestry in Harrison
The most populous ancestries reported in Harrison are South American (4,436 | 23.1%), Thai (2,008 | 10.4%), Colombian (1,570 | 8.2%), Peruvian (1,522 | 7.9%), and Indian (Asian) (1,294 | 6.7%), together accounting for 56.4% of all Harrison residents.
| Ancestry | # Population | % Population |
| African | 363 | 1.9% |
| Alsatian | 13 | 0.1% |
| American | 277 | 1.4% |
| Arab | 237 | 1.2% |
| Armenian | 16 | 0.1% |
| Austrian | 18 | 0.1% |
| Bermudan | 57 | 0.3% |
| Bhutanese | 31 | 0.2% |
| Brazilian | 609 | 3.2% |
| British | 44 | 0.2% |
| Burmese | 175 | 0.9% |
| Cambodian | 17 | 0.1% |
| Canadian | 87 | 0.4% |
| Cape Verdean | 18 | 0.1% |
| Central American | 834 | 4.3% |
| Central American Indian | 78 | 0.4% |
| Cherokee | 32 | 0.2% |
| Chilean | 33 | 0.2% |
| Colombian | 1,570 | 8.2% |
| Costa Rican | 73 | 0.4% |
| Cuban | 376 | 2.0% |
| Cypriot | 29 | 0.2% |
| Czech | 19 | 0.1% |
| Danish | 47 | 0.2% |
| Dominican | 915 | 4.8% |
| Dutch | 24 | 0.1% |
| Eastern European | 48 | 0.3% |
| Ecuadorian | 948 | 4.9% |
| Egyptian | 23 | 0.1% |
| English | 128 | 0.7% |
| Estonian | 14 | 0.1% |
| European | 60 | 0.3% |
| Filipino | 78 | 0.4% |
| Finnish | 13 | 0.1% |
| French | 17 | 0.1% |
| French Canadian | 30 | 0.2% |
| German | 629 | 3.3% |
| Ghanaian | 94 | 0.5% |
| Greek | 99 | 0.5% |
| Guatemalan | 83 | 0.4% |
| Guyanese | 2 | 0.0% |
| Haitian | 18 | 0.1% |
| Honduran | 398 | 2.1% |
| Hungarian | 6 | 0.0% |
| Icelander | 19 | 0.1% |
| Indian (Asian) | 1,294 | 6.7% |
| Iranian | 11 | 0.1% |
| Irish | 889 | 4.6% |
| Iroquois | 29 | 0.2% |
| Italian | 721 | 3.7% |
| Jamaican | 33 | 0.2% |
| Korean | 313 | 1.6% |
| Lebanese | 30 | 0.2% |
| Lithuanian | 7 | 0.0% |
| Mexican | 468 | 2.4% |
| Moroccan | 134 | 0.7% |
| New Zealander | 19 | 0.1% |
| Nicaraguan | 23 | 0.1% |
| Nigerian | 44 | 0.2% |
| Northern European | 11 | 0.1% |
| Norwegian | 16 | 0.1% |
| Panamanian | 8 | 0.0% |
| Peruvian | 1,522 | 7.9% |
| Polish | 858 | 4.5% |
| Portuguese | 732 | 3.8% |
| Puerto Rican | 1,097 | 5.7% |
| Romanian | 9 | 0.1% |
| Russian | 127 | 0.7% |
| Salvadoran | 249 | 1.3% |
| Scottish | 163 | 0.9% |
| Serbian | 7 | 0.0% |
| Slavic | 18 | 0.1% |
| Slovak | 3 | 0.0% |
| South American | 4,436 | 23.1% |
| South American Indian | 40 | 0.2% |
| Spaniard | 252 | 1.3% |
| Spanish | 36 | 0.2% |
| Sri Lankan | 18 | 0.1% |
| Subsaharan African | 519 | 2.7% |
| Swedish | 39 | 0.2% |
| Syrian | 50 | 0.3% |
| Thai | 2,008 | 10.4% |
| Trinidadian and Tobagonian | 46 | 0.2% |
| Ukrainian | 128 | 0.7% |
| Uruguayan | 177 | 0.9% |
| Venezuelan | 186 | 1.0% |
| Vietnamese | 4 | 0.0% |
| Welsh | 31 | 0.2% |
| West Indian | 73 | 0.4% |
| Yugoslavian | 7 | 0.0% | View All 90 Rows |
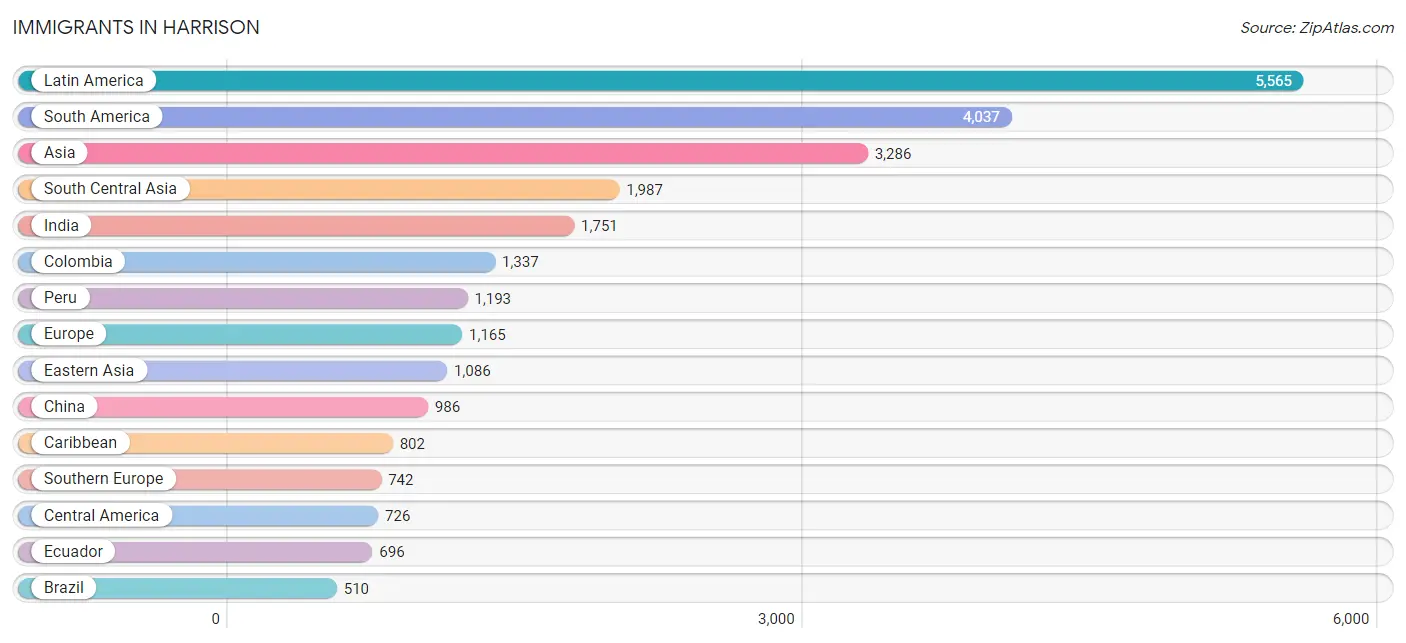
Immigrants in Harrison
The most numerous immigrant groups reported in Harrison came from Latin America (5,565 | 29.0%), South America (4,037 | 21.0%), Asia (3,286 | 17.1%), South Central Asia (1,987 | 10.3%), and India (1,751 | 9.1%), together accounting for 86.5% of all Harrison residents.
| Immigration Origin | # Population | % Population |
| Africa | 254 | 1.3% |
| Asia | 3,286 | 17.1% |
| Bangladesh | 11 | 0.1% |
| Bosnia and Herzegovina | 7 | 0.0% |
| Brazil | 510 | 2.6% |
| Cabo Verde | 12 | 0.1% |
| Cameroon | 9 | 0.1% |
| Canada | 65 | 0.3% |
| Caribbean | 802 | 4.2% |
| Central America | 726 | 3.8% |
| Chile | 55 | 0.3% |
| China | 986 | 5.1% |
| Colombia | 1,337 | 7.0% |
| Costa Rica | 115 | 0.6% |
| Cuba | 211 | 1.1% |
| Dominican Republic | 499 | 2.6% |
| Eastern Africa | 75 | 0.4% |
| Eastern Asia | 1,086 | 5.7% |
| Eastern Europe | 328 | 1.7% |
| Ecuador | 696 | 3.6% |
| Egypt | 12 | 0.1% |
| El Salvador | 186 | 1.0% |
| Europe | 1,165 | 6.1% |
| France | 56 | 0.3% |
| Greece | 31 | 0.2% |
| Guatemala | 83 | 0.4% |
| Guyana | 19 | 0.1% |
| Honduras | 127 | 0.7% |
| Hong Kong | 97 | 0.5% |
| India | 1,751 | 9.1% |
| Iran | 11 | 0.1% |
| Japan | 17 | 0.1% |
| Jordan | 6 | 0.0% |
| Korea | 72 | 0.4% |
| Latin America | 5,565 | 29.0% |
| Lebanon | 8 | 0.0% |
| Mexico | 204 | 1.1% |
| Middle Africa | 9 | 0.1% |
| Morocco | 102 | 0.5% |
| Nicaragua | 11 | 0.1% |
| Nigeria | 44 | 0.2% |
| Northern Africa | 114 | 0.6% |
| Northern Europe | 39 | 0.2% |
| Pakistan | 214 | 1.1% |
| Peru | 1,193 | 6.2% |
| Philippines | 164 | 0.9% |
| Poland | 270 | 1.4% |
| Portugal | 483 | 2.5% |
| Scotland | 20 | 0.1% |
| Serbia | 7 | 0.0% |
| South America | 4,037 | 21.0% |
| South Central Asia | 1,987 | 10.3% |
| South Eastern Asia | 164 | 0.9% |
| Southern Europe | 742 | 3.9% |
| Spain | 228 | 1.2% |
| St. Vincent and the Grenadines | 17 | 0.1% |
| Taiwan | 88 | 0.5% |
| Trinidad and Tobago | 75 | 0.4% |
| Ukraine | 44 | 0.2% |
| Uruguay | 40 | 0.2% |
| Venezuela | 187 | 1.0% |
| Western Africa | 56 | 0.3% |
| Western Asia | 49 | 0.3% |
| Western Europe | 56 | 0.3% | View All 64 Rows |
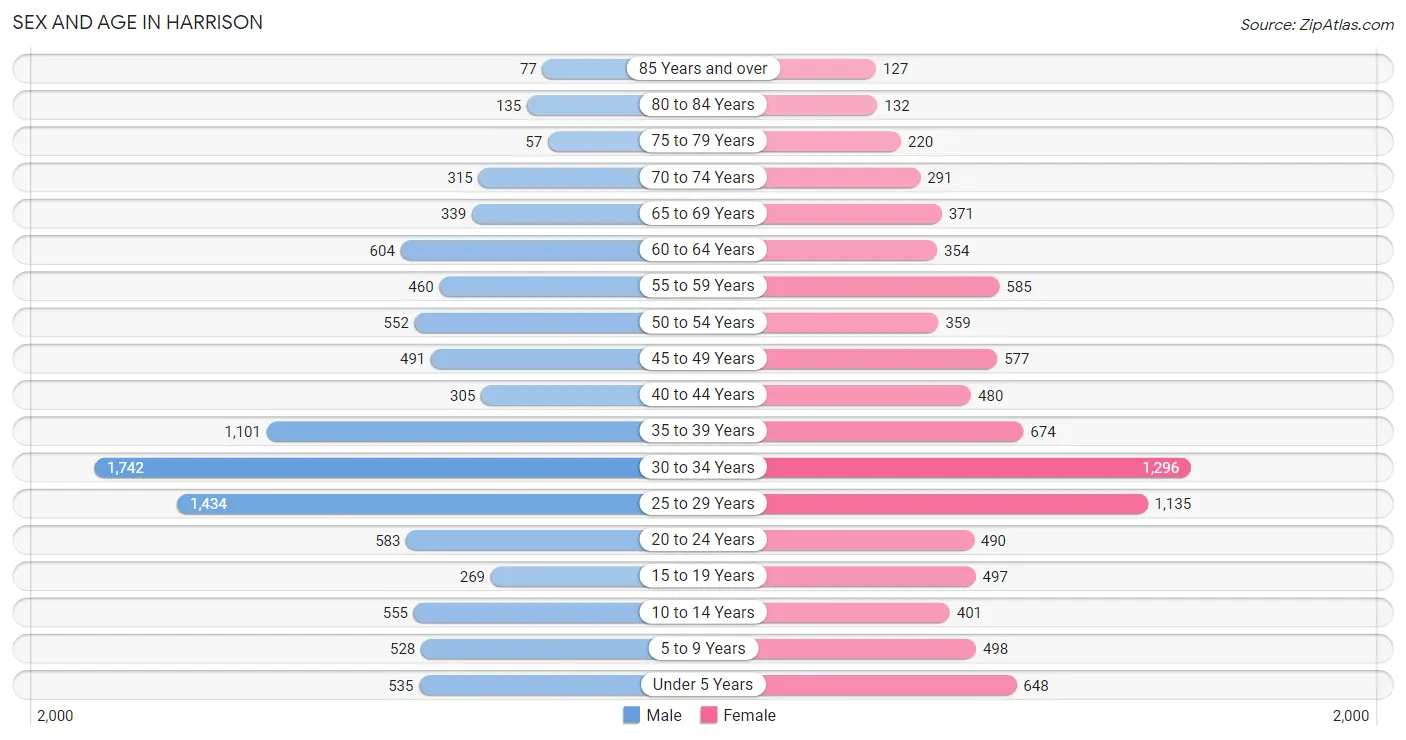
Sex and Age in Harrison
Sex and Age in Harrison
The most populous age groups in Harrison are 30 to 34 Years (1,742 | 17.3%) for men and 30 to 34 Years (1,296 | 14.2%) for women.
| Age Bracket | Male | Female |
| Under 5 Years | 535 (5.3%) | 648 (7.1%) |
| 5 to 9 Years | 528 (5.2%) | 498 (5.4%) |
| 10 to 14 Years | 555 (5.5%) | 401 (4.4%) |
| 15 to 19 Years | 269 (2.7%) | 497 (5.4%) |
| 20 to 24 Years | 583 (5.8%) | 490 (5.4%) |
| 25 to 29 Years | 1,434 (14.2%) | 1,135 (12.4%) |
| 30 to 34 Years | 1,742 (17.3%) | 1,296 (14.2%) |
| 35 to 39 Years | 1,101 (10.9%) | 674 (7.4%) |
| 40 to 44 Years | 305 (3.0%) | 480 (5.2%) |
| 45 to 49 Years | 491 (4.9%) | 577 (6.3%) |
| 50 to 54 Years | 552 (5.5%) | 359 (3.9%) |
| 55 to 59 Years | 460 (4.6%) | 585 (6.4%) |
| 60 to 64 Years | 604 (6.0%) | 354 (3.9%) |
| 65 to 69 Years | 339 (3.4%) | 371 (4.1%) |
| 70 to 74 Years | 315 (3.1%) | 291 (3.2%) |
| 75 to 79 Years | 57 (0.6%) | 220 (2.4%) |
| 80 to 84 Years | 135 (1.3%) | 132 (1.4%) |
| 85 Years and over | 77 (0.8%) | 127 (1.4%) |
| Total | 10,082 (100.0%) | 9,135 (100.0%) |
Families and Households in Harrison
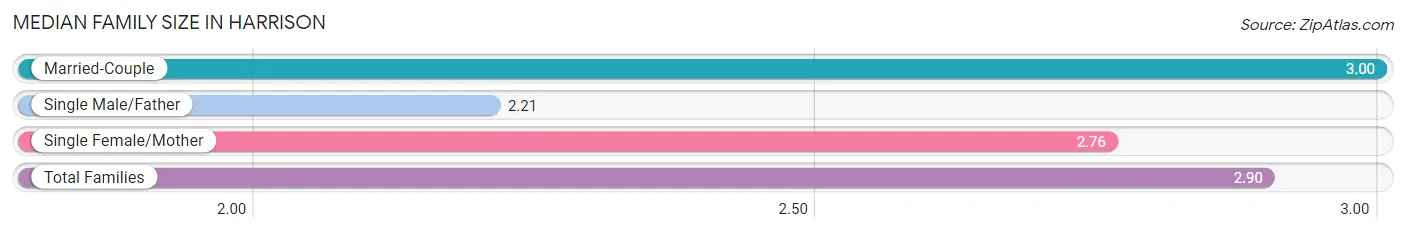
Median Family Size in Harrison
The median family size in Harrison is 2.90 persons per family, with married-couple families (3,547 | 74.1%) accounting for the largest median family size of 3 persons per family. On the other hand, single male/father families (349 | 7.3%) represent the smallest median family size with 2.21 persons per family.
| Family Type | # Families | Family Size |
| Married-Couple | 3,547 (74.1%) | 3.00 |
| Single Male/Father | 349 (7.3%) | 2.21 |
| Single Female/Mother | 891 (18.6%) | 2.76 |
| Total Families | 4,787 (100.0%) | 2.90 |
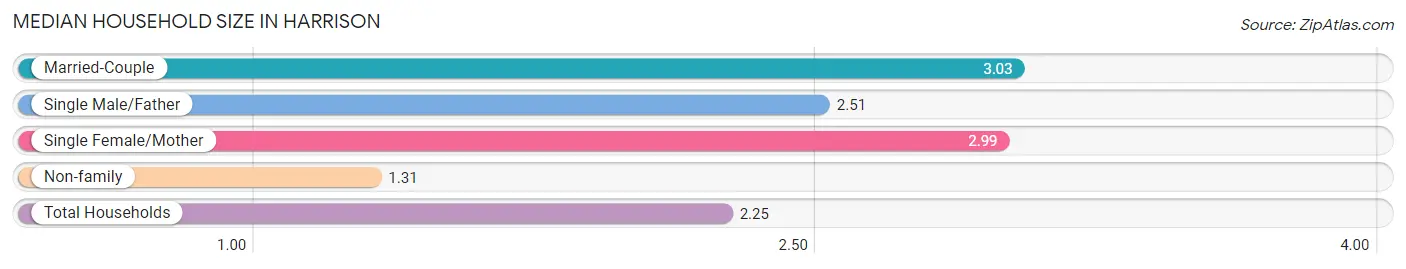
Median Household Size in Harrison
The median household size in Harrison is 2.25 persons per household, with married-couple households (3,547 | 41.6%) accounting for the largest median household size of 3.03 persons per household. non-family households (3,744 | 43.9%) represent the smallest median household size with 1.31 persons per household.
| Household Type | # Households | Household Size |
| Married-Couple | 3,547 (41.6%) | 3.03 |
| Single Male/Father | 349 (4.1%) | 2.51 |
| Single Female/Mother | 891 (10.4%) | 2.99 |
| Non-family | 3,744 (43.9%) | 1.31 |
| Total Households | 8,531 (100.0%) | 2.25 |
Household Size by Marriage Status in Harrison
Out of a total of 8,531 households in Harrison, 4,787 (56.1%) are family households, while 3,744 (43.9%) are nonfamily households. The most numerous type of family households are 2-person households, comprising 2,022, and the most common type of nonfamily households are 1-person households, comprising 2,905.
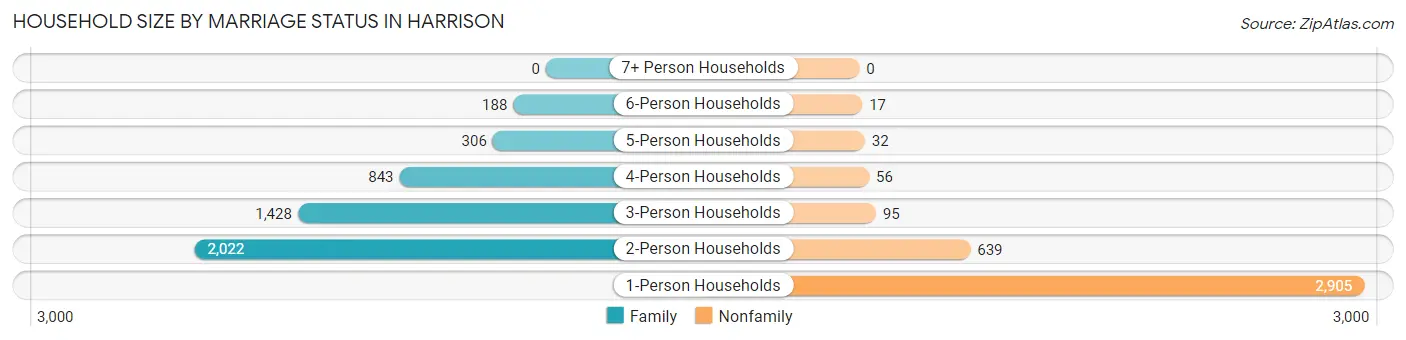
| Household Size | Family Households | Nonfamily Households |
| 1-Person Households | - | 2,905 (34.1%) |
| 2-Person Households | 2,022 (23.7%) | 639 (7.5%) |
| 3-Person Households | 1,428 (16.7%) | 95 (1.1%) |
| 4-Person Households | 843 (9.9%) | 56 (0.7%) |
| 5-Person Households | 306 (3.6%) | 32 (0.4%) |
| 6-Person Households | 188 (2.2%) | 17 (0.2%) |
| 7+ Person Households | 0 (0.0%) | 0 (0.0%) |
| Total | 4,787 (56.1%) | 3,744 (43.9%) |
Female Fertility in Harrison
Fertility by Age in Harrison
Average fertility rate in Harrison is 53.0 births per 1,000 women. Women in the age bracket of 20 to 34 years have the highest fertility rate with 64.0 births per 1,000 women. Women in the age bracket of 20 to 34 years acount for 67.1% of all women with births.
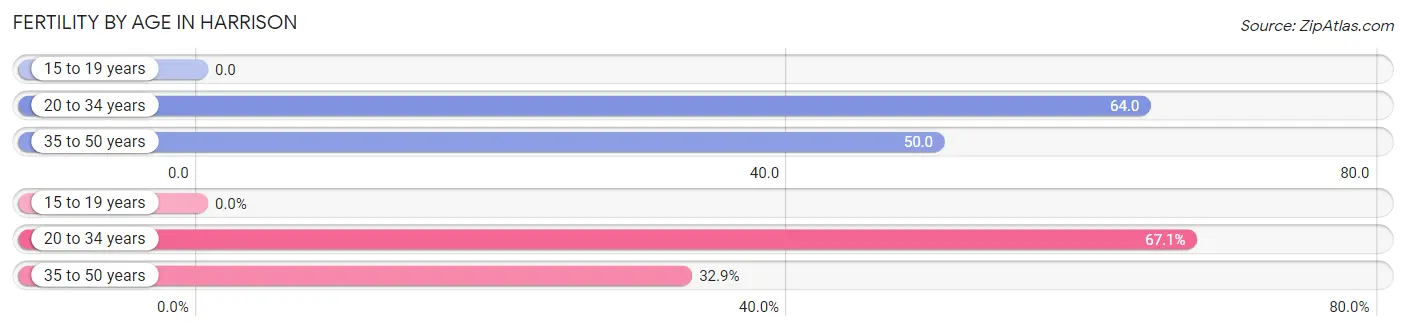
| Age Bracket | Women with Births | Births / 1,000 Women |
| 15 to 19 years | 0 (0.0%) | 0.0 |
| 20 to 34 years | 188 (67.1%) | 64.0 |
| 35 to 50 years | 92 (32.9%) | 50.0 |
| Total | 280 (100.0%) | 53.0 |
Fertility by Age by Marriage Status in Harrison
71.8% of women with births (280) in Harrison are married. The highest percentage of unmarried women with births falls into 20 to 34 years age bracket with 34.6% of them unmarried at the time of birth, while the lowest percentage of unmarried women with births belong to 35 to 50 years age bracket with 15.2% of them unmarried.
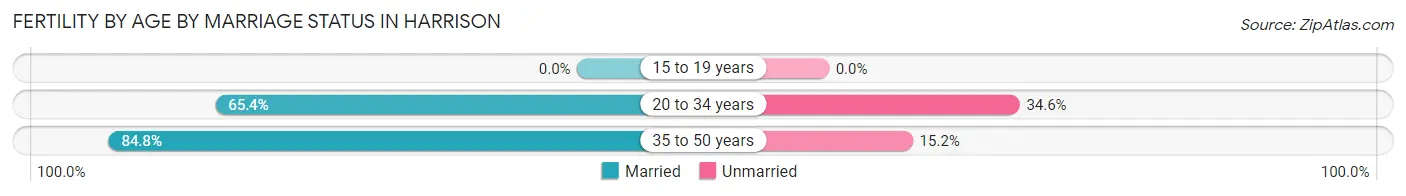
| Age Bracket | Married | Unmarried |
| 15 to 19 years | 0 (0.0%) | 0 (0.0%) |
| 20 to 34 years | 123 (65.4%) | 65 (34.6%) |
| 35 to 50 years | 78 (84.8%) | 14 (15.2%) |
| Total | 201 (71.8%) | 79 (28.2%) |
Fertility by Education in Harrison
Average fertility rate in Harrison is 53.0 births per 1,000 women. Women with the education attainment of college or associate's degree have the highest fertility rate of 88.0 births per 1,000 women, while women with the education attainment of less than high school have the lowest fertility at 7.0 births per 1,000 women. Women with the education attainment of bachelor's degree represent 32.5% of all women with births.
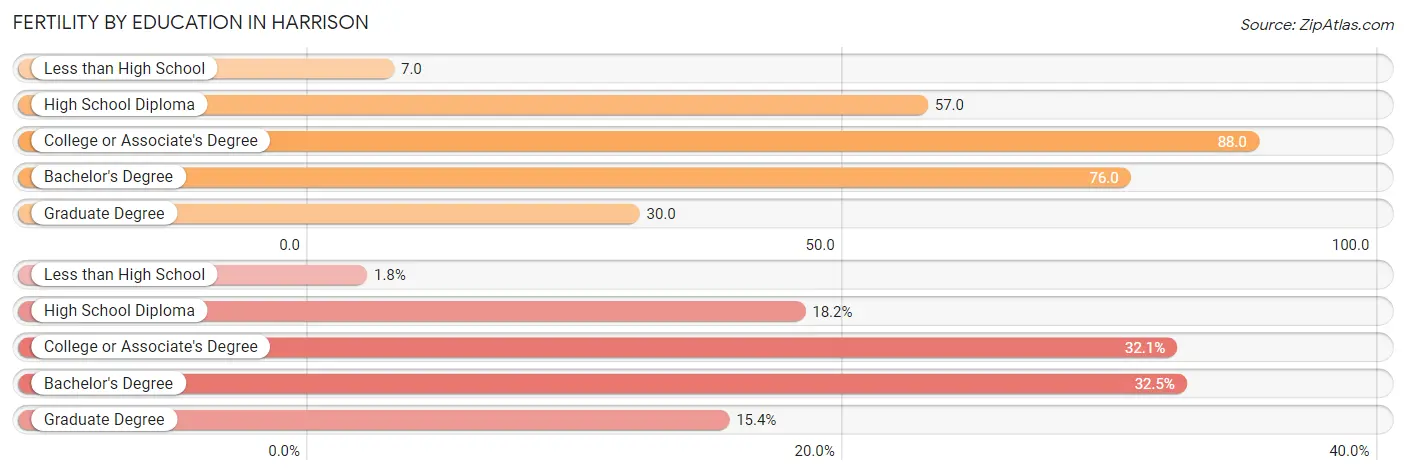
| Educational Attainment | Women with Births | Births / 1,000 Women |
| Less than High School | 5 (1.8%) | 7.0 |
| High School Diploma | 51 (18.2%) | 57.0 |
| College or Associate's Degree | 90 (32.1%) | 88.0 |
| Bachelor's Degree | 91 (32.5%) | 76.0 |
| Graduate Degree | 43 (15.4%) | 30.0 |
| Total | 280 (100.0%) | 53.0 |
Fertility by Education by Marriage Status in Harrison
28.2% of women with births in Harrison are unmarried. Women with the educational attainment of less than high school are most likely to be married with 100.0% of them married at childbirth, while women with the educational attainment of college or associate's degree are least likely to be married with 54.4% of them unmarried at childbirth.
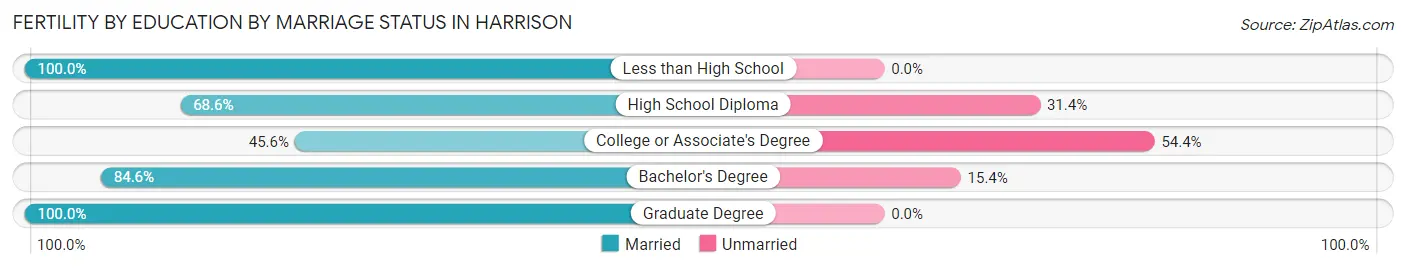
| Educational Attainment | Married | Unmarried |
| Less than High School | 5 (100.0%) | 0 (0.0%) |
| High School Diploma | 35 (68.6%) | 16 (31.4%) |
| College or Associate's Degree | 41 (45.6%) | 49 (54.4%) |
| Bachelor's Degree | 77 (84.6%) | 14 (15.4%) |
| Graduate Degree | 43 (100.0%) | 0 (0.0%) |
| Total | 201 (71.8%) | 79 (28.2%) |
Employment Characteristics in Harrison
Employment by Class of Employer in Harrison
Among the 10,626 employed individuals in Harrison, private company employees (8,039 | 75.6%), not-for-profit organizations (844 | 7.9%), and self-employed (not incorporated) (445 | 4.2%) make up the most common classes of employment.
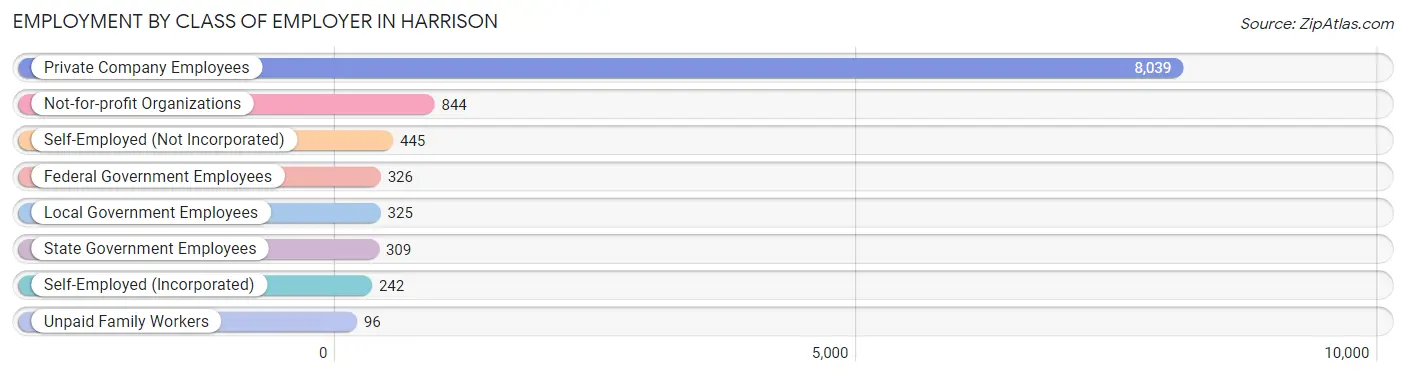
| Employer Class | # Employees | % Employees |
| Private Company Employees | 8,039 | 75.6% |
| Self-Employed (Incorporated) | 242 | 2.3% |
| Self-Employed (Not Incorporated) | 445 | 4.2% |
| Not-for-profit Organizations | 844 | 7.9% |
| Local Government Employees | 325 | 3.1% |
| State Government Employees | 309 | 2.9% |
| Federal Government Employees | 326 | 3.1% |
| Unpaid Family Workers | 96 | 0.9% |
| Total | 10,626 | 100.0% |
Employment Status by Age in Harrison
According to the labor force statistics for Harrison, out of the total population over 16 years of age (15,851), 72.0% or 11,413 individuals are in the labor force, with 5.0% or 571 of them unemployed. The age group with the highest labor force participation rate is 30 to 34 years, with 90.8% or 2,759 individuals in the labor force. Within the labor force, the 45 to 54 years age range has the highest percentage of unemployed individuals, with 12.9% or 216 of them being unemployed.
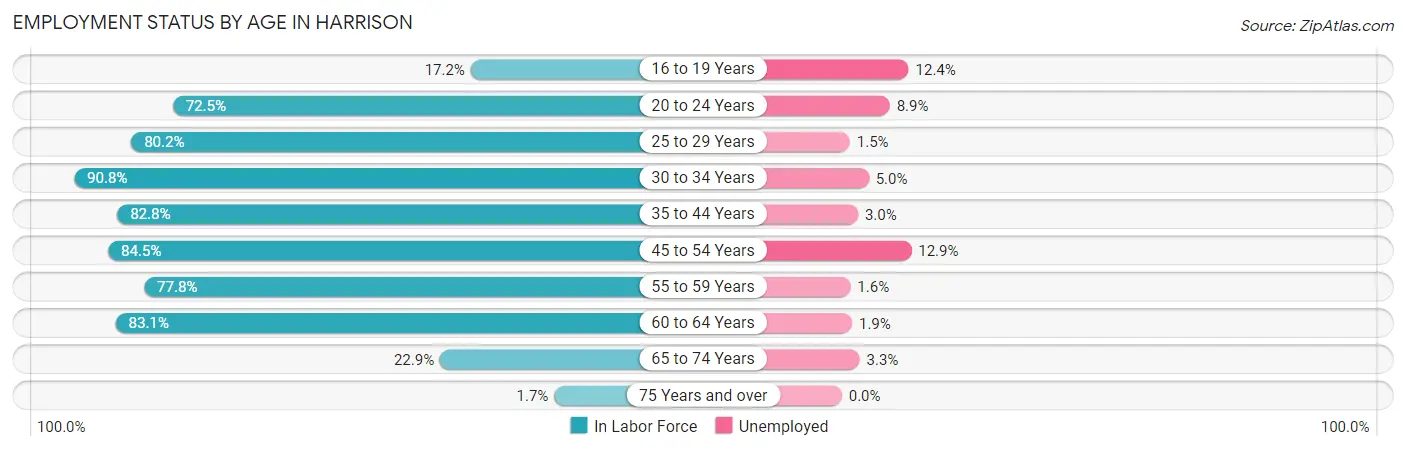
| Age Bracket | In Labor Force | Unemployed |
| 16 to 19 Years | 97 (17.2%) | 12 (12.4%) |
| 20 to 24 Years | 778 (72.5%) | 69 (8.9%) |
| 25 to 29 Years | 2,060 (80.2%) | 31 (1.5%) |
| 30 to 34 Years | 2,759 (90.8%) | 138 (5.0%) |
| 35 to 44 Years | 2,120 (82.8%) | 64 (3.0%) |
| 45 to 54 Years | 1,672 (84.5%) | 216 (12.9%) |
| 55 to 59 Years | 813 (77.8%) | 13 (1.6%) |
| 60 to 64 Years | 796 (83.1%) | 15 (1.9%) |
| 65 to 74 Years | 301 (22.9%) | 10 (3.3%) |
| 75 Years and over | 13 (1.7%) | 0 (0.0%) |
| Total | 11,413 (72.0%) | 571 (5.0%) |
Employment Status by Educational Attainment in Harrison
According to labor force statistics for Harrison, 84.1% of individuals (10,217) out of the total population between 25 and 64 years of age (12,149) are in the labor force, with 4.7% or 480 of them being unemployed. The group with the highest labor force participation rate are those with the educational attainment of college / associate degree, with 86.0% or 1,651 individuals in the labor force. Within the labor force, individuals with less than high school education have the highest percentage of unemployment, with 15.8% or 144 of them being unemployed.
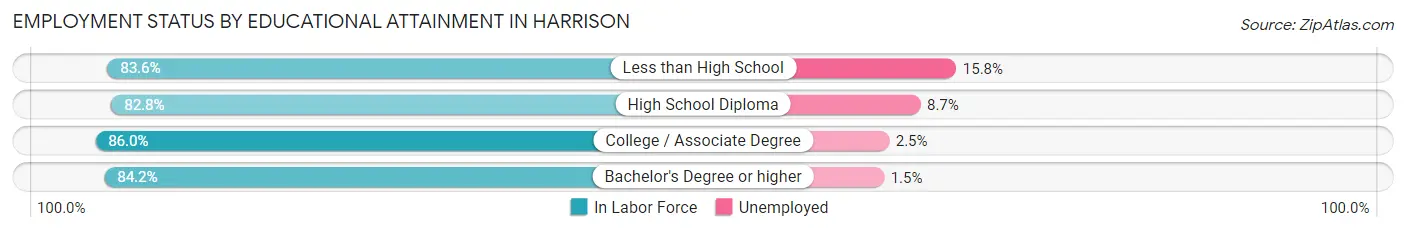
| Educational Attainment | In Labor Force | Unemployed |
| Less than High School | 910 (83.6%) | 172 (15.8%) |
| High School Diploma | 2,343 (82.8%) | 246 (8.7%) |
| College / Associate Degree | 1,651 (86.0%) | 48 (2.5%) |
| Bachelor's Degree or higher | 5,313 (84.2%) | 95 (1.5%) |
| Total | 10,217 (84.1%) | 571 (4.7%) |
Employment Occupations by Sex in Harrison
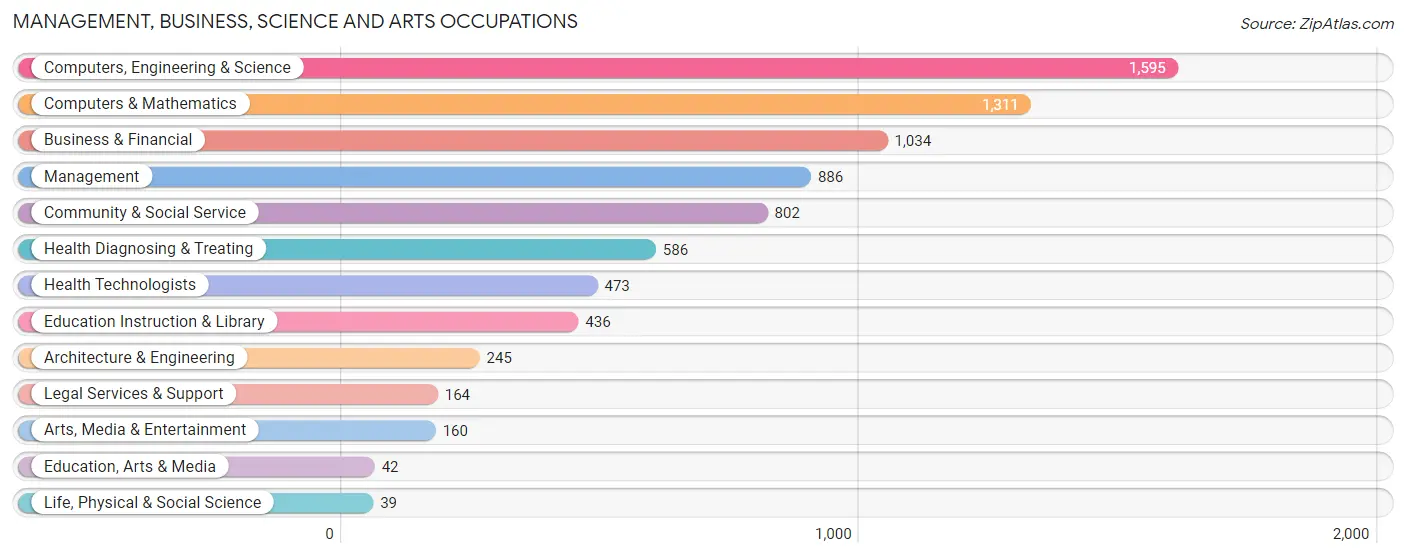
Management, Business, Science and Arts Occupations
The most common Management, Business, Science and Arts occupations in Harrison are Computers, Engineering & Science (1,595 | 15.0%), Computers & Mathematics (1,311 | 12.3%), Business & Financial (1,034 | 9.7%), Management (886 | 8.3%), and Community & Social Service (802 | 7.5%).
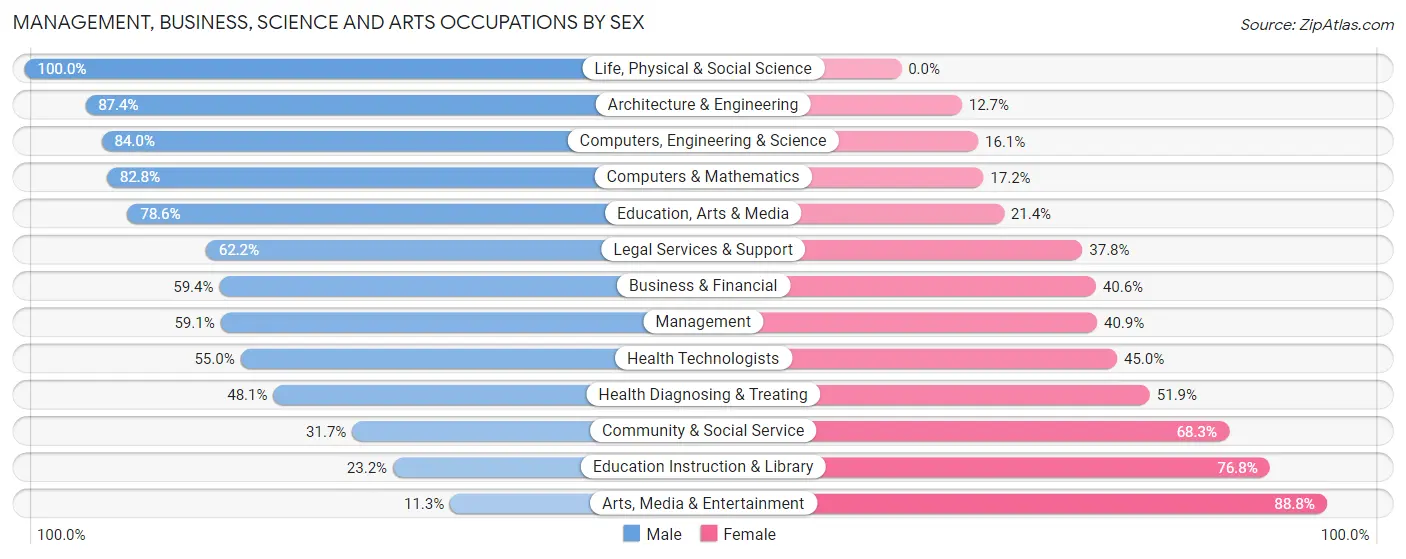
Management, Business, Science and Arts Occupations by Sex
Within the Management, Business, Science and Arts occupations in Harrison, the most male-oriented occupations are Life, Physical & Social Science (100.0%), Architecture & Engineering (87.4%), and Computers, Engineering & Science (84.0%), while the most female-oriented occupations are Arts, Media & Entertainment (88.7%), Education Instruction & Library (76.8%), and Community & Social Service (68.3%).
| Occupation | Male | Female |
| Management | 524 (59.1%) | 362 (40.9%) |
| Business & Financial | 614 (59.4%) | 420 (40.6%) |
| Computers, Engineering & Science | 1,339 (84.0%) | 256 (16.1%) |
| Computers & Mathematics | 1,086 (82.8%) | 225 (17.2%) |
| Architecture & Engineering | 214 (87.4%) | 31 (12.7%) |
| Life, Physical & Social Science | 39 (100.0%) | 0 (0.0%) |
| Community & Social Service | 254 (31.7%) | 548 (68.3%) |
| Education, Arts & Media | 33 (78.6%) | 9 (21.4%) |
| Legal Services & Support | 102 (62.2%) | 62 (37.8%) |
| Education Instruction & Library | 101 (23.2%) | 335 (76.8%) |
| Arts, Media & Entertainment | 18 (11.3%) | 142 (88.7%) |
| Health Diagnosing & Treating | 282 (48.1%) | 304 (51.9%) |
| Health Technologists | 260 (55.0%) | 213 (45.0%) |
| Total (Category) | 3,013 (61.5%) | 1,890 (38.6%) |
| Total (Overall) | 6,329 (59.4%) | 4,329 (40.6%) |
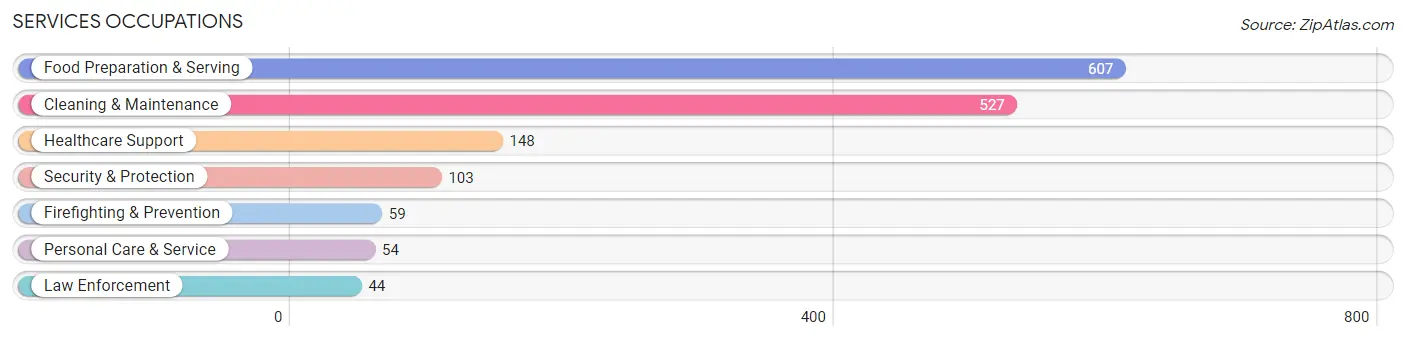
Services Occupations
The most common Services occupations in Harrison are Food Preparation & Serving (607 | 5.7%), Cleaning & Maintenance (527 | 4.9%), Healthcare Support (148 | 1.4%), Security & Protection (103 | 1.0%), and Firefighting & Prevention (59 | 0.5%).
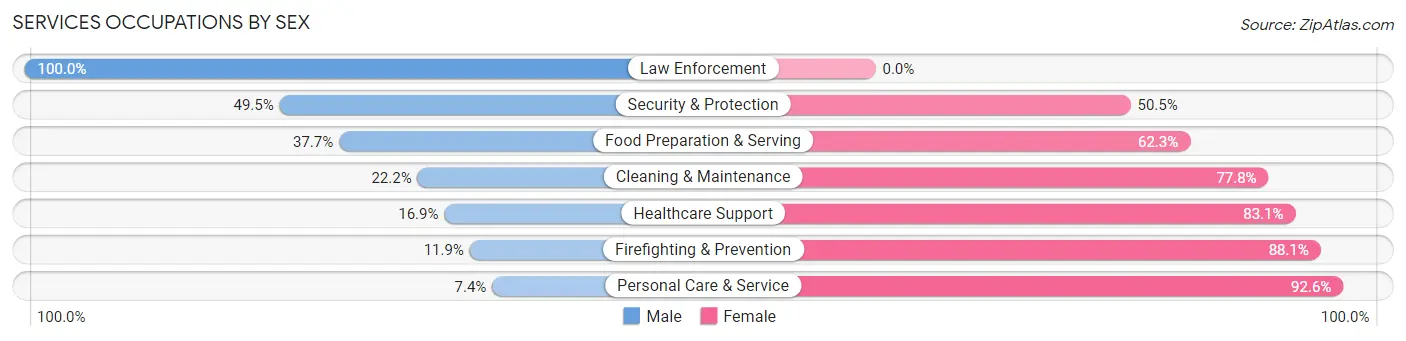
Services Occupations by Sex
Within the Services occupations in Harrison, the most male-oriented occupations are Law Enforcement (100.0%), Security & Protection (49.5%), and Food Preparation & Serving (37.7%), while the most female-oriented occupations are Personal Care & Service (92.6%), Firefighting & Prevention (88.1%), and Healthcare Support (83.1%).
| Occupation | Male | Female |
| Healthcare Support | 25 (16.9%) | 123 (83.1%) |
| Security & Protection | 51 (49.5%) | 52 (50.5%) |
| Firefighting & Prevention | 7 (11.9%) | 52 (88.1%) |
| Law Enforcement | 44 (100.0%) | 0 (0.0%) |
| Food Preparation & Serving | 229 (37.7%) | 378 (62.3%) |
| Cleaning & Maintenance | 117 (22.2%) | 410 (77.8%) |
| Personal Care & Service | 4 (7.4%) | 50 (92.6%) |
| Total (Category) | 426 (29.6%) | 1,013 (70.4%) |
| Total (Overall) | 6,329 (59.4%) | 4,329 (40.6%) |
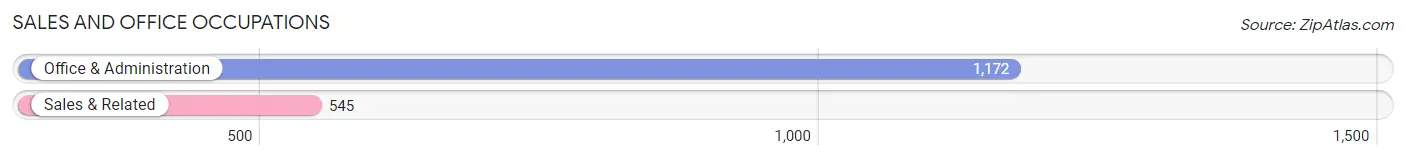
Sales and Office Occupations
The most common Sales and Office occupations in Harrison are Office & Administration (1,172 | 11.0%), and Sales & Related (545 | 5.1%).
Sales and Office Occupations by Sex
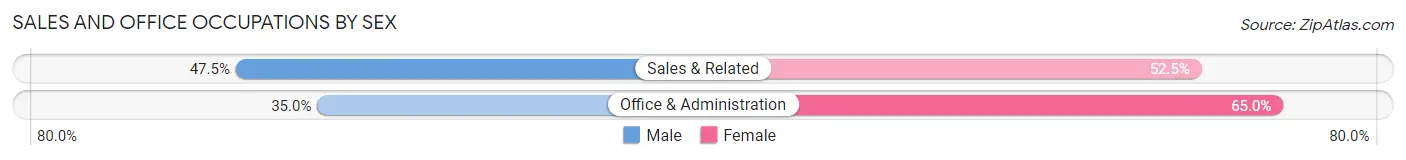
| Occupation | Male | Female |
| Sales & Related | 259 (47.5%) | 286 (52.5%) |
| Office & Administration | 410 (35.0%) | 762 (65.0%) |
| Total (Category) | 669 (39.0%) | 1,048 (61.0%) |
| Total (Overall) | 6,329 (59.4%) | 4,329 (40.6%) |
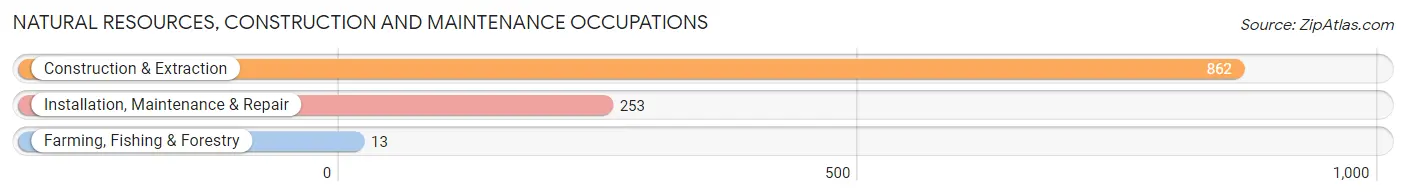
Natural Resources, Construction and Maintenance Occupations
The most common Natural Resources, Construction and Maintenance occupations in Harrison are Construction & Extraction (862 | 8.1%), Installation, Maintenance & Repair (253 | 2.4%), and Farming, Fishing & Forestry (13 | 0.1%).
Natural Resources, Construction and Maintenance Occupations by Sex
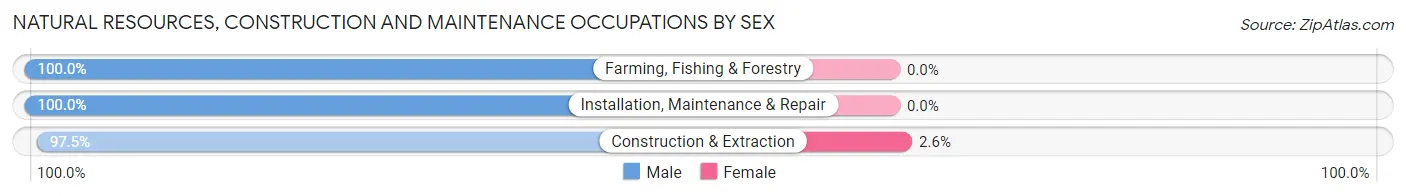
| Occupation | Male | Female |
| Farming, Fishing & Forestry | 13 (100.0%) | 0 (0.0%) |
| Construction & Extraction | 840 (97.5%) | 22 (2.5%) |
| Installation, Maintenance & Repair | 253 (100.0%) | 0 (0.0%) |
| Total (Category) | 1,106 (98.1%) | 22 (1.9%) |
| Total (Overall) | 6,329 (59.4%) | 4,329 (40.6%) |
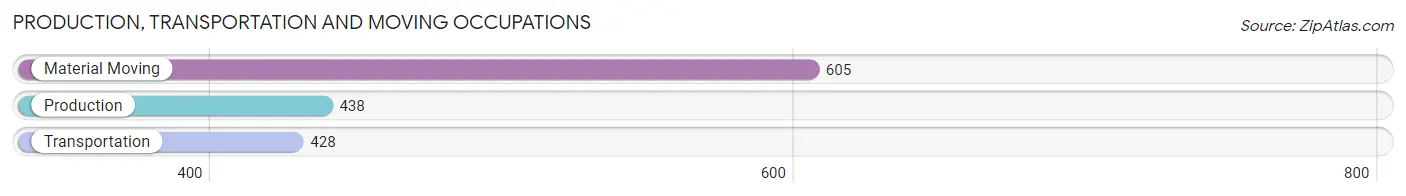
Production, Transportation and Moving Occupations
The most common Production, Transportation and Moving occupations in Harrison are Material Moving (605 | 5.7%), Production (438 | 4.1%), and Transportation (428 | 4.0%).
Production, Transportation and Moving Occupations by Sex
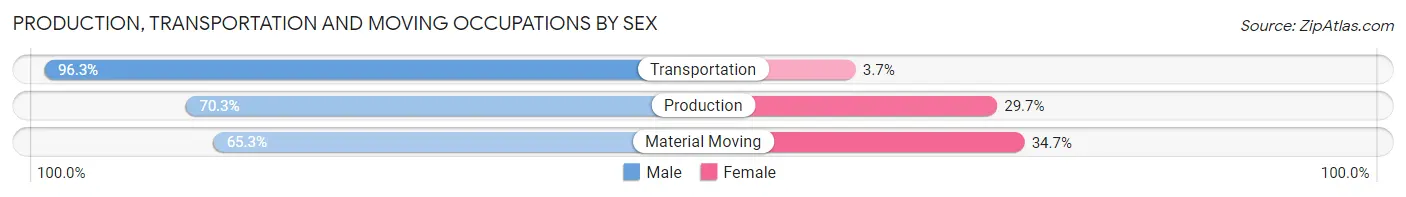
| Occupation | Male | Female |
| Production | 308 (70.3%) | 130 (29.7%) |
| Transportation | 412 (96.3%) | 16 (3.7%) |
| Material Moving | 395 (65.3%) | 210 (34.7%) |
| Total (Category) | 1,115 (75.8%) | 356 (24.2%) |
| Total (Overall) | 6,329 (59.4%) | 4,329 (40.6%) |
Employment Industries by Sex in Harrison
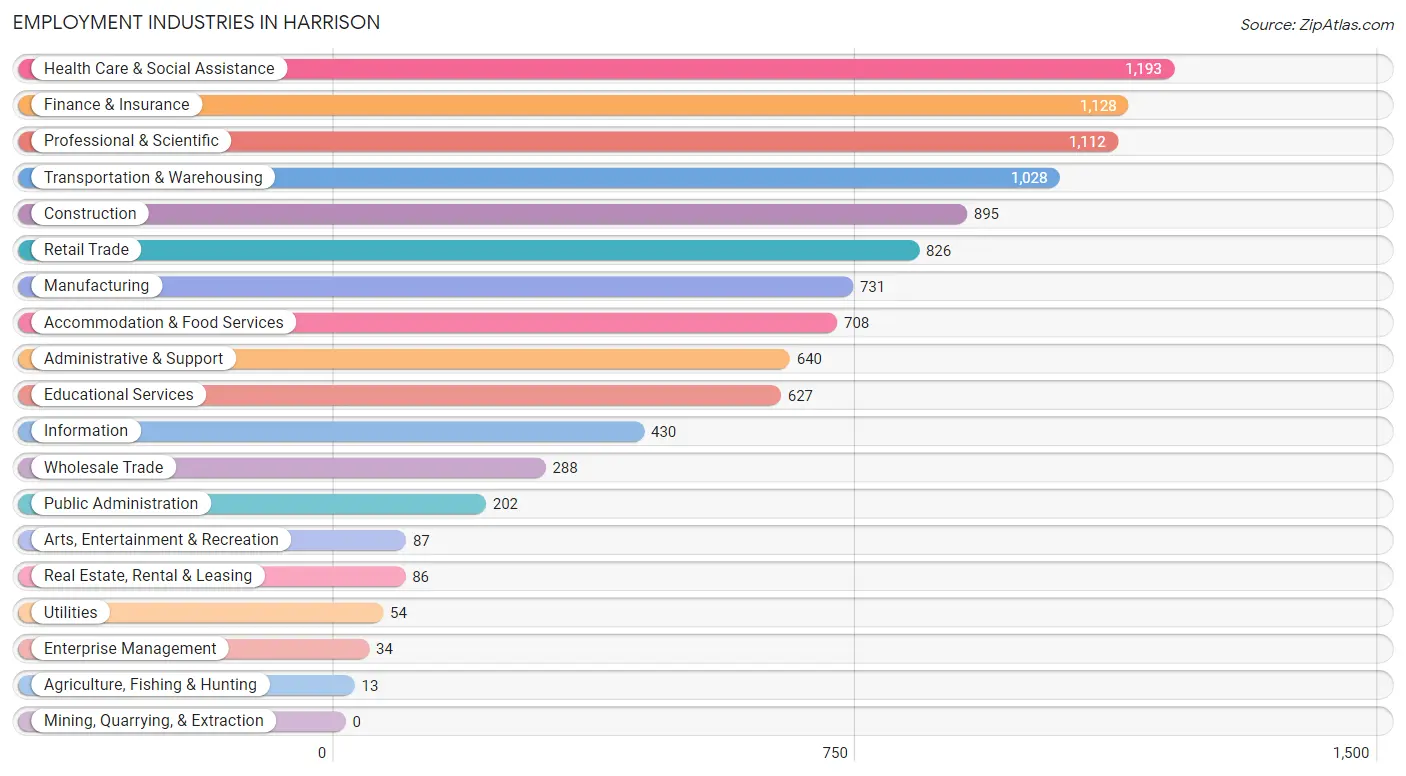
Employment Industries in Harrison
The major employment industries in Harrison include Health Care & Social Assistance (1,193 | 11.2%), Finance & Insurance (1,128 | 10.6%), Professional & Scientific (1,112 | 10.4%), Transportation & Warehousing (1,028 | 9.7%), and Construction (895 | 8.4%).
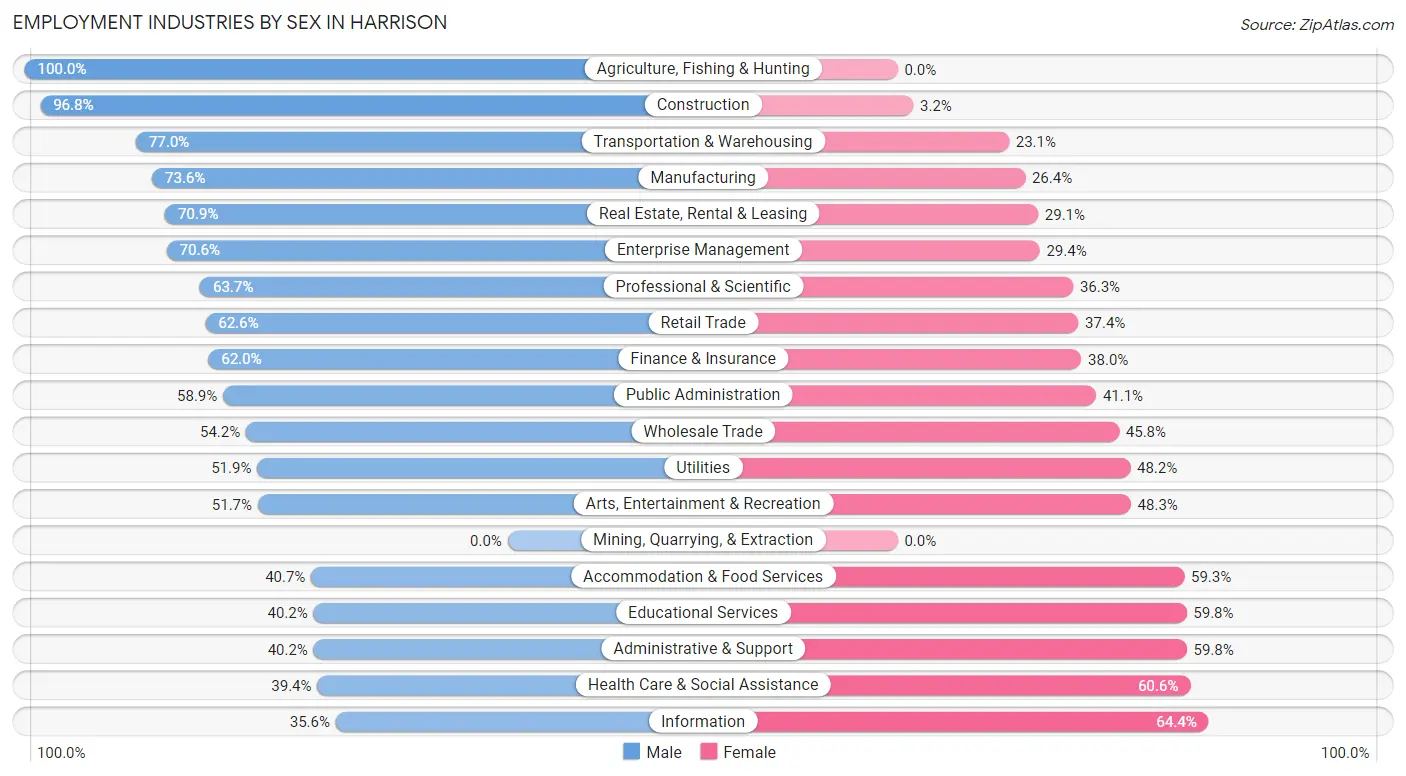
Employment Industries by Sex in Harrison
The Harrison industries that see more men than women are Agriculture, Fishing & Hunting (100.0%), Construction (96.8%), and Transportation & Warehousing (76.9%), whereas the industries that tend to have a higher number of women are Information (64.4%), Health Care & Social Assistance (60.6%), and Administrative & Support (59.8%).
| Industry | Male | Female |
| Agriculture, Fishing & Hunting | 13 (100.0%) | 0 (0.0%) |
| Mining, Quarrying, & Extraction | 0 (0.0%) | 0 (0.0%) |
| Construction | 866 (96.8%) | 29 (3.2%) |
| Manufacturing | 538 (73.6%) | 193 (26.4%) |
| Wholesale Trade | 156 (54.2%) | 132 (45.8%) |
| Retail Trade | 517 (62.6%) | 309 (37.4%) |
| Transportation & Warehousing | 791 (76.9%) | 237 (23.1%) |
| Utilities | 28 (51.8%) | 26 (48.1%) |
| Information | 153 (35.6%) | 277 (64.4%) |
| Finance & Insurance | 699 (62.0%) | 429 (38.0%) |
| Real Estate, Rental & Leasing | 61 (70.9%) | 25 (29.1%) |
| Professional & Scientific | 708 (63.7%) | 404 (36.3%) |
| Enterprise Management | 24 (70.6%) | 10 (29.4%) |
| Administrative & Support | 257 (40.2%) | 383 (59.8%) |
| Educational Services | 252 (40.2%) | 375 (59.8%) |
| Health Care & Social Assistance | 470 (39.4%) | 723 (60.6%) |
| Arts, Entertainment & Recreation | 45 (51.7%) | 42 (48.3%) |
| Accommodation & Food Services | 288 (40.7%) | 420 (59.3%) |
| Public Administration | 119 (58.9%) | 83 (41.1%) |
| Total | 6,329 (59.4%) | 4,329 (40.6%) |
Education in Harrison
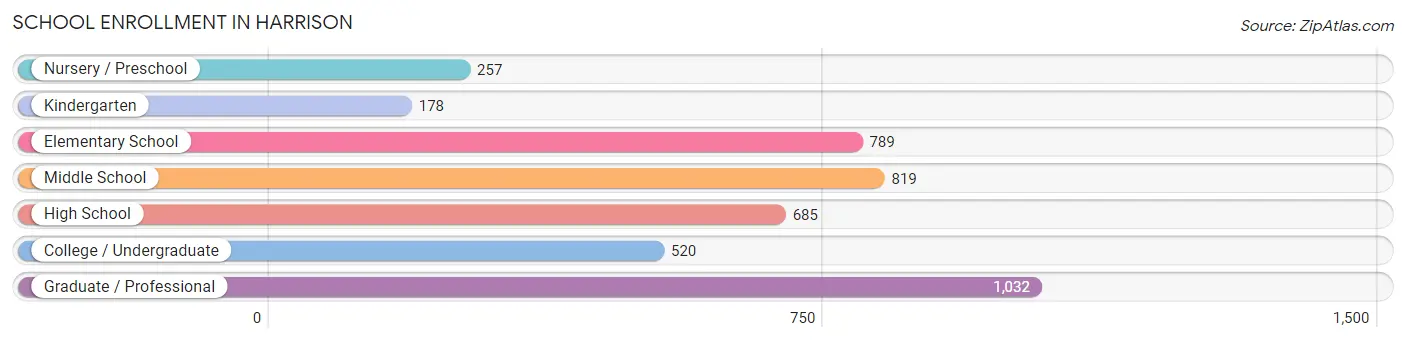
School Enrollment in Harrison
The most common levels of schooling among the 4,280 students in Harrison are graduate / professional (1,032 | 24.1%), middle school (819 | 19.1%), and elementary school (789 | 18.4%).
| School Level | # Students | % Students |
| Nursery / Preschool | 257 | 6.0% |
| Kindergarten | 178 | 4.2% |
| Elementary School | 789 | 18.4% |
| Middle School | 819 | 19.1% |
| High School | 685 | 16.0% |
| College / Undergraduate | 520 | 12.1% |
| Graduate / Professional | 1,032 | 24.1% |
| Total | 4,280 | 100.0% |
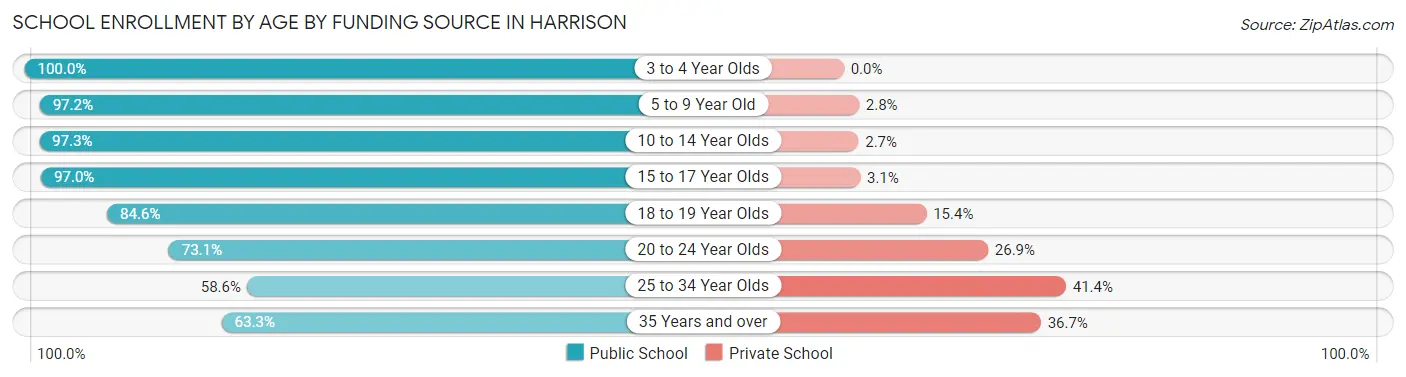
School Enrollment by Age by Funding Source in Harrison
Out of a total of 4,280 students who are enrolled in schools in Harrison, 646 (15.1%) attend a private institution, while the remaining 3,634 (84.9%) are enrolled in public schools. The age group of 25 to 34 year olds has the highest likelihood of being enrolled in private schools, with 403 (41.4% in the age bracket) enrolled. Conversely, the age group of 3 to 4 year olds has the lowest likelihood of being enrolled in a private school, with 224 (100.0% in the age bracket) attending a public institution.
| Age Bracket | Public School | Private School |
| 3 to 4 Year Olds | 224 (100.0%) | 0 (0.0%) |
| 5 to 9 Year Old | 893 (97.2%) | 26 (2.8%) |
| 10 to 14 Year Olds | 930 (97.3%) | 26 (2.7%) |
| 15 to 17 Year Olds | 509 (97.0%) | 16 (3.0%) |
| 18 to 19 Year Olds | 132 (84.6%) | 24 (15.4%) |
| 20 to 24 Year Olds | 305 (73.1%) | 112 (26.9%) |
| 25 to 34 Year Olds | 571 (58.6%) | 403 (41.4%) |
| 35 Years and over | 69 (63.3%) | 40 (36.7%) |
| Total | 3,634 (84.9%) | 646 (15.1%) |
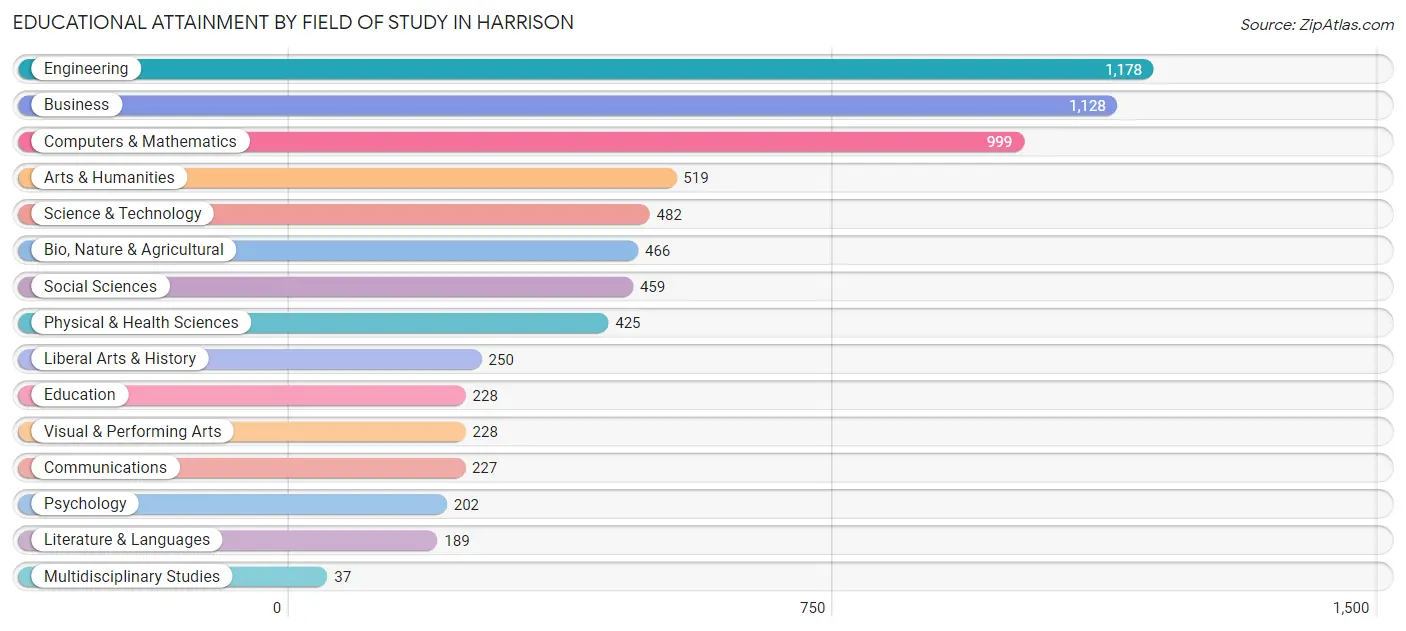
Educational Attainment by Field of Study in Harrison
Engineering (1,178 | 16.8%), business (1,128 | 16.1%), computers & mathematics (999 | 14.2%), arts & humanities (519 | 7.4%), and science & technology (482 | 6.9%) are the most common fields of study among 7,017 individuals in Harrison who have obtained a bachelor's degree or higher.
| Field of Study | # Graduates | % Graduates |
| Computers & Mathematics | 999 | 14.2% |
| Bio, Nature & Agricultural | 466 | 6.6% |
| Physical & Health Sciences | 425 | 6.1% |
| Psychology | 202 | 2.9% |
| Social Sciences | 459 | 6.5% |
| Engineering | 1,178 | 16.8% |
| Multidisciplinary Studies | 37 | 0.5% |
| Science & Technology | 482 | 6.9% |
| Business | 1,128 | 16.1% |
| Education | 228 | 3.3% |
| Literature & Languages | 189 | 2.7% |
| Liberal Arts & History | 250 | 3.6% |
| Visual & Performing Arts | 228 | 3.3% |
| Communications | 227 | 3.2% |
| Arts & Humanities | 519 | 7.4% |
| Total | 7,017 | 100.0% |
Transportation & Commute in Harrison
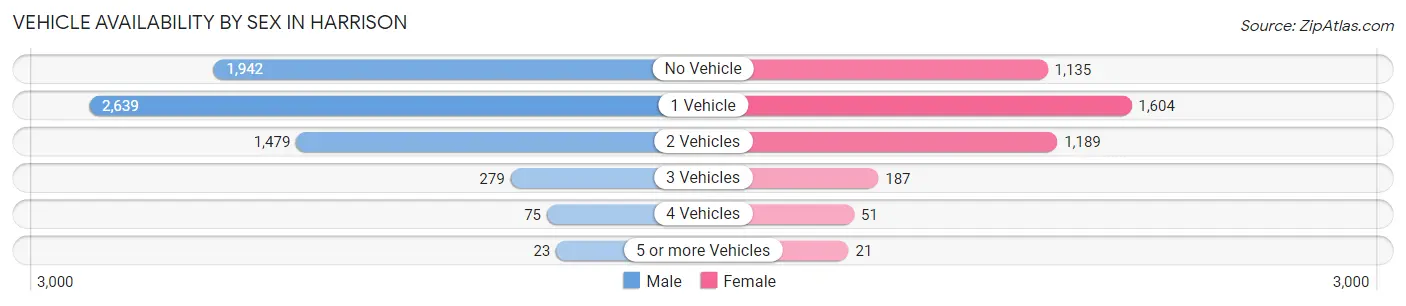
Vehicle Availability by Sex in Harrison
The most prevalent vehicle ownership categories in Harrison are males with 1 vehicle (2,639, accounting for 41.0%) and females with 1 vehicle (1,604, making up 63.0%).
| Vehicles Available | Male | Female |
| No Vehicle | 1,942 (30.2%) | 1,135 (27.1%) |
| 1 Vehicle | 2,639 (41.0%) | 1,604 (38.3%) |
| 2 Vehicles | 1,479 (23.0%) | 1,189 (28.4%) |
| 3 Vehicles | 279 (4.3%) | 187 (4.5%) |
| 4 Vehicles | 75 (1.2%) | 51 (1.2%) |
| 5 or more Vehicles | 23 (0.4%) | 21 (0.5%) |
| Total | 6,437 (100.0%) | 4,187 (100.0%) |
Commute Time in Harrison
The most frequently occuring commute durations in Harrison are 60 to 89 minutes (1,634 commuters, 18.1%), 45 to 59 minutes (1,315 commuters, 14.6%), and 15 to 19 minutes (1,196 commuters, 13.3%).
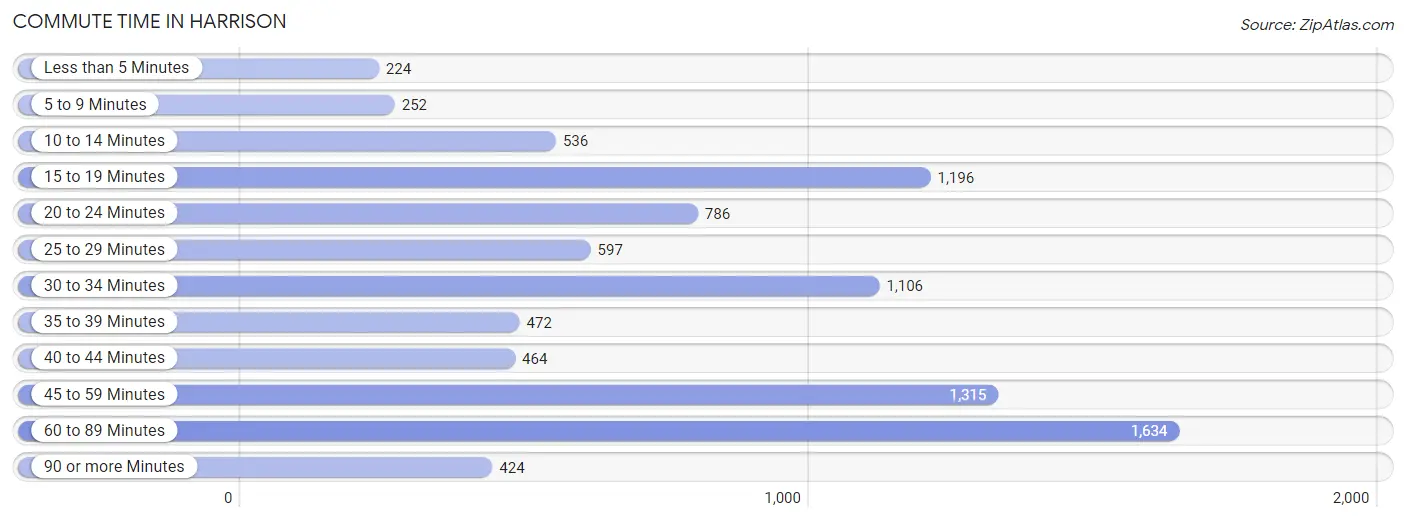
| Commute Time | # Commuters | % Commuters |
| Less than 5 Minutes | 224 | 2.5% |
| 5 to 9 Minutes | 252 | 2.8% |
| 10 to 14 Minutes | 536 | 5.9% |
| 15 to 19 Minutes | 1,196 | 13.3% |
| 20 to 24 Minutes | 786 | 8.7% |
| 25 to 29 Minutes | 597 | 6.6% |
| 30 to 34 Minutes | 1,106 | 12.3% |
| 35 to 39 Minutes | 472 | 5.2% |
| 40 to 44 Minutes | 464 | 5.1% |
| 45 to 59 Minutes | 1,315 | 14.6% |
| 60 to 89 Minutes | 1,634 | 18.1% |
| 90 or more Minutes | 424 | 4.7% |
Commute Time by Sex in Harrison
The most common commute times in Harrison are 60 to 89 minutes (1,090 commuters, 20.2%) for males and 15 to 19 minutes (646 commuters, 17.9%) for females.
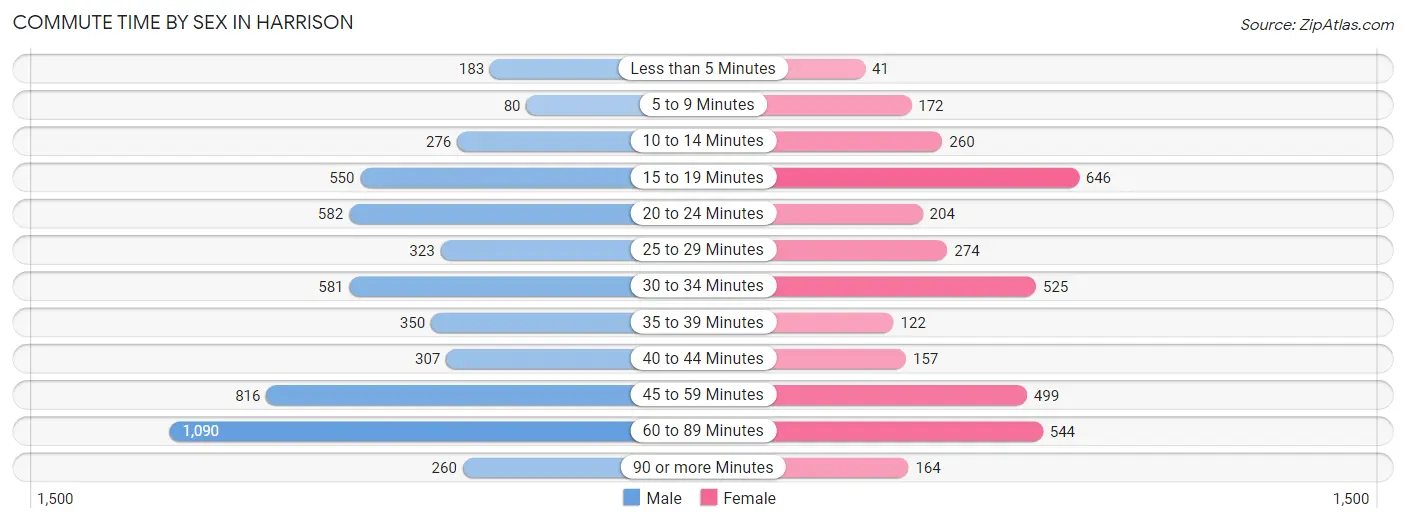
| Commute Time | Male | Female |
| Less than 5 Minutes | 183 (3.4%) | 41 (1.1%) |
| 5 to 9 Minutes | 80 (1.5%) | 172 (4.8%) |
| 10 to 14 Minutes | 276 (5.1%) | 260 (7.2%) |
| 15 to 19 Minutes | 550 (10.2%) | 646 (17.9%) |
| 20 to 24 Minutes | 582 (10.8%) | 204 (5.7%) |
| 25 to 29 Minutes | 323 (6.0%) | 274 (7.6%) |
| 30 to 34 Minutes | 581 (10.8%) | 525 (14.5%) |
| 35 to 39 Minutes | 350 (6.5%) | 122 (3.4%) |
| 40 to 44 Minutes | 307 (5.7%) | 157 (4.3%) |
| 45 to 59 Minutes | 816 (15.1%) | 499 (13.8%) |
| 60 to 89 Minutes | 1,090 (20.2%) | 544 (15.1%) |
| 90 or more Minutes | 260 (4.8%) | 164 (4.5%) |
Time of Departure to Work by Sex in Harrison
The most frequent times of departure to work in Harrison are 7:00 AM to 7:29 AM (1,285, 23.8%) for males and 8:00 AM to 8:29 AM (901, 25.0%) for females.
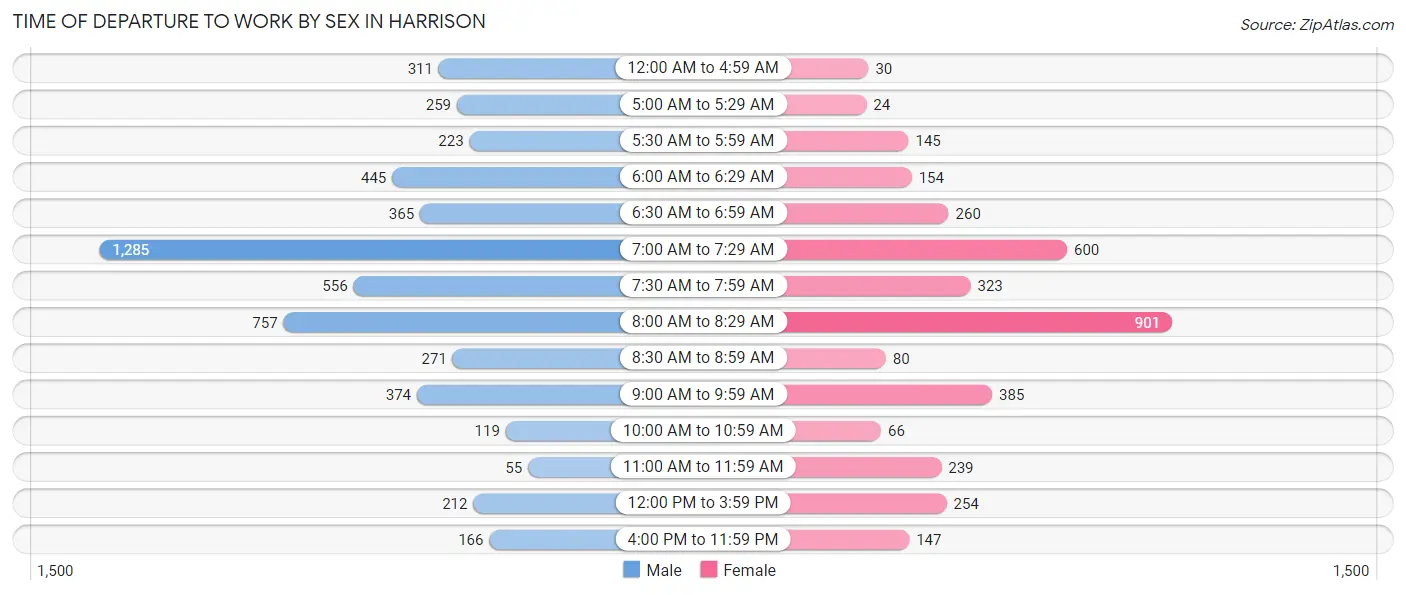
| Time of Departure | Male | Female |
| 12:00 AM to 4:59 AM | 311 (5.8%) | 30 (0.8%) |
| 5:00 AM to 5:29 AM | 259 (4.8%) | 24 (0.7%) |
| 5:30 AM to 5:59 AM | 223 (4.1%) | 145 (4.0%) |
| 6:00 AM to 6:29 AM | 445 (8.2%) | 154 (4.3%) |
| 6:30 AM to 6:59 AM | 365 (6.8%) | 260 (7.2%) |
| 7:00 AM to 7:29 AM | 1,285 (23.8%) | 600 (16.6%) |
| 7:30 AM to 7:59 AM | 556 (10.3%) | 323 (8.9%) |
| 8:00 AM to 8:29 AM | 757 (14.0%) | 901 (25.0%) |
| 8:30 AM to 8:59 AM | 271 (5.0%) | 80 (2.2%) |
| 9:00 AM to 9:59 AM | 374 (6.9%) | 385 (10.7%) |
| 10:00 AM to 10:59 AM | 119 (2.2%) | 66 (1.8%) |
| 11:00 AM to 11:59 AM | 55 (1.0%) | 239 (6.6%) |
| 12:00 PM to 3:59 PM | 212 (3.9%) | 254 (7.0%) |
| 4:00 PM to 11:59 PM | 166 (3.1%) | 147 (4.1%) |
| Total | 5,398 (100.0%) | 3,608 (100.0%) |
Housing Occupancy in Harrison
Occupancy by Ownership in Harrison
Of the total 8,531 dwellings in Harrison, owner-occupied units account for 1,869 (21.9%), while renter-occupied units make up 6,662 (78.1%).
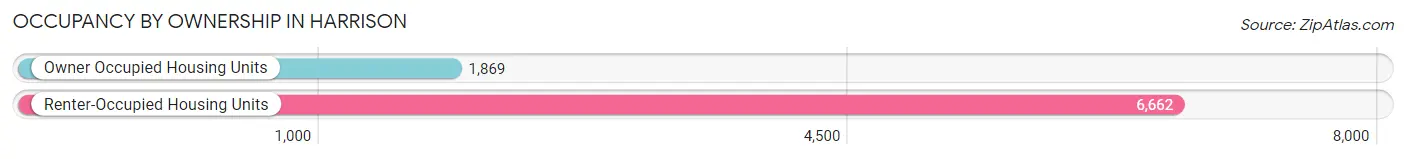
| Occupancy | # Housing Units | % Housing Units |
| Owner Occupied Housing Units | 1,869 | 21.9% |
| Renter-Occupied Housing Units | 6,662 | 78.1% |
| Total Occupied Housing Units | 8,531 | 100.0% |
Occupancy by Household Size in Harrison
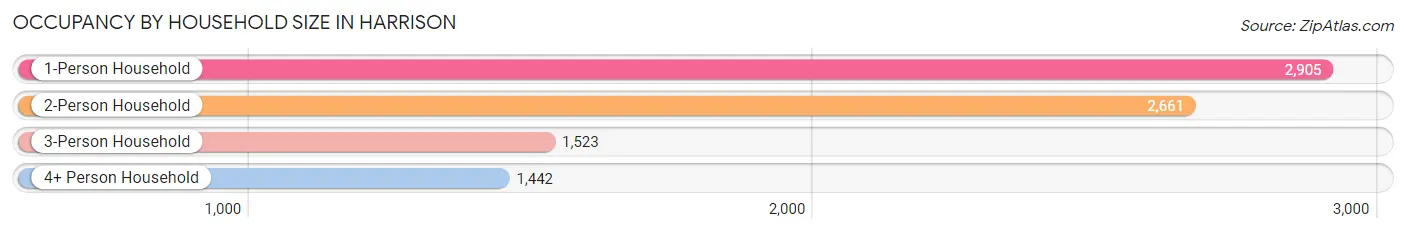
| Household Size | # Housing Units | % Housing Units |
| 1-Person Household | 2,905 | 34.1% |
| 2-Person Household | 2,661 | 31.2% |
| 3-Person Household | 1,523 | 17.8% |
| 4+ Person Household | 1,442 | 16.9% |
| Total Housing Units | 8,531 | 100.0% |
Occupancy by Ownership by Household Size in Harrison
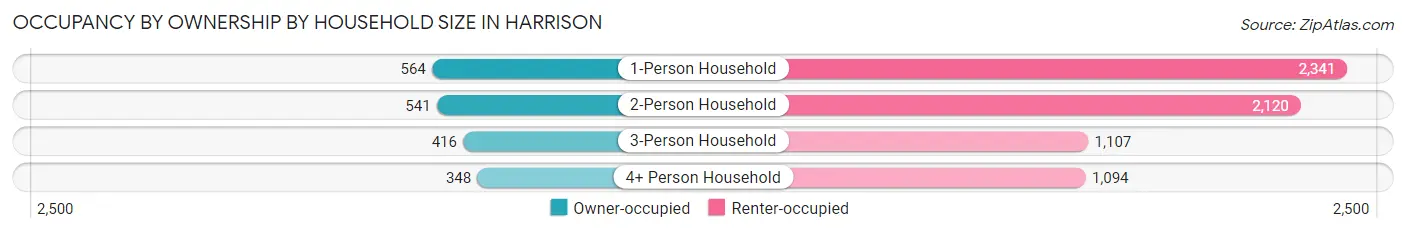
| Household Size | Owner-occupied | Renter-occupied |
| 1-Person Household | 564 (19.4%) | 2,341 (80.6%) |
| 2-Person Household | 541 (20.3%) | 2,120 (79.7%) |
| 3-Person Household | 416 (27.3%) | 1,107 (72.7%) |
| 4+ Person Household | 348 (24.1%) | 1,094 (75.9%) |
| Total Housing Units | 1,869 (21.9%) | 6,662 (78.1%) |
Occupancy by Educational Attainment in Harrison
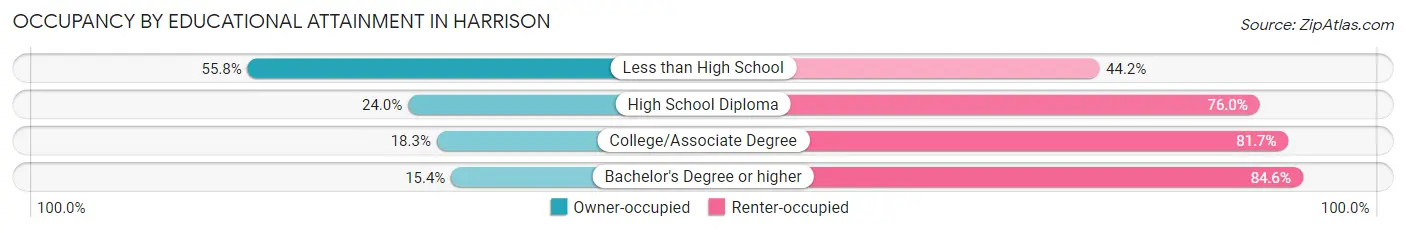
| Household Size | Owner-occupied | Renter-occupied |
| Less than High School | 481 (55.8%) | 381 (44.2%) |
| High School Diploma | 472 (24.0%) | 1,497 (76.0%) |
| College/Associate Degree | 237 (18.3%) | 1,059 (81.7%) |
| Bachelor's Degree or higher | 679 (15.4%) | 3,725 (84.6%) |
Occupancy by Age of Householder in Harrison
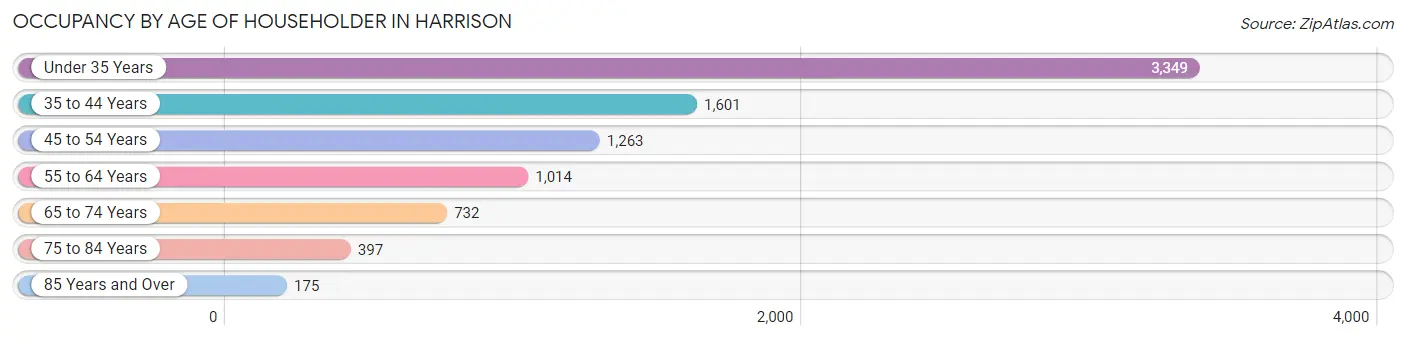
| Age Bracket | # Households | % Households |
| Under 35 Years | 3,349 | 39.3% |
| 35 to 44 Years | 1,601 | 18.8% |
| 45 to 54 Years | 1,263 | 14.8% |
| 55 to 64 Years | 1,014 | 11.9% |
| 65 to 74 Years | 732 | 8.6% |
| 75 to 84 Years | 397 | 4.6% |
| 85 Years and Over | 175 | 2.1% |
| Total | 8,531 | 100.0% |
Housing Finances in Harrison
Median Income by Occupancy in Harrison
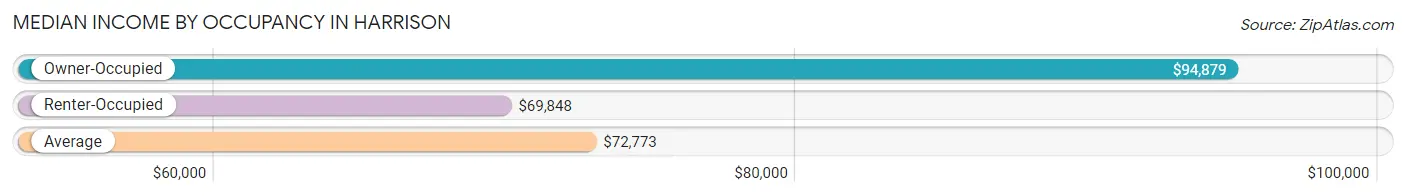
| Occupancy Type | # Households | Median Income |
| Owner-Occupied | 1,869 (21.9%) | $94,879 |
| Renter-Occupied | 6,662 (78.1%) | $69,848 |
| Average | 8,531 (100.0%) | $72,773 |
Occupancy by Householder Income Bracket in Harrison
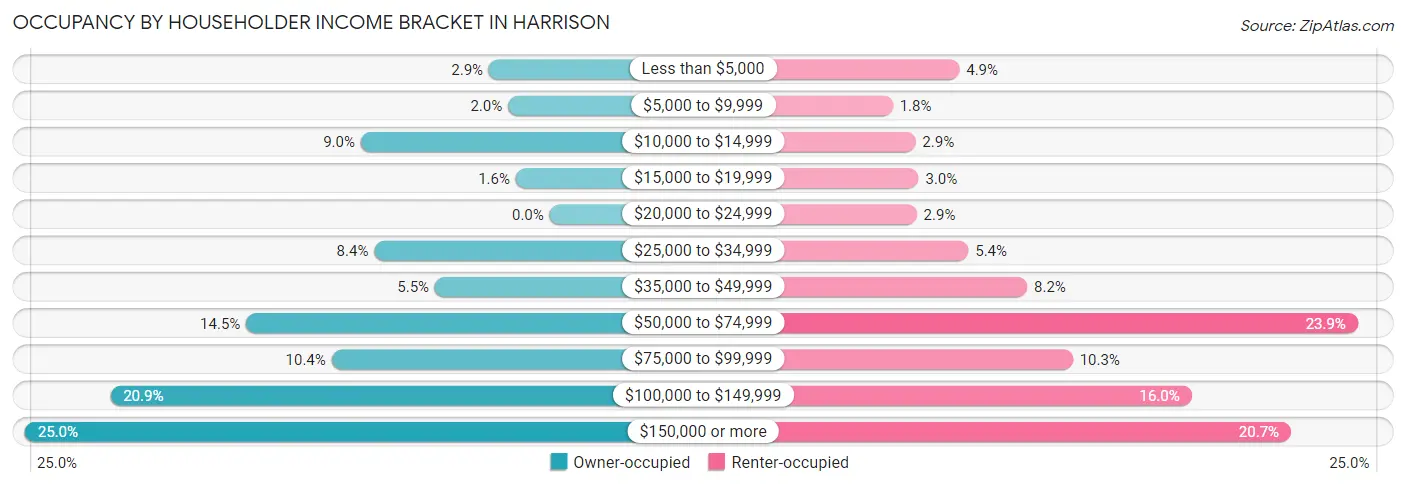
| Income Bracket | Owner-occupied | Renter-occupied |
| Less than $5,000 | 54 (2.9%) | 329 (4.9%) |
| $5,000 to $9,999 | 37 (2.0%) | 118 (1.8%) |
| $10,000 to $14,999 | 168 (9.0%) | 190 (2.9%) |
| $15,000 to $19,999 | 30 (1.6%) | 200 (3.0%) |
| $20,000 to $24,999 | 0 (0.0%) | 194 (2.9%) |
| $25,000 to $34,999 | 156 (8.4%) | 358 (5.4%) |
| $35,000 to $49,999 | 102 (5.5%) | 544 (8.2%) |
| $50,000 to $74,999 | 270 (14.4%) | 1,593 (23.9%) |
| $75,000 to $99,999 | 194 (10.4%) | 689 (10.3%) |
| $100,000 to $149,999 | 391 (20.9%) | 1,066 (16.0%) |
| $150,000 or more | 467 (25.0%) | 1,381 (20.7%) |
| Total | 1,869 (100.0%) | 6,662 (100.0%) |
Monthly Housing Cost Tiers in Harrison
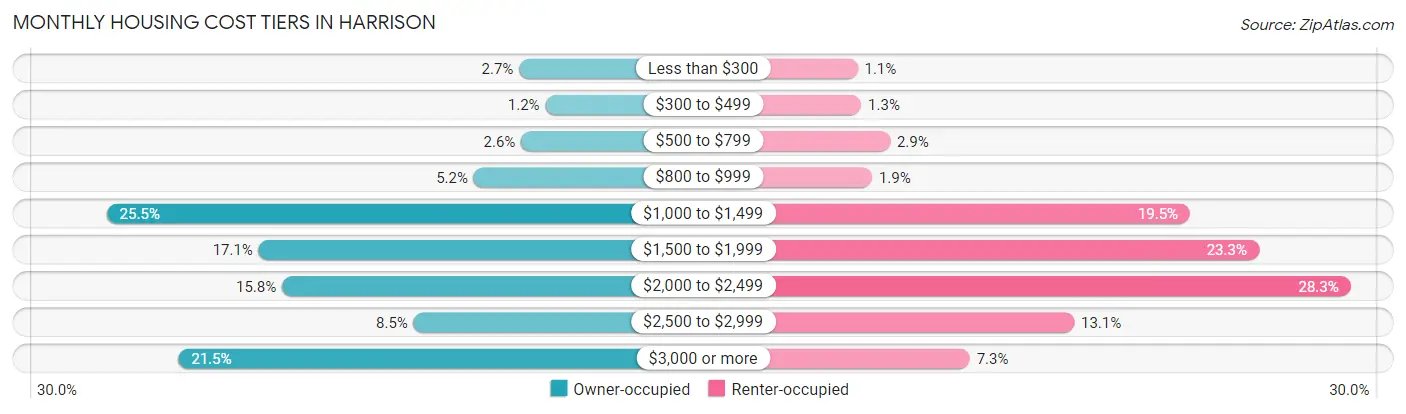
| Monthly Cost | Owner-occupied | Renter-occupied |
| Less than $300 | 50 (2.7%) | 74 (1.1%) |
| $300 to $499 | 23 (1.2%) | 87 (1.3%) |
| $500 to $799 | 48 (2.6%) | 193 (2.9%) |
| $800 to $999 | 97 (5.2%) | 127 (1.9%) |
| $1,000 to $1,499 | 476 (25.5%) | 1,297 (19.5%) |
| $1,500 to $1,999 | 319 (17.1%) | 1,550 (23.3%) |
| $2,000 to $2,499 | 295 (15.8%) | 1,888 (28.3%) |
| $2,500 to $2,999 | 159 (8.5%) | 871 (13.1%) |
| $3,000 or more | 402 (21.5%) | 487 (7.3%) |
| Total | 1,869 (100.0%) | 6,662 (100.0%) |
Physical Housing Characteristics in Harrison
Housing Structures in Harrison
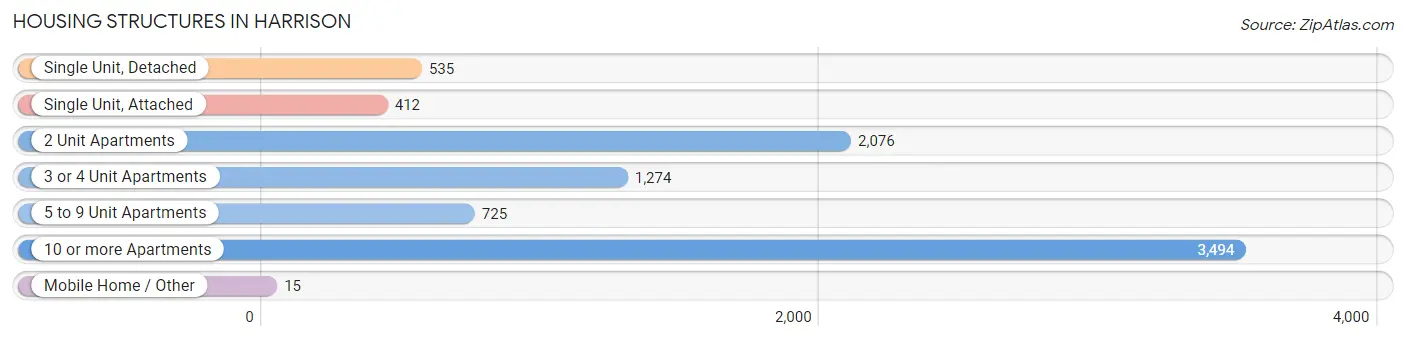
| Structure Type | # Housing Units | % Housing Units |
| Single Unit, Detached | 535 | 6.3% |
| Single Unit, Attached | 412 | 4.8% |
| 2 Unit Apartments | 2,076 | 24.3% |
| 3 or 4 Unit Apartments | 1,274 | 14.9% |
| 5 to 9 Unit Apartments | 725 | 8.5% |
| 10 or more Apartments | 3,494 | 41.0% |
| Mobile Home / Other | 15 | 0.2% |
| Total | 8,531 | 100.0% |
Housing Structures by Occupancy in Harrison
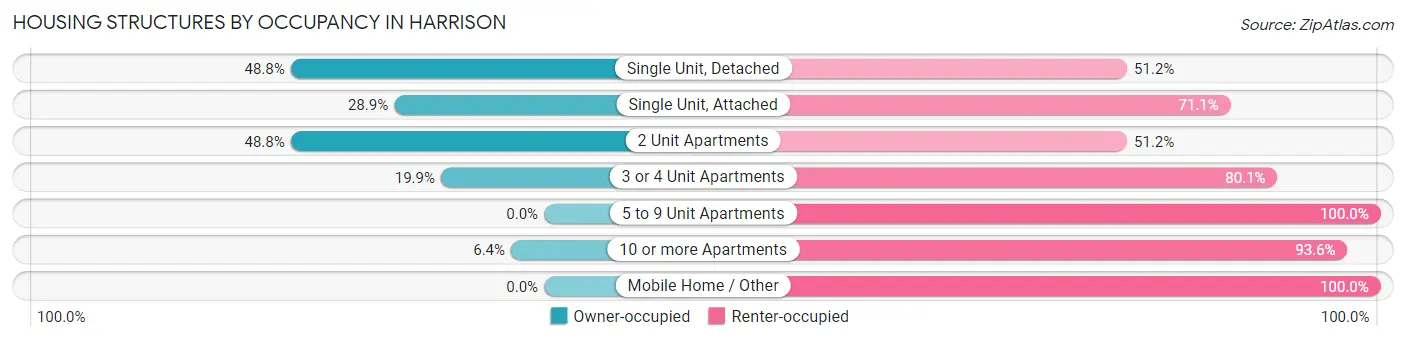
| Structure Type | Owner-occupied | Renter-occupied |
| Single Unit, Detached | 261 (48.8%) | 274 (51.2%) |
| Single Unit, Attached | 119 (28.9%) | 293 (71.1%) |
| 2 Unit Apartments | 1,013 (48.8%) | 1,063 (51.2%) |
| 3 or 4 Unit Apartments | 253 (19.9%) | 1,021 (80.1%) |
| 5 to 9 Unit Apartments | 0 (0.0%) | 725 (100.0%) |
| 10 or more Apartments | 223 (6.4%) | 3,271 (93.6%) |
| Mobile Home / Other | 0 (0.0%) | 15 (100.0%) |
| Total | 1,869 (21.9%) | 6,662 (78.1%) |
Housing Structures by Number of Rooms in Harrison
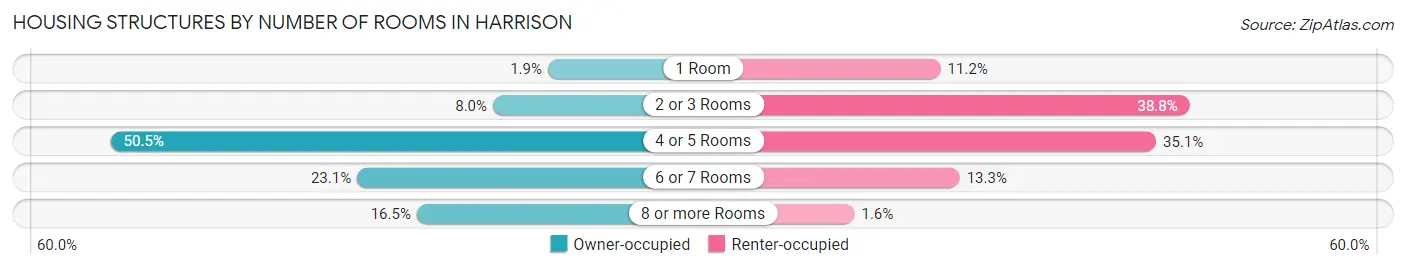
| Number of Rooms | Owner-occupied | Renter-occupied |
| 1 Room | 36 (1.9%) | 745 (11.2%) |
| 2 or 3 Rooms | 150 (8.0%) | 2,585 (38.8%) |
| 4 or 5 Rooms | 943 (50.4%) | 2,338 (35.1%) |
| 6 or 7 Rooms | 432 (23.1%) | 886 (13.3%) |
| 8 or more Rooms | 308 (16.5%) | 108 (1.6%) |
| Total | 1,869 (100.0%) | 6,662 (100.0%) |
Housing Structure by Heating Type in Harrison
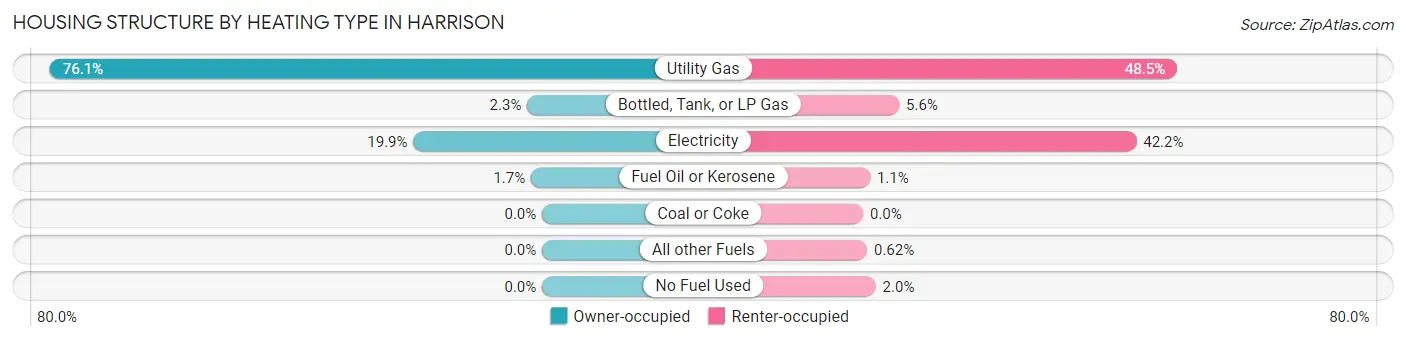
| Heating Type | Owner-occupied | Renter-occupied |
| Utility Gas | 1,422 (76.1%) | 3,234 (48.5%) |
| Bottled, Tank, or LP Gas | 43 (2.3%) | 372 (5.6%) |
| Electricity | 372 (19.9%) | 2,814 (42.2%) |
| Fuel Oil or Kerosene | 32 (1.7%) | 71 (1.1%) |
| Coal or Coke | 0 (0.0%) | 0 (0.0%) |
| All other Fuels | 0 (0.0%) | 41 (0.6%) |
| No Fuel Used | 0 (0.0%) | 130 (1.9%) |
| Total | 1,869 (100.0%) | 6,662 (100.0%) |
Household Vehicle Usage in Harrison
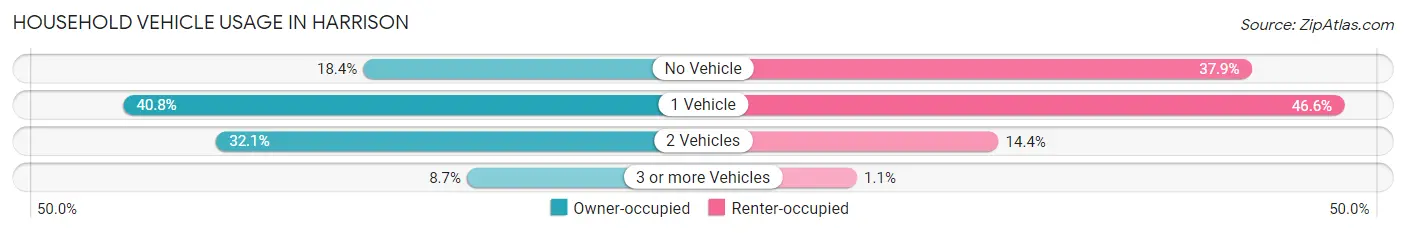
| Vehicles per Household | Owner-occupied | Renter-occupied |
| No Vehicle | 344 (18.4%) | 2,527 (37.9%) |
| 1 Vehicle | 762 (40.8%) | 3,103 (46.6%) |
| 2 Vehicles | 600 (32.1%) | 956 (14.3%) |
| 3 or more Vehicles | 163 (8.7%) | 76 (1.1%) |
| Total | 1,869 (100.0%) | 6,662 (100.0%) |
Real Estate & Mortgages in Harrison
Real Estate and Mortgage Overview in Harrison
| Characteristic | Without Mortgage | With Mortgage |
| Housing Units | 745 | 1,124 |
| Median Property Value | $405,200 | $452,100 |
| Median Household Income | $71,771 | $321 |
| Monthly Housing Costs | $1,246 | $402 |
| Real Estate Taxes | $9,935 | $4 |
Property Value by Mortgage Status in Harrison
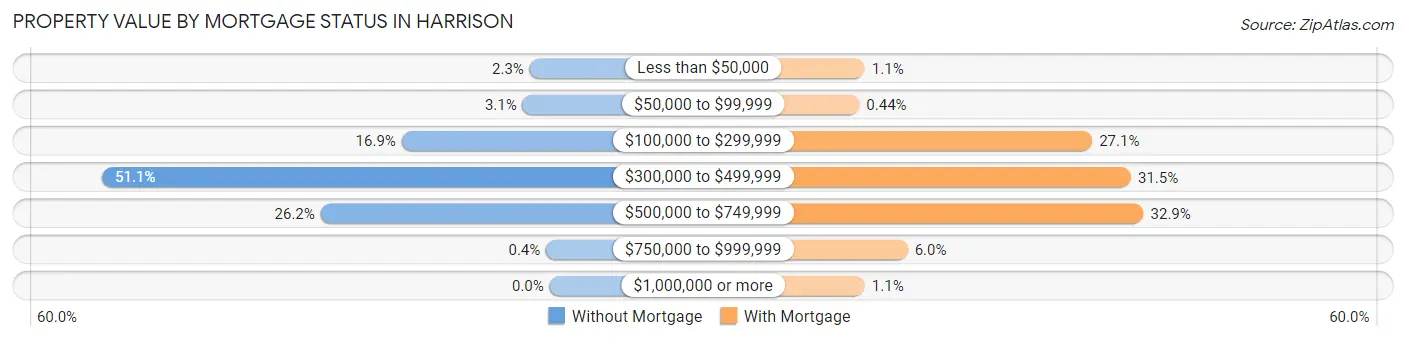
| Property Value | Without Mortgage | With Mortgage |
| Less than $50,000 | 17 (2.3%) | 12 (1.1%) |
| $50,000 to $99,999 | 23 (3.1%) | 5 (0.4%) |
| $100,000 to $299,999 | 126 (16.9%) | 304 (27.1%) |
| $300,000 to $499,999 | 381 (51.1%) | 354 (31.5%) |
| $500,000 to $749,999 | 195 (26.2%) | 370 (32.9%) |
| $750,000 to $999,999 | 3 (0.4%) | 67 (6.0%) |
| $1,000,000 or more | 0 (0.0%) | 12 (1.1%) |
| Total | 745 (100.0%) | 1,124 (100.0%) |
Household Income by Mortgage Status in Harrison
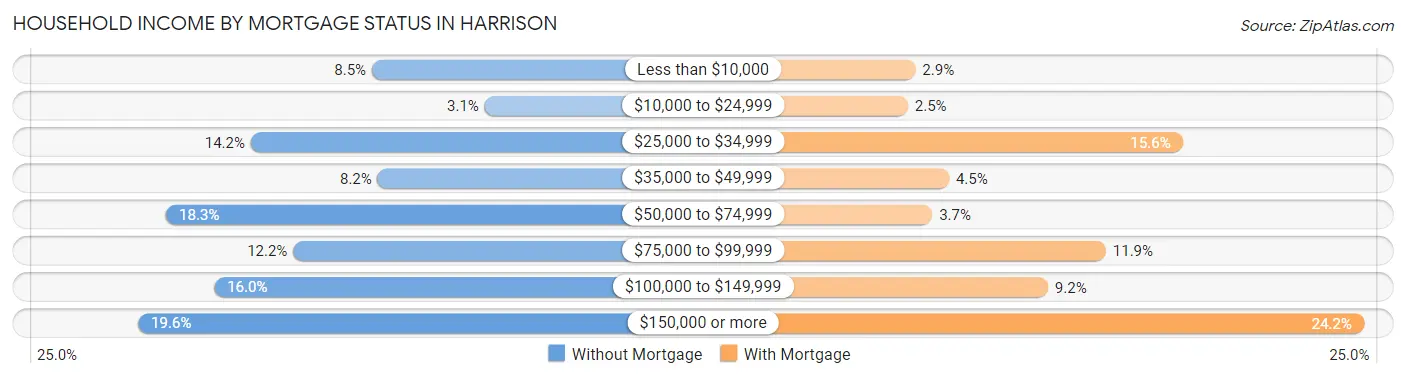
| Household Income | Without Mortgage | With Mortgage |
| Less than $10,000 | 63 (8.5%) | 32 (2.9%) |
| $10,000 to $24,999 | 23 (3.1%) | 28 (2.5%) |
| $25,000 to $34,999 | 106 (14.2%) | 175 (15.6%) |
| $35,000 to $49,999 | 61 (8.2%) | 50 (4.4%) |
| $50,000 to $74,999 | 136 (18.3%) | 41 (3.6%) |
| $75,000 to $99,999 | 91 (12.2%) | 134 (11.9%) |
| $100,000 to $149,999 | 119 (16.0%) | 103 (9.2%) |
| $150,000 or more | 146 (19.6%) | 272 (24.2%) |
| Total | 745 (100.0%) | 1,124 (100.0%) |
Property Value to Household Income Ratio in Harrison
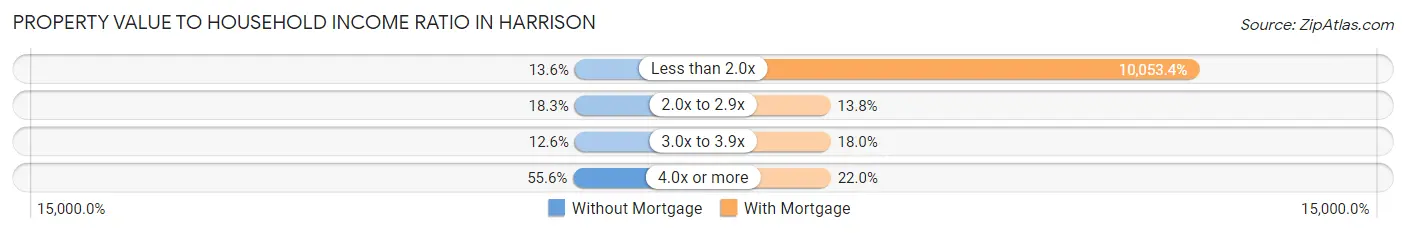
| Value-to-Income Ratio | Without Mortgage | With Mortgage |
| Less than 2.0x | 101 (13.6%) | 113,000 (10,053.4%) |
| 2.0x to 2.9x | 136 (18.3%) | 155 (13.8%) |
| 3.0x to 3.9x | 94 (12.6%) | 202 (18.0%) |
| 4.0x or more | 414 (55.6%) | 247 (22.0%) |
| Total | 745 (100.0%) | 1,124 (100.0%) |
Real Estate Taxes by Mortgage Status in Harrison
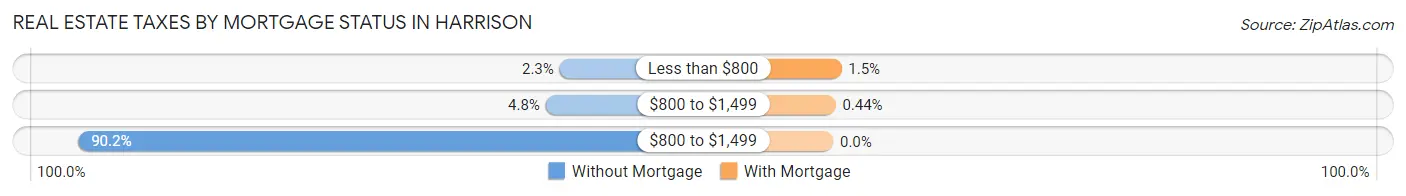
| Property Taxes | Without Mortgage | With Mortgage |
| Less than $800 | 17 (2.3%) | 17 (1.5%) |
| $800 to $1,499 | 36 (4.8%) | 5 (0.4%) |
| $800 to $1,499 | 672 (90.2%) | 0 (0.0%) |
| Total | 745 (100.0%) | 1,124 (100.0%) |
Health & Disability in Harrison
Health Insurance Coverage by Age in Harrison
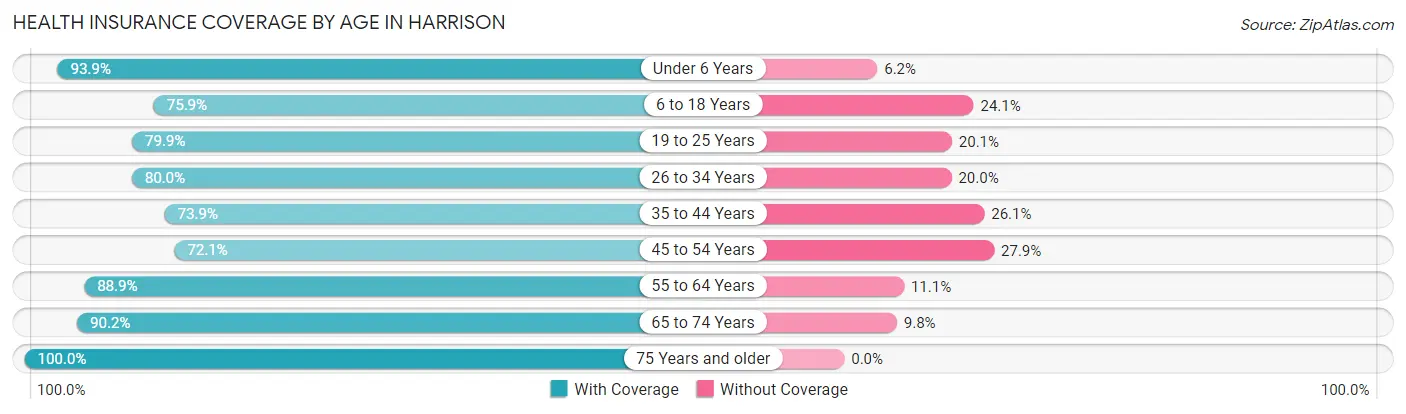
| Age Bracket | With Coverage | Without Coverage |
| Under 6 Years | 1,298 (93.9%) | 85 (6.1%) |
| 6 to 18 Years | 1,863 (75.9%) | 592 (24.1%) |
| 19 to 25 Years | 1,299 (79.9%) | 326 (20.1%) |
| 26 to 34 Years | 4,119 (80.0%) | 1,029 (20.0%) |
| 35 to 44 Years | 1,749 (73.9%) | 618 (26.1%) |
| 45 to 54 Years | 1,426 (72.1%) | 553 (27.9%) |
| 55 to 64 Years | 1,780 (88.9%) | 223 (11.1%) |
| 65 to 74 Years | 1,187 (90.2%) | 129 (9.8%) |
| 75 Years and older | 748 (100.0%) | 0 (0.0%) |
| Total | 15,469 (81.3%) | 3,555 (18.7%) |
Health Insurance Coverage by Citizenship Status in Harrison
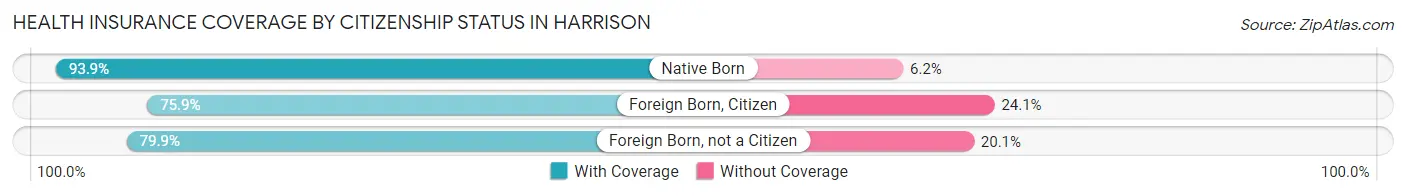
| Citizenship Status | With Coverage | Without Coverage |
| Native Born | 1,298 (93.9%) | 85 (6.1%) |
| Foreign Born, Citizen | 1,863 (75.9%) | 592 (24.1%) |
| Foreign Born, not a Citizen | 1,299 (79.9%) | 326 (20.1%) |
Health Insurance Coverage by Household Income in Harrison
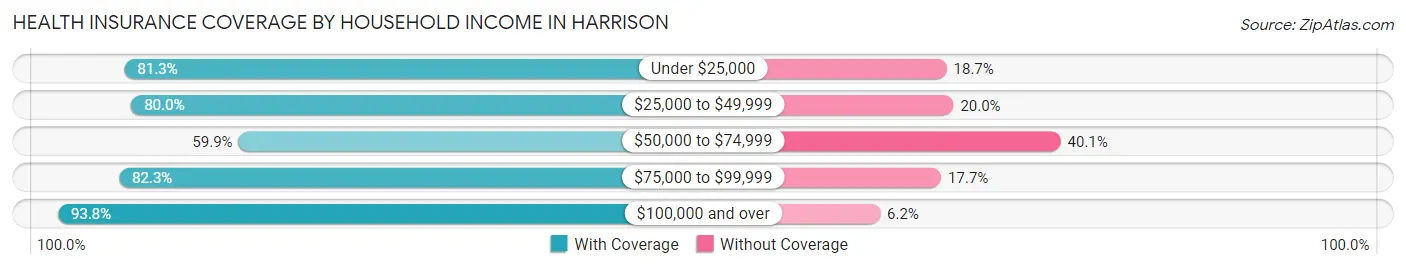
| Household Income | With Coverage | Without Coverage |
| Under $25,000 | 2,061 (81.3%) | 474 (18.7%) |
| $25,000 to $49,999 | 2,095 (80.0%) | 523 (20.0%) |
| $50,000 to $74,999 | 2,574 (59.9%) | 1,720 (40.1%) |
| $75,000 to $99,999 | 1,727 (82.3%) | 371 (17.7%) |
| $100,000 and over | 7,005 (93.8%) | 466 (6.2%) |
Public vs Private Health Insurance Coverage by Age in Harrison
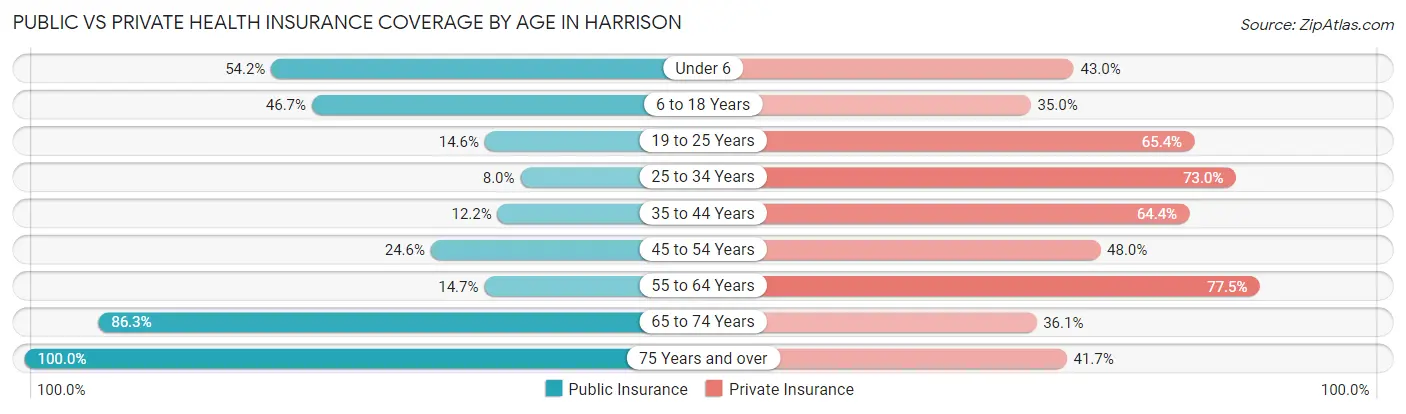
| Age Bracket | Public Insurance | Private Insurance |
| Under 6 | 750 (54.2%) | 595 (43.0%) |
| 6 to 18 Years | 1,146 (46.7%) | 860 (35.0%) |
| 19 to 25 Years | 237 (14.6%) | 1,062 (65.3%) |
| 25 to 34 Years | 411 (8.0%) | 3,759 (73.0%) |
| 35 to 44 Years | 289 (12.2%) | 1,525 (64.4%) |
| 45 to 54 Years | 487 (24.6%) | 949 (47.9%) |
| 55 to 64 Years | 294 (14.7%) | 1,552 (77.5%) |
| 65 to 74 Years | 1,136 (86.3%) | 475 (36.1%) |
| 75 Years and over | 748 (100.0%) | 312 (41.7%) |
| Total | 5,498 (28.9%) | 11,089 (58.3%) |
Disability Status by Sex by Age in Harrison
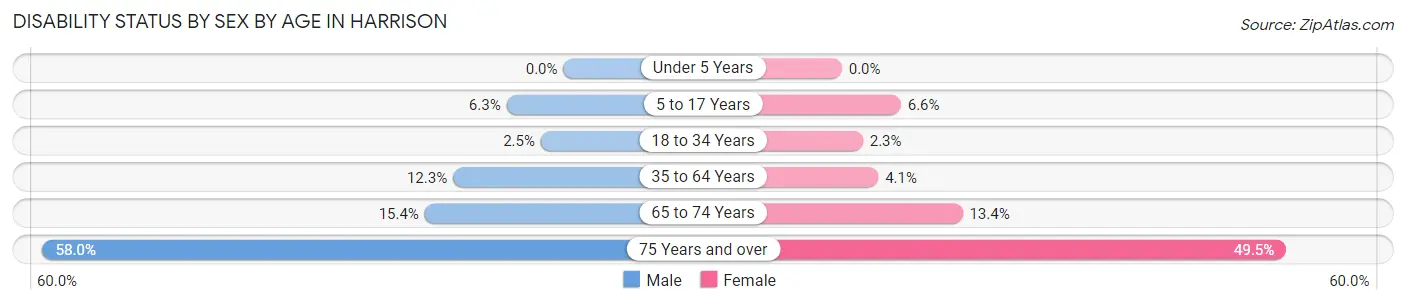
| Age Bracket | Male | Female |
| Under 5 Years | 0 (0.0%) | 0 (0.0%) |
| 5 to 17 Years | 79 (6.3%) | 84 (6.6%) |
| 18 to 34 Years | 97 (2.5%) | 71 (2.3%) |
| 35 to 64 Years | 408 (12.3%) | 123 (4.1%) |
| 65 to 74 Years | 101 (15.4%) | 89 (13.4%) |
| 75 Years and over | 156 (58.0%) | 237 (49.5%) |
Disability Class by Sex by Age in Harrison
Disability Class: Hearing Difficulty
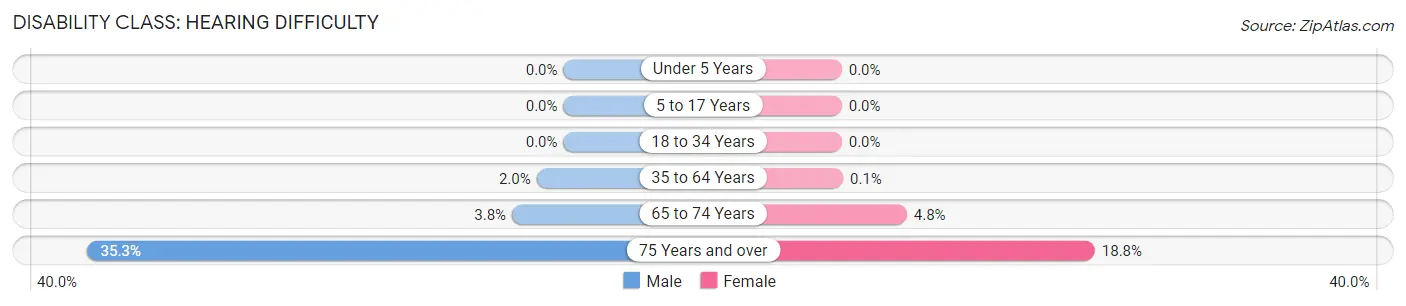
| Age Bracket | Male | Female |
| Under 5 Years | 0 (0.0%) | 0 (0.0%) |
| 5 to 17 Years | 0 (0.0%) | 0 (0.0%) |
| 18 to 34 Years | 0 (0.0%) | 0 (0.0%) |
| 35 to 64 Years | 66 (2.0%) | 3 (0.1%) |
| 65 to 74 Years | 25 (3.8%) | 32 (4.8%) |
| 75 Years and over | 95 (35.3%) | 90 (18.8%) |
Disability Class: Vision Difficulty
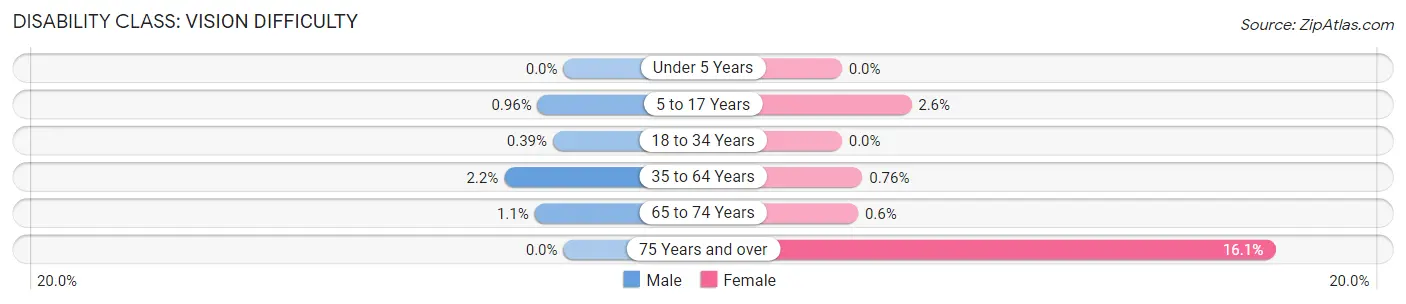
| Age Bracket | Male | Female |
| Under 5 Years | 0 (0.0%) | 0 (0.0%) |
| 5 to 17 Years | 12 (1.0%) | 33 (2.6%) |
| 18 to 34 Years | 15 (0.4%) | 0 (0.0%) |
| 35 to 64 Years | 73 (2.2%) | 23 (0.8%) |
| 65 to 74 Years | 7 (1.1%) | 4 (0.6%) |
| 75 Years and over | 0 (0.0%) | 77 (16.1%) |
Disability Class: Cognitive Difficulty
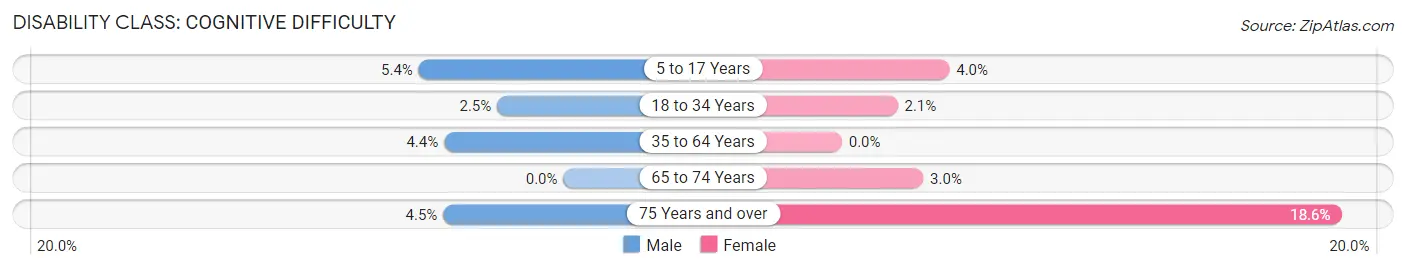
| Age Bracket | Male | Female |
| 5 to 17 Years | 67 (5.4%) | 51 (4.0%) |
| 18 to 34 Years | 95 (2.5%) | 63 (2.1%) |
| 35 to 64 Years | 147 (4.4%) | 0 (0.0%) |
| 65 to 74 Years | 0 (0.0%) | 20 (3.0%) |
| 75 Years and over | 12 (4.5%) | 89 (18.6%) |
Disability Class: Ambulatory Difficulty
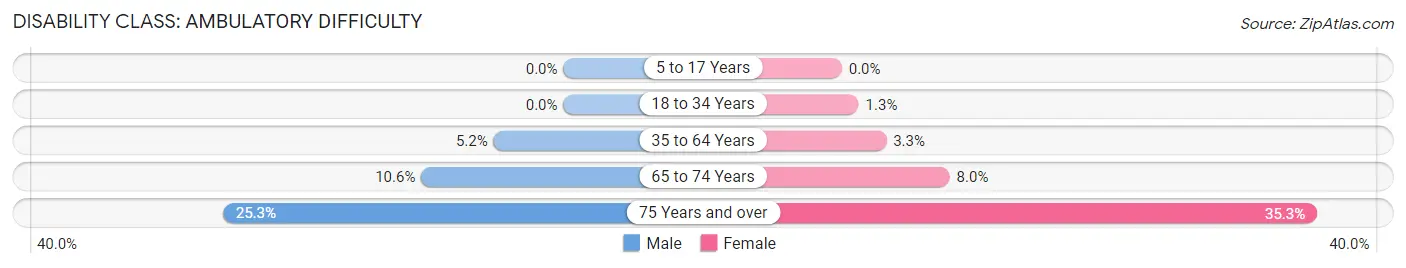
| Age Bracket | Male | Female |
| 5 to 17 Years | 0 (0.0%) | 0 (0.0%) |
| 18 to 34 Years | 0 (0.0%) | 38 (1.3%) |
| 35 to 64 Years | 172 (5.2%) | 100 (3.3%) |
| 65 to 74 Years | 69 (10.5%) | 53 (8.0%) |
| 75 Years and over | 68 (25.3%) | 169 (35.3%) |
Disability Class: Self-Care Difficulty
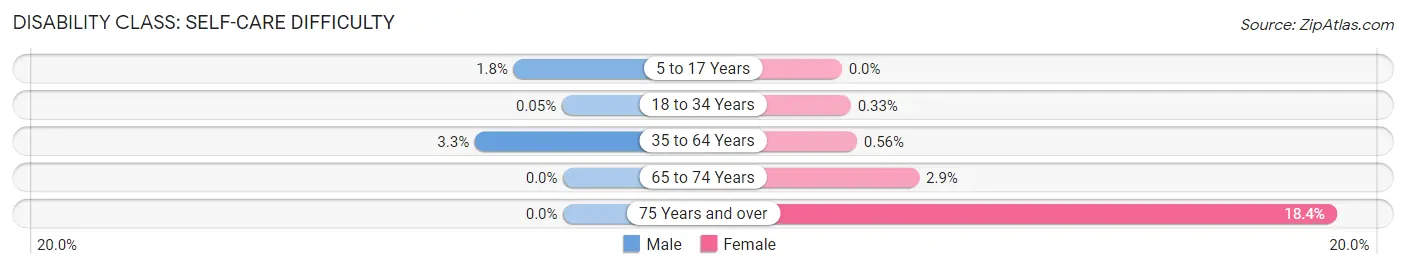
| Age Bracket | Male | Female |
| 5 to 17 Years | 23 (1.8%) | 0 (0.0%) |
| 18 to 34 Years | 2 (0.1%) | 10 (0.3%) |
| 35 to 64 Years | 109 (3.3%) | 17 (0.6%) |
| 65 to 74 Years | 0 (0.0%) | 19 (2.9%) |
| 75 Years and over | 0 (0.0%) | 88 (18.4%) |
Technology Access in Harrison
Computing Device Access in Harrison
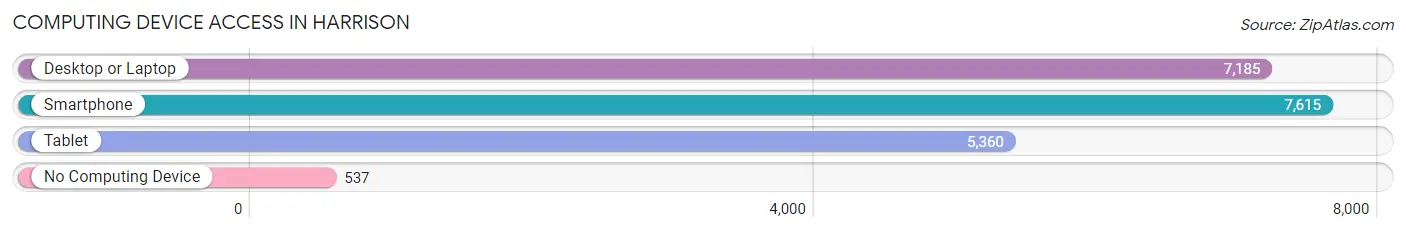
| Device Type | # Households | % Households |
| Desktop or Laptop | 7,185 | 84.2% |
| Smartphone | 7,615 | 89.3% |
| Tablet | 5,360 | 62.8% |
| No Computing Device | 537 | 6.3% |
| Total | 8,531 | 100.0% |
Internet Access in Harrison
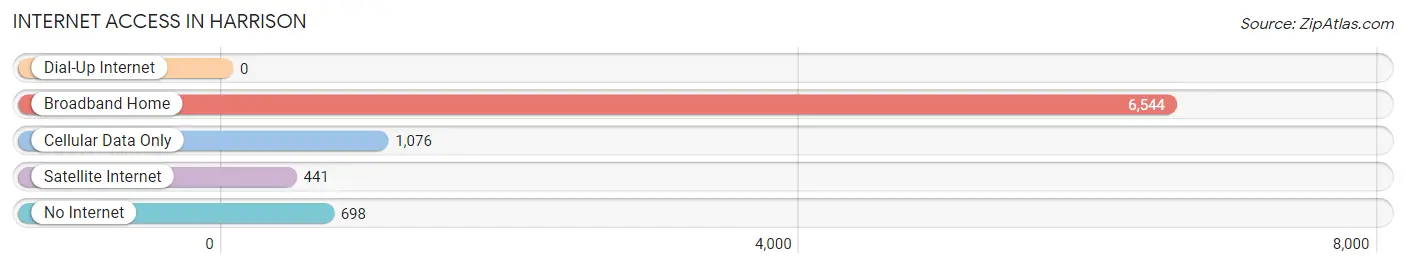
| Internet Type | # Households | % Households |
| Dial-Up Internet | 0 | 0.0% |
| Broadband Home | 6,544 | 76.7% |
| Cellular Data Only | 1,076 | 12.6% |
| Satellite Internet | 441 | 5.2% |
| No Internet | 698 | 8.2% |
| Total | 8,531 | 100.0% |
Harrison Summary
Harrison is a town located in Hudson County, New Jersey, United States. It is situated on the Passaic River, across from Newark. As of the 2010 United States Census, the town's population was 13,620, reflecting a decline of 810 (−5.6%) from the 14,430 counted in the 2000 Census, which had in turn increased by 1,591 (+12.3%) from the 12,839 counted in the 1990 Census.
History
Harrison was originally formed as a township by an act of the New Jersey Legislature on April 13, 1840, from portions of Newark Township. Portions of the township were taken on March 28, 1869, to form East Newark. Harrison was incorporated as a town on March 6, 1869, replacing the township. The area that is now Harrison was a part of a charter granted to Captain William Sandford of Barbados. Sandford sent his nephew, Major Nathanial Kingsland, to enter into an agreement for the purchase the land in the 1690s. In 1755, the area that is now Harrison, was called the "Meadow Lands".
Geography
Harrison is located at 40°45'37" North, 74°10'13" West (40.760278, -74.170317). According to the United States Census Bureau, the town had a total area of 1.319 square miles (3.419 km2), including 1.299 square miles (3.362 km2) of land and 0.020 square miles (0.057 km2) of water (1.51%).
The town borders the municipalities of East Newark and Kearny in Hudson County, and Newark in Essex County.
Economy
Harrison is home to a number of businesses, including the Red Bull Arena, a soccer stadium, and the Harrison PATH station, which provides access to New York City. The town is also home to a number of industrial and commercial businesses, including the Harrison Industrial Park, which is home to a number of manufacturing and distribution companies.
Demographics
As of the 2010 United States Census, there were 13,620 people, 5,541 households, and 3,541.9 families residing in the town. The population density was 10,521.3 per square mile (4,062.2/km2). There were 5,890 housing units at an average density of 4,541.2 per square mile (1,753.7/km2). The racial makeup of the town was 64.44% (8,817) White, 5.00% (678) Black or African American, 0.17% (23) Native American, 11.45% (1,556) Asian, 0.03% (4) Pacific Islander, 15.39% (2,097) from other races, and 3.51% (478) from two or more races. Hispanic or Latino of any race were 37.45% (5,072) of the population.
There were 5,541 households out of which 28.2% had children under the age of 18 living with them, 43.2% were married couples living together, 15.3% had a female householder with no husband present, and 35.3% were non-families. 28.7% of all households were made up of individuals, and 10.2% had someone living alone who was 65 years of age or older. The average household size was 2.45 and the average family size was 3.03.
In the town, the population was spread out with 20.9% under the age of 18, 9.2% from 18 to 24, 33.2% from 25 to 44, 24.2% from 45 to 64, and 12.5% who were 65 years of age or older. The median age was 36.4 years. For every 100 females there were 94.2 males. For every 100 females ages 18 and older there were 91.2 males.
The median income for a household in the town was $50,865, and the median income for a family was $60,871. Males had a median income of $41,180 versus $37,400 for females. The per capita income for the town was $26,913. About 8.7% of families and 10.9% of the population were below the poverty line, including 15.2% of those under age 18 and 9.0% of those age 65 or over.
Common Questions
What is Per Capita Income in Harrison?
Per Capita income in Harrison is $43,699.
What is the Median Family Income in Harrison?
Median Family Income in Harrison is $79,985.
What is the Median Household income in Harrison?
Median Household Income in Harrison is $72,773.
What is Income or Wage Gap in Harrison?
Income or Wage Gap in Harrison is 35.2%.
Women in Harrison earn 64.8 cents for every dollar earned by a man.
What is Family Income Deficit in Harrison?
Family Income Deficit in Harrison is $13,428.
Families that are below poverty line in Harrison earn $13,428 less on average than the poverty threshold level.
What is Inequality or Gini Index in Harrison?
Inequality or Gini Index in Harrison is 0.44.
What is the Total Population of Harrison?
Total Population of Harrison is 19,217.
What is the Total Male Population of Harrison?
Total Male Population of Harrison is 10,082.
What is the Total Female Population of Harrison?
Total Female Population of Harrison is 9,135.
What is the Ratio of Males per 100 Females in Harrison?
There are 110.37 Males per 100 Females in Harrison.
What is the Ratio of Females per 100 Males in Harrison?
There are 90.61 Females per 100 Males in Harrison.
What is the Median Population Age in Harrison?
Median Population Age in Harrison is 33.7 Years.
What is the Average Family Size in Harrison
Average Family Size in Harrison is 2.9 People.
What is the Average Household Size in Harrison
Average Household Size in Harrison is 2.2 People.
How Large is the Labor Force in Harrison?
There are 11,413 People in the Labor Forcein in Harrison.
What is the Percentage of People in the Labor Force in Harrison?
72.0% of People are in the Labor Force in Harrison.
What is the Unemployment Rate in Harrison?
Unemployment Rate in Harrison is 5.0%.