Plainfield, NJ Map & Demographics
Plainfield Map
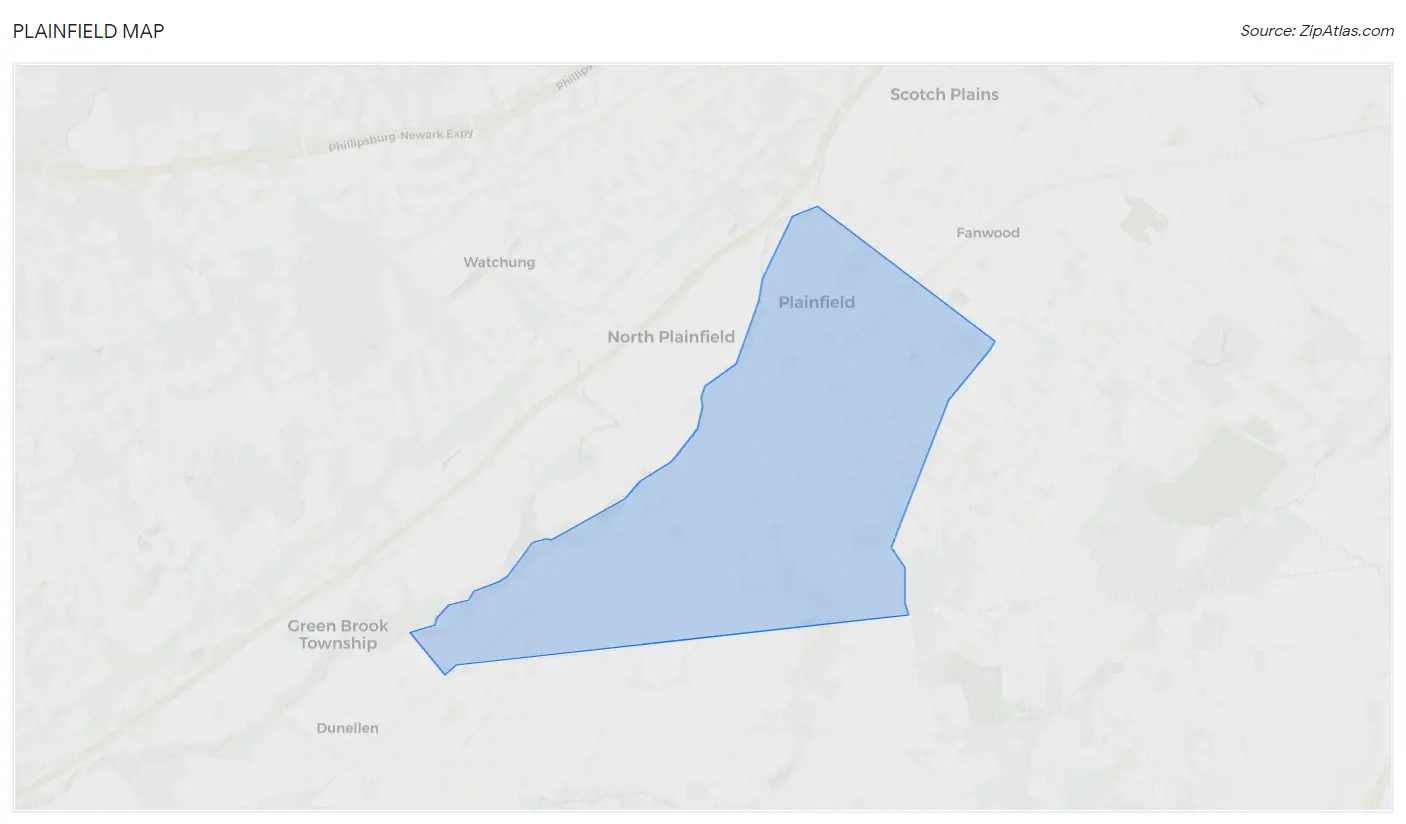
Plainfield Overview
$28,788
PER CAPITA INCOME
$74,415
AVG FAMILY INCOME
$70,712
AVG HOUSEHOLD INCOME
17.4%
WAGE / INCOME GAP [ % ]
82.6¢/ $1
WAGE / INCOME GAP [ $ ]
$9,868
FAMILY INCOME DEFICIT
0.42
INEQUALITY / GINI INDEX
54,358
TOTAL POPULATION
28,042
MALE POPULATION
26,316
FEMALE POPULATION
106.56
MALES / 100 FEMALES
93.84
FEMALES / 100 MALES
33.1
MEDIAN AGE
3.7
AVG FAMILY SIZE
3.2
AVG HOUSEHOLD SIZE
29,588
LABOR FORCE [ PEOPLE ]
72.1%
PERCENT IN LABOR FORCE
10.3%
UNEMPLOYMENT RATE
Income in Plainfield
Income Overview in Plainfield
Per Capita Income in Plainfield is $28,788, while median incomes of families and households are $74,415 and $70,712 respectively.
| Characteristic | Number | Measure |
| Per Capita Income | 54,358 | $28,788 |
| Median Family Income | 12,118 | $74,415 |
| Mean Family Income | 12,118 | $97,191 |
| Median Household Income | 16,459 | $70,712 |
| Mean Household Income | 16,459 | $92,401 |
| Income Deficit | 12,118 | $9,868 |
| Wage / Income Gap (%) | 54,358 | 17.39% |
| Wage / Income Gap ($) | 54,358 | 82.61¢ per $1 |
| Gini / Inequality Index | 54,358 | 0.42 |
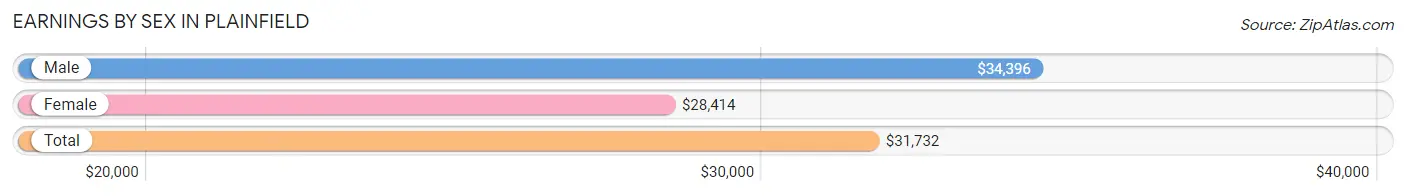
Earnings by Sex in Plainfield
Average Earnings in Plainfield are $31,732, $34,396 for men and $28,414 for women, a difference of 17.4%.
| Sex | Number | Average Earnings |
| Male | 15,737 (54.3%) | $34,396 |
| Female | 13,232 (45.7%) | $28,414 |
| Total | 28,969 (100.0%) | $31,732 |
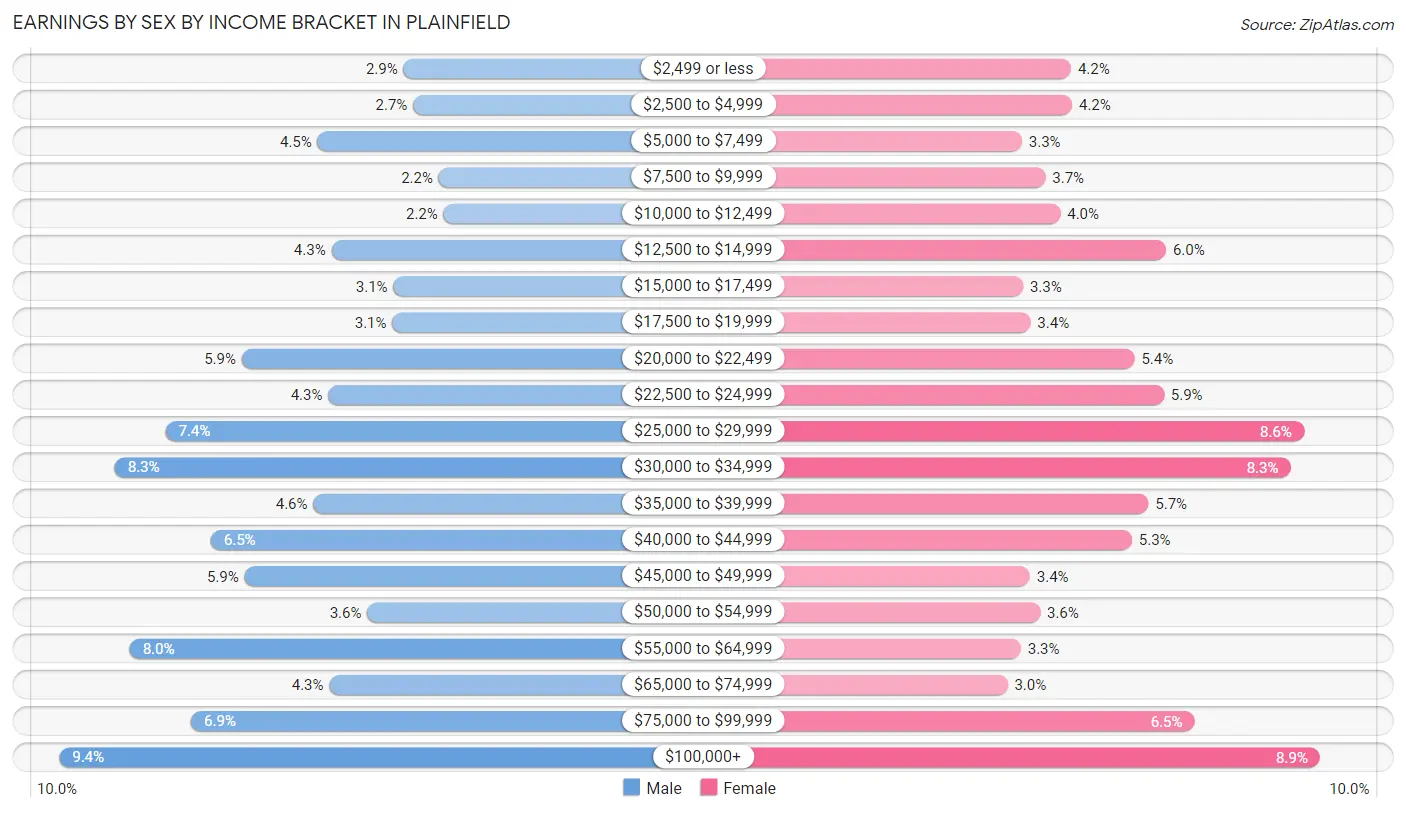
Earnings by Sex by Income Bracket in Plainfield
The most common earnings brackets in Plainfield are $100,000+ for men (1,472 | 9.3%) and $100,000+ for women (1,173 | 8.9%).
| Income | Male | Female |
| $2,499 or less | 456 (2.9%) | 556 (4.2%) |
| $2,500 to $4,999 | 428 (2.7%) | 558 (4.2%) |
| $5,000 to $7,499 | 710 (4.5%) | 434 (3.3%) |
| $7,500 to $9,999 | 352 (2.2%) | 492 (3.7%) |
| $10,000 to $12,499 | 338 (2.1%) | 529 (4.0%) |
| $12,500 to $14,999 | 669 (4.3%) | 791 (6.0%) |
| $15,000 to $17,499 | 487 (3.1%) | 437 (3.3%) |
| $17,500 to $19,999 | 490 (3.1%) | 455 (3.4%) |
| $20,000 to $22,499 | 933 (5.9%) | 713 (5.4%) |
| $22,500 to $24,999 | 679 (4.3%) | 786 (5.9%) |
| $25,000 to $29,999 | 1,158 (7.4%) | 1,132 (8.6%) |
| $30,000 to $34,999 | 1,307 (8.3%) | 1,099 (8.3%) |
| $35,000 to $39,999 | 723 (4.6%) | 747 (5.7%) |
| $40,000 to $44,999 | 1,024 (6.5%) | 707 (5.3%) |
| $45,000 to $49,999 | 925 (5.9%) | 454 (3.4%) |
| $50,000 to $54,999 | 564 (3.6%) | 479 (3.6%) |
| $55,000 to $64,999 | 1,264 (8.0%) | 431 (3.3%) |
| $65,000 to $74,999 | 675 (4.3%) | 398 (3.0%) |
| $75,000 to $99,999 | 1,083 (6.9%) | 861 (6.5%) |
| $100,000+ | 1,472 (9.3%) | 1,173 (8.9%) |
| Total | 15,737 (100.0%) | 13,232 (100.0%) |
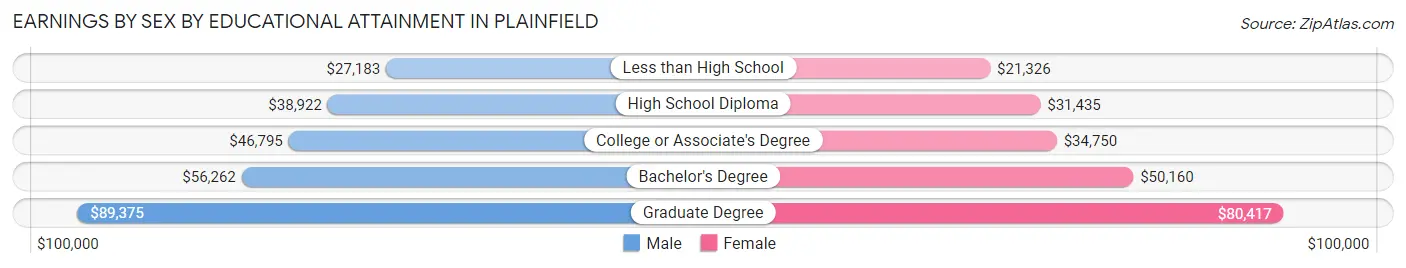
Earnings by Sex by Educational Attainment in Plainfield
Average earnings in Plainfield are $41,319 for men and $32,263 for women, a difference of 21.9%. Men with an educational attainment of graduate degree enjoy the highest average annual earnings of $89,375, while those with less than high school education earn the least with $27,183. Women with an educational attainment of graduate degree earn the most with the average annual earnings of $80,417, while those with less than high school education have the smallest earnings of $21,326.
| Educational Attainment | Male Income | Female Income |
| Less than High School | $27,183 | $21,326 |
| High School Diploma | $38,922 | $31,435 |
| College or Associate's Degree | $46,795 | $34,750 |
| Bachelor's Degree | $56,262 | $50,160 |
| Graduate Degree | $89,375 | $80,417 |
| Total | $41,319 | $32,263 |
Family Income in Plainfield
Family Income Brackets in Plainfield
According to the Plainfield family income data, there are 2,339 families falling into the $50,000 to $74,999 income range, which is the most common income bracket and makes up 19.3% of all families. Conversely, the $10,000 to $14,999 income bracket is the least frequent group with only 109 families (0.9%) belonging to this category.
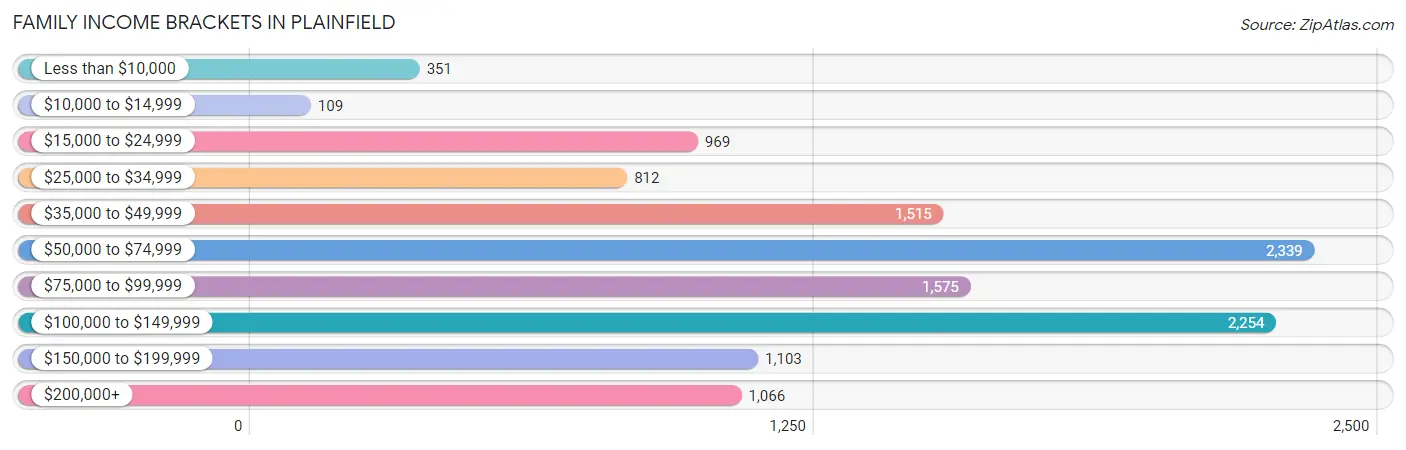
| Income Bracket | # Families | % Families |
| Less than $10,000 | 351 | 2.9% |
| $10,000 to $14,999 | 109 | 0.9% |
| $15,000 to $24,999 | 969 | 8.0% |
| $25,000 to $34,999 | 812 | 6.7% |
| $35,000 to $49,999 | 1,515 | 12.5% |
| $50,000 to $74,999 | 2,339 | 19.3% |
| $75,000 to $99,999 | 1,575 | 13.0% |
| $100,000 to $149,999 | 2,254 | 18.6% |
| $150,000 to $199,999 | 1,103 | 9.1% |
| $200,000+ | 1,066 | 8.8% |
Family Income by Famaliy Size in Plainfield
7+ person families (634 | 5.2%) account for the highest median family income in Plainfield with $119,769 per family, while 2-person families (3,849 | 31.8%) have the highest median income of $36,150 per family member.
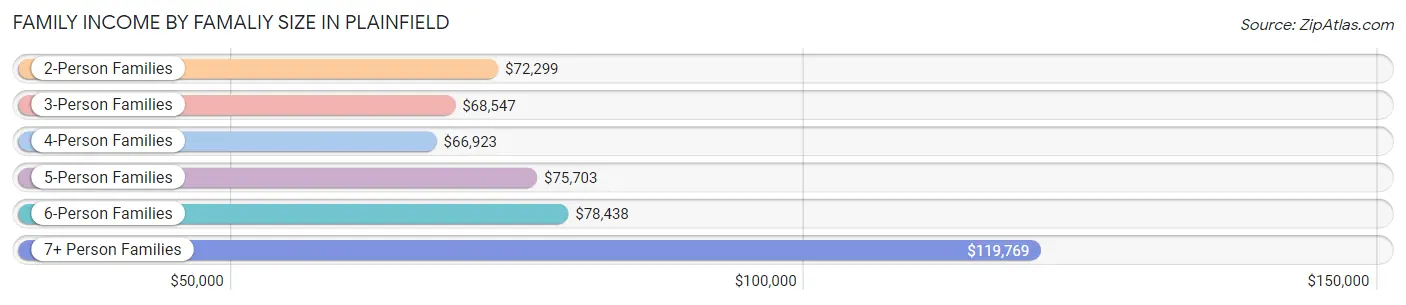
| Income Bracket | # Families | Median Income |
| 2-Person Families | 3,849 (31.8%) | $72,299 |
| 3-Person Families | 2,845 (23.5%) | $68,547 |
| 4-Person Families | 2,528 (20.9%) | $66,923 |
| 5-Person Families | 1,400 (11.6%) | $75,703 |
| 6-Person Families | 862 (7.1%) | $78,438 |
| 7+ Person Families | 634 (5.2%) | $119,769 |
| Total | 12,118 (100.0%) | $74,415 |
Family Income by Number of Earners in Plainfield
The median family income in Plainfield is $74,415, with families comprising 3+ earners (2,452) having the highest median family income of $122,262, while families with 1 earner (3,753) have the lowest median family income of $43,115, accounting for 20.2% and 31.0% of families, respectively.
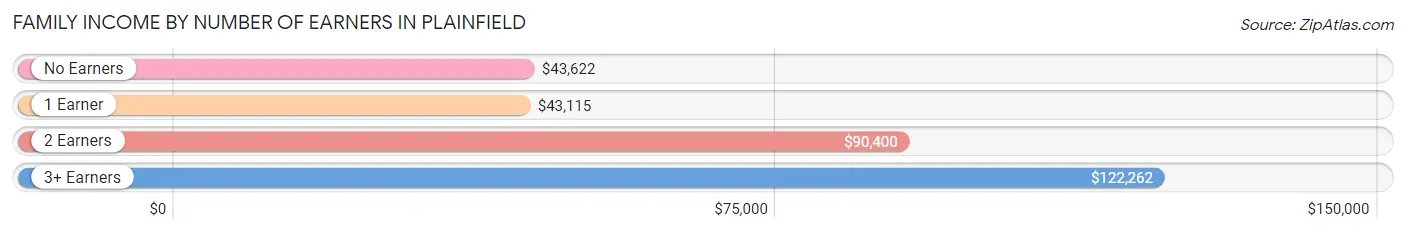
| Number of Earners | # Families | Median Income |
| No Earners | 861 (7.1%) | $43,622 |
| 1 Earner | 3,753 (31.0%) | $43,115 |
| 2 Earners | 5,052 (41.7%) | $90,400 |
| 3+ Earners | 2,452 (20.2%) | $122,262 |
| Total | 12,118 (100.0%) | $74,415 |
Household Income in Plainfield
Household Income Brackets in Plainfield
With 3,028 households falling in the category, the $50,000 to $74,999 income range is the most frequent in Plainfield, accounting for 18.4% of all households. In contrast, only 411 households (2.5%) fall into the $10,000 to $14,999 income bracket, making it the least populous group.
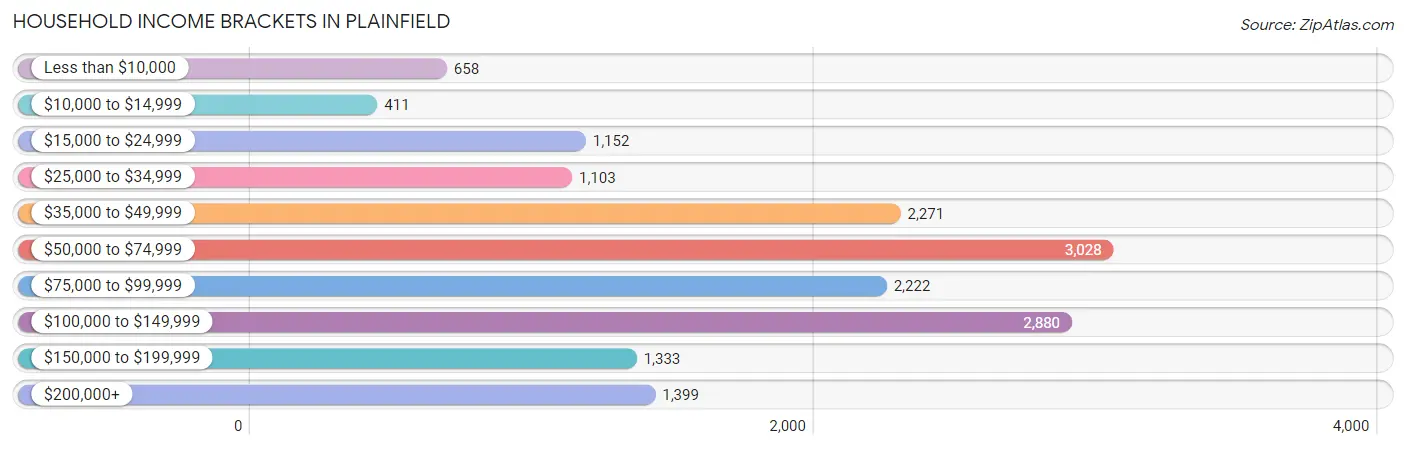
| Income Bracket | # Households | % Households |
| Less than $10,000 | 658 | 4.0% |
| $10,000 to $14,999 | 411 | 2.5% |
| $15,000 to $24,999 | 1,152 | 7.0% |
| $25,000 to $34,999 | 1,103 | 6.7% |
| $35,000 to $49,999 | 2,271 | 13.8% |
| $50,000 to $74,999 | 3,028 | 18.4% |
| $75,000 to $99,999 | 2,222 | 13.5% |
| $100,000 to $149,999 | 2,880 | 17.5% |
| $150,000 to $199,999 | 1,333 | 8.1% |
| $200,000+ | 1,399 | 8.5% |
Household Income by Householder Age in Plainfield
The median household income in Plainfield is $70,712, with the highest median household income of $94,293 found in the 45 to 64 years age bracket for the primary householder. A total of 6,126 households (37.2%) fall into this category. Meanwhile, the 15 to 24 years age bracket for the primary householder has the lowest median household income of $50,984, with 401 households (2.4%) in this group.
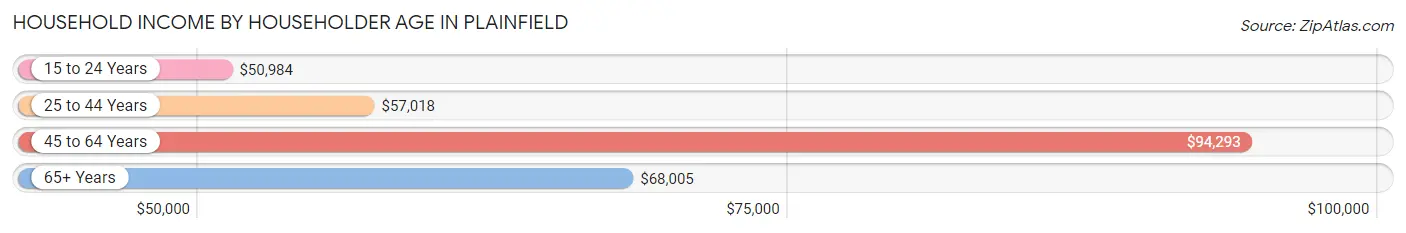
| Income Bracket | # Households | Median Income |
| 15 to 24 Years | 401 (2.4%) | $50,984 |
| 25 to 44 Years | 6,325 (38.4%) | $57,018 |
| 45 to 64 Years | 6,126 (37.2%) | $94,293 |
| 65+ Years | 3,607 (21.9%) | $68,005 |
| Total | 16,459 (100.0%) | $70,712 |
Poverty in Plainfield
Income Below Poverty by Sex and Age in Plainfield
With 17.9% poverty level for males and 19.3% for females among the residents of Plainfield, 15 year old males and 5 year old females are the most vulnerable to poverty, with 135 males (45.8%) and 78 females (35.9%) in their respective age groups living below the poverty level.
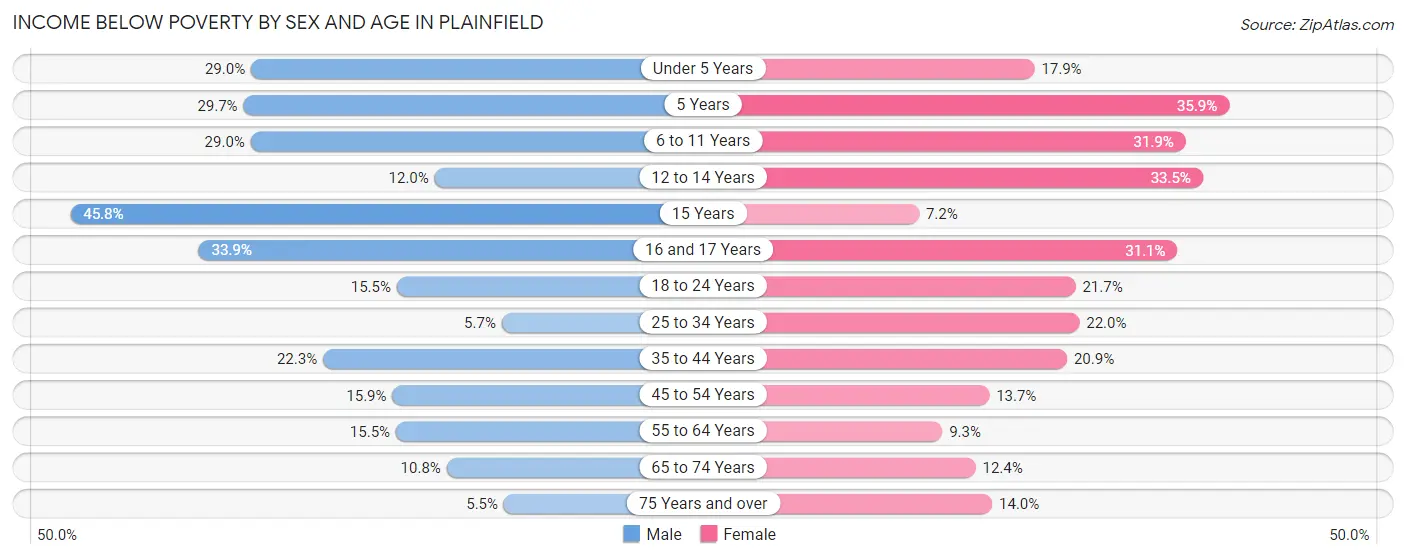
| Age Bracket | Male | Female |
| Under 5 Years | 563 (29.0%) | 349 (17.9%) |
| 5 Years | 223 (29.7%) | 78 (35.9%) |
| 6 to 11 Years | 809 (29.0%) | 687 (31.9%) |
| 12 to 14 Years | 143 (11.9%) | 354 (33.5%) |
| 15 Years | 135 (45.8%) | 32 (7.2%) |
| 16 and 17 Years | 307 (33.9%) | 237 (31.1%) |
| 18 to 24 Years | 459 (15.5%) | 550 (21.7%) |
| 25 to 34 Years | 252 (5.7%) | 842 (22.0%) |
| 35 to 44 Years | 907 (22.3%) | 718 (20.9%) |
| 45 to 54 Years | 492 (15.9%) | 476 (13.7%) |
| 55 to 64 Years | 421 (15.5%) | 272 (9.3%) |
| 65 to 74 Years | 179 (10.8%) | 236 (12.4%) |
| 75 Years and over | 45 (5.5%) | 174 (14.0%) |
| Total | 4,935 (17.9%) | 5,005 (19.3%) |
Income Above Poverty by Sex and Age in Plainfield
According to the poverty statistics in Plainfield, males aged 75 years and over and females aged 15 years are the age groups that are most secure financially, with 94.5% of males and 92.8% of females in these age groups living above the poverty line.
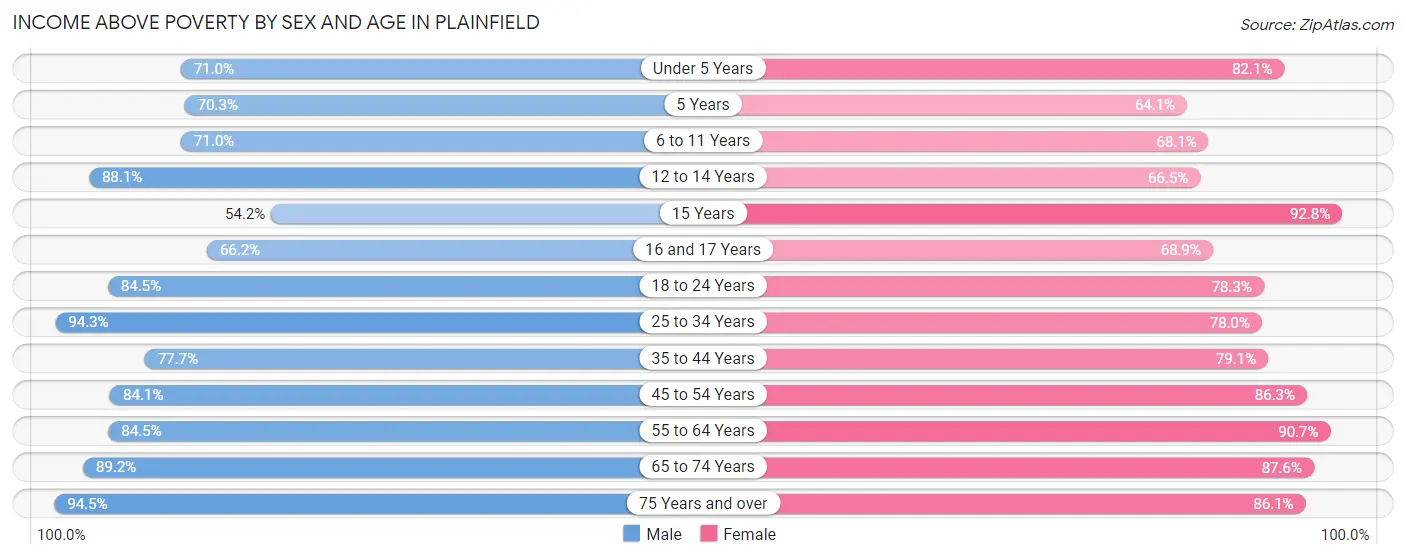
| Age Bracket | Male | Female |
| Under 5 Years | 1,379 (71.0%) | 1,603 (82.1%) |
| 5 Years | 528 (70.3%) | 139 (64.1%) |
| 6 to 11 Years | 1,979 (71.0%) | 1,466 (68.1%) |
| 12 to 14 Years | 1,054 (88.0%) | 703 (66.5%) |
| 15 Years | 160 (54.2%) | 415 (92.8%) |
| 16 and 17 Years | 600 (66.1%) | 524 (68.9%) |
| 18 to 24 Years | 2,509 (84.5%) | 1,986 (78.3%) |
| 25 to 34 Years | 4,151 (94.3%) | 2,979 (78.0%) |
| 35 to 44 Years | 3,158 (77.7%) | 2,717 (79.1%) |
| 45 to 54 Years | 2,608 (84.1%) | 3,003 (86.3%) |
| 55 to 64 Years | 2,288 (84.5%) | 2,645 (90.7%) |
| 65 to 74 Years | 1,474 (89.2%) | 1,665 (87.6%) |
| 75 Years and over | 770 (94.5%) | 1,073 (86.1%) |
| Total | 22,658 (82.1%) | 20,918 (80.7%) |
Income Below Poverty Among Married-Couple Families in Plainfield
The poverty statistics for married-couple families in Plainfield show that 8.8% or 595 of the total 6,774 families live below the poverty line. Families with 5 or more children have the highest poverty rate of 51.1%, comprising of 48 families. On the other hand, families with no children have the lowest poverty rate of 3.7%, which includes 127 families.
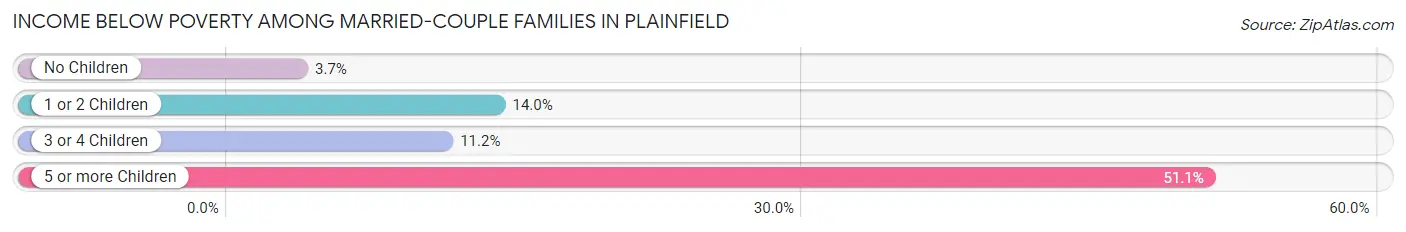
| Children | Above Poverty | Below Poverty |
| No Children | 3,343 (96.3%) | 127 (3.7%) |
| 1 or 2 Children | 1,866 (86.0%) | 303 (14.0%) |
| 3 or 4 Children | 924 (88.8%) | 117 (11.2%) |
| 5 or more Children | 46 (48.9%) | 48 (51.1%) |
| Total | 6,179 (91.2%) | 595 (8.8%) |
Income Below Poverty Among Single-Parent Households in Plainfield
According to the poverty data in Plainfield, 20.0% or 399 single-father households and 21.4% or 717 single-mother households are living below the poverty line. Among single-father households, those with 5 or more children have the highest poverty rate, with 25 households (100.0%) experiencing poverty. Likewise, among single-mother households, those with 5 or more children have the highest poverty rate, with 21 households (65.6%) falling below the poverty line.
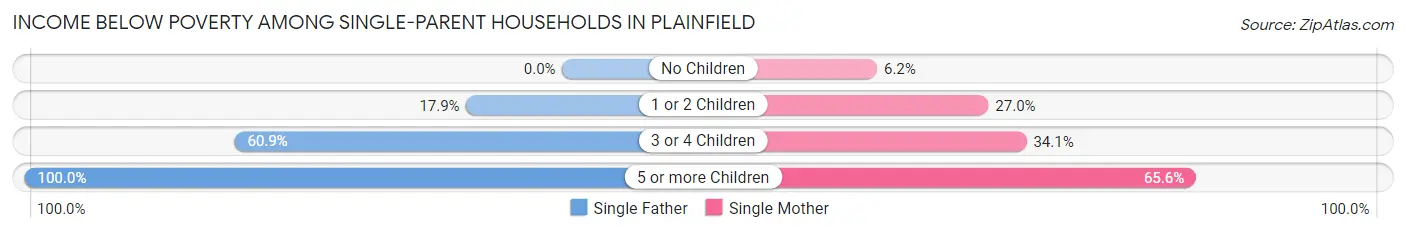
| Children | Single Father | Single Mother |
| No Children | 0 (0.0%) | 71 (6.2%) |
| 1 or 2 Children | 173 (17.9%) | 436 (27.0%) |
| 3 or 4 Children | 201 (60.9%) | 189 (34.1%) |
| 5 or more Children | 25 (100.0%) | 21 (65.6%) |
| Total | 399 (20.0%) | 717 (21.4%) |
Income Below Poverty Among Married-Couple vs Single-Parent Households in Plainfield
The poverty data for Plainfield shows that 595 of the married-couple family households (8.8%) and 1,116 of the single-parent households (20.9%) are living below the poverty level. Within the married-couple family households, those with 5 or more children have the highest poverty rate, with 48 households (51.1%) falling below the poverty line. Among the single-parent households, those with 5 or more children have the highest poverty rate, with 46 household (80.7%) living below poverty.
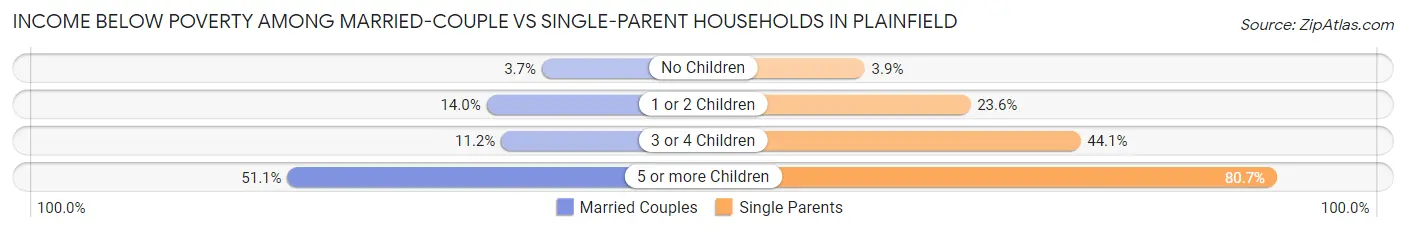
| Children | Married-Couple Families | Single-Parent Households |
| No Children | 127 (3.7%) | 71 (3.9%) |
| 1 or 2 Children | 303 (14.0%) | 609 (23.6%) |
| 3 or 4 Children | 117 (11.2%) | 390 (44.1%) |
| 5 or more Children | 48 (51.1%) | 46 (80.7%) |
| Total | 595 (8.8%) | 1,116 (20.9%) |
Race in Plainfield
The most populous races in Plainfield are Hispanic or Latino (28,460 | 52.4%), Some other Race (22,359 | 41.1%), and Black / African American (19,508 | 35.9%).
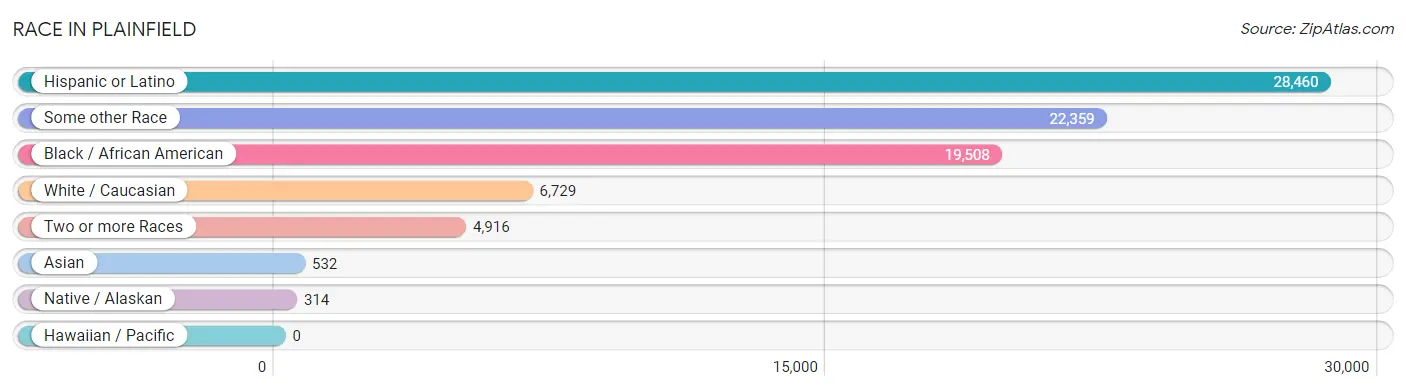
| Race | # Population | % Population |
| Asian | 532 | 1.0% |
| Black / African American | 19,508 | 35.9% |
| Hawaiian / Pacific | 0 | 0.0% |
| Hispanic or Latino | 28,460 | 52.4% |
| Native / Alaskan | 314 | 0.6% |
| White / Caucasian | 6,729 | 12.4% |
| Two or more Races | 4,916 | 9.0% |
| Some other Race | 22,359 | 41.1% |
| Total | 54,358 | 100.0% |
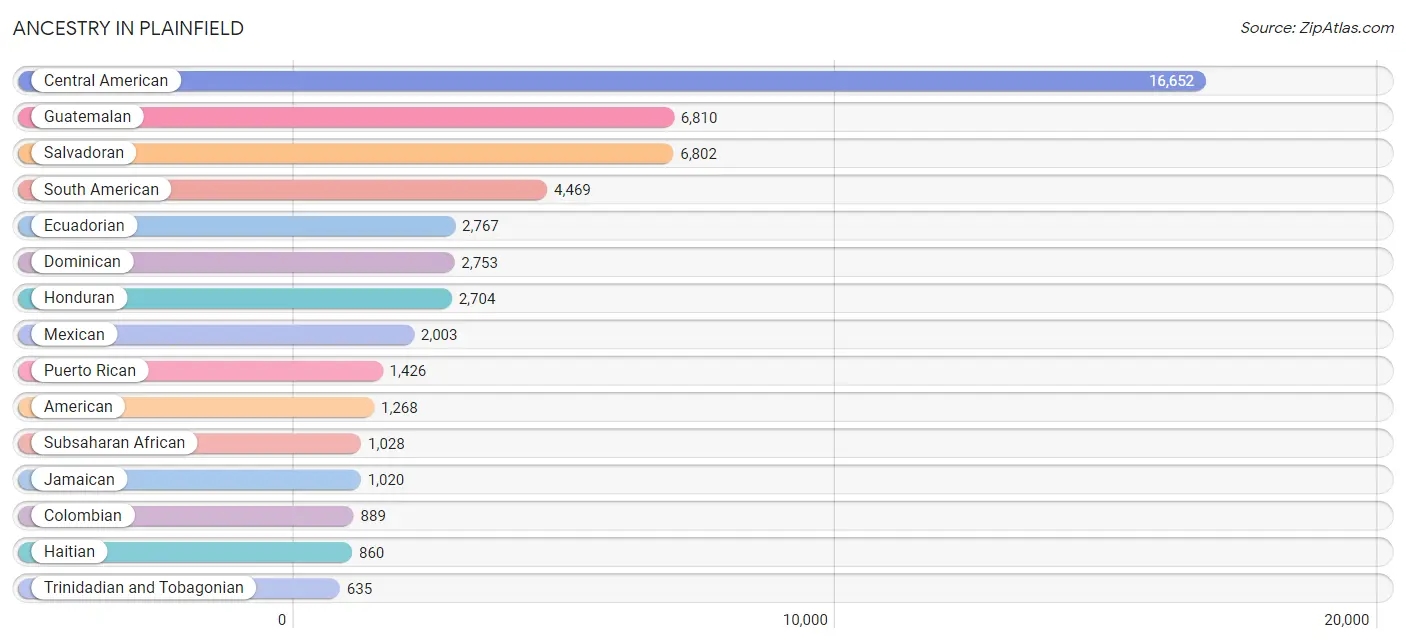
Ancestry in Plainfield
The most populous ancestries reported in Plainfield are Central American (16,652 | 30.6%), Guatemalan (6,810 | 12.5%), Salvadoran (6,802 | 12.5%), South American (4,469 | 8.2%), and Ecuadorian (2,767 | 5.1%), together accounting for 69.0% of all Plainfield residents.
| Ancestry | # Population | % Population |
| African | 587 | 1.1% |
| American | 1,268 | 2.3% |
| Arab | 188 | 0.4% |
| Argentinean | 20 | 0.0% |
| Austrian | 38 | 0.1% |
| Barbadian | 186 | 0.3% |
| Blackfeet | 39 | 0.1% |
| Brazilian | 129 | 0.2% |
| British | 104 | 0.2% |
| British West Indian | 229 | 0.4% |
| Burmese | 7 | 0.0% |
| Central American | 16,652 | 30.6% |
| Central American Indian | 493 | 0.9% |
| Cherokee | 26 | 0.1% |
| Chilean | 69 | 0.1% |
| Choctaw | 9 | 0.0% |
| Colombian | 889 | 1.6% |
| Costa Rican | 72 | 0.1% |
| Creek | 13 | 0.0% |
| Cuban | 318 | 0.6% |
| Czech | 15 | 0.0% |
| Czechoslovakian | 31 | 0.1% |
| Danish | 17 | 0.0% |
| Dominican | 2,753 | 5.1% |
| Dutch | 48 | 0.1% |
| Eastern European | 58 | 0.1% |
| Ecuadorian | 2,767 | 5.1% |
| English | 416 | 0.8% |
| European | 27 | 0.1% |
| Finnish | 9 | 0.0% |
| French | 37 | 0.1% |
| French Canadian | 37 | 0.1% |
| German | 512 | 0.9% |
| Ghanaian | 91 | 0.2% |
| Greek | 66 | 0.1% |
| Guatemalan | 6,810 | 12.5% |
| Guyanese | 261 | 0.5% |
| Haitian | 860 | 1.6% |
| Honduran | 2,704 | 5.0% |
| Hungarian | 166 | 0.3% |
| Indian (Asian) | 1 | 0.0% |
| Iranian | 43 | 0.1% |
| Irish | 478 | 0.9% |
| Italian | 629 | 1.2% |
| Jamaican | 1,020 | 1.9% |
| Kenyan | 48 | 0.1% |
| Korean | 242 | 0.4% |
| Laotian | 7 | 0.0% |
| Lebanese | 44 | 0.1% |
| Lithuanian | 22 | 0.0% |
| Maltese | 31 | 0.1% |
| Mexican | 2,003 | 3.7% |
| Mexican American Indian | 111 | 0.2% |
| Nicaraguan | 110 | 0.2% |
| Nigerian | 189 | 0.4% |
| Norwegian | 70 | 0.1% |
| Palestinian | 53 | 0.1% |
| Panamanian | 154 | 0.3% |
| Peruvian | 476 | 0.9% |
| Polish | 219 | 0.4% |
| Portuguese | 171 | 0.3% |
| Puerto Rican | 1,426 | 2.6% |
| Romanian | 32 | 0.1% |
| Russian | 17 | 0.0% |
| Salvadoran | 6,802 | 12.5% |
| Scotch-Irish | 59 | 0.1% |
| Scottish | 55 | 0.1% |
| Senegalese | 8 | 0.0% |
| Slovak | 35 | 0.1% |
| South African | 11 | 0.0% |
| South American | 4,469 | 8.2% |
| South American Indian | 49 | 0.1% |
| Spaniard | 30 | 0.1% |
| Spanish | 25 | 0.1% |
| Subsaharan African | 1,028 | 1.9% |
| Syrian | 76 | 0.1% |
| Thai | 117 | 0.2% |
| Trinidadian and Tobagonian | 635 | 1.2% |
| Ukrainian | 24 | 0.0% |
| Venezuelan | 248 | 0.5% |
| Welsh | 7 | 0.0% |
| West Indian | 520 | 1.0% | View All 82 Rows |
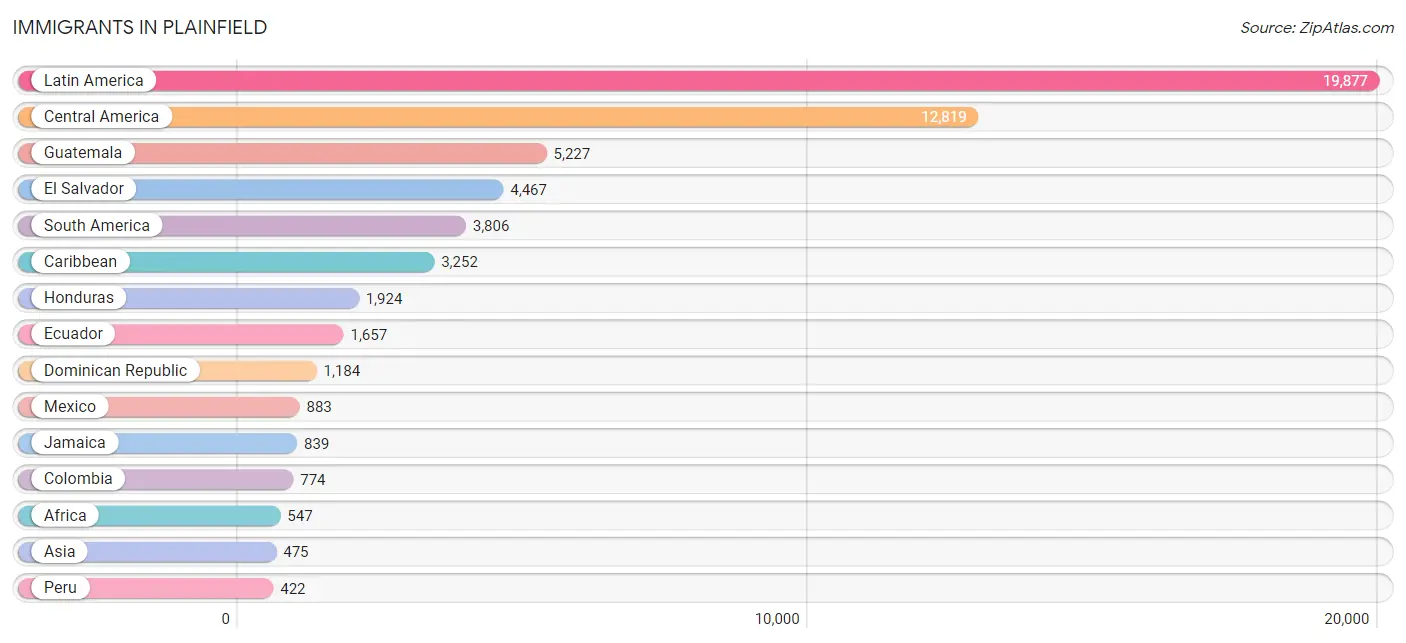
Immigrants in Plainfield
The most numerous immigrant groups reported in Plainfield came from Latin America (19,877 | 36.6%), Central America (12,819 | 23.6%), Guatemala (5,227 | 9.6%), El Salvador (4,467 | 8.2%), and South America (3,806 | 7.0%), together accounting for 85.0% of all Plainfield residents.
| Immigration Origin | # Population | % Population |
| Africa | 547 | 1.0% |
| Argentina | 61 | 0.1% |
| Asia | 475 | 0.9% |
| Barbados | 275 | 0.5% |
| Brazil | 187 | 0.3% |
| Canada | 25 | 0.1% |
| Caribbean | 3,252 | 6.0% |
| Central America | 12,819 | 23.6% |
| Chile | 46 | 0.1% |
| China | 1 | 0.0% |
| Colombia | 774 | 1.4% |
| Costa Rica | 59 | 0.1% |
| Cuba | 67 | 0.1% |
| Dominica | 26 | 0.1% |
| Dominican Republic | 1,184 | 2.2% |
| Eastern Africa | 117 | 0.2% |
| Eastern Asia | 8 | 0.0% |
| Eastern Europe | 85 | 0.2% |
| Ecuador | 1,657 | 3.0% |
| Egypt | 14 | 0.0% |
| El Salvador | 4,467 | 8.2% |
| England | 40 | 0.1% |
| Europe | 417 | 0.8% |
| Germany | 18 | 0.0% |
| Ghana | 176 | 0.3% |
| Greece | 45 | 0.1% |
| Grenada | 42 | 0.1% |
| Guatemala | 5,227 | 9.6% |
| Guyana | 403 | 0.7% |
| Haiti | 240 | 0.4% |
| Honduras | 1,924 | 3.5% |
| India | 75 | 0.1% |
| Indonesia | 2 | 0.0% |
| Italy | 1 | 0.0% |
| Jamaica | 839 | 1.5% |
| Kenya | 26 | 0.1% |
| Korea | 7 | 0.0% |
| Latin America | 19,877 | 36.6% |
| Liberia | 14 | 0.0% |
| Mexico | 883 | 1.6% |
| Middle Africa | 11 | 0.0% |
| Nicaragua | 96 | 0.2% |
| Nigeria | 180 | 0.3% |
| Northern Africa | 14 | 0.0% |
| Northern Europe | 70 | 0.1% |
| Pakistan | 162 | 0.3% |
| Panama | 163 | 0.3% |
| Peru | 422 | 0.8% |
| Philippines | 125 | 0.2% |
| Poland | 28 | 0.1% |
| Portugal | 56 | 0.1% |
| Russia | 24 | 0.0% |
| Senegal | 8 | 0.0% |
| South Africa | 11 | 0.0% |
| South America | 3,806 | 7.0% |
| South Central Asia | 262 | 0.5% |
| South Eastern Asia | 127 | 0.2% |
| Southern Europe | 244 | 0.4% |
| Spain | 111 | 0.2% |
| Syria | 67 | 0.1% |
| Trinidad and Tobago | 351 | 0.6% |
| Ukraine | 1 | 0.0% |
| Uzbekistan | 25 | 0.1% |
| Venezuela | 209 | 0.4% |
| West Indies | 62 | 0.1% |
| Western Africa | 380 | 0.7% |
| Western Asia | 67 | 0.1% |
| Western Europe | 18 | 0.0% |
| Zimbabwe | 66 | 0.1% | View All 69 Rows |
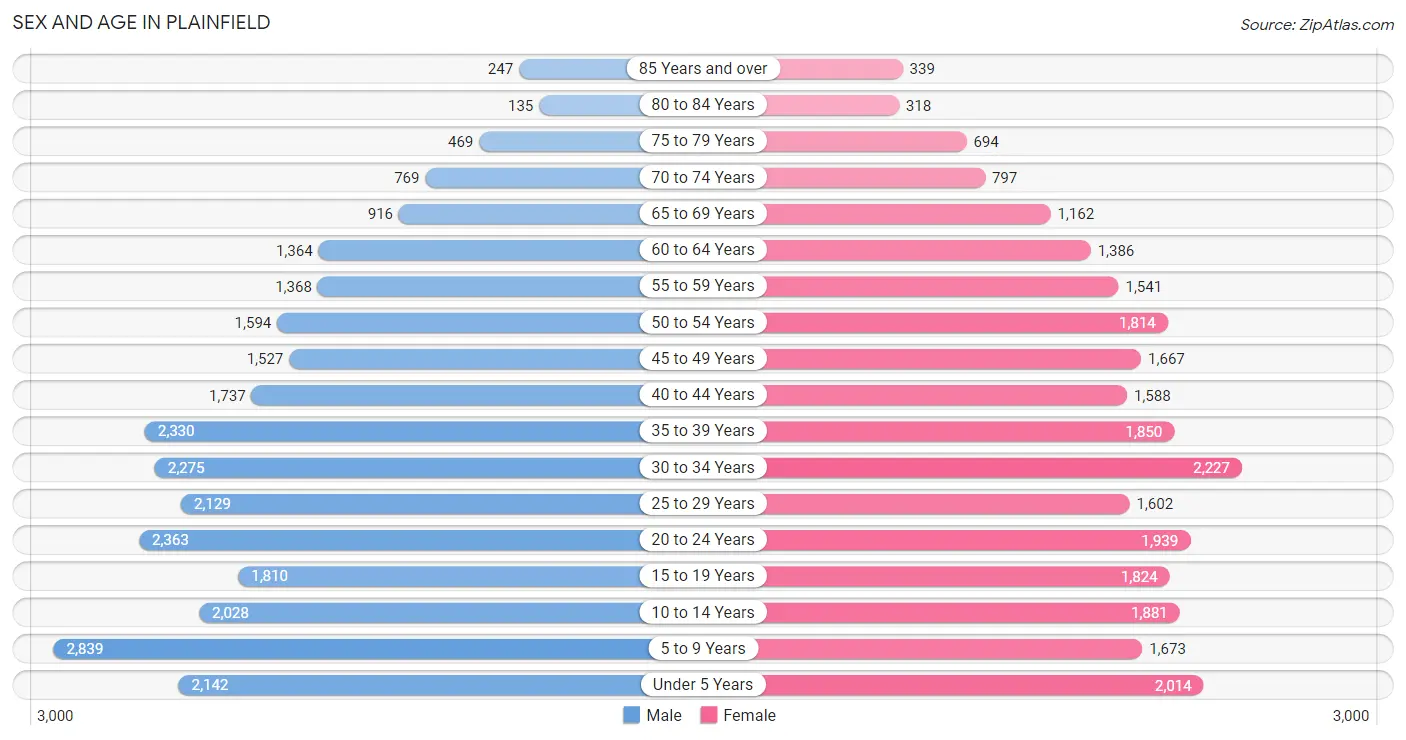
Sex and Age in Plainfield
Sex and Age in Plainfield
The most populous age groups in Plainfield are 5 to 9 Years (2,839 | 10.1%) for men and 30 to 34 Years (2,227 | 8.5%) for women.
| Age Bracket | Male | Female |
| Under 5 Years | 2,142 (7.6%) | 2,014 (7.6%) |
| 5 to 9 Years | 2,839 (10.1%) | 1,673 (6.4%) |
| 10 to 14 Years | 2,028 (7.2%) | 1,881 (7.1%) |
| 15 to 19 Years | 1,810 (6.5%) | 1,824 (6.9%) |
| 20 to 24 Years | 2,363 (8.4%) | 1,939 (7.4%) |
| 25 to 29 Years | 2,129 (7.6%) | 1,602 (6.1%) |
| 30 to 34 Years | 2,275 (8.1%) | 2,227 (8.5%) |
| 35 to 39 Years | 2,330 (8.3%) | 1,850 (7.0%) |
| 40 to 44 Years | 1,737 (6.2%) | 1,588 (6.0%) |
| 45 to 49 Years | 1,527 (5.4%) | 1,667 (6.3%) |
| 50 to 54 Years | 1,594 (5.7%) | 1,814 (6.9%) |
| 55 to 59 Years | 1,368 (4.9%) | 1,541 (5.9%) |
| 60 to 64 Years | 1,364 (4.9%) | 1,386 (5.3%) |
| 65 to 69 Years | 916 (3.3%) | 1,162 (4.4%) |
| 70 to 74 Years | 769 (2.7%) | 797 (3.0%) |
| 75 to 79 Years | 469 (1.7%) | 694 (2.6%) |
| 80 to 84 Years | 135 (0.5%) | 318 (1.2%) |
| 85 Years and over | 247 (0.9%) | 339 (1.3%) |
| Total | 28,042 (100.0%) | 26,316 (100.0%) |
Families and Households in Plainfield
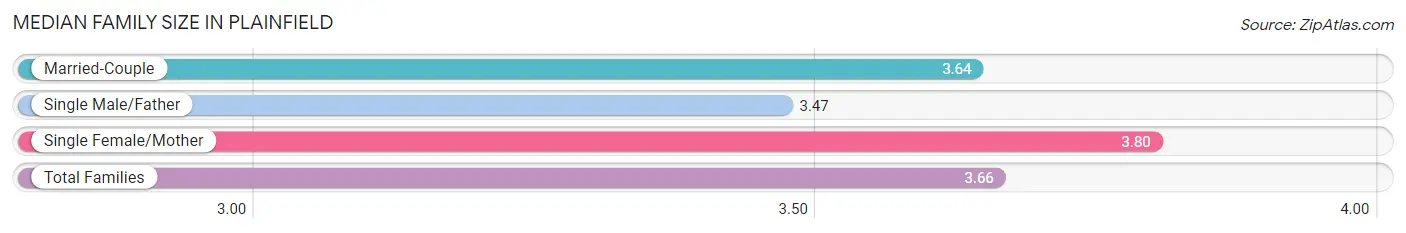
Median Family Size in Plainfield
The median family size in Plainfield is 3.66 persons per family, with single female/mother families (3,345 | 27.6%) accounting for the largest median family size of 3.8 persons per family. On the other hand, single male/father families (1,999 | 16.5%) represent the smallest median family size with 3.47 persons per family.
| Family Type | # Families | Family Size |
| Married-Couple | 6,774 (55.9%) | 3.64 |
| Single Male/Father | 1,999 (16.5%) | 3.47 |
| Single Female/Mother | 3,345 (27.6%) | 3.80 |
| Total Families | 12,118 (100.0%) | 3.66 |
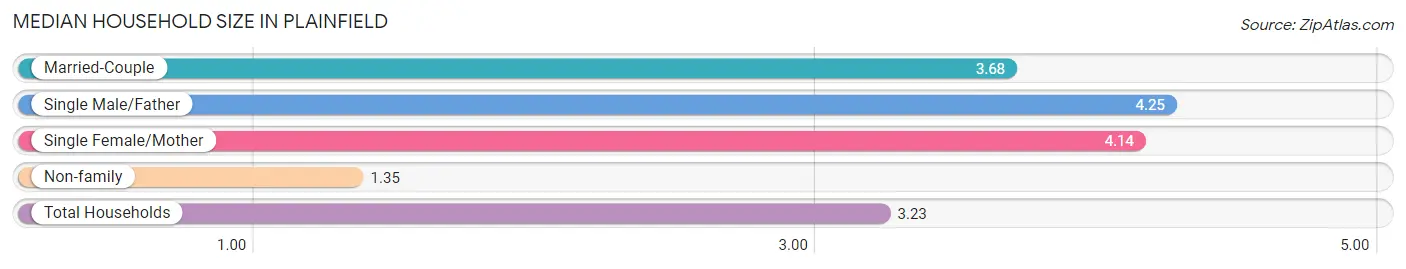
Median Household Size in Plainfield
The median household size in Plainfield is 3.23 persons per household, with single male/father households (1,999 | 12.1%) accounting for the largest median household size of 4.25 persons per household. non-family households (4,341 | 26.4%) represent the smallest median household size with 1.35 persons per household.
| Household Type | # Households | Household Size |
| Married-Couple | 6,774 (41.2%) | 3.68 |
| Single Male/Father | 1,999 (12.1%) | 4.25 |
| Single Female/Mother | 3,345 (20.3%) | 4.14 |
| Non-family | 4,341 (26.4%) | 1.35 |
| Total Households | 16,459 (100.0%) | 3.23 |
Household Size by Marriage Status in Plainfield
Out of a total of 16,459 households in Plainfield, 12,118 (73.6%) are family households, while 4,341 (26.4%) are nonfamily households. The most numerous type of family households are 2-person households, comprising 3,354, and the most common type of nonfamily households are 1-person households, comprising 3,551.
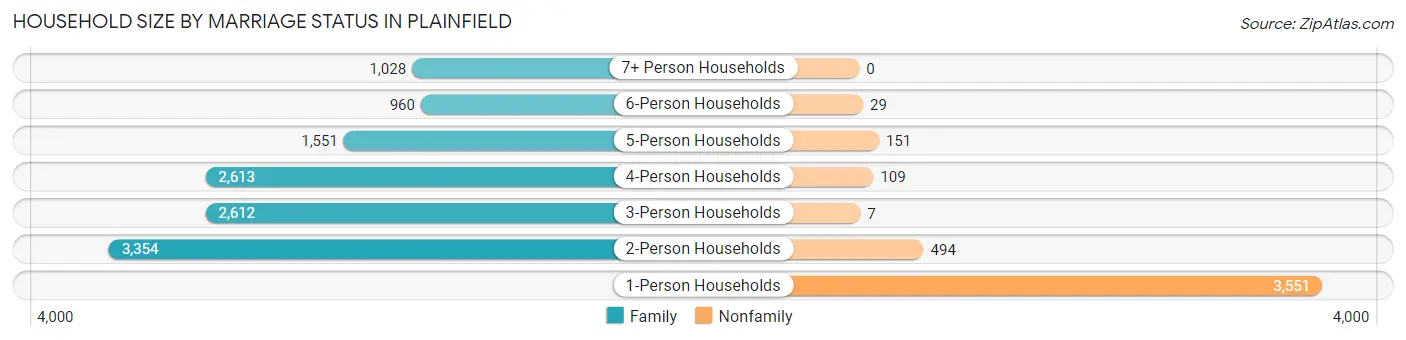
| Household Size | Family Households | Nonfamily Households |
| 1-Person Households | - | 3,551 (21.6%) |
| 2-Person Households | 3,354 (20.4%) | 494 (3.0%) |
| 3-Person Households | 2,612 (15.9%) | 7 (0.0%) |
| 4-Person Households | 2,613 (15.9%) | 109 (0.7%) |
| 5-Person Households | 1,551 (9.4%) | 151 (0.9%) |
| 6-Person Households | 960 (5.8%) | 29 (0.2%) |
| 7+ Person Households | 1,028 (6.2%) | 0 (0.0%) |
| Total | 12,118 (73.6%) | 4,341 (26.4%) |
Female Fertility in Plainfield
Fertility by Age in Plainfield
Average fertility rate in Plainfield is 78.0 births per 1,000 women. Women in the age bracket of 20 to 34 years have the highest fertility rate with 99.0 births per 1,000 women. Women in the age bracket of 20 to 34 years acount for 56.2% of all women with births.
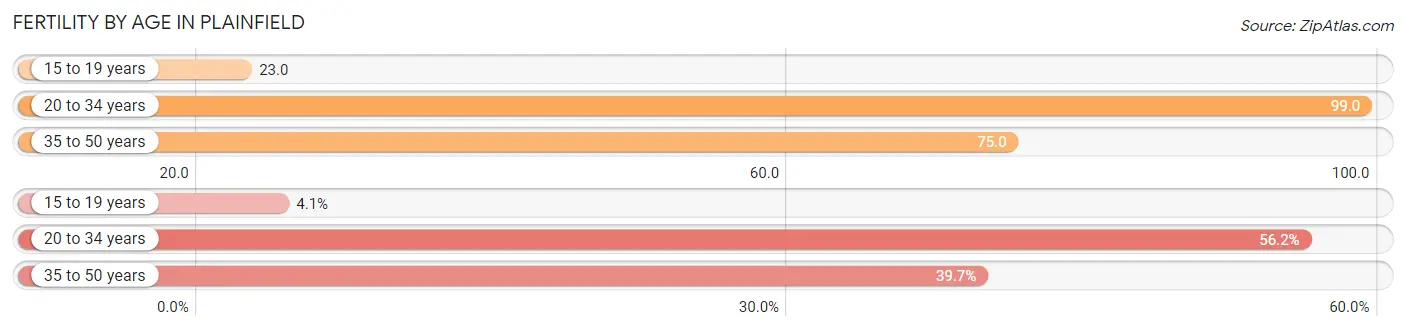
| Age Bracket | Women with Births | Births / 1,000 Women |
| 15 to 19 years | 42 (4.1%) | 23.0 |
| 20 to 34 years | 570 (56.2%) | 99.0 |
| 35 to 50 years | 403 (39.7%) | 75.0 |
| Total | 1,015 (100.0%) | 78.0 |
Fertility by Age by Marriage Status in Plainfield
41.0% of women with births (1,015) in Plainfield are married. The highest percentage of unmarried women with births falls into 15 to 19 years age bracket with 100.0% of them unmarried at the time of birth, while the lowest percentage of unmarried women with births belong to 35 to 50 years age bracket with 45.4% of them unmarried.
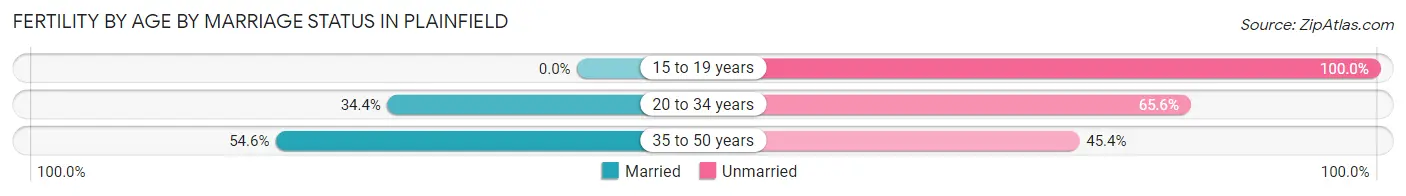
| Age Bracket | Married | Unmarried |
| 15 to 19 years | 0 (0.0%) | 42 (100.0%) |
| 20 to 34 years | 196 (34.4%) | 374 (65.6%) |
| 35 to 50 years | 220 (54.6%) | 183 (45.4%) |
| Total | 416 (41.0%) | 599 (59.0%) |
Fertility by Education in Plainfield
Average fertility rate in Plainfield is 78.0 births per 1,000 women. Women with the education attainment of high school diploma have the highest fertility rate of 102.0 births per 1,000 women, while women with the education attainment of college or associate's degree have the lowest fertility at 47.0 births per 1,000 women. Women with the education attainment of less than high school represent 36.3% of all women with births.
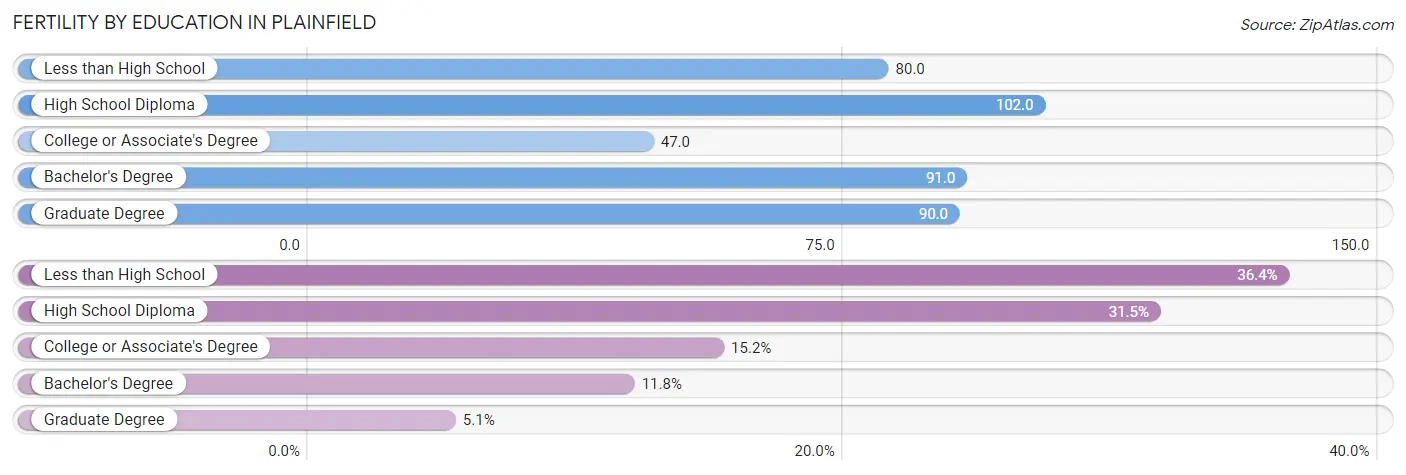
| Educational Attainment | Women with Births | Births / 1,000 Women |
| Less than High School | 369 (36.3%) | 80.0 |
| High School Diploma | 320 (31.5%) | 102.0 |
| College or Associate's Degree | 154 (15.2%) | 47.0 |
| Bachelor's Degree | 120 (11.8%) | 91.0 |
| Graduate Degree | 52 (5.1%) | 90.0 |
| Total | 1,015 (100.0%) | 78.0 |
Fertility by Education by Marriage Status in Plainfield
59.0% of women with births in Plainfield are unmarried. Women with the educational attainment of graduate degree are most likely to be married with 100.0% of them married at childbirth, while women with the educational attainment of high school diploma are least likely to be married with 69.1% of them unmarried at childbirth.
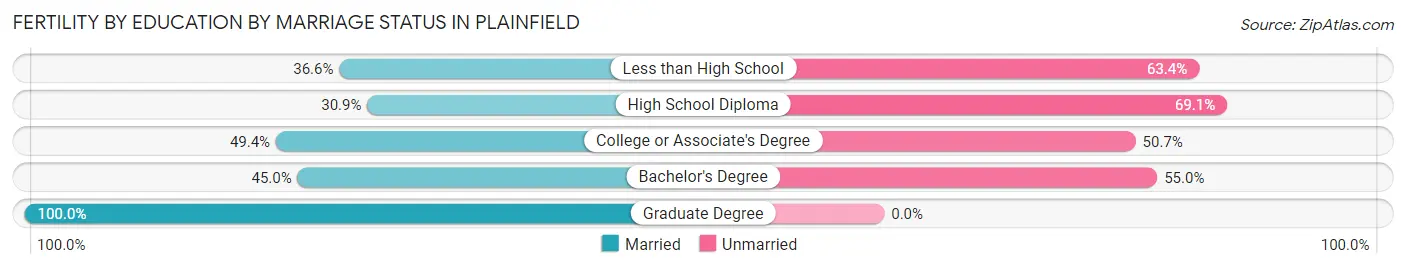
| Educational Attainment | Married | Unmarried |
| Less than High School | 135 (36.6%) | 234 (63.4%) |
| High School Diploma | 99 (30.9%) | 221 (69.1%) |
| College or Associate's Degree | 76 (49.3%) | 78 (50.6%) |
| Bachelor's Degree | 54 (45.0%) | 66 (55.0%) |
| Graduate Degree | 52 (100.0%) | 0 (0.0%) |
| Total | 416 (41.0%) | 599 (59.0%) |
Employment Characteristics in Plainfield
Employment by Class of Employer in Plainfield
Among the 26,026 employed individuals in Plainfield, private company employees (20,500 | 78.8%), not-for-profit organizations (1,655 | 6.4%), and local government employees (1,171 | 4.5%) make up the most common classes of employment.
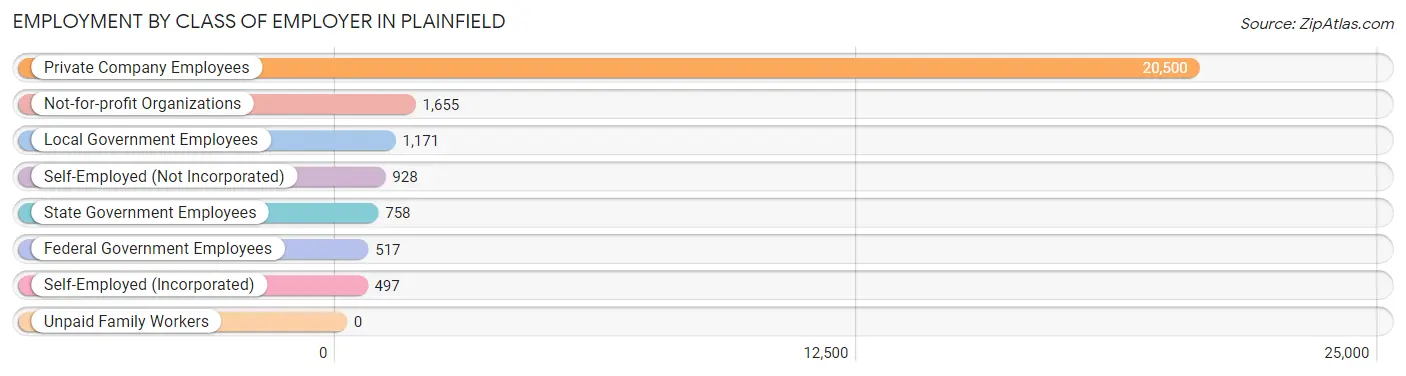
| Employer Class | # Employees | % Employees |
| Private Company Employees | 20,500 | 78.8% |
| Self-Employed (Incorporated) | 497 | 1.9% |
| Self-Employed (Not Incorporated) | 928 | 3.6% |
| Not-for-profit Organizations | 1,655 | 6.4% |
| Local Government Employees | 1,171 | 4.5% |
| State Government Employees | 758 | 2.9% |
| Federal Government Employees | 517 | 2.0% |
| Unpaid Family Workers | 0 | 0.0% |
| Total | 26,026 | 100.0% |
Employment Status by Age in Plainfield
According to the labor force statistics for Plainfield, out of the total population over 16 years of age (41,038), 72.1% or 29,588 individuals are in the labor force, with 10.3% or 3,048 of them unemployed. The age group with the highest labor force participation rate is 30 to 34 years, with 88.1% or 3,966 individuals in the labor force. Within the labor force, the 16 to 19 years age range has the highest percentage of unemployed individuals, with 36.8% or 428 of them being unemployed.
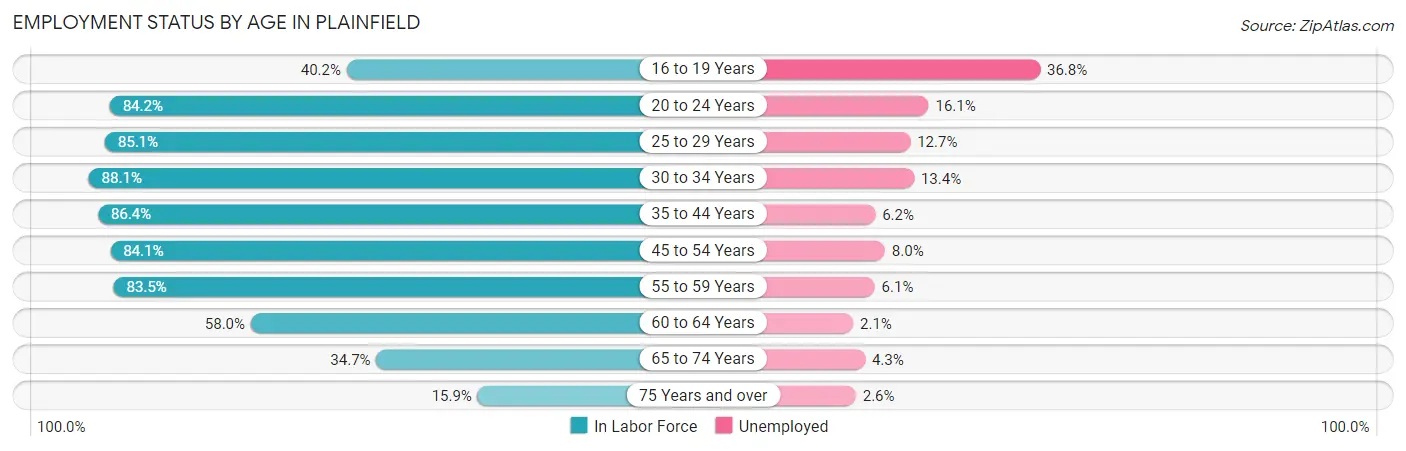
| Age Bracket | In Labor Force | Unemployed |
| 16 to 19 Years | 1,162 (40.2%) | 428 (36.8%) |
| 20 to 24 Years | 3,622 (84.2%) | 583 (16.1%) |
| 25 to 29 Years | 3,175 (85.1%) | 403 (12.7%) |
| 30 to 34 Years | 3,966 (88.1%) | 531 (13.4%) |
| 35 to 44 Years | 6,484 (86.4%) | 402 (6.2%) |
| 45 to 54 Years | 5,552 (84.1%) | 444 (8.0%) |
| 55 to 59 Years | 2,429 (83.5%) | 148 (6.1%) |
| 60 to 64 Years | 1,595 (58.0%) | 33 (2.1%) |
| 65 to 74 Years | 1,264 (34.7%) | 54 (4.3%) |
| 75 Years and over | 350 (15.9%) | 9 (2.6%) |
| Total | 29,588 (72.1%) | 3,048 (10.3%) |
Employment Status by Educational Attainment in Plainfield
According to labor force statistics for Plainfield, 82.9% of individuals (23,211) out of the total population between 25 and 64 years of age (27,999) are in the labor force, with 8.5% or 1,973 of them being unemployed. The group with the highest labor force participation rate are those with the educational attainment of bachelor's degree or higher, with 88.4% or 5,367 individuals in the labor force. Within the labor force, individuals with college / associate degree education have the highest percentage of unemployment, with 11.2% or 601 of them being unemployed.
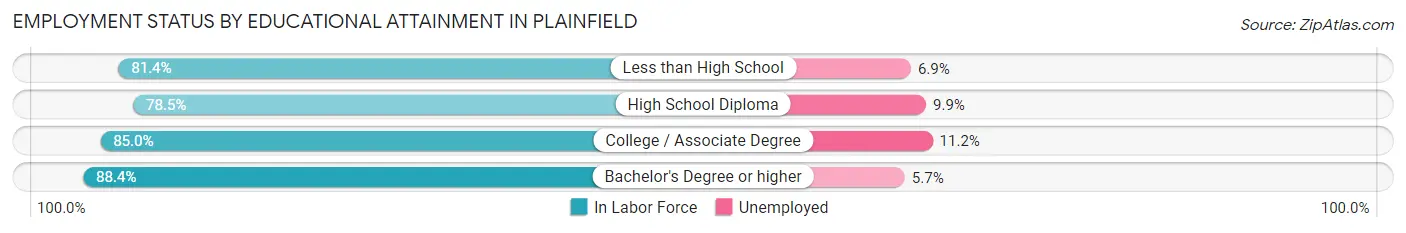
| Educational Attainment | In Labor Force | Unemployed |
| Less than High School | 6,016 (81.4%) | 510 (6.9%) |
| High School Diploma | 6,457 (78.5%) | 814 (9.9%) |
| College / Associate Degree | 5,365 (85.0%) | 707 (11.2%) |
| Bachelor's Degree or higher | 5,367 (88.4%) | 346 (5.7%) |
| Total | 23,211 (82.9%) | 2,380 (8.5%) |
Employment Occupations by Sex in Plainfield
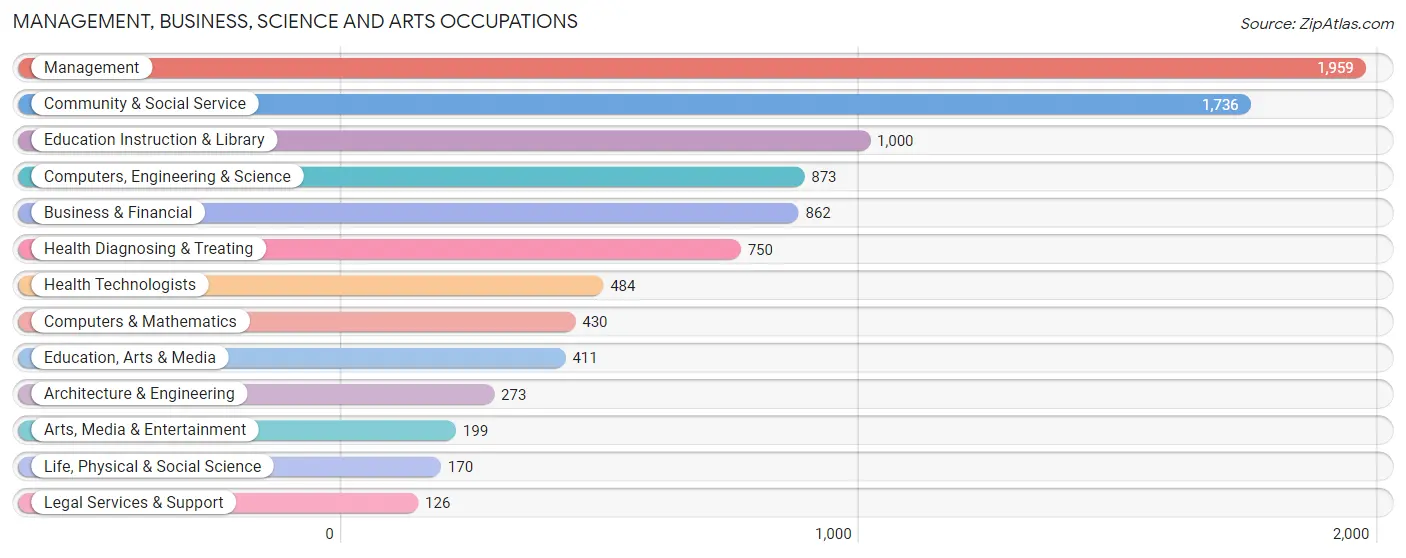
Management, Business, Science and Arts Occupations
The most common Management, Business, Science and Arts occupations in Plainfield are Management (1,959 | 7.4%), Community & Social Service (1,736 | 6.5%), Education Instruction & Library (1,000 | 3.8%), Computers, Engineering & Science (873 | 3.3%), and Business & Financial (862 | 3.3%).
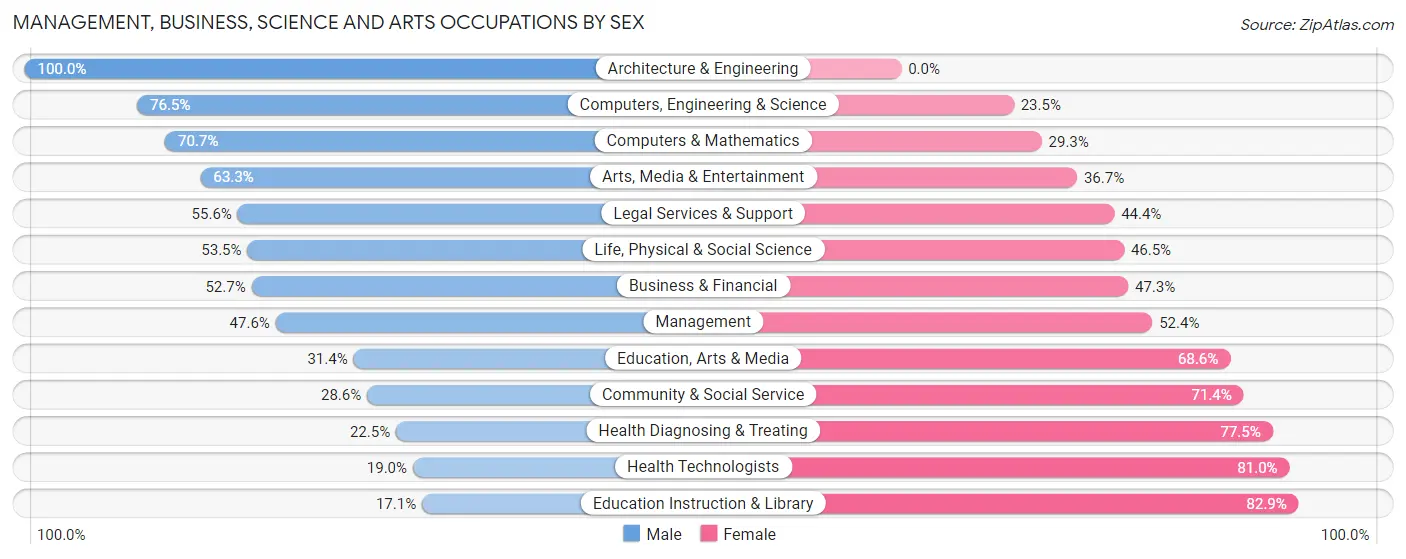
Management, Business, Science and Arts Occupations by Sex
Within the Management, Business, Science and Arts occupations in Plainfield, the most male-oriented occupations are Architecture & Engineering (100.0%), Computers, Engineering & Science (76.5%), and Computers & Mathematics (70.7%), while the most female-oriented occupations are Education Instruction & Library (82.9%), Health Technologists (81.0%), and Health Diagnosing & Treating (77.5%).
| Occupation | Male | Female |
| Management | 933 (47.6%) | 1,026 (52.4%) |
| Business & Financial | 454 (52.7%) | 408 (47.3%) |
| Computers, Engineering & Science | 668 (76.5%) | 205 (23.5%) |
| Computers & Mathematics | 304 (70.7%) | 126 (29.3%) |
| Architecture & Engineering | 273 (100.0%) | 0 (0.0%) |
| Life, Physical & Social Science | 91 (53.5%) | 79 (46.5%) |
| Community & Social Service | 496 (28.6%) | 1,240 (71.4%) |
| Education, Arts & Media | 129 (31.4%) | 282 (68.6%) |
| Legal Services & Support | 70 (55.6%) | 56 (44.4%) |
| Education Instruction & Library | 171 (17.1%) | 829 (82.9%) |
| Arts, Media & Entertainment | 126 (63.3%) | 73 (36.7%) |
| Health Diagnosing & Treating | 169 (22.5%) | 581 (77.5%) |
| Health Technologists | 92 (19.0%) | 392 (81.0%) |
| Total (Category) | 2,720 (44.0%) | 3,460 (56.0%) |
| Total (Overall) | 14,637 (55.2%) | 11,891 (44.8%) |
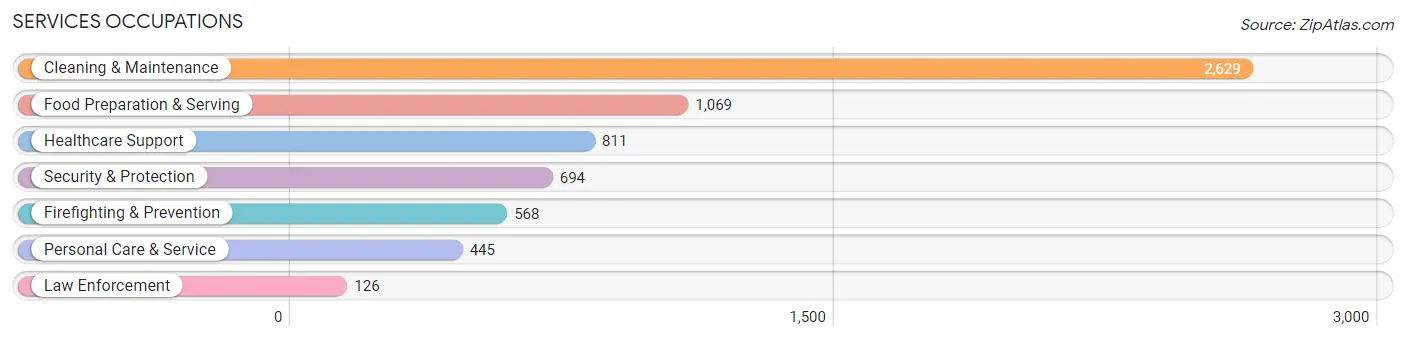
Services Occupations
The most common Services occupations in Plainfield are Cleaning & Maintenance (2,629 | 9.9%), Food Preparation & Serving (1,069 | 4.0%), Healthcare Support (811 | 3.1%), Security & Protection (694 | 2.6%), and Firefighting & Prevention (568 | 2.1%).
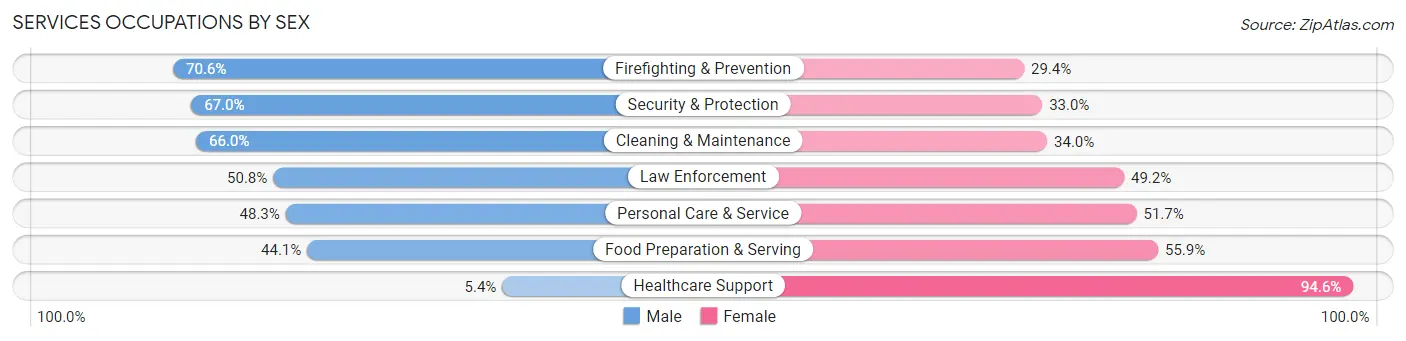
Services Occupations by Sex
Within the Services occupations in Plainfield, the most male-oriented occupations are Firefighting & Prevention (70.6%), Security & Protection (67.0%), and Cleaning & Maintenance (66.0%), while the most female-oriented occupations are Healthcare Support (94.6%), Food Preparation & Serving (55.9%), and Personal Care & Service (51.7%).
| Occupation | Male | Female |
| Healthcare Support | 44 (5.4%) | 767 (94.6%) |
| Security & Protection | 465 (67.0%) | 229 (33.0%) |
| Firefighting & Prevention | 401 (70.6%) | 167 (29.4%) |
| Law Enforcement | 64 (50.8%) | 62 (49.2%) |
| Food Preparation & Serving | 471 (44.1%) | 598 (55.9%) |
| Cleaning & Maintenance | 1,736 (66.0%) | 893 (34.0%) |
| Personal Care & Service | 215 (48.3%) | 230 (51.7%) |
| Total (Category) | 2,931 (51.9%) | 2,717 (48.1%) |
| Total (Overall) | 14,637 (55.2%) | 11,891 (44.8%) |
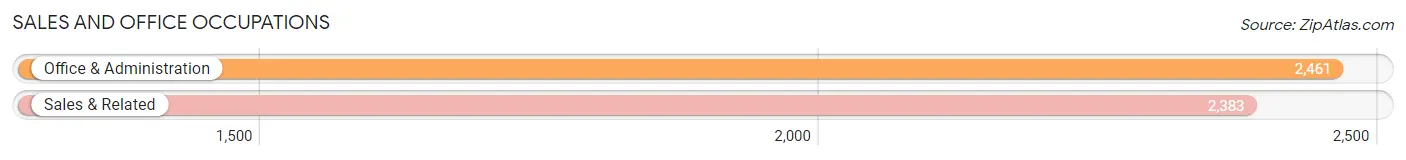
Sales and Office Occupations
The most common Sales and Office occupations in Plainfield are Office & Administration (2,461 | 9.3%), and Sales & Related (2,383 | 9.0%).
Sales and Office Occupations by Sex
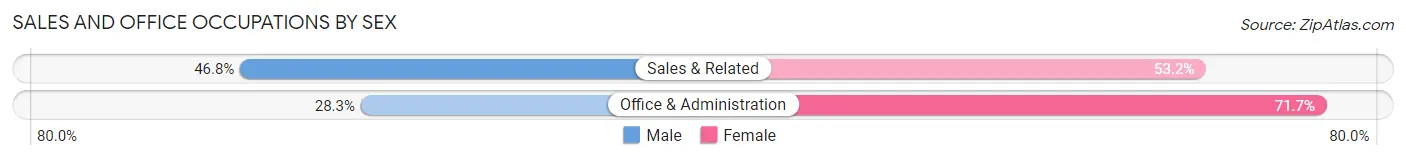
| Occupation | Male | Female |
| Sales & Related | 1,116 (46.8%) | 1,267 (53.2%) |
| Office & Administration | 696 (28.3%) | 1,765 (71.7%) |
| Total (Category) | 1,812 (37.4%) | 3,032 (62.6%) |
| Total (Overall) | 14,637 (55.2%) | 11,891 (44.8%) |
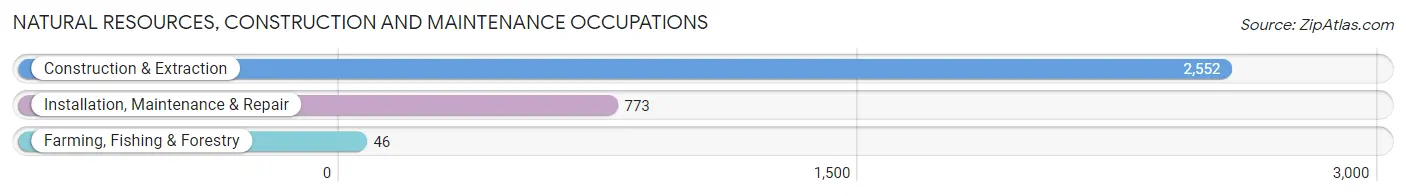
Natural Resources, Construction and Maintenance Occupations
The most common Natural Resources, Construction and Maintenance occupations in Plainfield are Construction & Extraction (2,552 | 9.6%), Installation, Maintenance & Repair (773 | 2.9%), and Farming, Fishing & Forestry (46 | 0.2%).
Natural Resources, Construction and Maintenance Occupations by Sex
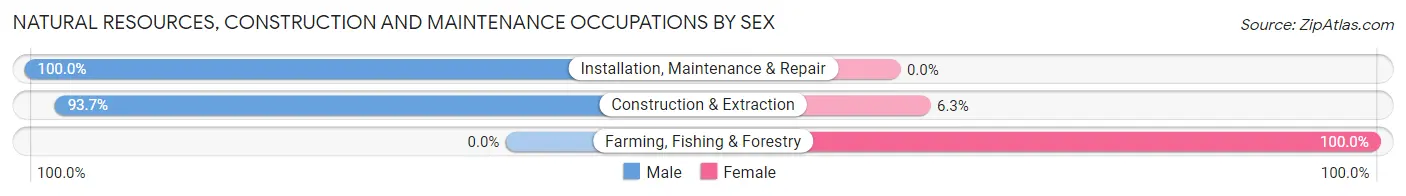
| Occupation | Male | Female |
| Farming, Fishing & Forestry | 0 (0.0%) | 46 (100.0%) |
| Construction & Extraction | 2,392 (93.7%) | 160 (6.3%) |
| Installation, Maintenance & Repair | 773 (100.0%) | 0 (0.0%) |
| Total (Category) | 3,165 (93.9%) | 206 (6.1%) |
| Total (Overall) | 14,637 (55.2%) | 11,891 (44.8%) |
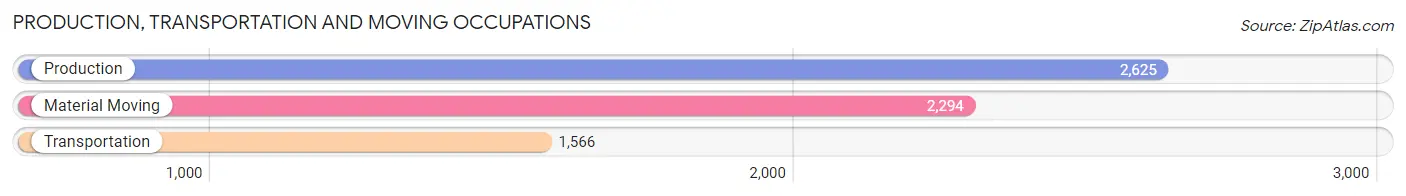
Production, Transportation and Moving Occupations
The most common Production, Transportation and Moving occupations in Plainfield are Production (2,625 | 9.9%), Material Moving (2,294 | 8.6%), and Transportation (1,566 | 5.9%).
Production, Transportation and Moving Occupations by Sex
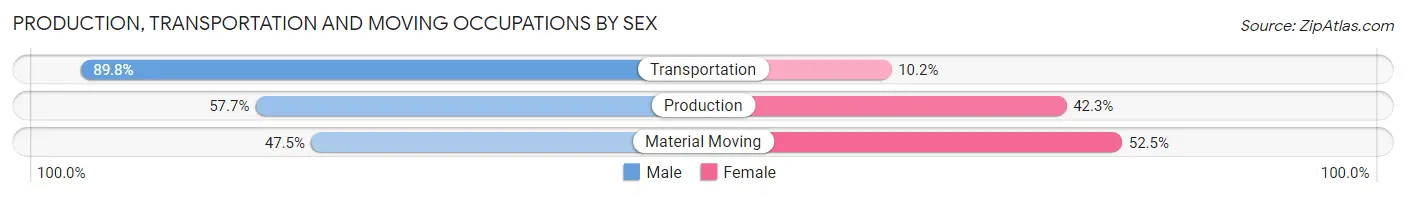
| Occupation | Male | Female |
| Production | 1,514 (57.7%) | 1,111 (42.3%) |
| Transportation | 1,406 (89.8%) | 160 (10.2%) |
| Material Moving | 1,089 (47.5%) | 1,205 (52.5%) |
| Total (Category) | 4,009 (61.8%) | 2,476 (38.2%) |
| Total (Overall) | 14,637 (55.2%) | 11,891 (44.8%) |
Employment Industries by Sex in Plainfield
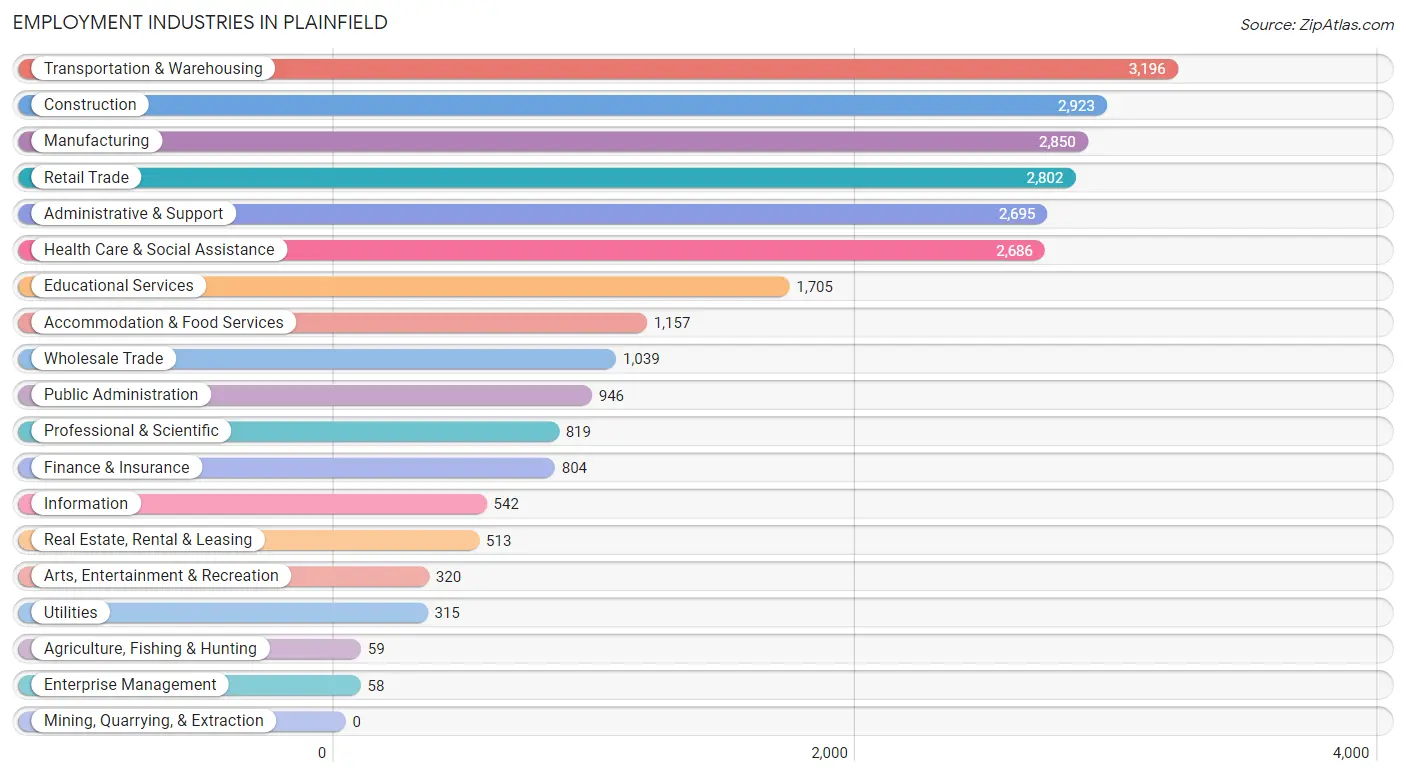
Employment Industries in Plainfield
The major employment industries in Plainfield include Transportation & Warehousing (3,196 | 12.0%), Construction (2,923 | 11.0%), Manufacturing (2,850 | 10.7%), Retail Trade (2,802 | 10.6%), and Administrative & Support (2,695 | 10.2%).
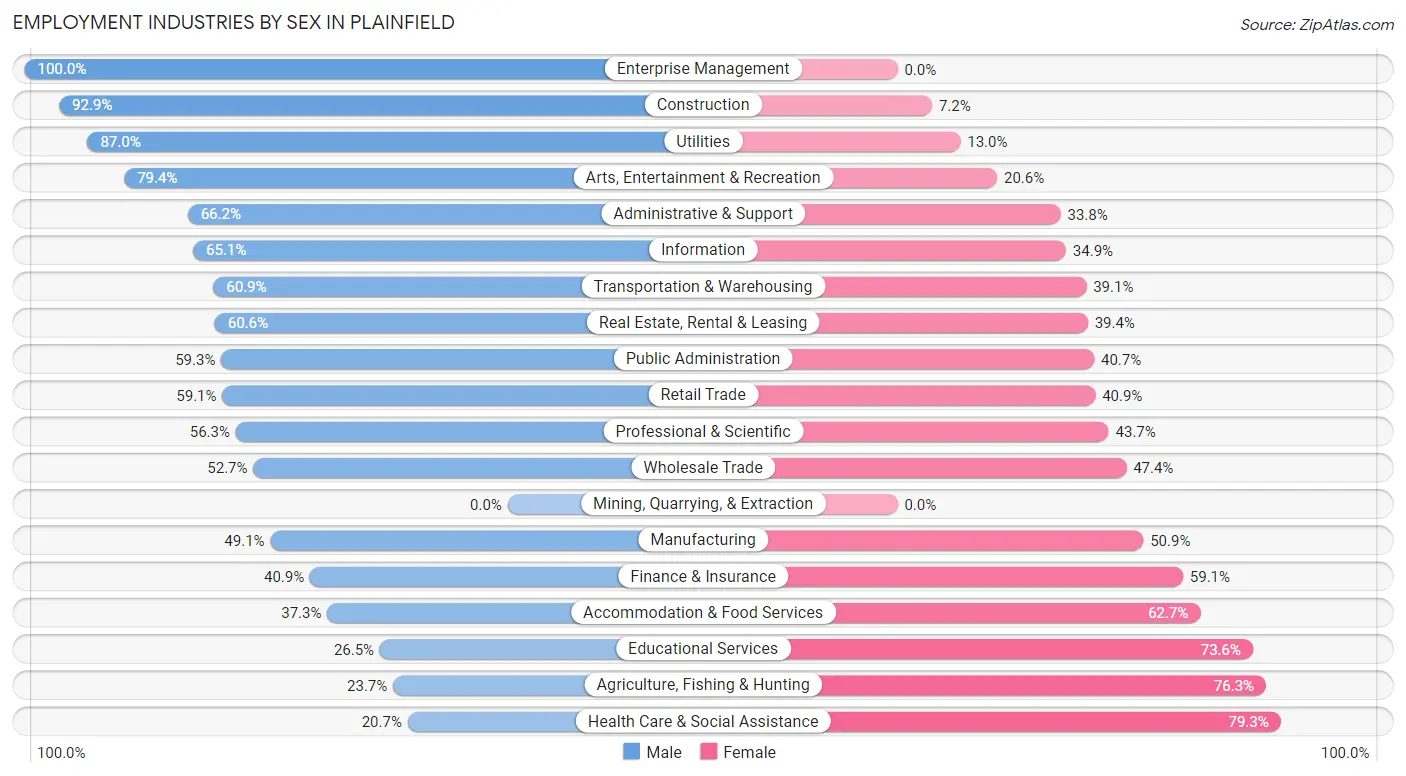
Employment Industries by Sex in Plainfield
The Plainfield industries that see more men than women are Enterprise Management (100.0%), Construction (92.8%), and Utilities (87.0%), whereas the industries that tend to have a higher number of women are Health Care & Social Assistance (79.3%), Agriculture, Fishing & Hunting (76.3%), and Educational Services (73.6%).
| Industry | Male | Female |
| Agriculture, Fishing & Hunting | 14 (23.7%) | 45 (76.3%) |
| Mining, Quarrying, & Extraction | 0 (0.0%) | 0 (0.0%) |
| Construction | 2,714 (92.8%) | 209 (7.1%) |
| Manufacturing | 1,400 (49.1%) | 1,450 (50.9%) |
| Wholesale Trade | 547 (52.6%) | 492 (47.3%) |
| Retail Trade | 1,655 (59.1%) | 1,147 (40.9%) |
| Transportation & Warehousing | 1,947 (60.9%) | 1,249 (39.1%) |
| Utilities | 274 (87.0%) | 41 (13.0%) |
| Information | 353 (65.1%) | 189 (34.9%) |
| Finance & Insurance | 329 (40.9%) | 475 (59.1%) |
| Real Estate, Rental & Leasing | 311 (60.6%) | 202 (39.4%) |
| Professional & Scientific | 461 (56.3%) | 358 (43.7%) |
| Enterprise Management | 58 (100.0%) | 0 (0.0%) |
| Administrative & Support | 1,785 (66.2%) | 910 (33.8%) |
| Educational Services | 451 (26.5%) | 1,254 (73.6%) |
| Health Care & Social Assistance | 556 (20.7%) | 2,130 (79.3%) |
| Arts, Entertainment & Recreation | 254 (79.4%) | 66 (20.6%) |
| Accommodation & Food Services | 432 (37.3%) | 725 (62.7%) |
| Public Administration | 561 (59.3%) | 385 (40.7%) |
| Total | 14,637 (55.2%) | 11,891 (44.8%) |
Education in Plainfield
School Enrollment in Plainfield
The most common levels of schooling among the 14,538 students in Plainfield are elementary school (3,222 | 22.2%), middle school (3,126 | 21.5%), and high school (2,920 | 20.1%).
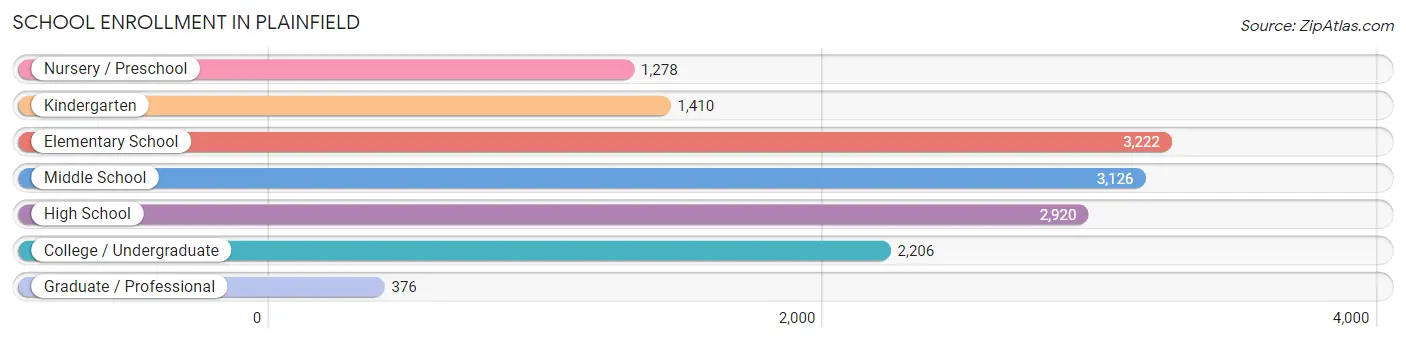
| School Level | # Students | % Students |
| Nursery / Preschool | 1,278 | 8.8% |
| Kindergarten | 1,410 | 9.7% |
| Elementary School | 3,222 | 22.2% |
| Middle School | 3,126 | 21.5% |
| High School | 2,920 | 20.1% |
| College / Undergraduate | 2,206 | 15.2% |
| Graduate / Professional | 376 | 2.6% |
| Total | 14,538 | 100.0% |
School Enrollment by Age by Funding Source in Plainfield
Out of a total of 14,538 students who are enrolled in schools in Plainfield, 669 (4.6%) attend a private institution, while the remaining 13,869 (95.4%) are enrolled in public schools. The age group of 35 years and over has the highest likelihood of being enrolled in private schools, with 199 (38.1% in the age bracket) enrolled. Conversely, the age group of 10 to 14 year olds has the lowest likelihood of being enrolled in a private school, with 3,757 (98.5% in the age bracket) attending a public institution.
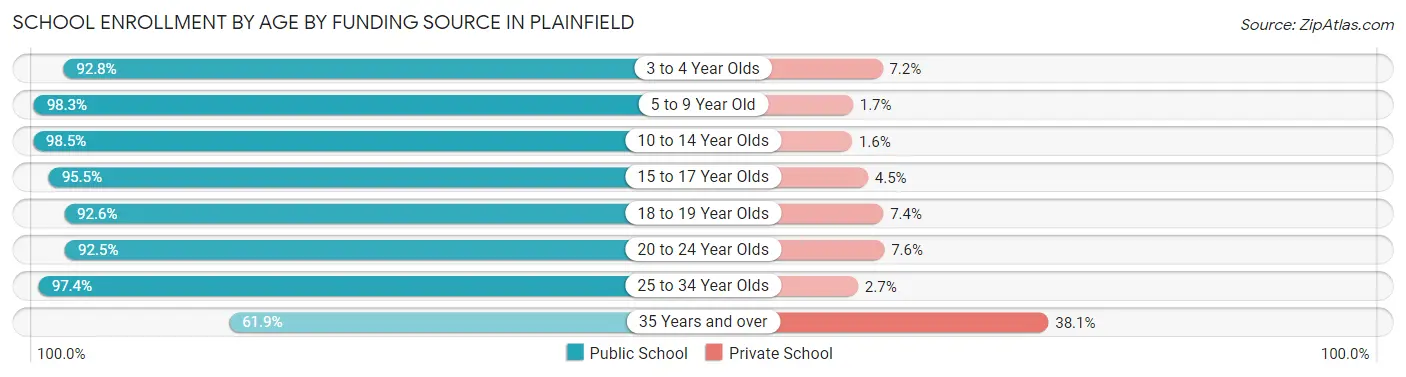
| Age Bracket | Public School | Private School |
| 3 to 4 Year Olds | 1,090 (92.8%) | 85 (7.2%) |
| 5 to 9 Year Old | 4,349 (98.3%) | 75 (1.7%) |
| 10 to 14 Year Olds | 3,757 (98.5%) | 59 (1.5%) |
| 15 to 17 Year Olds | 2,166 (95.5%) | 102 (4.5%) |
| 18 to 19 Year Olds | 591 (92.6%) | 47 (7.4%) |
| 20 to 24 Year Olds | 1,114 (92.4%) | 91 (7.5%) |
| 25 to 34 Year Olds | 477 (97.4%) | 13 (2.6%) |
| 35 Years and over | 323 (61.9%) | 199 (38.1%) |
| Total | 13,869 (95.4%) | 669 (4.6%) |
Educational Attainment by Field of Study in Plainfield
Business (1,933 | 23.4%), education (967 | 11.7%), science & technology (716 | 8.7%), arts & humanities (657 | 8.0%), and psychology (484 | 5.9%) are the most common fields of study among 8,257 individuals in Plainfield who have obtained a bachelor's degree or higher.
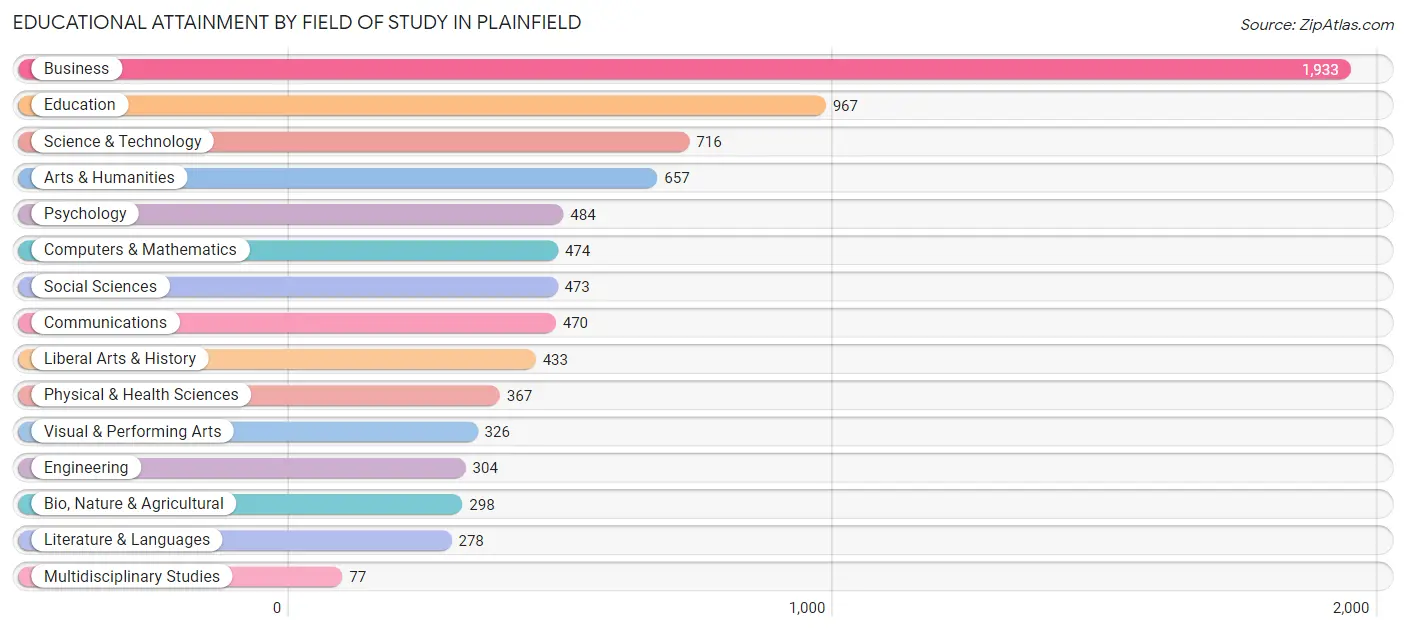
| Field of Study | # Graduates | % Graduates |
| Computers & Mathematics | 474 | 5.7% |
| Bio, Nature & Agricultural | 298 | 3.6% |
| Physical & Health Sciences | 367 | 4.4% |
| Psychology | 484 | 5.9% |
| Social Sciences | 473 | 5.7% |
| Engineering | 304 | 3.7% |
| Multidisciplinary Studies | 77 | 0.9% |
| Science & Technology | 716 | 8.7% |
| Business | 1,933 | 23.4% |
| Education | 967 | 11.7% |
| Literature & Languages | 278 | 3.4% |
| Liberal Arts & History | 433 | 5.2% |
| Visual & Performing Arts | 326 | 4.0% |
| Communications | 470 | 5.7% |
| Arts & Humanities | 657 | 8.0% |
| Total | 8,257 | 100.0% |
Transportation & Commute in Plainfield
Vehicle Availability by Sex in Plainfield
The most prevalent vehicle ownership categories in Plainfield are males with 2 vehicles (4,606, accounting for 31.9%) and females with 2 vehicles (3,327, making up 40.2%).
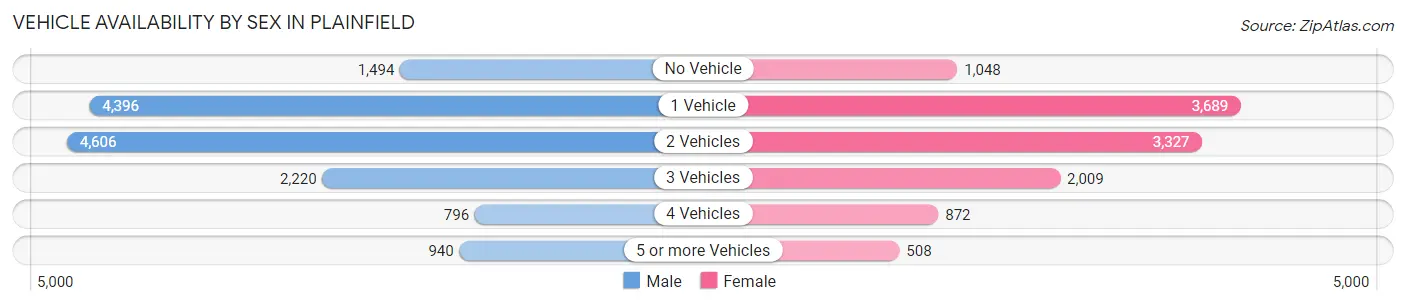
| Vehicles Available | Male | Female |
| No Vehicle | 1,494 (10.3%) | 1,048 (9.1%) |
| 1 Vehicle | 4,396 (30.4%) | 3,689 (32.2%) |
| 2 Vehicles | 4,606 (31.9%) | 3,327 (29.0%) |
| 3 Vehicles | 2,220 (15.4%) | 2,009 (17.5%) |
| 4 Vehicles | 796 (5.5%) | 872 (7.6%) |
| 5 or more Vehicles | 940 (6.5%) | 508 (4.4%) |
| Total | 14,452 (100.0%) | 11,453 (100.0%) |
Commute Time in Plainfield
The most frequently occuring commute durations in Plainfield are 30 to 34 minutes (3,686 commuters, 15.1%), 20 to 24 minutes (3,264 commuters, 13.4%), and 15 to 19 minutes (3,154 commuters, 12.9%).
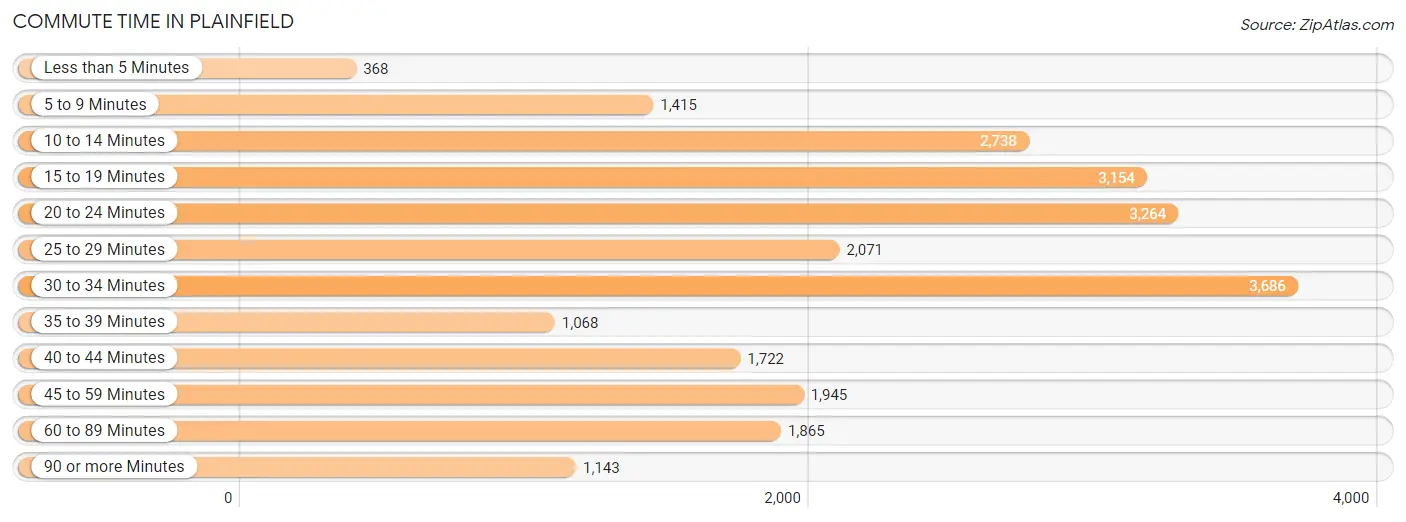
| Commute Time | # Commuters | % Commuters |
| Less than 5 Minutes | 368 | 1.5% |
| 5 to 9 Minutes | 1,415 | 5.8% |
| 10 to 14 Minutes | 2,738 | 11.2% |
| 15 to 19 Minutes | 3,154 | 12.9% |
| 20 to 24 Minutes | 3,264 | 13.4% |
| 25 to 29 Minutes | 2,071 | 8.5% |
| 30 to 34 Minutes | 3,686 | 15.1% |
| 35 to 39 Minutes | 1,068 | 4.4% |
| 40 to 44 Minutes | 1,722 | 7.0% |
| 45 to 59 Minutes | 1,945 | 8.0% |
| 60 to 89 Minutes | 1,865 | 7.6% |
| 90 or more Minutes | 1,143 | 4.7% |
Commute Time by Sex in Plainfield
The most common commute times in Plainfield are 30 to 34 minutes (2,116 commuters, 15.3%) for males and 20 to 24 minutes (1,803 commuters, 17.0%) for females.
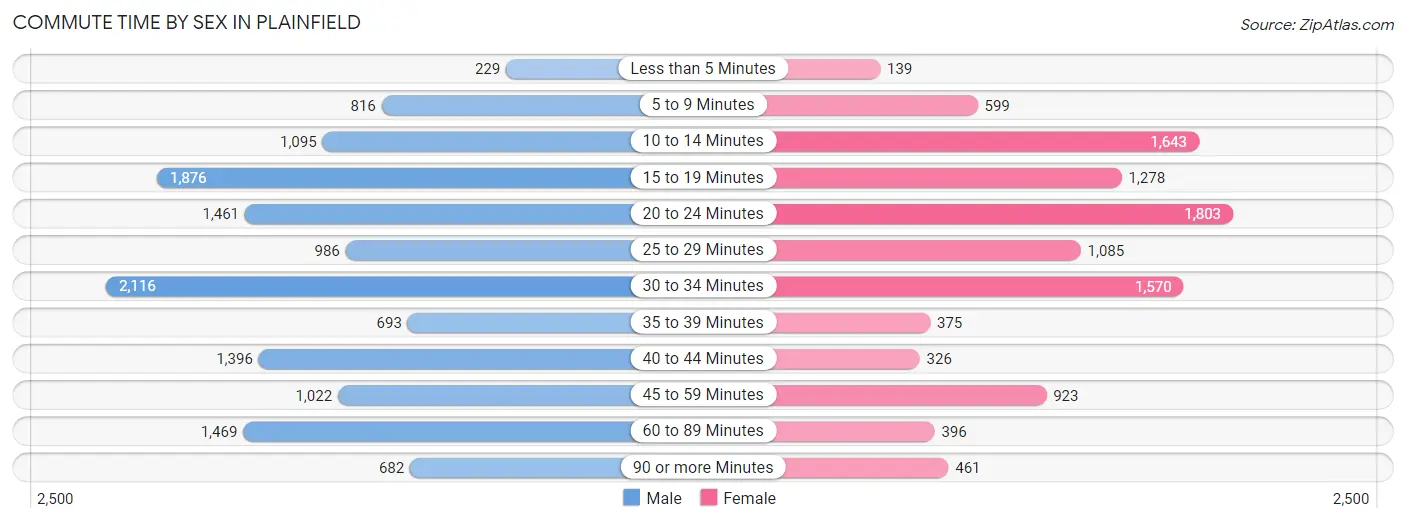
| Commute Time | Male | Female |
| Less than 5 Minutes | 229 (1.7%) | 139 (1.3%) |
| 5 to 9 Minutes | 816 (5.9%) | 599 (5.7%) |
| 10 to 14 Minutes | 1,095 (7.9%) | 1,643 (15.5%) |
| 15 to 19 Minutes | 1,876 (13.6%) | 1,278 (12.1%) |
| 20 to 24 Minutes | 1,461 (10.6%) | 1,803 (17.0%) |
| 25 to 29 Minutes | 986 (7.1%) | 1,085 (10.2%) |
| 30 to 34 Minutes | 2,116 (15.3%) | 1,570 (14.8%) |
| 35 to 39 Minutes | 693 (5.0%) | 375 (3.5%) |
| 40 to 44 Minutes | 1,396 (10.1%) | 326 (3.1%) |
| 45 to 59 Minutes | 1,022 (7.4%) | 923 (8.7%) |
| 60 to 89 Minutes | 1,469 (10.6%) | 396 (3.7%) |
| 90 or more Minutes | 682 (4.9%) | 461 (4.3%) |
Time of Departure to Work by Sex in Plainfield
The most frequent times of departure to work in Plainfield are 7:00 AM to 7:29 AM (2,505, 18.1%) for males and 7:00 AM to 7:29 AM (1,833, 17.3%) for females.
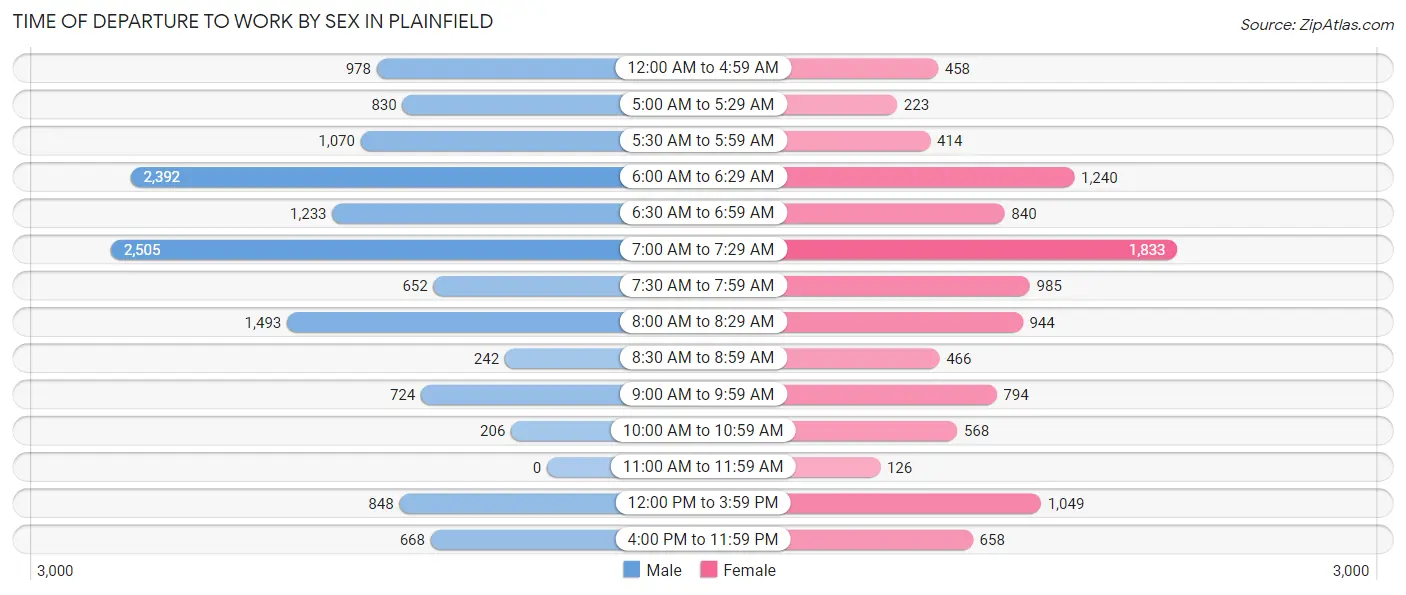
| Time of Departure | Male | Female |
| 12:00 AM to 4:59 AM | 978 (7.1%) | 458 (4.3%) |
| 5:00 AM to 5:29 AM | 830 (6.0%) | 223 (2.1%) |
| 5:30 AM to 5:59 AM | 1,070 (7.7%) | 414 (3.9%) |
| 6:00 AM to 6:29 AM | 2,392 (17.3%) | 1,240 (11.7%) |
| 6:30 AM to 6:59 AM | 1,233 (8.9%) | 840 (7.9%) |
| 7:00 AM to 7:29 AM | 2,505 (18.1%) | 1,833 (17.3%) |
| 7:30 AM to 7:59 AM | 652 (4.7%) | 985 (9.3%) |
| 8:00 AM to 8:29 AM | 1,493 (10.8%) | 944 (8.9%) |
| 8:30 AM to 8:59 AM | 242 (1.8%) | 466 (4.4%) |
| 9:00 AM to 9:59 AM | 724 (5.2%) | 794 (7.5%) |
| 10:00 AM to 10:59 AM | 206 (1.5%) | 568 (5.4%) |
| 11:00 AM to 11:59 AM | 0 (0.0%) | 126 (1.2%) |
| 12:00 PM to 3:59 PM | 848 (6.1%) | 1,049 (9.9%) |
| 4:00 PM to 11:59 PM | 668 (4.8%) | 658 (6.2%) |
| Total | 13,841 (100.0%) | 10,598 (100.0%) |
Housing Occupancy in Plainfield
Occupancy by Ownership in Plainfield
Of the total 16,459 dwellings in Plainfield, owner-occupied units account for 7,254 (44.1%), while renter-occupied units make up 9,205 (55.9%).
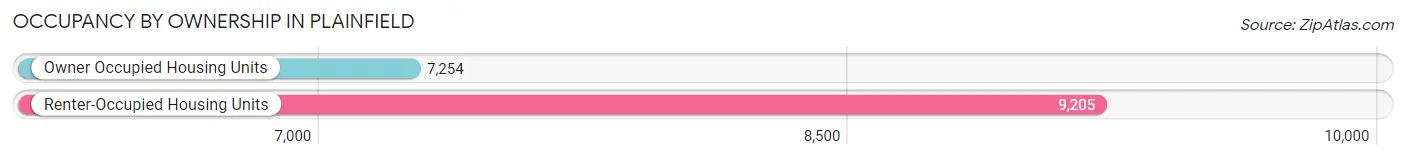
| Occupancy | # Housing Units | % Housing Units |
| Owner Occupied Housing Units | 7,254 | 44.1% |
| Renter-Occupied Housing Units | 9,205 | 55.9% |
| Total Occupied Housing Units | 16,459 | 100.0% |
Occupancy by Household Size in Plainfield
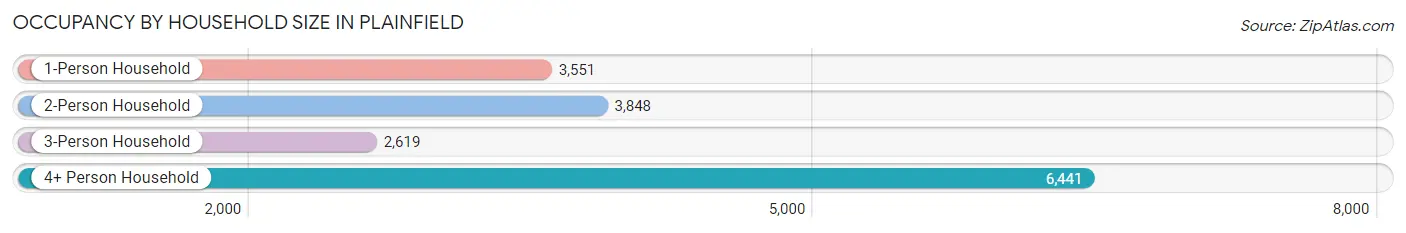
| Household Size | # Housing Units | % Housing Units |
| 1-Person Household | 3,551 | 21.6% |
| 2-Person Household | 3,848 | 23.4% |
| 3-Person Household | 2,619 | 15.9% |
| 4+ Person Household | 6,441 | 39.1% |
| Total Housing Units | 16,459 | 100.0% |
Occupancy by Ownership by Household Size in Plainfield
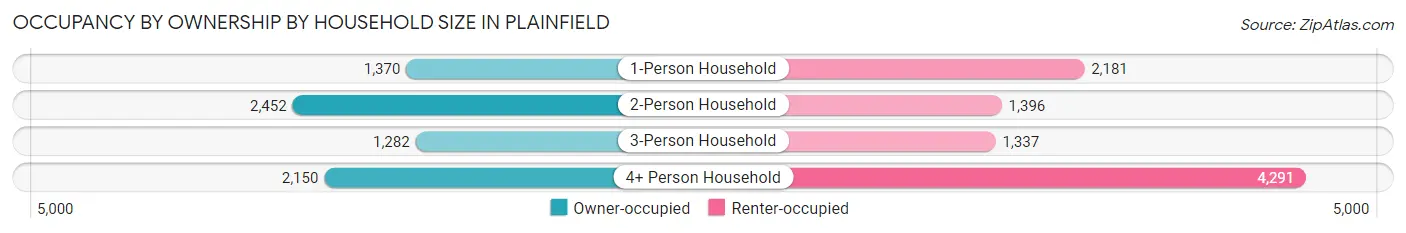
| Household Size | Owner-occupied | Renter-occupied |
| 1-Person Household | 1,370 (38.6%) | 2,181 (61.4%) |
| 2-Person Household | 2,452 (63.7%) | 1,396 (36.3%) |
| 3-Person Household | 1,282 (48.9%) | 1,337 (51.0%) |
| 4+ Person Household | 2,150 (33.4%) | 4,291 (66.6%) |
| Total Housing Units | 7,254 (44.1%) | 9,205 (55.9%) |
Occupancy by Educational Attainment in Plainfield
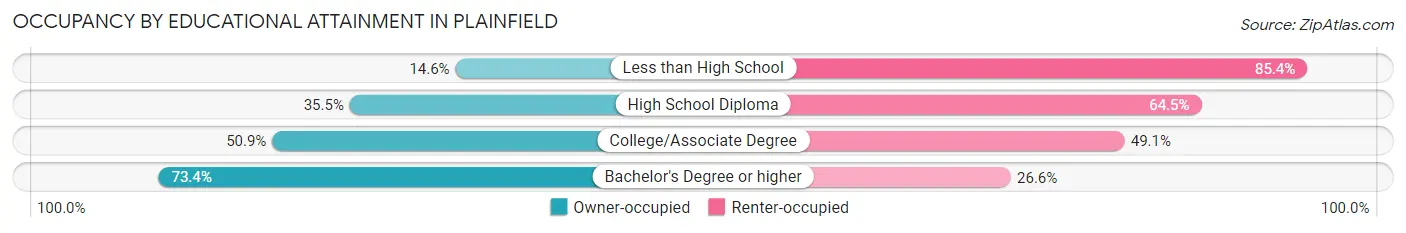
| Household Size | Owner-occupied | Renter-occupied |
| Less than High School | 532 (14.6%) | 3,117 (85.4%) |
| High School Diploma | 1,663 (35.5%) | 3,016 (64.5%) |
| College/Associate Degree | 2,062 (50.9%) | 1,988 (49.1%) |
| Bachelor's Degree or higher | 2,997 (73.4%) | 1,084 (26.6%) |
Occupancy by Age of Householder in Plainfield
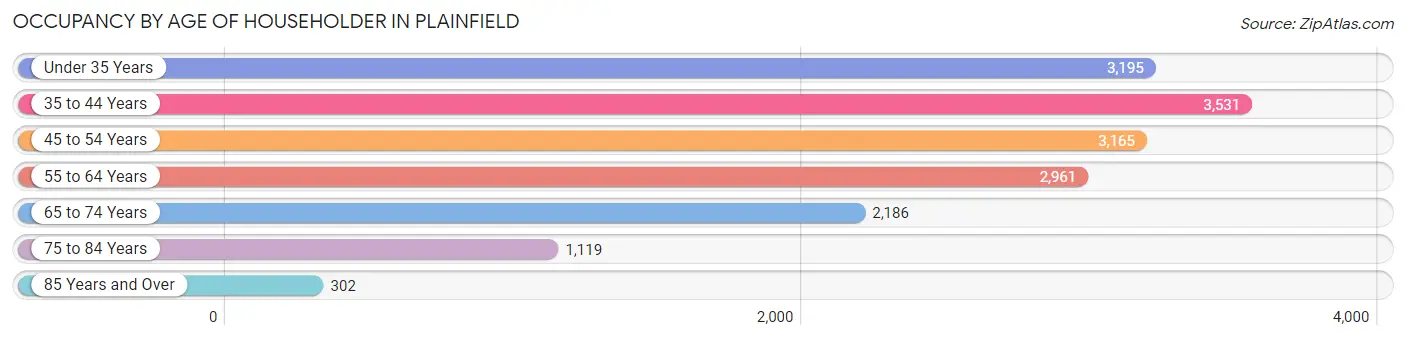
| Age Bracket | # Households | % Households |
| Under 35 Years | 3,195 | 19.4% |
| 35 to 44 Years | 3,531 | 21.4% |
| 45 to 54 Years | 3,165 | 19.2% |
| 55 to 64 Years | 2,961 | 18.0% |
| 65 to 74 Years | 2,186 | 13.3% |
| 75 to 84 Years | 1,119 | 6.8% |
| 85 Years and Over | 302 | 1.8% |
| Total | 16,459 | 100.0% |
Housing Finances in Plainfield
Median Income by Occupancy in Plainfield
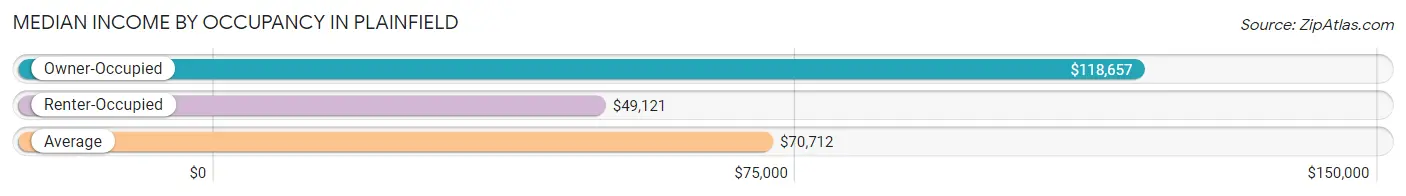
| Occupancy Type | # Households | Median Income |
| Owner-Occupied | 7,254 (44.1%) | $118,657 |
| Renter-Occupied | 9,205 (55.9%) | $49,121 |
| Average | 16,459 (100.0%) | $70,712 |
Occupancy by Householder Income Bracket in Plainfield
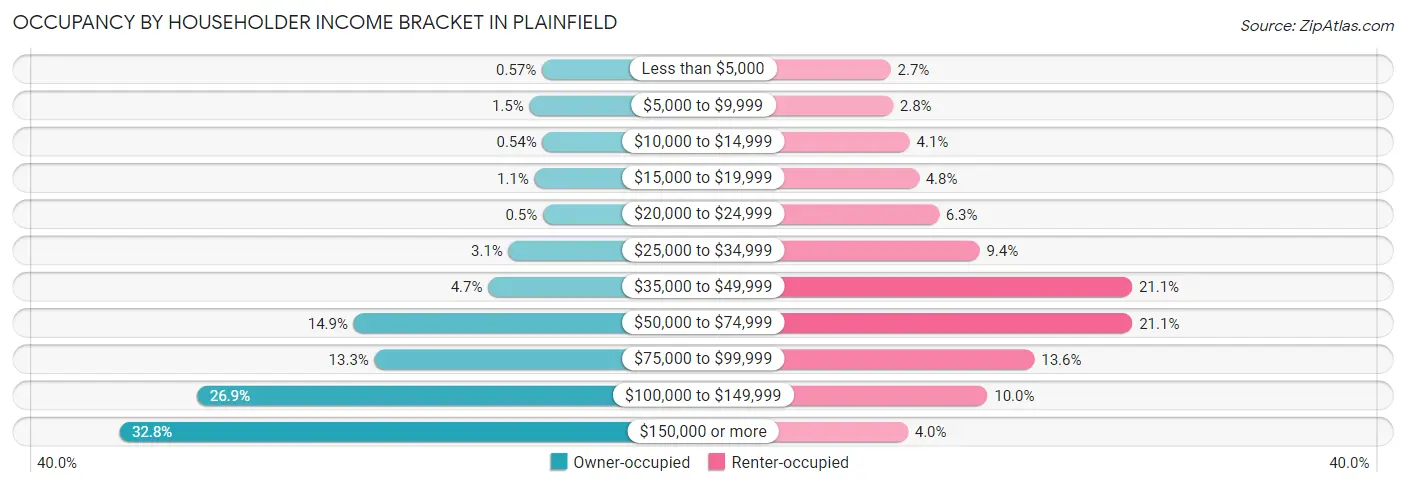
| Income Bracket | Owner-occupied | Renter-occupied |
| Less than $5,000 | 41 (0.6%) | 246 (2.7%) |
| $5,000 to $9,999 | 111 (1.5%) | 261 (2.8%) |
| $10,000 to $14,999 | 39 (0.5%) | 379 (4.1%) |
| $15,000 to $19,999 | 83 (1.1%) | 443 (4.8%) |
| $20,000 to $24,999 | 36 (0.5%) | 584 (6.3%) |
| $25,000 to $34,999 | 226 (3.1%) | 869 (9.4%) |
| $35,000 to $49,999 | 339 (4.7%) | 1,939 (21.1%) |
| $50,000 to $74,999 | 1,082 (14.9%) | 1,940 (21.1%) |
| $75,000 to $99,999 | 967 (13.3%) | 1,254 (13.6%) |
| $100,000 to $149,999 | 1,950 (26.9%) | 924 (10.0%) |
| $150,000 or more | 2,380 (32.8%) | 366 (4.0%) |
| Total | 7,254 (100.0%) | 9,205 (100.0%) |
Monthly Housing Cost Tiers in Plainfield
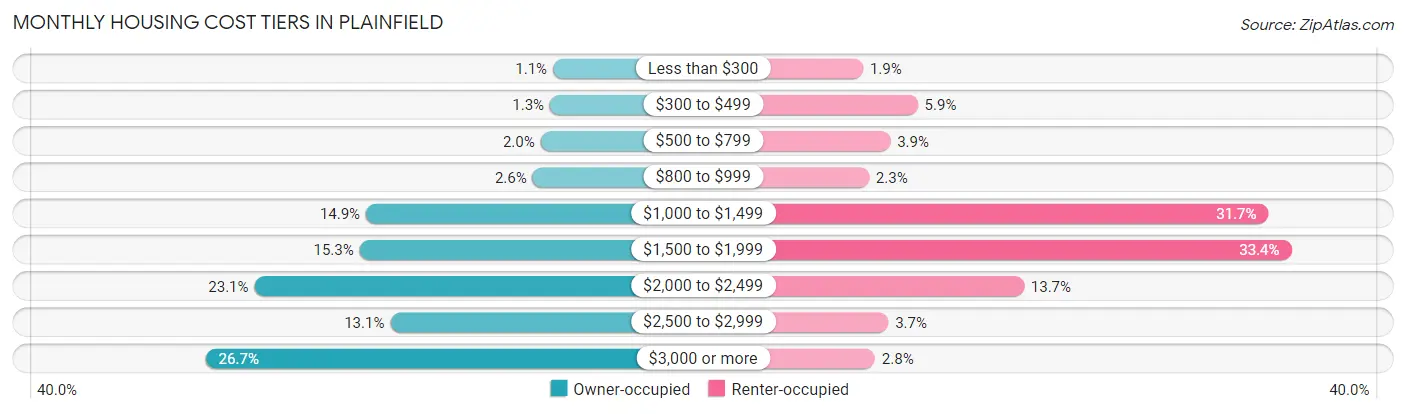
| Monthly Cost | Owner-occupied | Renter-occupied |
| Less than $300 | 79 (1.1%) | 173 (1.9%) |
| $300 to $499 | 95 (1.3%) | 544 (5.9%) |
| $500 to $799 | 145 (2.0%) | 358 (3.9%) |
| $800 to $999 | 188 (2.6%) | 214 (2.3%) |
| $1,000 to $1,499 | 1,078 (14.9%) | 2,921 (31.7%) |
| $1,500 to $1,999 | 1,112 (15.3%) | 3,077 (33.4%) |
| $2,000 to $2,499 | 1,674 (23.1%) | 1,264 (13.7%) |
| $2,500 to $2,999 | 948 (13.1%) | 344 (3.7%) |
| $3,000 or more | 1,935 (26.7%) | 254 (2.8%) |
| Total | 7,254 (100.0%) | 9,205 (100.0%) |
Physical Housing Characteristics in Plainfield
Housing Structures in Plainfield
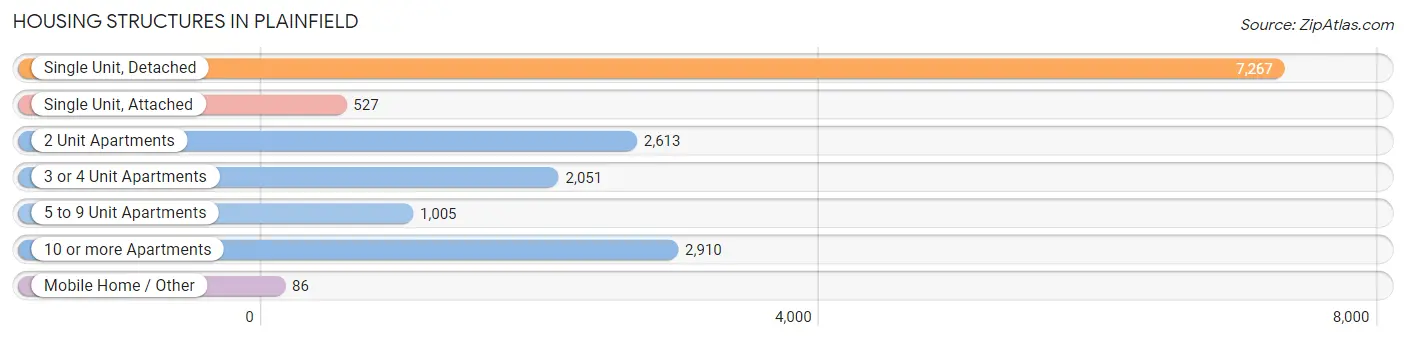
| Structure Type | # Housing Units | % Housing Units |
| Single Unit, Detached | 7,267 | 44.2% |
| Single Unit, Attached | 527 | 3.2% |
| 2 Unit Apartments | 2,613 | 15.9% |
| 3 or 4 Unit Apartments | 2,051 | 12.5% |
| 5 to 9 Unit Apartments | 1,005 | 6.1% |
| 10 or more Apartments | 2,910 | 17.7% |
| Mobile Home / Other | 86 | 0.5% |
| Total | 16,459 | 100.0% |
Housing Structures by Occupancy in Plainfield
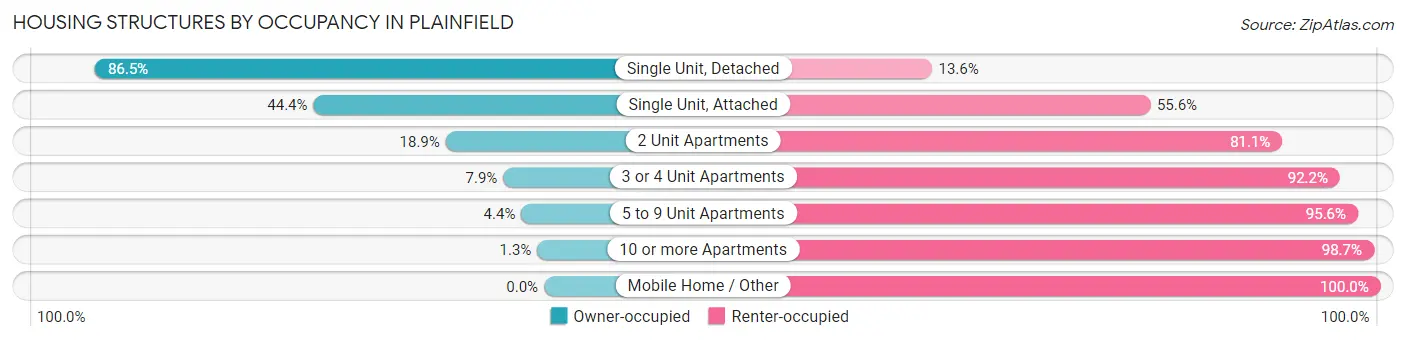
| Structure Type | Owner-occupied | Renter-occupied |
| Single Unit, Detached | 6,282 (86.5%) | 985 (13.6%) |
| Single Unit, Attached | 234 (44.4%) | 293 (55.6%) |
| 2 Unit Apartments | 495 (18.9%) | 2,118 (81.1%) |
| 3 or 4 Unit Apartments | 161 (7.9%) | 1,890 (92.1%) |
| 5 to 9 Unit Apartments | 44 (4.4%) | 961 (95.6%) |
| 10 or more Apartments | 38 (1.3%) | 2,872 (98.7%) |
| Mobile Home / Other | 0 (0.0%) | 86 (100.0%) |
| Total | 7,254 (44.1%) | 9,205 (55.9%) |
Housing Structures by Number of Rooms in Plainfield
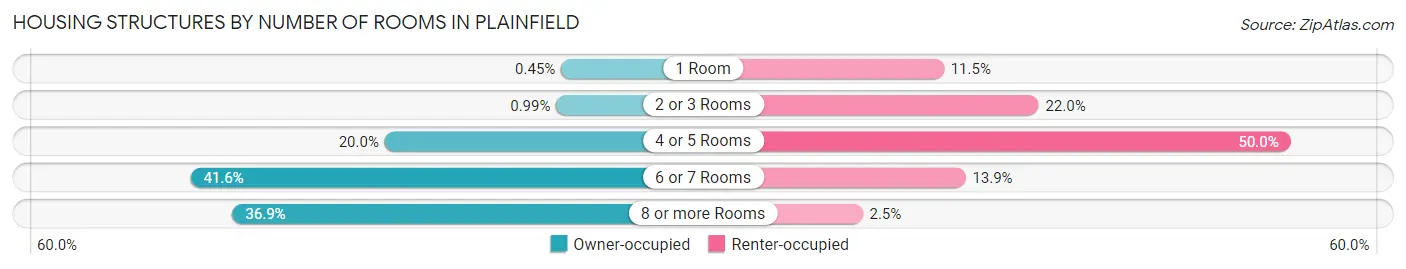
| Number of Rooms | Owner-occupied | Renter-occupied |
| 1 Room | 33 (0.4%) | 1,060 (11.5%) |
| 2 or 3 Rooms | 72 (1.0%) | 2,029 (22.0%) |
| 4 or 5 Rooms | 1,453 (20.0%) | 4,603 (50.0%) |
| 6 or 7 Rooms | 3,017 (41.6%) | 1,282 (13.9%) |
| 8 or more Rooms | 2,679 (36.9%) | 231 (2.5%) |
| Total | 7,254 (100.0%) | 9,205 (100.0%) |
Housing Structure by Heating Type in Plainfield
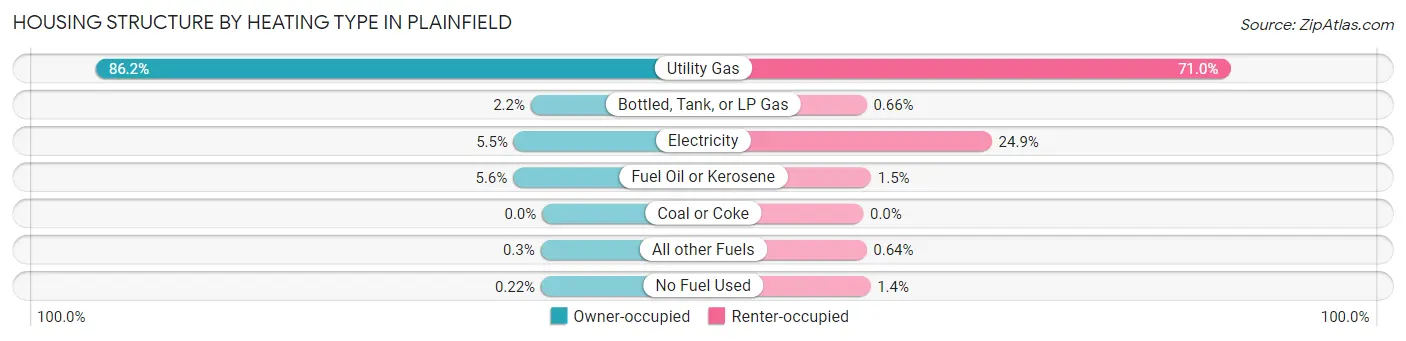
| Heating Type | Owner-occupied | Renter-occupied |
| Utility Gas | 6,255 (86.2%) | 6,531 (71.0%) |
| Bottled, Tank, or LP Gas | 158 (2.2%) | 61 (0.7%) |
| Electricity | 397 (5.5%) | 2,287 (24.8%) |
| Fuel Oil or Kerosene | 406 (5.6%) | 139 (1.5%) |
| Coal or Coke | 0 (0.0%) | 0 (0.0%) |
| All other Fuels | 22 (0.3%) | 59 (0.6%) |
| No Fuel Used | 16 (0.2%) | 128 (1.4%) |
| Total | 7,254 (100.0%) | 9,205 (100.0%) |
Household Vehicle Usage in Plainfield
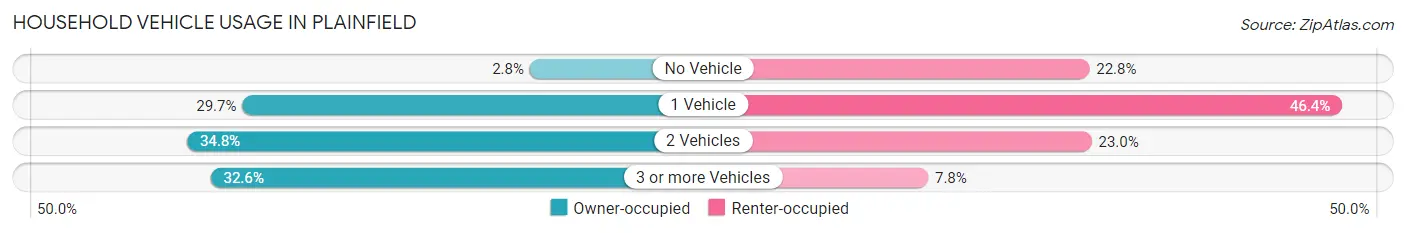
| Vehicles per Household | Owner-occupied | Renter-occupied |
| No Vehicle | 206 (2.8%) | 2,100 (22.8%) |
| 1 Vehicle | 2,153 (29.7%) | 4,272 (46.4%) |
| 2 Vehicles | 2,527 (34.8%) | 2,119 (23.0%) |
| 3 or more Vehicles | 2,368 (32.6%) | 714 (7.8%) |
| Total | 7,254 (100.0%) | 9,205 (100.0%) |
Real Estate & Mortgages in Plainfield
Real Estate and Mortgage Overview in Plainfield
| Characteristic | Without Mortgage | With Mortgage |
| Housing Units | 1,764 | 5,490 |
| Median Property Value | $325,400 | $357,200 |
| Median Household Income | $94,107 | $1,844 |
| Monthly Housing Costs | $1,252 | $1,912 |
| Real Estate Taxes | $9,885 | $36 |
Property Value by Mortgage Status in Plainfield
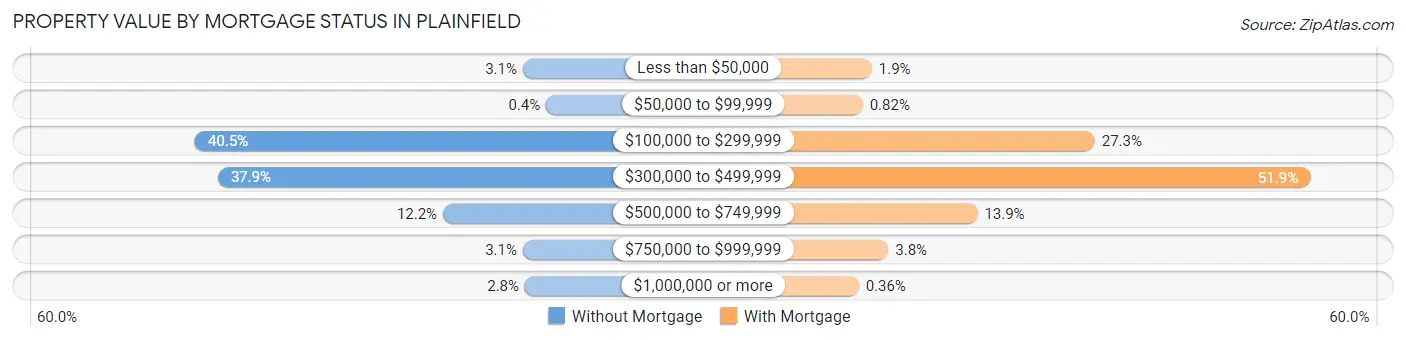
| Property Value | Without Mortgage | With Mortgage |
| Less than $50,000 | 54 (3.1%) | 102 (1.9%) |
| $50,000 to $99,999 | 7 (0.4%) | 45 (0.8%) |
| $100,000 to $299,999 | 715 (40.5%) | 1,501 (27.3%) |
| $300,000 to $499,999 | 669 (37.9%) | 2,851 (51.9%) |
| $500,000 to $749,999 | 215 (12.2%) | 765 (13.9%) |
| $750,000 to $999,999 | 54 (3.1%) | 206 (3.7%) |
| $1,000,000 or more | 50 (2.8%) | 20 (0.4%) |
| Total | 1,764 (100.0%) | 5,490 (100.0%) |
Household Income by Mortgage Status in Plainfield
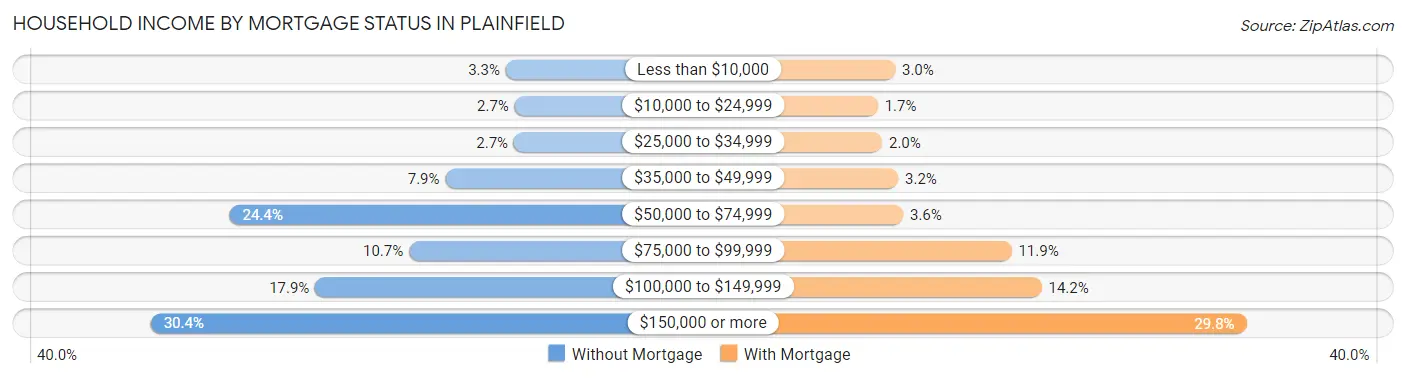
| Household Income | Without Mortgage | With Mortgage |
| Less than $10,000 | 59 (3.3%) | 165 (3.0%) |
| $10,000 to $24,999 | 47 (2.7%) | 93 (1.7%) |
| $25,000 to $34,999 | 48 (2.7%) | 111 (2.0%) |
| $35,000 to $49,999 | 140 (7.9%) | 178 (3.2%) |
| $50,000 to $74,999 | 430 (24.4%) | 199 (3.6%) |
| $75,000 to $99,999 | 189 (10.7%) | 652 (11.9%) |
| $100,000 to $149,999 | 315 (17.9%) | 778 (14.2%) |
| $150,000 or more | 536 (30.4%) | 1,635 (29.8%) |
| Total | 1,764 (100.0%) | 5,490 (100.0%) |
Property Value to Household Income Ratio in Plainfield
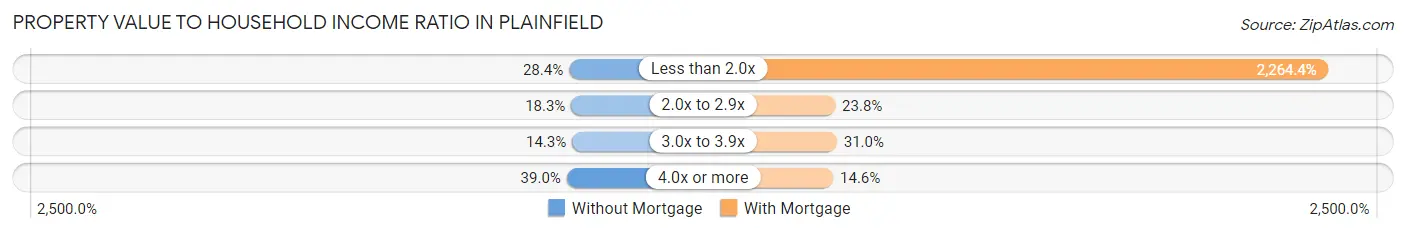
| Value-to-Income Ratio | Without Mortgage | With Mortgage |
| Less than 2.0x | 501 (28.4%) | 124,315 (2,264.4%) |
| 2.0x to 2.9x | 322 (18.2%) | 1,307 (23.8%) |
| 3.0x to 3.9x | 253 (14.3%) | 1,704 (31.0%) |
| 4.0x or more | 688 (39.0%) | 800 (14.6%) |
| Total | 1,764 (100.0%) | 5,490 (100.0%) |
Real Estate Taxes by Mortgage Status in Plainfield
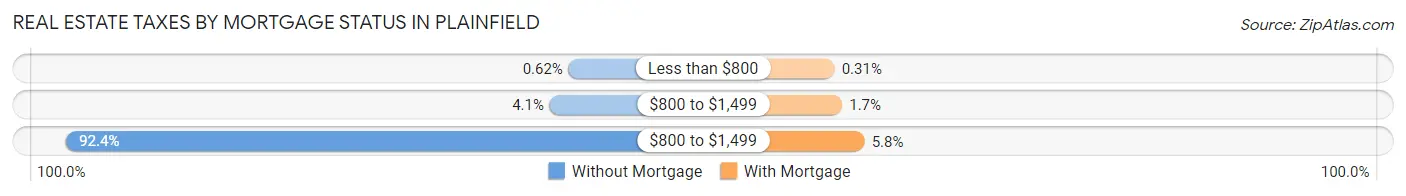
| Property Taxes | Without Mortgage | With Mortgage |
| Less than $800 | 11 (0.6%) | 17 (0.3%) |
| $800 to $1,499 | 72 (4.1%) | 93 (1.7%) |
| $800 to $1,499 | 1,630 (92.4%) | 318 (5.8%) |
| Total | 1,764 (100.0%) | 5,490 (100.0%) |
Health & Disability in Plainfield
Health Insurance Coverage by Age in Plainfield
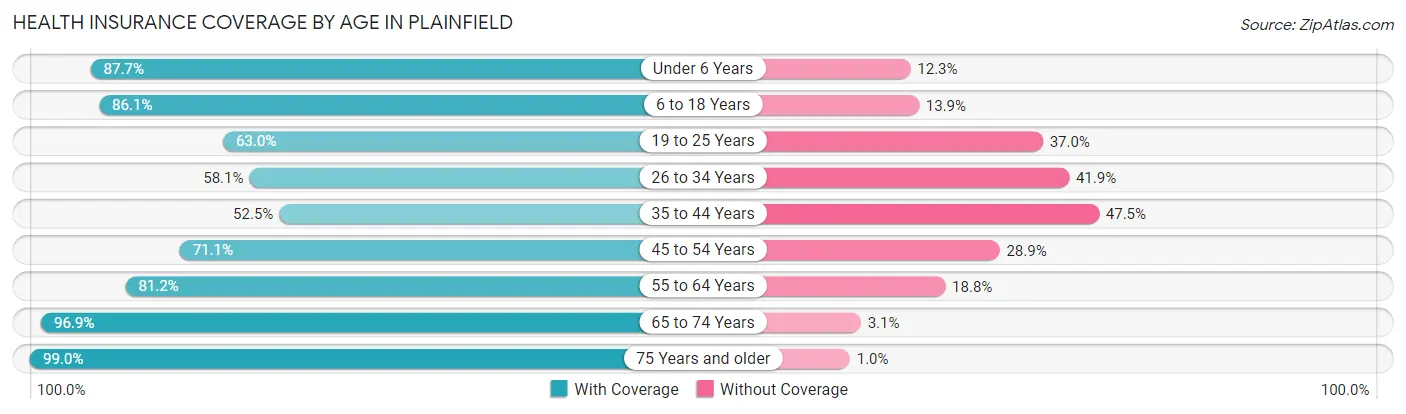
| Age Bracket | With Coverage | Without Coverage |
| Under 6 Years | 4,561 (87.7%) | 641 (12.3%) |
| 6 to 18 Years | 8,942 (86.1%) | 1,444 (13.9%) |
| 19 to 25 Years | 3,441 (63.0%) | 2,021 (37.0%) |
| 26 to 34 Years | 4,457 (58.1%) | 3,214 (41.9%) |
| 35 to 44 Years | 3,941 (52.5%) | 3,561 (47.5%) |
| 45 to 54 Years | 4,659 (71.1%) | 1,897 (28.9%) |
| 55 to 64 Years | 4,568 (81.2%) | 1,058 (18.8%) |
| 65 to 74 Years | 3,445 (96.9%) | 109 (3.1%) |
| 75 Years and older | 2,041 (99.0%) | 21 (1.0%) |
| Total | 40,055 (74.2%) | 13,966 (25.9%) |
Health Insurance Coverage by Citizenship Status in Plainfield
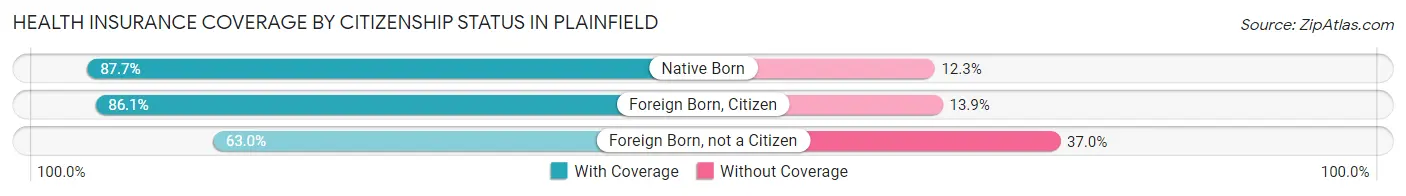
| Citizenship Status | With Coverage | Without Coverage |
| Native Born | 4,561 (87.7%) | 641 (12.3%) |
| Foreign Born, Citizen | 8,942 (86.1%) | 1,444 (13.9%) |
| Foreign Born, not a Citizen | 3,441 (63.0%) | 2,021 (37.0%) |
Health Insurance Coverage by Household Income in Plainfield
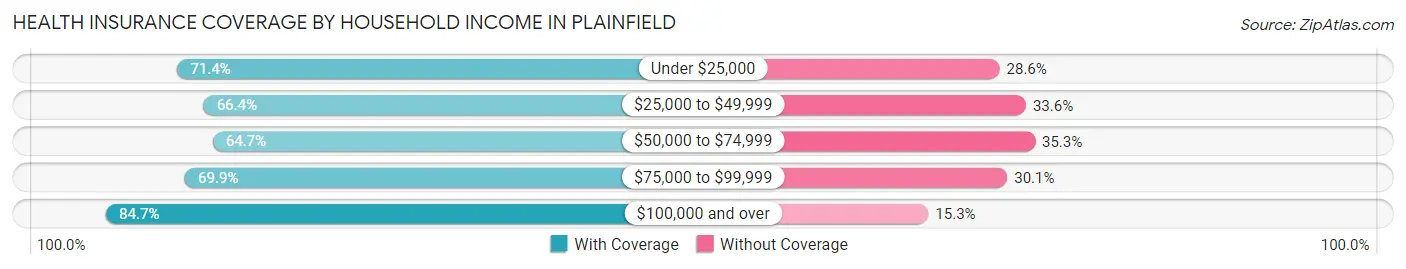
| Household Income | With Coverage | Without Coverage |
| Under $25,000 | 3,485 (71.4%) | 1,398 (28.6%) |
| $25,000 to $49,999 | 7,111 (66.4%) | 3,593 (33.6%) |
| $50,000 to $74,999 | 6,298 (64.7%) | 3,431 (35.3%) |
| $75,000 to $99,999 | 5,544 (69.9%) | 2,384 (30.1%) |
| $100,000 and over | 16,848 (84.7%) | 3,041 (15.3%) |
Public vs Private Health Insurance Coverage by Age in Plainfield
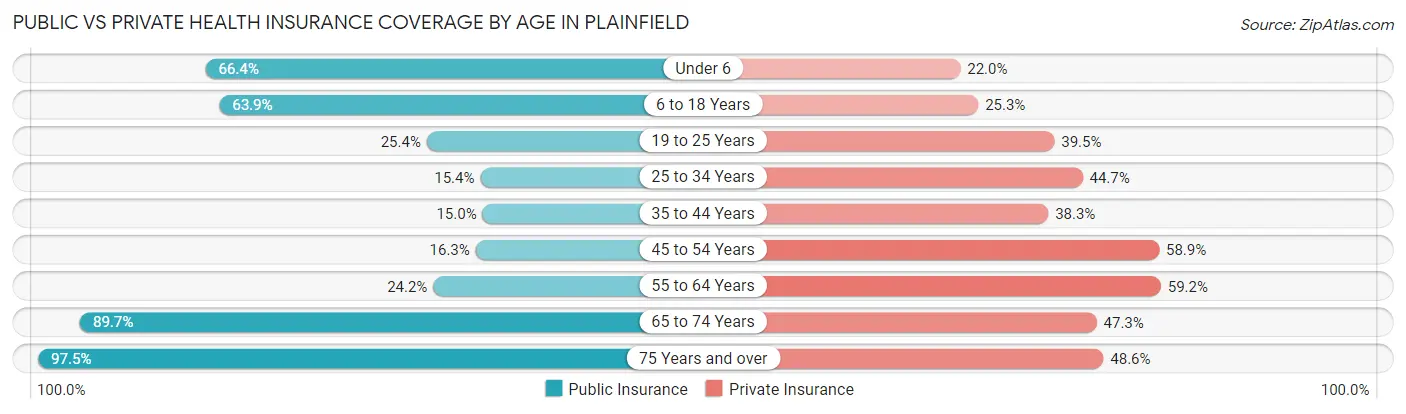
| Age Bracket | Public Insurance | Private Insurance |
| Under 6 | 3,455 (66.4%) | 1,144 (22.0%) |
| 6 to 18 Years | 6,631 (63.8%) | 2,630 (25.3%) |
| 19 to 25 Years | 1,385 (25.4%) | 2,155 (39.5%) |
| 25 to 34 Years | 1,182 (15.4%) | 3,428 (44.7%) |
| 35 to 44 Years | 1,126 (15.0%) | 2,874 (38.3%) |
| 45 to 54 Years | 1,068 (16.3%) | 3,860 (58.9%) |
| 55 to 64 Years | 1,359 (24.2%) | 3,331 (59.2%) |
| 65 to 74 Years | 3,188 (89.7%) | 1,681 (47.3%) |
| 75 Years and over | 2,010 (97.5%) | 1,001 (48.5%) |
| Total | 21,404 (39.6%) | 22,104 (40.9%) |
Disability Status by Sex by Age in Plainfield
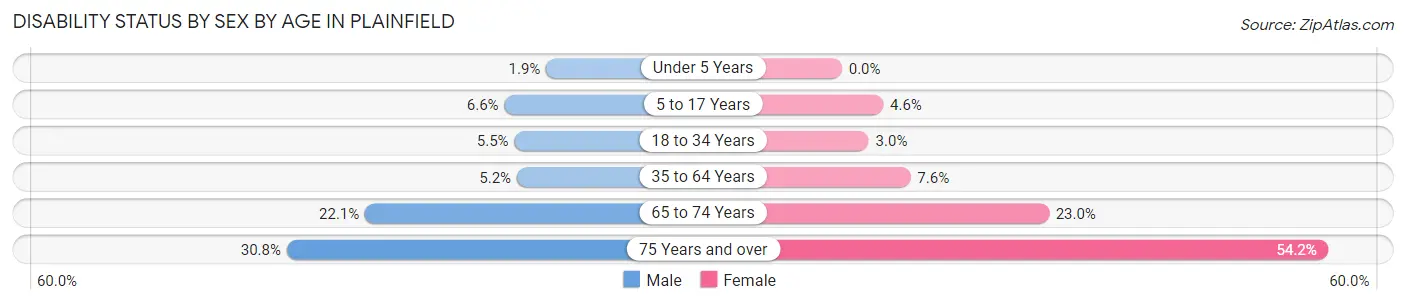
| Age Bracket | Male | Female |
| Under 5 Years | 41 (1.9%) | 0 (0.0%) |
| 5 to 17 Years | 398 (6.6%) | 219 (4.6%) |
| 18 to 34 Years | 401 (5.4%) | 191 (3.0%) |
| 35 to 64 Years | 509 (5.2%) | 751 (7.6%) |
| 65 to 74 Years | 365 (22.1%) | 438 (23.0%) |
| 75 Years and over | 251 (30.8%) | 676 (54.2%) |
Disability Class by Sex by Age in Plainfield
Disability Class: Hearing Difficulty
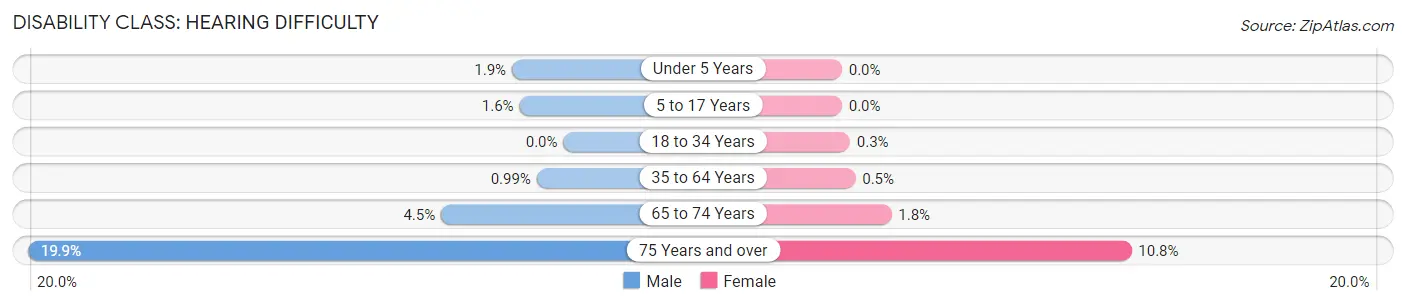
| Age Bracket | Male | Female |
| Under 5 Years | 41 (1.9%) | 0 (0.0%) |
| 5 to 17 Years | 99 (1.6%) | 0 (0.0%) |
| 18 to 34 Years | 0 (0.0%) | 19 (0.3%) |
| 35 to 64 Years | 98 (1.0%) | 49 (0.5%) |
| 65 to 74 Years | 75 (4.5%) | 35 (1.8%) |
| 75 Years and over | 162 (19.9%) | 134 (10.7%) |
Disability Class: Vision Difficulty
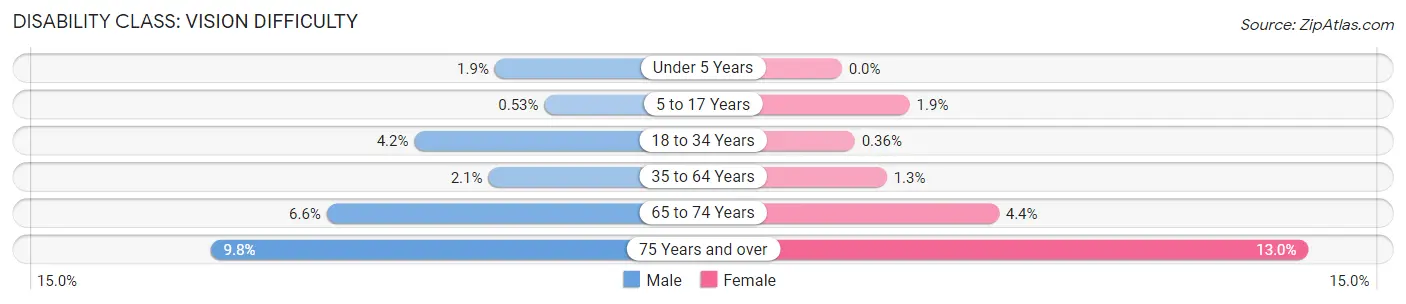
| Age Bracket | Male | Female |
| Under 5 Years | 41 (1.9%) | 0 (0.0%) |
| 5 to 17 Years | 32 (0.5%) | 90 (1.9%) |
| 18 to 34 Years | 305 (4.2%) | 23 (0.4%) |
| 35 to 64 Years | 206 (2.1%) | 123 (1.3%) |
| 65 to 74 Years | 109 (6.6%) | 83 (4.4%) |
| 75 Years and over | 80 (9.8%) | 162 (13.0%) |
Disability Class: Cognitive Difficulty
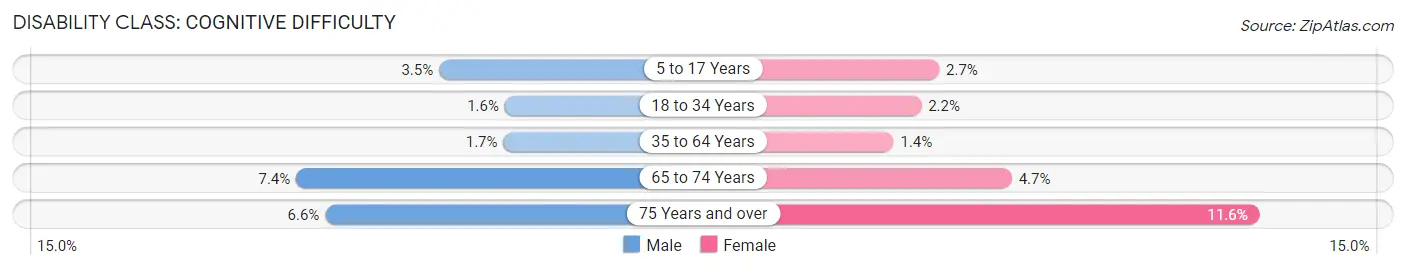
| Age Bracket | Male | Female |
| 5 to 17 Years | 210 (3.5%) | 129 (2.7%) |
| 18 to 34 Years | 120 (1.6%) | 141 (2.2%) |
| 35 to 64 Years | 165 (1.7%) | 142 (1.4%) |
| 65 to 74 Years | 123 (7.4%) | 90 (4.7%) |
| 75 Years and over | 54 (6.6%) | 145 (11.6%) |
Disability Class: Ambulatory Difficulty
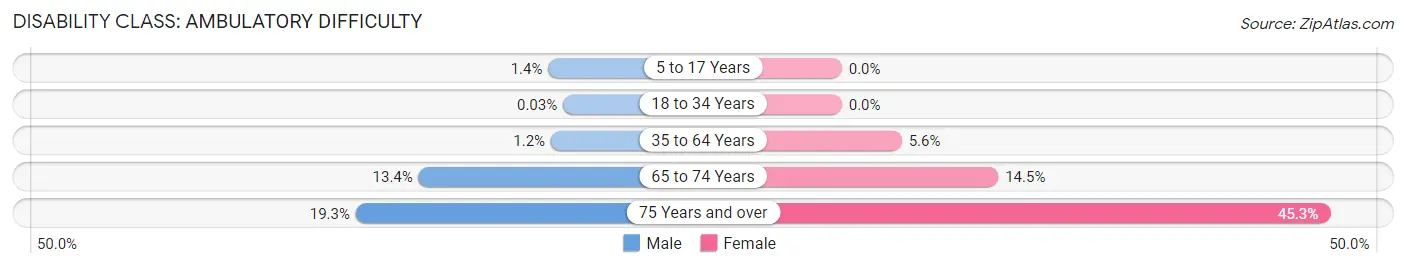
| Age Bracket | Male | Female |
| 5 to 17 Years | 85 (1.4%) | 0 (0.0%) |
| 18 to 34 Years | 2 (0.0%) | 0 (0.0%) |
| 35 to 64 Years | 113 (1.1%) | 547 (5.6%) |
| 65 to 74 Years | 222 (13.4%) | 276 (14.5%) |
| 75 Years and over | 157 (19.3%) | 565 (45.3%) |
Disability Class: Self-Care Difficulty
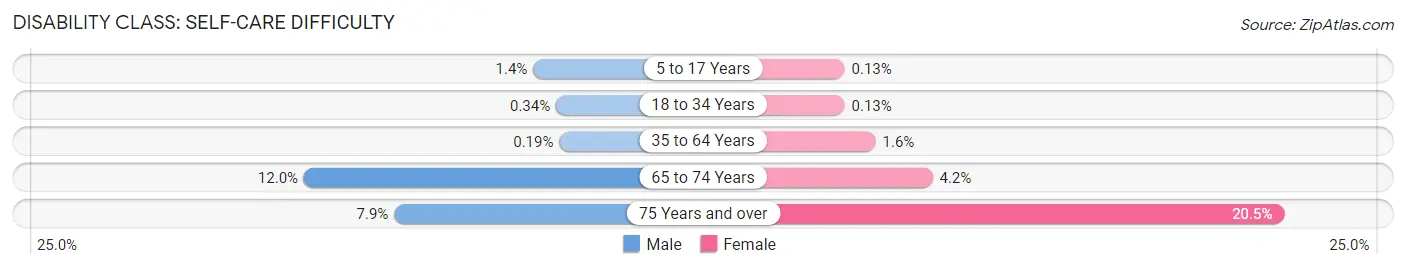
| Age Bracket | Male | Female |
| 5 to 17 Years | 85 (1.4%) | 6 (0.1%) |
| 18 to 34 Years | 25 (0.3%) | 8 (0.1%) |
| 35 to 64 Years | 19 (0.2%) | 154 (1.6%) |
| 65 to 74 Years | 199 (12.0%) | 80 (4.2%) |
| 75 Years and over | 64 (7.9%) | 256 (20.5%) |
Technology Access in Plainfield
Computing Device Access in Plainfield
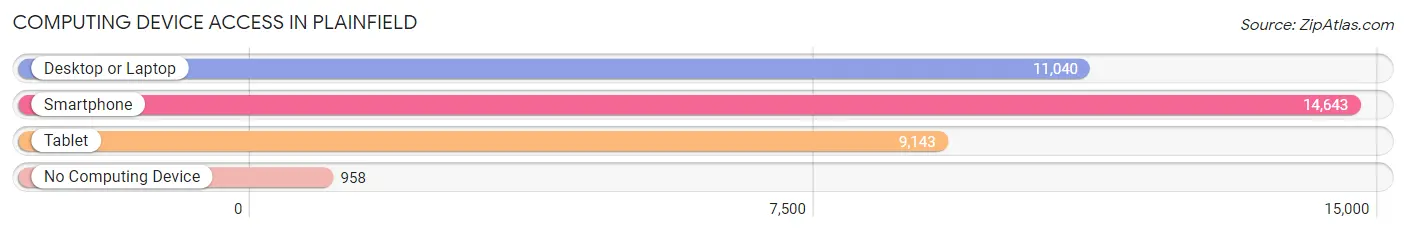
| Device Type | # Households | % Households |
| Desktop or Laptop | 11,040 | 67.1% |
| Smartphone | 14,643 | 89.0% |
| Tablet | 9,143 | 55.5% |
| No Computing Device | 958 | 5.8% |
| Total | 16,459 | 100.0% |
Internet Access in Plainfield
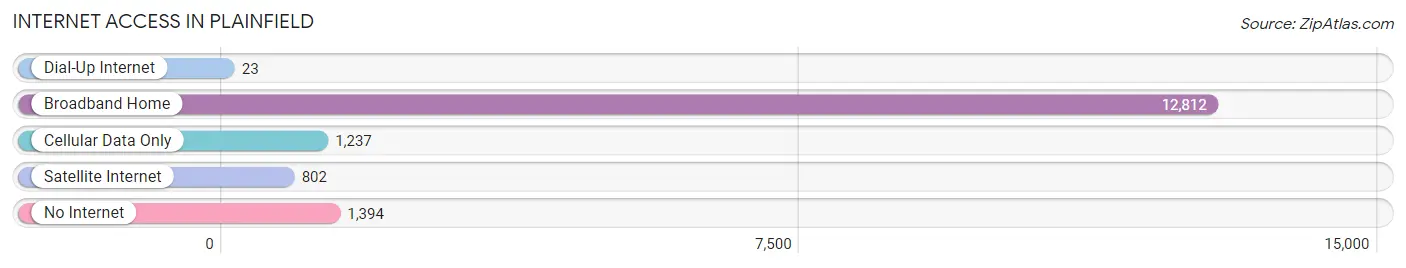
| Internet Type | # Households | % Households |
| Dial-Up Internet | 23 | 0.1% |
| Broadband Home | 12,812 | 77.8% |
| Cellular Data Only | 1,237 | 7.5% |
| Satellite Internet | 802 | 4.9% |
| No Internet | 1,394 | 8.5% |
| Total | 16,459 | 100.0% |
Plainfield Summary
Plainfield is a city located in Union County, New Jersey, United States. As of the 2010 United States Census, the city had a total population of 49,808, making it the 15th largest municipality in New Jersey. Plainfield is known for its diverse population and vibrant culture.
History
The area now known as Plainfield was originally inhabited by the Lenape Native Americans. The first European settlers arrived in the area in the late 17th century. The area was originally part of Elizabethtown, which was founded in 1664. In 1741, the area was officially incorporated as Plainfield Township.
In 1847, the township was divided into two parts, with the northern part becoming Fanwood Township and the southern part becoming Plainfield Township. In 1857, Plainfield Township was reincorporated as a town. In 1869, the town was reincorporated as a city.
Geography
Plainfield is located at 40°37'14" North, 74°23'45" West (40.620556, -74.395833). According to the United States Census Bureau, the city has a total area of 5.2 square miles (13.4 km2), all of which is land.
The city is located in the Raritan Valley region of New Jersey. It is bordered by North Plainfield to the north, Scotch Plains to the east, Edison to the south, and Westfield to the west.
Economy
Plainfield's economy is largely based on the service industry. The city is home to a variety of businesses, including restaurants, retail stores, and professional services. The city is also home to several corporate headquarters, including the headquarters of the Plainfield-based company, PSE&G.
Demographics
As of the 2010 United States Census, there were 49,808 people, 19,919 households, and 11,845 families residing in the city. The population density was 9,541.3 people per square mile (3,689.2/km2). There were 21,845 housing units at an average density of 4,212.3 per square mile (1,621.2/km2). The racial makeup of the city was 44.2% White, 33.2% African American, 0.3% Native American, 8.2% Asian, 0.1% Pacific Islander, 9.3% from other races, and 4.7% from two or more races. Hispanic or Latino of any race were 24.2% of the population.
There were 19,919 households, out of which 28.3% had children under the age of 18 living with them, 33.2% were married couples living together, 22.2% had a female householder with no husband present, and 38.7% were non-families. 32.2% of all households were made up of individuals, and 11.3% had someone living alone who was 65 years of age or older. The average household size was 2.50 and the average family size was 3.17.
In the city, the population was spread out, with 24.2% under the age of 18, 9.3% from 18 to 24, 29.7% from 25 to 44, 22.7% from 45 to 64, and 14.1% who were 65 years of age or older. The median age was 36 years. For every 100 females, there were 91.2 males. For every 100 females age 18 and over, there were 87.2 males.
The median income for a household in the city was $41,919, and the median income for a family was $50,817. Males had a median income of $37,845 versus $31,845 for females. The per capita income for the city was $21,945. About 11.3% of families and 14.3% of the population were below the poverty line, including 21.2% of those under age 18 and 10.2% of those age 65 or over.
Common Questions
What is Per Capita Income in Plainfield?
Per Capita income in Plainfield is $28,788.
What is the Median Family Income in Plainfield?
Median Family Income in Plainfield is $74,415.
What is the Median Household income in Plainfield?
Median Household Income in Plainfield is $70,712.
What is Income or Wage Gap in Plainfield?
Income or Wage Gap in Plainfield is 17.4%.
Women in Plainfield earn 82.6 cents for every dollar earned by a man.
What is Family Income Deficit in Plainfield?
Family Income Deficit in Plainfield is $9,868.
Families that are below poverty line in Plainfield earn $9,868 less on average than the poverty threshold level.
What is Inequality or Gini Index in Plainfield?
Inequality or Gini Index in Plainfield is 0.42.
What is the Total Population of Plainfield?
Total Population of Plainfield is 54,358.
What is the Total Male Population of Plainfield?
Total Male Population of Plainfield is 28,042.
What is the Total Female Population of Plainfield?
Total Female Population of Plainfield is 26,316.
What is the Ratio of Males per 100 Females in Plainfield?
There are 106.56 Males per 100 Females in Plainfield.
What is the Ratio of Females per 100 Males in Plainfield?
There are 93.84 Females per 100 Males in Plainfield.
What is the Median Population Age in Plainfield?
Median Population Age in Plainfield is 33.1 Years.
What is the Average Family Size in Plainfield
Average Family Size in Plainfield is 3.7 People.
What is the Average Household Size in Plainfield
Average Household Size in Plainfield is 3.2 People.
How Large is the Labor Force in Plainfield?
There are 29,588 People in the Labor Forcein in Plainfield.
What is the Percentage of People in the Labor Force in Plainfield?
72.1% of People are in the Labor Force in Plainfield.
What is the Unemployment Rate in Plainfield?
Unemployment Rate in Plainfield is 10.3%.