Cities with the Highest Percentage of Hispanic or Latino Population in Pennsylvania
RELATED REPORTS & OPTIONS
Hispanic or Latino
Pennsylvania
Compare Cities
Map of Cities with the Highest Percentage of Hispanic or Latino Population in Pennsylvania
0.0%
80.0%
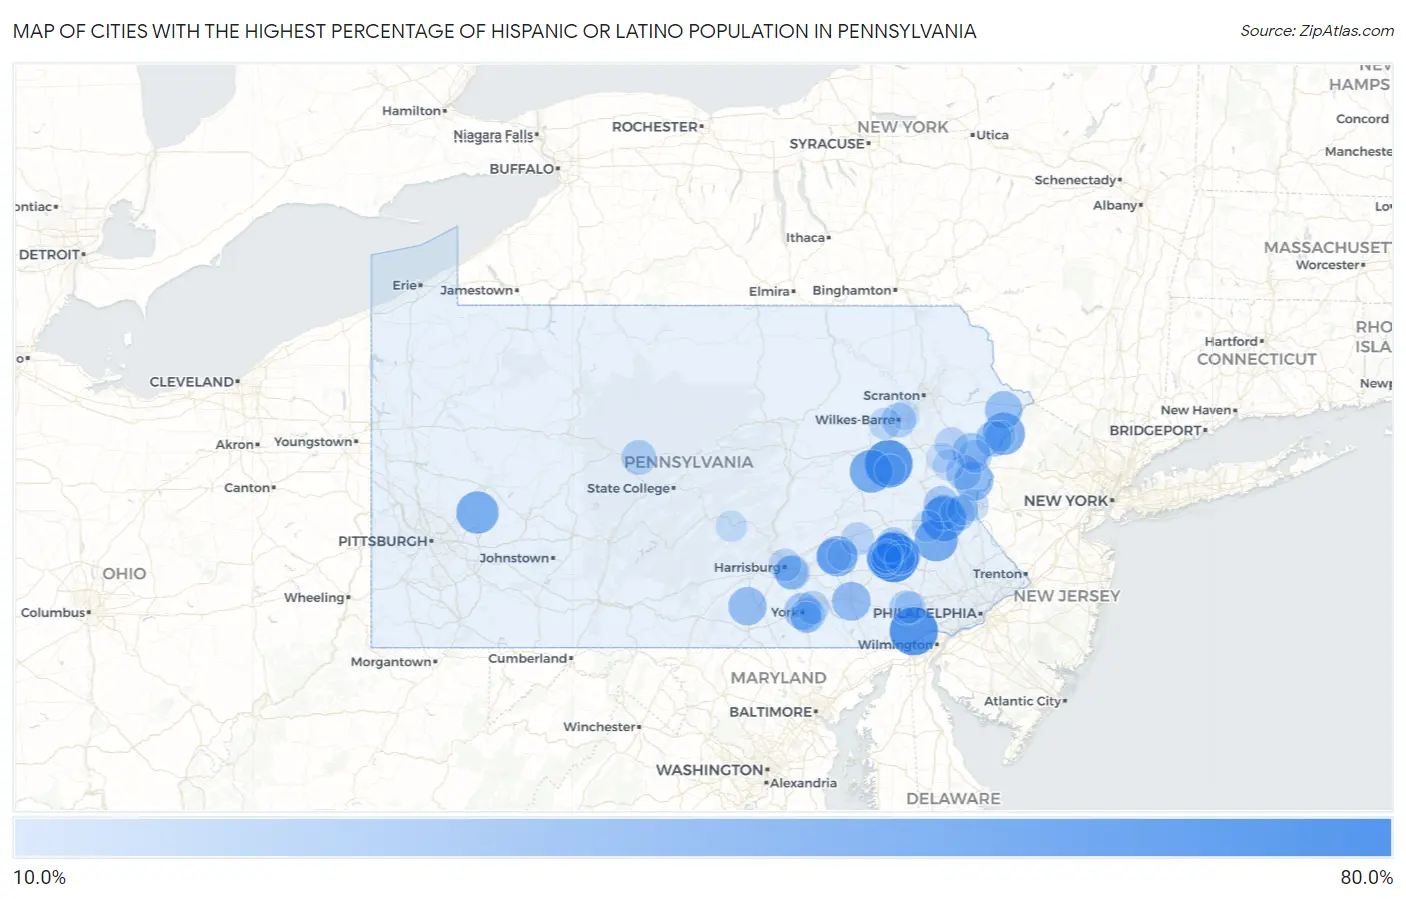
Cities with the Highest Percentage of Hispanic or Latino Population in Pennsylvania
| City | Hispanic or Latino | vs State | vs National | |
| 1. | Reading | 67.2% | 8.1%(+59.0)#1 | 18.7%(+48.5)#1,337 |
| 2. | West Hazleton Borough | 66.5% | 8.1%(+58.3)#2 | 18.7%(+47.8)#1,356 |
| 3. | Avondale Borough | 66.0% | 8.1%(+57.9)#3 | 18.7%(+47.4)#1,369 |
| 4. | Toughkenamon | 63.6% | 8.1%(+55.5)#4 | 18.7%(+44.9)#1,445 |
| 5. | Hazleton | 62.2% | 8.1%(+54.1)#5 | 18.7%(+43.6)#1,479 |
| 6. | Allentown | 54.3% | 8.1%(+46.2)#6 | 18.7%(+35.7)#1,765 |
| 7. | Oneida | 50.1% | 8.1%(+42.0)#7 | 18.7%(+31.5)#1,940 |
| 8. | Hereford | 50.1% | 8.1%(+42.0)#8 | 18.7%(+31.4)#1,942 |
| 9. | Hyde Park | 48.6% | 8.1%(+40.5)#9 | 18.7%(+29.9)#2,032 |
| 10. | Pocono Mountain Lake Estates | 48.3% | 8.1%(+40.2)#10 | 18.7%(+29.7)#2,049 |
| 11. | Lebanon | 43.9% | 8.1%(+35.8)#11 | 18.7%(+25.3)#2,274 |
| 12. | York Springs Borough | 41.8% | 8.1%(+33.6)#12 | 18.7%(+23.1)#2,398 |
| 13. | Ackermanville | 39.6% | 8.1%(+31.5)#13 | 18.7%(+21.0)#2,531 |
| 14. | Lancaster | 39.4% | 8.1%(+31.2)#14 | 18.7%(+20.7)#2,548 |
| 15. | Mifflintown Borough | 38.4% | 8.1%(+30.3)#15 | 18.7%(+19.7)#2,621 |
| 16. | Laureldale Borough | 38.3% | 8.1%(+30.2)#16 | 18.7%(+19.7)#2,625 |
| 17. | Gardners | 38.1% | 8.1%(+30.0)#17 | 18.7%(+19.5)#2,640 |
| 18. | Oxford Borough | 38.1% | 8.1%(+29.9)#18 | 18.7%(+19.4)#2,644 |
| 19. | Stony Creek Mills | 37.8% | 8.1%(+29.7)#19 | 18.7%(+19.2)#2,663 |
| 20. | Lincoln Park | 37.6% | 8.1%(+29.5)#20 | 18.7%(+19.0)#2,676 |
| 21. | Kimberton | 37.3% | 8.1%(+29.2)#21 | 18.7%(+18.6)#2,697 |
| 22. | Shenandoah Borough | 36.4% | 8.1%(+28.3)#22 | 18.7%(+17.8)#2,765 |
| 23. | Sunrise Lake | 36.4% | 8.1%(+28.3)#23 | 18.7%(+17.8)#2,767 |
| 24. | Kennett Square Borough | 35.4% | 8.1%(+27.3)#24 | 18.7%(+16.8)#2,852 |
| 25. | Fountain Hill Borough | 34.7% | 8.1%(+26.6)#25 | 18.7%(+16.1)#2,906 |
| 26. | Springmont | 34.6% | 8.1%(+26.5)#26 | 18.7%(+16.0)#2,919 |
| 27. | York | 34.0% | 8.1%(+25.9)#27 | 18.7%(+15.4)#2,980 |
| 28. | Penn Estates | 34.0% | 8.1%(+25.9)#28 | 18.7%(+15.3)#2,986 |
| 29. | Mount Pocono Borough | 33.2% | 8.1%(+25.0)#29 | 18.7%(+14.5)#3,064 |
| 30. | Bendersville Borough | 32.9% | 8.1%(+24.8)#30 | 18.7%(+14.3)#3,077 |
| 31. | Saw Creek | 32.3% | 8.1%(+24.2)#31 | 18.7%(+13.6)#3,142 |
| 32. | Mcadoo Borough | 31.7% | 8.1%(+23.6)#32 | 18.7%(+13.1)#3,202 |
| 33. | Kenhorst Borough | 31.5% | 8.1%(+23.4)#33 | 18.7%(+12.8)#3,228 |
| 34. | Freemansburg Borough | 31.4% | 8.1%(+23.3)#34 | 18.7%(+12.7)#3,240 |
| 35. | West Reading Borough | 31.2% | 8.1%(+23.1)#35 | 18.7%(+12.6)#3,260 |
| 36. | Temple | 30.7% | 8.1%(+22.6)#36 | 18.7%(+12.1)#3,315 |
| 37. | Pleasant Hill | 30.6% | 8.1%(+22.5)#37 | 18.7%(+12.0)#3,323 |
| 38. | Saylorsburg | 30.6% | 8.1%(+22.5)#38 | 18.7%(+12.0)#3,325 |
| 39. | Fullerton | 30.6% | 8.1%(+22.5)#39 | 18.7%(+12.0)#3,326 |
| 40. | Cementon | 30.5% | 8.1%(+22.4)#40 | 18.7%(+11.8)#3,345 |
| 41. | Bethlehem | 30.2% | 8.1%(+22.0)#41 | 18.7%(+11.5)#3,377 |
| 42. | Queens Gate | 30.0% | 8.1%(+21.8)#42 | 18.7%(+11.3)#3,399 |
| 43. | Bressler | 29.9% | 8.1%(+21.7)#43 | 18.7%(+11.2)#3,411 |
| 44. | Kylertown | 29.1% | 8.1%(+21.0)#44 | 18.7%(+10.5)#3,488 |
| 45. | Wilkes Barre | 29.1% | 8.1%(+21.0)#45 | 18.7%(+10.5)#3,495 |
| 46. | Casanova | 29.1% | 8.1%(+21.0)#46 | 18.7%(+10.5)#3,496 |
| 47. | Mount Penn Borough | 28.0% | 8.1%(+19.9)#47 | 18.7%(+9.37)#3,628 |
| 48. | Coatesville | 27.8% | 8.1%(+19.7)#48 | 18.7%(+9.18)#3,648 |
| 49. | Coplay Borough | 27.8% | 8.1%(+19.7)#49 | 18.7%(+9.17)#3,650 |
| 50. | S N P J Borough | 27.8% | 8.1%(+19.7)#50 | 18.7%(+9.13)#3,657 |
| 51. | Norristown Borough | 27.4% | 8.1%(+19.3)#51 | 18.7%(+8.74)#3,706 |
| 52. | South Temple | 26.9% | 8.1%(+18.8)#52 | 18.7%(+8.24)#3,780 |
| 53. | Enhaut | 26.3% | 8.1%(+18.2)#53 | 18.7%(+7.63)#3,862 |
| 54. | Yorklyn | 25.7% | 8.1%(+17.6)#54 | 18.7%(+7.07)#3,919 |
| 55. | Arlington Heights | 25.6% | 8.1%(+17.5)#55 | 18.7%(+6.94)#3,941 |
| 56. | Emerald Lakes | 25.2% | 8.1%(+17.1)#56 | 18.7%(+6.53)#3,989 |
| 57. | Rehrersburg | 25.2% | 8.1%(+17.0)#57 | 18.7%(+6.52)#3,991 |
| 58. | Harrisburg | 24.7% | 8.1%(+16.6)#58 | 18.7%(+6.04)#4,057 |
| 59. | West Grove Borough | 24.2% | 8.1%(+16.1)#59 | 18.7%(+5.56)#4,137 |
| 60. | Wilson Borough | 24.1% | 8.1%(+16.0)#60 | 18.7%(+5.48)#4,153 |
| 61. | Windsor Borough | 24.1% | 8.1%(+15.9)#61 | 18.7%(+5.41)#4,177 |
| 62. | Columbia Borough | 23.5% | 8.1%(+15.3)#62 | 18.7%(+4.80)#4,279 |
| 63. | Macungie Borough | 23.4% | 8.1%(+15.3)#63 | 18.7%(+4.77)#4,289 |
| 64. | Portland Borough | 23.3% | 8.1%(+15.1)#64 | 18.7%(+4.62)#4,317 |
| 65. | Easton | 23.2% | 8.1%(+15.1)#65 | 18.7%(+4.56)#4,326 |
| 66. | Steelton Borough | 23.1% | 8.1%(+15.0)#66 | 18.7%(+4.43)#4,350 |
| 67. | West Nanticoke | 22.5% | 8.1%(+14.4)#67 | 18.7%(+3.89)#4,441 |
| 68. | Caln | 22.2% | 8.1%(+14.1)#68 | 18.7%(+3.56)#4,505 |
| 69. | West York Borough | 22.2% | 8.1%(+14.1)#69 | 18.7%(+3.54)#4,509 |
| 70. | Bear Creek Village Borough | 22.2% | 8.1%(+14.1)#70 | 18.7%(+3.54)#4,510 |
| 71. | Hawley Borough | 21.6% | 8.1%(+13.5)#71 | 18.7%(+2.97)#4,613 |
| 72. | Breinigsville | 21.5% | 8.1%(+13.4)#72 | 18.7%(+2.86)#4,631 |
| 73. | Shillington Borough | 21.5% | 8.1%(+13.4)#73 | 18.7%(+2.82)#4,642 |
| 74. | Effort | 21.4% | 8.1%(+13.3)#74 | 18.7%(+2.74)#4,663 |
| 75. | Tyler Run | 21.3% | 8.1%(+13.1)#75 | 18.7%(+2.60)#4,690 |
| 76. | Gratz Borough | 21.0% | 8.1%(+12.9)#76 | 18.7%(+2.34)#4,743 |
| 77. | Penbrook Borough | 21.0% | 8.1%(+12.8)#77 | 18.7%(+2.30)#4,758 |
| 78. | West Lawn | 20.6% | 8.1%(+12.5)#78 | 18.7%(+1.94)#4,828 |
| 79. | West Easton Borough | 20.6% | 8.1%(+12.5)#79 | 18.7%(+1.94)#4,829 |
| 80. | Mexico | 20.5% | 8.1%(+12.4)#80 | 18.7%(+1.88)#4,838 |
| 81. | Tresckow | 20.3% | 8.1%(+12.2)#81 | 18.7%(+1.69)#4,888 |
| 82. | New Oxford Borough | 20.1% | 8.1%(+12.0)#82 | 18.7%(+1.46)#4,944 |
| 83. | South Coatesville Borough | 19.7% | 8.1%(+11.6)#83 | 18.7%(+1.05)#5,035 |
| 84. | Pine Ridge | 19.7% | 8.1%(+11.5)#84 | 18.7%(+1.01)#5,045 |
| 85. | Chambersburg Borough | 19.6% | 8.1%(+11.5)#85 | 18.7%(+0.995)#5,049 |
| 86. | Pennside | 19.6% | 8.1%(+11.5)#86 | 18.7%(+0.928)#5,065 |
| 87. | Fox Chase | 19.6% | 8.1%(+11.4)#87 | 18.7%(+0.909)#5,074 |
| 88. | Stroudsburg Borough | 19.4% | 8.1%(+11.3)#88 | 18.7%(+0.748)#5,112 |
| 89. | Alburtis Borough | 19.4% | 8.1%(+11.3)#89 | 18.7%(+0.733)#5,115 |
| 90. | West Wyomissing | 19.3% | 8.1%(+11.2)#90 | 18.7%(+0.693)#5,124 |
| 91. | Middletown | 19.1% | 8.1%(+11.0)#91 | 18.7%(+0.451)#5,167 |
| 92. | Manchester Borough | 18.8% | 8.1%(+10.6)#92 | 18.7%(+0.120)#5,234 |
| 93. | Avon | 18.7% | 8.1%(+10.6)#93 | 18.7%(+0.049)#5,256 |
| 94. | East Stroudsburg Borough | 18.6% | 8.1%(+10.5)#94 | 18.7%(-0.043)#5,273 |
| 95. | Freeland Borough | 18.6% | 8.1%(+10.5)#95 | 18.7%(-0.055)#5,278 |
| 96. | Reiffton | 18.2% | 8.1%(+10.1)#96 | 18.7%(-0.437)#5,376 |
| 97. | Indian Mountain Lake | 18.0% | 8.1%(+9.93)#97 | 18.7%(-0.603)#5,428 |
| 98. | Hudson | 17.9% | 8.1%(+9.79)#98 | 18.7%(-0.743)#5,471 |
| 99. | North Catasauqua Borough | 17.6% | 8.1%(+9.50)#99 | 18.7%(-1.03)#5,547 |
| 100. | Colony Park | 17.6% | 8.1%(+9.50)#100 | 18.7%(-1.03)#5,548 |
Common Questions
What are the Top 10 Cities with the Highest Percentage of Hispanic or Latino Population in Pennsylvania?
Top 10 Cities with the Highest Percentage of Hispanic or Latino Population in Pennsylvania are:
#1
67.2%
#2
63.6%
#3
62.2%
#4
54.3%
#5
50.1%
#6
50.1%
#7
48.6%
#8
48.3%
#9
43.9%
#10
39.6%
What city has the Highest Percentage of Hispanic or Latino Population in Pennsylvania?
Reading has the Highest Percentage of Hispanic or Latino Population in Pennsylvania with 67.2%.
What is the Percentage of Hispanic or Latino Population in the State of Pennsylvania?
Percentage of Hispanic or Latino Population in Pennsylvania is 8.1%.
What is the Percentage of Hispanic or Latino Population in the United States?
Percentage of Hispanic or Latino Population in the United States is 18.7%.