Cities with the Highest Percentage of Hispanic or Latino Population in Tennessee
RELATED REPORTS & OPTIONS
Hispanic or Latino
Tennessee
Compare Cities
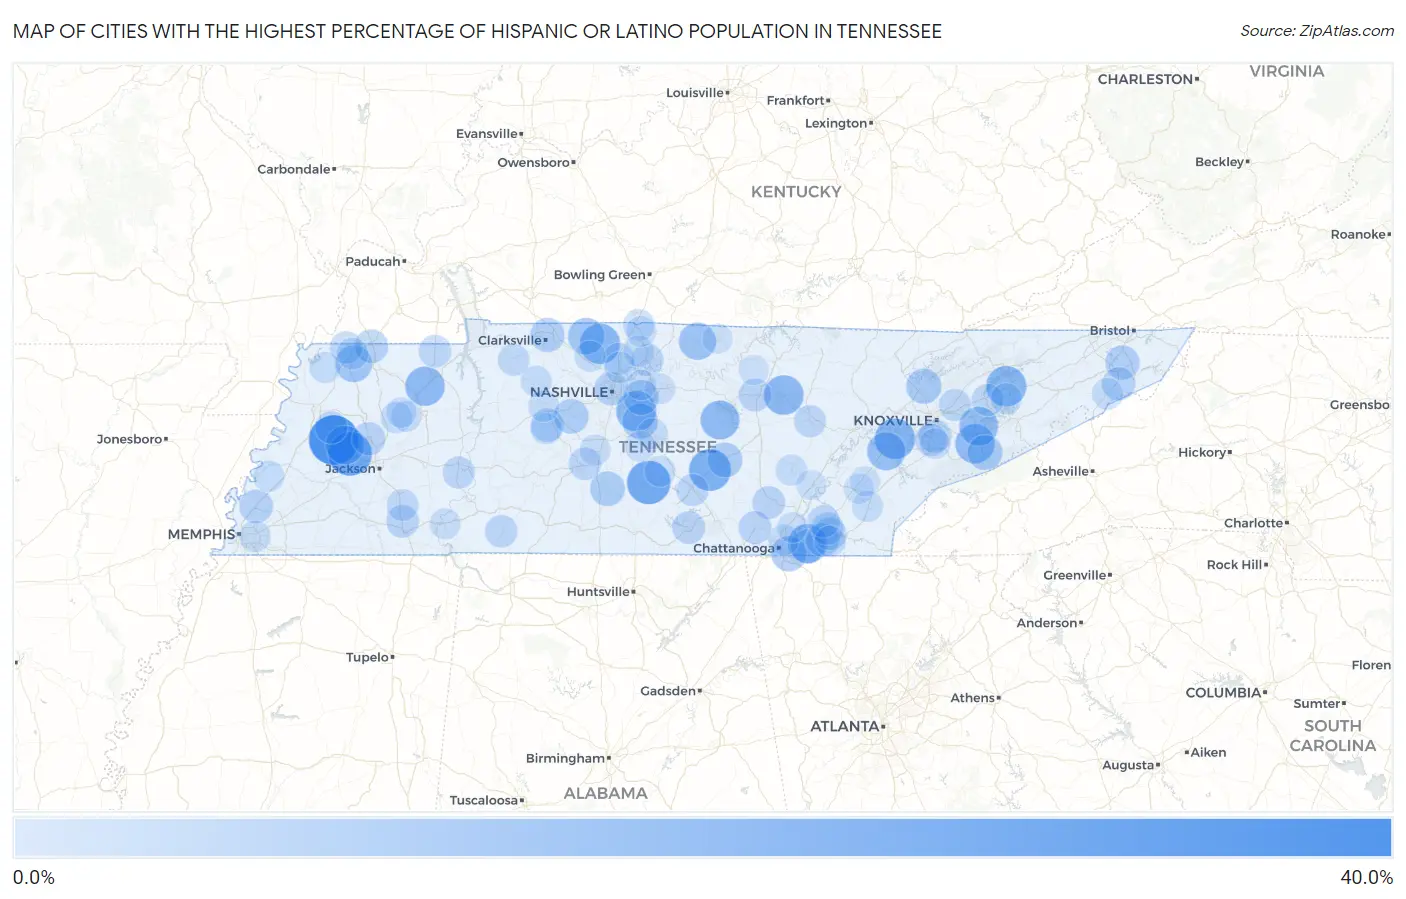
Map of Cities with the Highest Percentage of Hispanic or Latino Population in Tennessee
0.0%
40.0%
Cities with the Highest Percentage of Hispanic or Latino Population in Tennessee
| City | Hispanic or Latino | vs State | vs National | |
| 1. | Maury City | 32.7% | 6.0%(+26.7)#1 | 18.7%(+14.0)#3,092 |
| 2. | Mayland | 28.8% | 6.0%(+22.8)#2 | 18.7%(+10.1)#3,532 |
| 3. | Bells | 25.1% | 6.0%(+19.2)#3 | 18.7%(+6.47)#4,000 |
| 4. | Shelbyville | 24.4% | 6.0%(+18.4)#4 | 18.7%(+5.74)#4,115 |
| 5. | Morrison | 22.2% | 6.0%(+16.2)#5 | 18.7%(+3.52)#4,511 |
| 6. | Lenoir City | 20.3% | 6.0%(+14.3)#6 | 18.7%(+1.62)#4,901 |
| 7. | Morristown | 20.0% | 6.0%(+14.1)#7 | 18.7%(+1.37)#4,965 |
| 8. | Springfield | 19.9% | 6.0%(+13.9)#8 | 18.7%(+1.20)#4,994 |
| 9. | La Vergne | 19.8% | 6.0%(+13.9)#9 | 18.7%(+1.18)#5,000 |
| 10. | Monterey | 19.1% | 6.0%(+13.1)#10 | 18.7%(+0.432)#5,172 |
| 11. | Ooltewah | 18.6% | 6.0%(+12.7)#11 | 18.7%(-0.037)#5,270 |
| 12. | Pigeon Forge | 18.6% | 6.0%(+12.7)#12 | 18.7%(-0.039)#5,271 |
| 13. | Henry | 18.6% | 6.0%(+12.6)#13 | 18.7%(-0.043)#5,274 |
| 14. | Smithville | 18.2% | 6.0%(+12.2)#14 | 18.7%(-0.486)#5,392 |
| 15. | Sevierville | 18.0% | 6.0%(+12.1)#15 | 18.7%(-0.627)#5,438 |
| 16. | Alamo | 18.0% | 6.0%(+12.0)#16 | 18.7%(-0.689)#5,450 |
| 17. | Loudon | 17.1% | 6.0%(+11.1)#17 | 18.7%(-1.60)#5,722 |
| 18. | Lafayette | 15.8% | 6.0%(+9.83)#18 | 18.7%(-2.86)#6,121 |
| 19. | Rives | 15.2% | 6.0%(+9.24)#19 | 18.7%(-3.46)#6,292 |
| 20. | Cedar Hill | 14.8% | 6.0%(+8.89)#20 | 18.7%(-3.81)#6,420 |
| 21. | Smyrna | 13.5% | 6.0%(+7.59)#21 | 18.7%(-5.10)#6,899 |
| 22. | East Ridge | 13.3% | 6.0%(+7.38)#22 | 18.7%(-5.32)#6,992 |
| 23. | Andersonville | 13.1% | 6.0%(+7.18)#23 | 18.7%(-5.51)#7,074 |
| 24. | Rural Hill | 13.0% | 6.0%(+7.09)#24 | 18.7%(-5.61)#7,116 |
| 25. | Gatlinburg | 12.9% | 6.0%(+6.94)#25 | 18.7%(-5.75)#7,187 |
| 26. | Mcminnville | 12.7% | 6.0%(+6.71)#26 | 18.7%(-5.98)#7,290 |
| 27. | Lewisburg | 12.5% | 6.0%(+6.59)#27 | 18.7%(-6.10)#7,334 |
| 28. | Fairview | 12.4% | 6.0%(+6.42)#28 | 18.7%(-6.28)#7,406 |
| 29. | Clarksville | 11.9% | 6.0%(+5.92)#29 | 18.7%(-6.77)#7,654 |
| 30. | Watauga | 11.8% | 6.0%(+5.81)#30 | 18.7%(-6.89)#7,712 |
| 31. | Collegedale | 11.4% | 6.0%(+5.40)#31 | 18.7%(-7.29)#7,932 |
| 32. | Millington | 11.1% | 6.0%(+5.13)#32 | 18.7%(-7.56)#8,074 |
| 33. | South Fulton | 11.0% | 6.0%(+5.03)#33 | 18.7%(-7.67)#8,128 |
| 34. | South Cleveland | 10.8% | 6.0%(+4.88)#34 | 18.7%(-7.81)#8,214 |
| 35. | Nashville | 10.8% | 6.0%(+4.80)#35 | 18.7%(-7.89)#8,254 |
| 36. | Lyles | 10.7% | 6.0%(+4.70)#36 | 18.7%(-7.99)#8,301 |
| 37. | Humboldt | 10.5% | 6.0%(+4.52)#37 | 18.7%(-8.17)#8,418 |
| 38. | Unicoi | 10.5% | 6.0%(+4.51)#38 | 18.7%(-8.18)#8,426 |
| 39. | Rockford | 10.2% | 6.0%(+4.29)#39 | 18.7%(-8.40)#8,560 |
| 40. | Cookeville | 10.1% | 6.0%(+4.13)#40 | 18.7%(-8.56)#8,648 |
| 41. | Winchester | 10.0% | 6.0%(+4.01)#41 | 18.7%(-8.68)#8,736 |
| 42. | Dunlap | 9.9% | 6.0%(+3.98)#42 | 18.7%(-8.71)#8,757 |
| 43. | Whitwell | 9.9% | 6.0%(+3.97)#43 | 18.7%(-8.72)#8,764 |
| 44. | East Cleveland | 9.9% | 6.0%(+3.92)#44 | 18.7%(-8.77)#8,792 |
| 45. | Bethel Springs | 9.9% | 6.0%(+3.92)#45 | 18.7%(-8.77)#8,793 |
| 46. | Columbia | 9.7% | 6.0%(+3.72)#46 | 18.7%(-8.97)#8,918 |
| 47. | Puryear | 9.6% | 6.0%(+3.67)#47 | 18.7%(-9.02)#8,953 |
| 48. | Bon Air | 9.6% | 6.0%(+3.65)#48 | 18.7%(-9.04)#8,974 |
| 49. | Woodland Mills | 9.5% | 6.0%(+3.53)#49 | 18.7%(-9.16)#9,056 |
| 50. | Collinwood | 9.5% | 6.0%(+3.52)#50 | 18.7%(-9.17)#9,062 |
| 51. | Cleveland | 9.5% | 6.0%(+3.52)#51 | 18.7%(-9.18)#9,063 |
| 52. | Hopewell | 9.5% | 6.0%(+3.51)#52 | 18.7%(-9.18)#9,067 |
| 53. | Pocahontas | 9.4% | 6.0%(+3.48)#53 | 18.7%(-9.21)#9,095 |
| 54. | Friendship | 9.4% | 6.0%(+3.42)#54 | 18.7%(-9.28)#9,136 |
| 55. | Gallatin | 9.4% | 6.0%(+3.41)#55 | 18.7%(-9.28)#9,142 |
| 56. | Mascot | 9.3% | 6.0%(+3.36)#56 | 18.7%(-9.33)#9,166 |
| 57. | Alcoa | 9.3% | 6.0%(+3.32)#57 | 18.7%(-9.37)#9,191 |
| 58. | Jefferson City | 9.1% | 6.0%(+3.11)#58 | 18.7%(-9.58)#9,374 |
| 59. | Decaturville | 9.1% | 6.0%(+3.10)#59 | 18.7%(-9.59)#9,383 |
| 60. | Manchester | 9.1% | 6.0%(+3.10)#60 | 18.7%(-9.60)#9,388 |
| 61. | Crossville | 9.0% | 6.0%(+3.06)#61 | 18.7%(-9.63)#9,408 |
| 62. | Finger | 8.8% | 6.0%(+2.87)#62 | 18.7%(-9.82)#9,553 |
| 63. | Millersville | 8.6% | 6.0%(+2.63)#63 | 18.7%(-10.1)#9,750 |
| 64. | Cumberland City | 8.5% | 6.0%(+2.58)#64 | 18.7%(-10.1)#9,787 |
| 65. | Goodlettsville | 8.4% | 6.0%(+2.42)#65 | 18.7%(-10.3)#9,918 |
| 66. | Union City | 8.4% | 6.0%(+2.42)#66 | 18.7%(-10.3)#9,921 |
| 67. | White Pine | 8.3% | 6.0%(+2.31)#67 | 18.7%(-10.4)#10,032 |
| 68. | Mitchellville | 8.1% | 6.0%(+2.15)#68 | 18.7%(-10.5)#10,171 |
| 69. | Atwood | 8.1% | 6.0%(+2.10)#69 | 18.7%(-10.6)#10,236 |
| 70. | Memphis | 8.0% | 6.0%(+2.06)#70 | 18.7%(-10.6)#10,268 |
| 71. | Wrigley | 8.0% | 6.0%(+2.04)#71 | 18.7%(-10.7)#10,286 |
| 72. | Wildwood Lake | 8.0% | 6.0%(+2.02)#72 | 18.7%(-10.7)#10,303 |
| 73. | Hornbeak | 8.0% | 6.0%(+2.01)#73 | 18.7%(-10.7)#10,315 |
| 74. | Erwin | 8.0% | 6.0%(+2.01)#74 | 18.7%(-10.7)#10,318 |
| 75. | Pikeville | 7.9% | 6.0%(+1.91)#75 | 18.7%(-10.8)#10,396 |
| 76. | Dickson | 7.8% | 6.0%(+1.87)#76 | 18.7%(-10.8)#10,441 |
| 77. | Burlison | 7.8% | 6.0%(+1.83)#77 | 18.7%(-10.9)#10,477 |
| 78. | Vanleer | 7.8% | 6.0%(+1.81)#78 | 18.7%(-10.9)#10,497 |
| 79. | Coopertown | 7.8% | 6.0%(+1.80)#79 | 18.7%(-10.9)#10,506 |
| 80. | Etowah | 7.7% | 6.0%(+1.76)#80 | 18.7%(-10.9)#10,543 |
| 81. | Savannah | 7.6% | 6.0%(+1.62)#81 | 18.7%(-11.1)#10,700 |
| 82. | Bell Buckle | 7.6% | 6.0%(+1.61)#82 | 18.7%(-11.1)#10,709 |
| 83. | Chattanooga | 7.6% | 6.0%(+1.61)#83 | 18.7%(-11.1)#10,712 |
| 84. | Spring Hill | 7.6% | 6.0%(+1.60)#84 | 18.7%(-11.1)#10,719 |
| 85. | Cottontown | 7.5% | 6.0%(+1.58)#85 | 18.7%(-11.1)#10,742 |
| 86. | Murfreesboro | 7.4% | 6.0%(+1.45)#86 | 18.7%(-11.2)#10,853 |
| 87. | Mclemoresville | 7.3% | 6.0%(+1.35)#87 | 18.7%(-11.3)#10,943 |
| 88. | Middle Valley | 7.3% | 6.0%(+1.34)#88 | 18.7%(-11.4)#10,954 |
| 89. | Eagleton Village | 7.1% | 6.0%(+1.14)#89 | 18.7%(-11.6)#11,144 |
| 90. | Lebanon | 7.0% | 6.0%(+1.08)#90 | 18.7%(-11.6)#11,196 |
| 91. | Rockvale | 7.0% | 6.0%(+1.03)#91 | 18.7%(-11.7)#11,250 |
| 92. | Portland | 7.0% | 6.0%(+0.992)#92 | 18.7%(-11.7)#11,294 |
| 93. | Trezevant | 6.9% | 6.0%(+0.958)#93 | 18.7%(-11.7)#11,330 |
| 94. | Mount Juliet | 6.7% | 6.0%(+0.788)#94 | 18.7%(-11.9)#11,505 |
| 95. | Athens | 6.7% | 6.0%(+0.754)#95 | 18.7%(-11.9)#11,544 |
| 96. | Niota | 6.7% | 6.0%(+0.707)#96 | 18.7%(-12.0)#11,598 |
| 97. | Sullivan Gardens | 6.6% | 6.0%(+0.642)#97 | 18.7%(-12.1)#11,668 |
| 98. | Dayton | 6.6% | 6.0%(+0.596)#98 | 18.7%(-12.1)#11,724 |
| 99. | Red Boiling Springs | 6.5% | 6.0%(+0.574)#99 | 18.7%(-12.1)#11,741 |
| 100. | Dodson Branch | 6.5% | 6.0%(+0.568)#100 | 18.7%(-12.1)#11,750 |
Common Questions
What are the Top 10 Cities with the Highest Percentage of Hispanic or Latino Population in Tennessee?
Top 10 Cities with the Highest Percentage of Hispanic or Latino Population in Tennessee are:
#1
32.7%
#2
25.1%
#3
24.4%
#4
22.2%
#5
20.3%
#6
20.0%
#7
19.9%
#8
19.8%
#9
19.1%
#10
18.6%
What city has the Highest Percentage of Hispanic or Latino Population in Tennessee?
Maury City has the Highest Percentage of Hispanic or Latino Population in Tennessee with 32.7%.
What is the Percentage of Hispanic or Latino Population in the State of Tennessee?
Percentage of Hispanic or Latino Population in Tennessee is 6.0%.
What is the Percentage of Hispanic or Latino Population in the United States?
Percentage of Hispanic or Latino Population in the United States is 18.7%.