South Toms River borough, NJ Map & Demographics
South Toms River borough Overview
$31,800
PER CAPITA INCOME
$95,971
AVG FAMILY INCOME
$96,688
AVG HOUSEHOLD INCOME
35.1%
WAGE / INCOME GAP [ % ]
64.9¢/ $1
WAGE / INCOME GAP [ $ ]
0.29
INEQUALITY / GINI INDEX
3,662
TOTAL POPULATION
1,718
MALE POPULATION
1,944
FEMALE POPULATION
88.37
MALES / 100 FEMALES
113.15
FEMALES / 100 MALES
33.7
MEDIAN AGE
3.5
AVG FAMILY SIZE
3.3
AVG HOUSEHOLD SIZE
1,996
LABOR FORCE [ PEOPLE ]
72.4%
PERCENT IN LABOR FORCE
8.1%
UNEMPLOYMENT RATE
Income in South Toms River borough
Income Overview in South Toms River borough
Per Capita Income in South Toms River borough is $31,800, while median incomes of families and households are $95,971 and $96,688 respectively.
| Characteristic | Number | Measure |
| Per Capita Income | 3,662 | $31,800 |
| Median Family Income | 951 | $95,971 |
| Mean Family Income | 951 | $100,875 |
| Median Household Income | 1,098 | $96,688 |
| Mean Household Income | 1,098 | $104,074 |
| Income Deficit | 951 | $0 |
| Wage / Income Gap (%) | 3,662 | 35.13% |
| Wage / Income Gap ($) | 3,662 | 64.87¢ per $1 |
| Gini / Inequality Index | 3,662 | 0.29 |
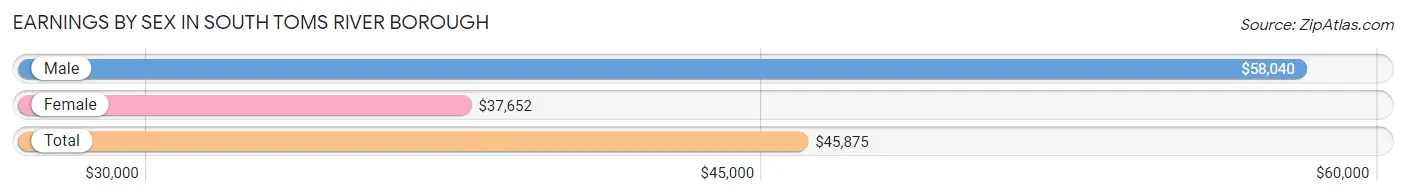
Earnings by Sex in South Toms River borough
Average Earnings in South Toms River borough are $45,875, $58,040 for men and $37,652 for women, a difference of 35.1%.
| Sex | Number | Average Earnings |
| Male | 1,015 (50.0%) | $58,040 |
| Female | 1,014 (50.0%) | $37,652 |
| Total | 2,029 (100.0%) | $45,875 |
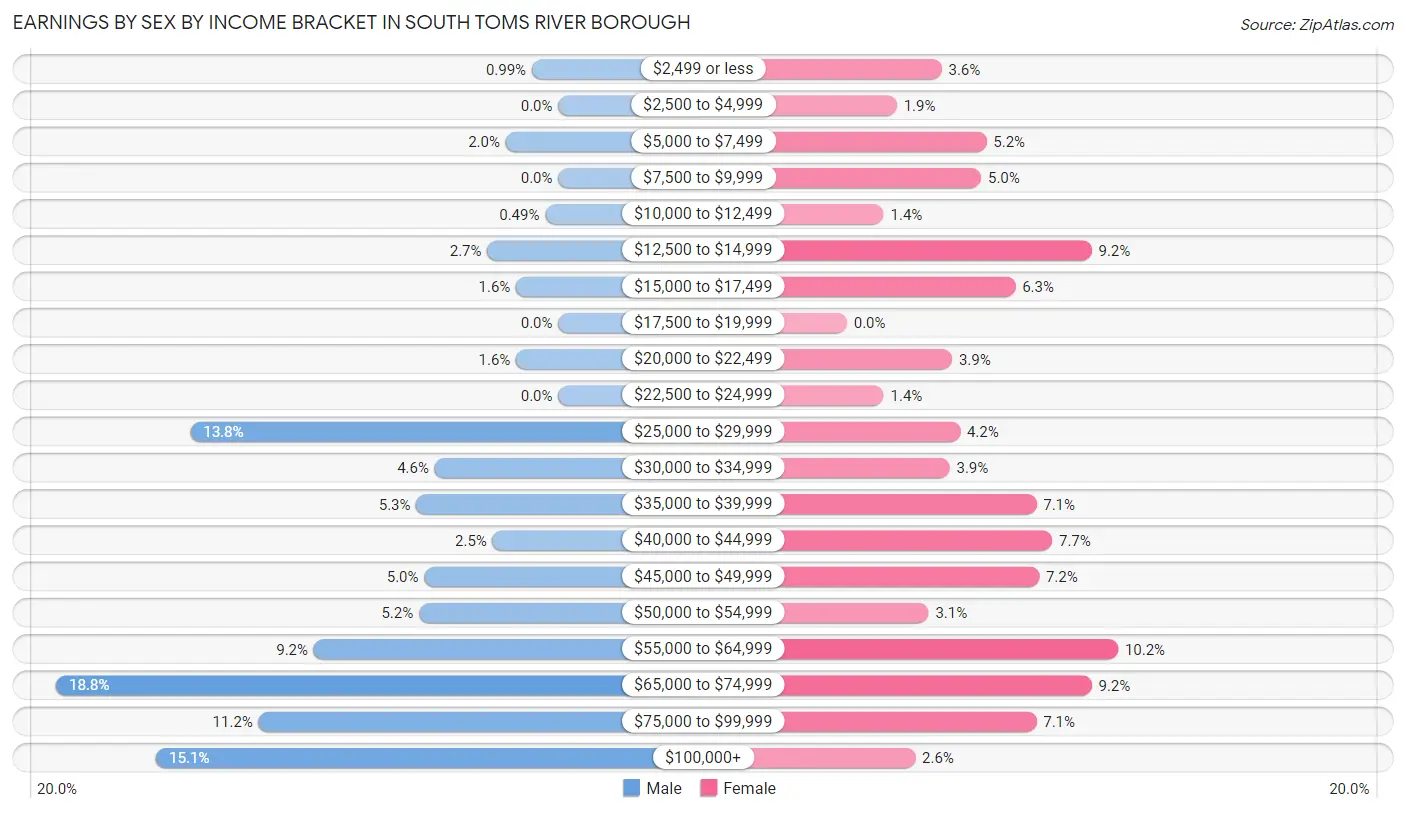
Earnings by Sex by Income Bracket in South Toms River borough
The most common earnings brackets in South Toms River borough are $65,000 to $74,999 for men (191 | 18.8%) and $55,000 to $64,999 for women (103 | 10.2%).
| Income | Male | Female |
| $2,499 or less | 10 (1.0%) | 36 (3.5%) |
| $2,500 to $4,999 | 0 (0.0%) | 19 (1.9%) |
| $5,000 to $7,499 | 20 (2.0%) | 53 (5.2%) |
| $7,500 to $9,999 | 0 (0.0%) | 51 (5.0%) |
| $10,000 to $12,499 | 5 (0.5%) | 14 (1.4%) |
| $12,500 to $14,999 | 27 (2.7%) | 93 (9.2%) |
| $15,000 to $17,499 | 16 (1.6%) | 64 (6.3%) |
| $17,500 to $19,999 | 0 (0.0%) | 0 (0.0%) |
| $20,000 to $22,499 | 16 (1.6%) | 40 (3.9%) |
| $22,500 to $24,999 | 0 (0.0%) | 14 (1.4%) |
| $25,000 to $29,999 | 140 (13.8%) | 43 (4.2%) |
| $30,000 to $34,999 | 47 (4.6%) | 39 (3.8%) |
| $35,000 to $39,999 | 54 (5.3%) | 72 (7.1%) |
| $40,000 to $44,999 | 25 (2.5%) | 78 (7.7%) |
| $45,000 to $49,999 | 51 (5.0%) | 73 (7.2%) |
| $50,000 to $54,999 | 53 (5.2%) | 31 (3.1%) |
| $55,000 to $64,999 | 93 (9.2%) | 103 (10.2%) |
| $65,000 to $74,999 | 191 (18.8%) | 93 (9.2%) |
| $75,000 to $99,999 | 114 (11.2%) | 72 (7.1%) |
| $100,000+ | 153 (15.1%) | 26 (2.6%) |
| Total | 1,015 (100.0%) | 1,014 (100.0%) |
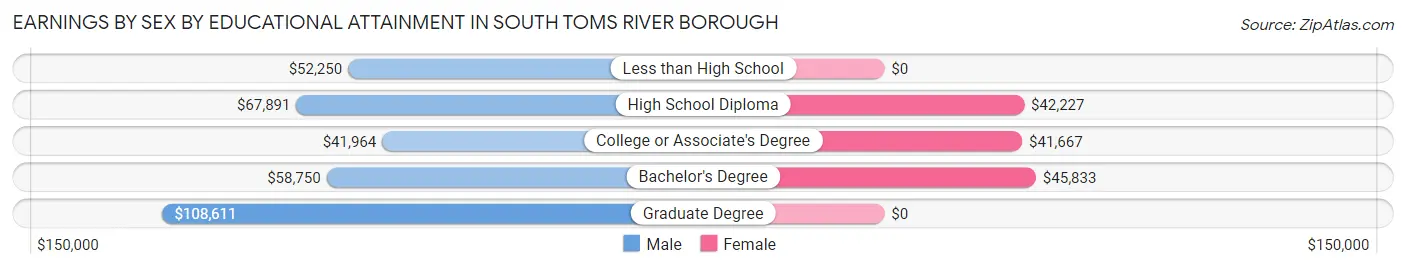
Earnings by Sex by Educational Attainment in South Toms River borough
Average earnings in South Toms River borough are $65,819 for men and $42,036 for women, a difference of 36.1%. Men with an educational attainment of graduate degree enjoy the highest average annual earnings of $108,611, while those with college or associate's degree education earn the least with $41,964. Women with an educational attainment of bachelor's degree earn the most with the average annual earnings of $45,833, while those with college or associate's degree education have the smallest earnings of $41,667.
| Educational Attainment | Male Income | Female Income |
| Less than High School | $52,250 | $0 |
| High School Diploma | $67,891 | $42,227 |
| College or Associate's Degree | $41,964 | $41,667 |
| Bachelor's Degree | $58,750 | $45,833 |
| Graduate Degree | $108,611 | $0 |
| Total | $65,819 | $42,036 |
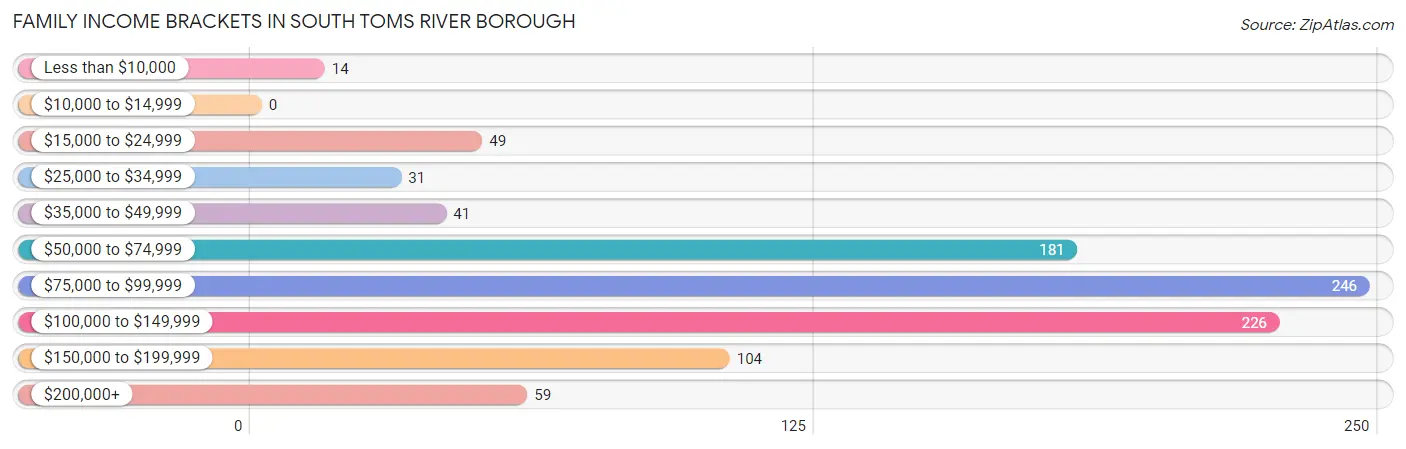
Family Income in South Toms River borough
Family Income Brackets in South Toms River borough
According to the South Toms River borough family income data, there are 246 families falling into the $75,000 to $99,999 income range, which is the most common income bracket and makes up 25.9% of all families.
| Income Bracket | # Families | % Families |
| Less than $10,000 | 14 | 1.5% |
| $10,000 to $14,999 | 0 | 0.0% |
| $15,000 to $24,999 | 49 | 5.2% |
| $25,000 to $34,999 | 31 | 3.3% |
| $35,000 to $49,999 | 41 | 4.3% |
| $50,000 to $74,999 | 181 | 19.0% |
| $75,000 to $99,999 | 246 | 25.9% |
| $100,000 to $149,999 | 226 | 23.8% |
| $150,000 to $199,999 | 104 | 10.9% |
| $200,000+ | 59 | 6.2% |
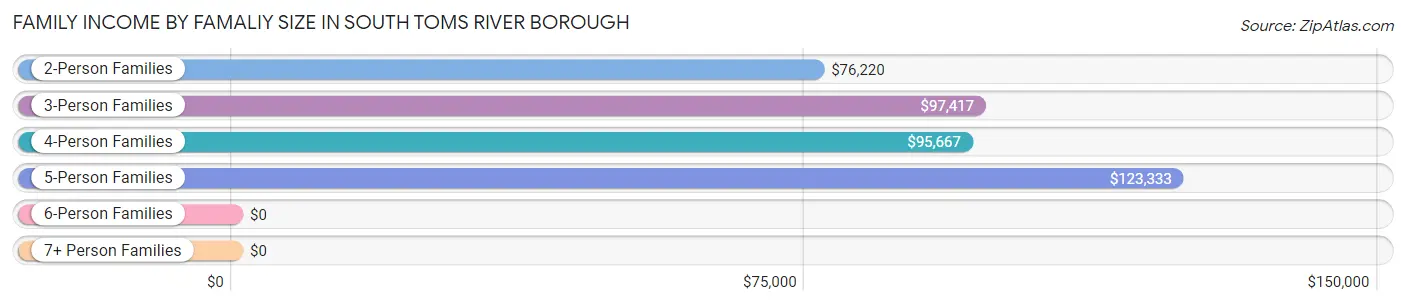
Family Income by Famaliy Size in South Toms River borough
5-person families (134 | 14.1%) account for the highest median family income in South Toms River borough with $123,333 per family, while 2-person families (284 | 29.9%) have the highest median income of $38,110 per family member.
| Income Bracket | # Families | Median Income |
| 2-Person Families | 284 (29.9%) | $76,220 |
| 3-Person Families | 271 (28.5%) | $97,417 |
| 4-Person Families | 244 (25.7%) | $95,667 |
| 5-Person Families | 134 (14.1%) | $123,333 |
| 6-Person Families | 0 (0.0%) | $0 |
| 7+ Person Families | 18 (1.9%) | $0 |
| Total | 951 (100.0%) | $95,971 |
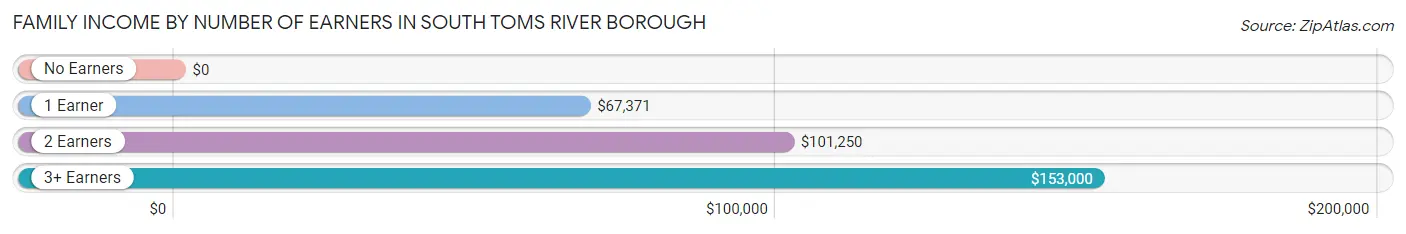
Family Income by Number of Earners in South Toms River borough
| Number of Earners | # Families | Median Income |
| No Earners | 67 (7.0%) | $0 |
| 1 Earner | 305 (32.1%) | $67,371 |
| 2 Earners | 413 (43.4%) | $101,250 |
| 3+ Earners | 166 (17.5%) | $153,000 |
| Total | 951 (100.0%) | $95,971 |
Household Income in South Toms River borough
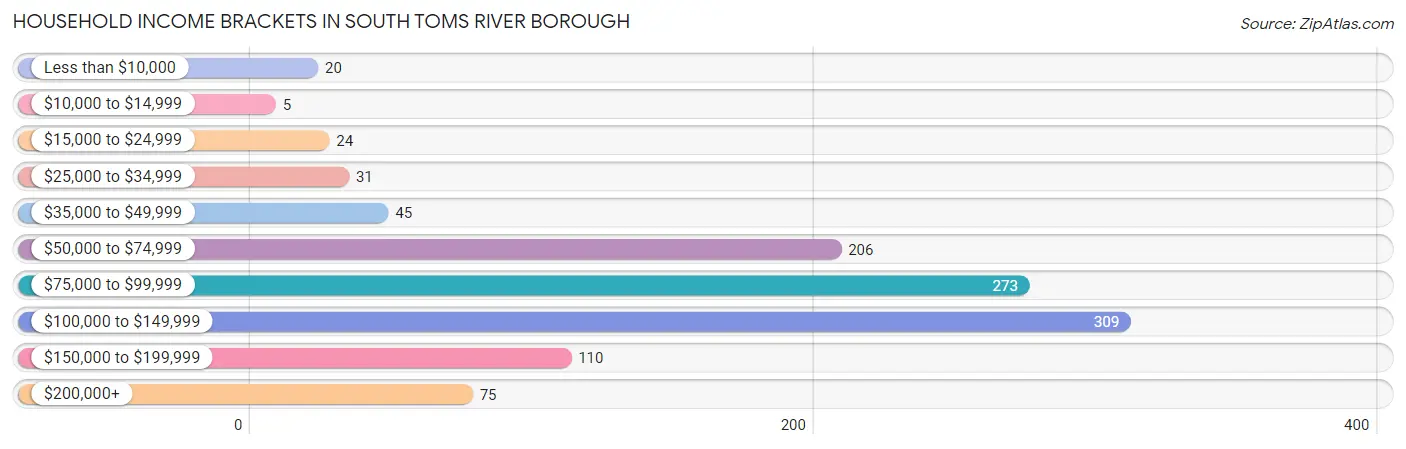
Household Income Brackets in South Toms River borough
With 309 households falling in the category, the $100,000 to $149,999 income range is the most frequent in South Toms River borough, accounting for 28.1% of all households. In contrast, only 5 households (0.5%) fall into the $10,000 to $14,999 income bracket, making it the least populous group.
| Income Bracket | # Households | % Households |
| Less than $10,000 | 20 | 1.8% |
| $10,000 to $14,999 | 5 | 0.5% |
| $15,000 to $24,999 | 24 | 2.2% |
| $25,000 to $34,999 | 31 | 2.8% |
| $35,000 to $49,999 | 45 | 4.1% |
| $50,000 to $74,999 | 206 | 18.8% |
| $75,000 to $99,999 | 273 | 24.9% |
| $100,000 to $149,999 | 309 | 28.1% |
| $150,000 to $199,999 | 110 | 10.0% |
| $200,000+ | 75 | 6.8% |
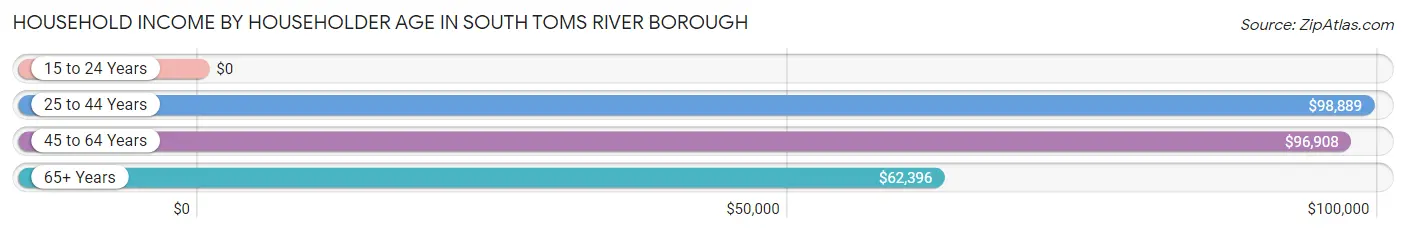
Household Income by Householder Age in South Toms River borough
The median household income in South Toms River borough is $96,688, with the highest median household income of $98,889 found in the 25 to 44 years age bracket for the primary householder. A total of 352 households (32.1%) fall into this category. Meanwhile, the 15 to 24 years age bracket for the primary householder has the lowest median household income of $0, with 33 households (3.0%) in this group.
| Income Bracket | # Households | Median Income |
| 15 to 24 Years | 33 (3.0%) | $0 |
| 25 to 44 Years | 352 (32.1%) | $98,889 |
| 45 to 64 Years | 561 (51.1%) | $96,908 |
| 65+ Years | 152 (13.8%) | $62,396 |
| Total | 1,098 (100.0%) | $96,688 |
Poverty in South Toms River borough
Income Below Poverty by Sex and Age in South Toms River borough
With 8.0% poverty level for males and 8.7% for females among the residents of South Toms River borough, 12 to 14 year old males and under 5 year old females are the most vulnerable to poverty, with 37 males (22.7%) and 53 females (32.5%) in their respective age groups living below the poverty level.
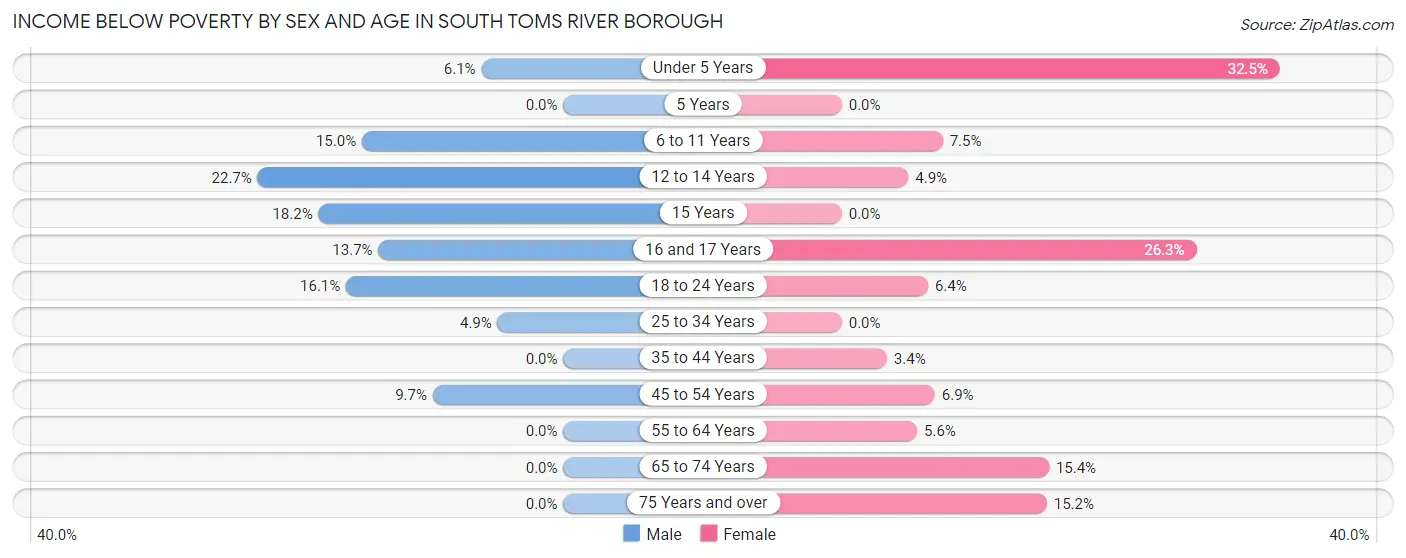
| Age Bracket | Male | Female |
| Under 5 Years | 9 (6.1%) | 53 (32.5%) |
| 5 Years | 0 (0.0%) | 0 (0.0%) |
| 6 to 11 Years | 16 (14.9%) | 14 (7.5%) |
| 12 to 14 Years | 37 (22.7%) | 4 (4.9%) |
| 15 Years | 4 (18.2%) | 0 (0.0%) |
| 16 and 17 Years | 7 (13.7%) | 25 (26.3%) |
| 18 to 24 Years | 25 (16.1%) | 13 (6.4%) |
| 25 to 34 Years | 14 (4.9%) | 0 (0.0%) |
| 35 to 44 Years | 0 (0.0%) | 12 (3.4%) |
| 45 to 54 Years | 25 (9.7%) | 13 (6.9%) |
| 55 to 64 Years | 0 (0.0%) | 17 (5.6%) |
| 65 to 74 Years | 0 (0.0%) | 12 (15.4%) |
| 75 Years and over | 0 (0.0%) | 7 (15.2%) |
| Total | 137 (8.0%) | 170 (8.7%) |
Income Above Poverty by Sex and Age in South Toms River borough
According to the poverty statistics in South Toms River borough, males aged 35 to 44 years and females aged 5 years are the age groups that are most secure financially, with 100.0% of males and 100.0% of females in these age groups living above the poverty line.
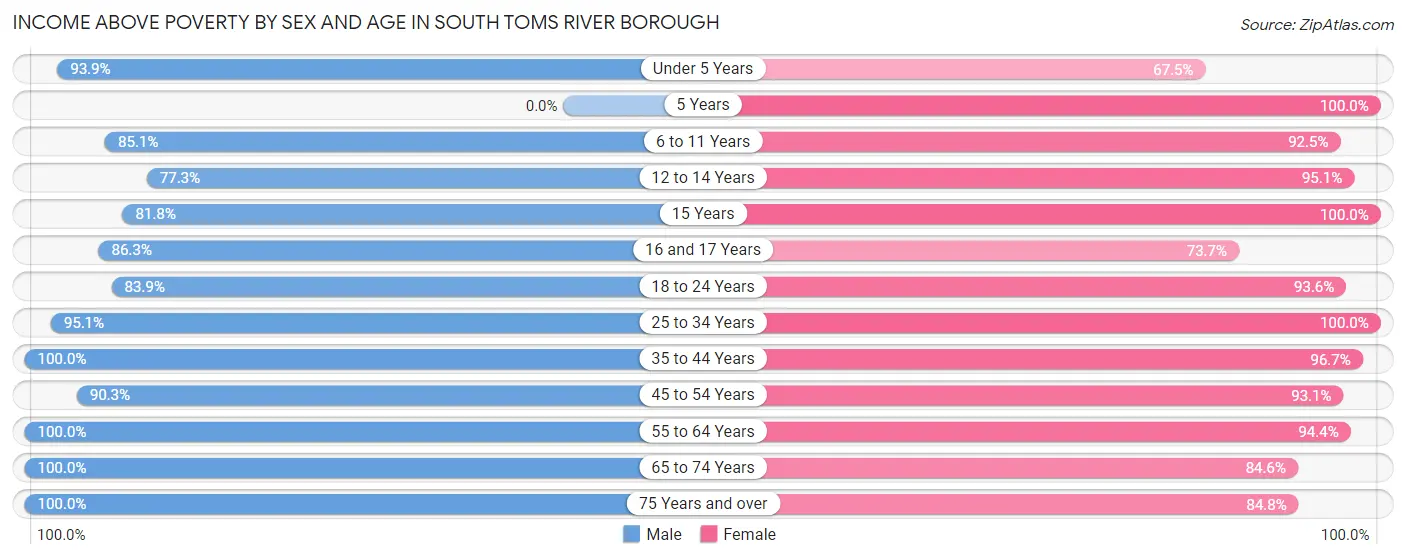
| Age Bracket | Male | Female |
| Under 5 Years | 139 (93.9%) | 110 (67.5%) |
| 5 Years | 0 (0.0%) | 6 (100.0%) |
| 6 to 11 Years | 91 (85.1%) | 173 (92.5%) |
| 12 to 14 Years | 126 (77.3%) | 77 (95.1%) |
| 15 Years | 18 (81.8%) | 28 (100.0%) |
| 16 and 17 Years | 44 (86.3%) | 70 (73.7%) |
| 18 to 24 Years | 130 (83.9%) | 190 (93.6%) |
| 25 to 34 Years | 273 (95.1%) | 207 (100.0%) |
| 35 to 44 Years | 193 (100.0%) | 346 (96.7%) |
| 45 to 54 Years | 233 (90.3%) | 175 (93.1%) |
| 55 to 64 Years | 196 (100.0%) | 287 (94.4%) |
| 65 to 74 Years | 89 (100.0%) | 66 (84.6%) |
| 75 Years and over | 49 (100.0%) | 39 (84.8%) |
| Total | 1,581 (92.0%) | 1,774 (91.3%) |
Income Below Poverty Among Married-Couple Families in South Toms River borough
| Children | Above Poverty | Below Poverty |
| No Children | 256 (100.0%) | 0 (0.0%) |
| 1 or 2 Children | 283 (100.0%) | 0 (0.0%) |
| 3 or 4 Children | 43 (100.0%) | 0 (0.0%) |
| 5 or more Children | 0 (0.0%) | 0 (0.0%) |
| Total | 582 (100.0%) | 0 (0.0%) |
Income Below Poverty Among Single-Parent Households in South Toms River borough
According to the poverty data in South Toms River borough, 42.9% or 39 single-father households and 11.5% or 32 single-mother households are living below the poverty line. Among single-father households, those with 1 or 2 children have the highest poverty rate, with 39 households (57.4%) experiencing poverty. Likewise, among single-mother households, those with 5 or more children have the highest poverty rate, with 8 households (100.0%) falling below the poverty line.
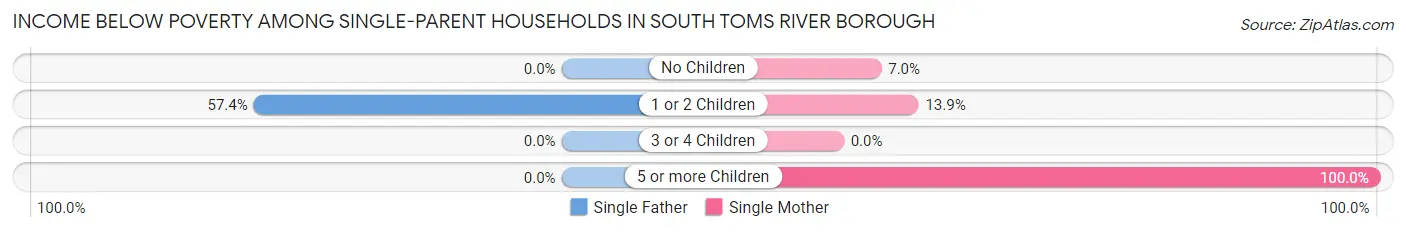
| Children | Single Father | Single Mother |
| No Children | 0 (0.0%) | 7 (7.0%) |
| 1 or 2 Children | 39 (57.4%) | 17 (13.9%) |
| 3 or 4 Children | 0 (0.0%) | 0 (0.0%) |
| 5 or more Children | 0 (0.0%) | 8 (100.0%) |
| Total | 39 (42.9%) | 32 (11.5%) |
Income Below Poverty Among Married-Couple vs Single-Parent Households in South Toms River borough
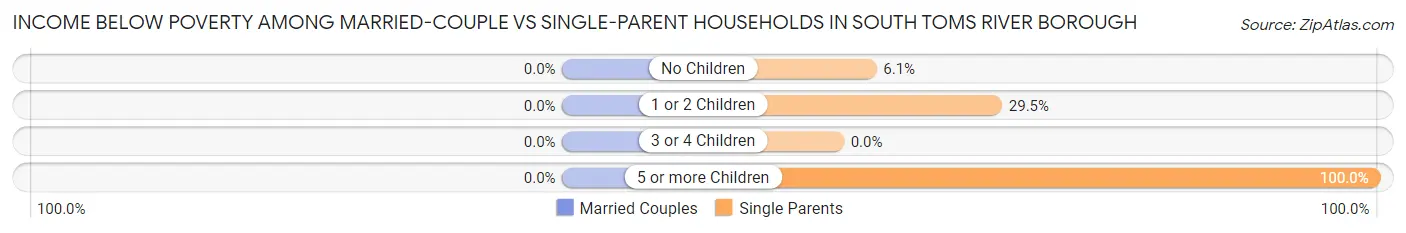
| Children | Married-Couple Families | Single-Parent Households |
| No Children | 0 (0.0%) | 7 (6.1%) |
| 1 or 2 Children | 0 (0.0%) | 56 (29.5%) |
| 3 or 4 Children | 0 (0.0%) | 0 (0.0%) |
| 5 or more Children | 0 (0.0%) | 8 (100.0%) |
| Total | 0 (0.0%) | 71 (19.2%) |
Race in South Toms River borough
The most populous races in South Toms River borough are White / Caucasian (1,942 | 53.0%), Hispanic or Latino (1,096 | 29.9%), and Black / African American (1,013 | 27.7%).
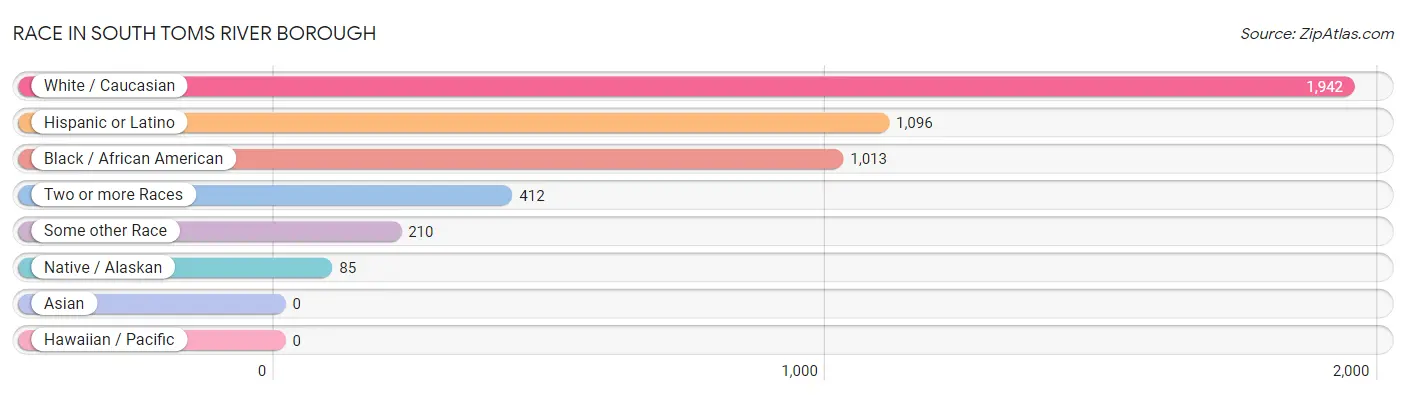
| Race | # Population | % Population |
| Asian | 0 | 0.0% |
| Black / African American | 1,013 | 27.7% |
| Hawaiian / Pacific | 0 | 0.0% |
| Hispanic or Latino | 1,096 | 29.9% |
| Native / Alaskan | 85 | 2.3% |
| White / Caucasian | 1,942 | 53.0% |
| Two or more Races | 412 | 11.3% |
| Some other Race | 210 | 5.7% |
| Total | 3,662 | 100.0% |
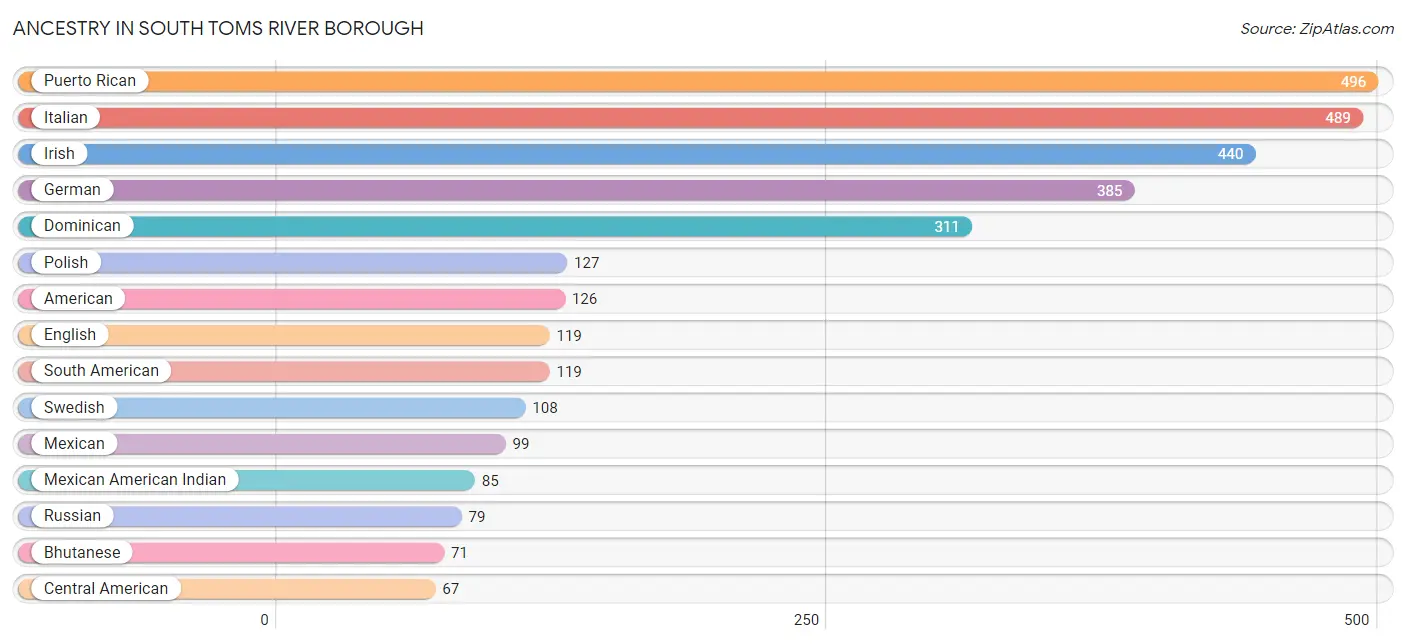
Ancestry in South Toms River borough
The most populous ancestries reported in South Toms River borough are Puerto Rican (496 | 13.5%), Italian (489 | 13.4%), Irish (440 | 12.0%), German (385 | 10.5%), and Dominican (311 | 8.5%), together accounting for 57.9% of all South Toms River borough residents.
| Ancestry | # Population | % Population |
| American | 126 | 3.4% |
| Arab | 18 | 0.5% |
| Bhutanese | 71 | 1.9% |
| Blackfeet | 9 | 0.3% |
| Brazilian | 46 | 1.3% |
| Central American | 67 | 1.8% |
| Colombian | 29 | 0.8% |
| Cuban | 4 | 0.1% |
| Czech | 25 | 0.7% |
| Czechoslovakian | 8 | 0.2% |
| Danish | 18 | 0.5% |
| Dominican | 311 | 8.5% |
| Dutch | 64 | 1.8% |
| Ecuadorian | 42 | 1.1% |
| English | 119 | 3.3% |
| French | 42 | 1.1% |
| German | 385 | 10.5% |
| Guatemalan | 49 | 1.3% |
| Haitian | 35 | 1.0% |
| Honduran | 18 | 0.5% |
| Hungarian | 26 | 0.7% |
| Irish | 440 | 12.0% |
| Italian | 489 | 13.4% |
| Jamaican | 10 | 0.3% |
| Jordanian | 9 | 0.3% |
| Lebanese | 9 | 0.3% |
| Lithuanian | 6 | 0.2% |
| Mexican | 99 | 2.7% |
| Mexican American Indian | 85 | 2.3% |
| Norwegian | 6 | 0.2% |
| Pennsylvania German | 7 | 0.2% |
| Peruvian | 48 | 1.3% |
| Polish | 127 | 3.5% |
| Puerto Rican | 496 | 13.5% |
| Russian | 79 | 2.2% |
| Scotch-Irish | 30 | 0.8% |
| Scottish | 39 | 1.1% |
| Sioux | 9 | 0.3% |
| Slavic | 8 | 0.2% |
| South American | 119 | 3.3% |
| Swedish | 108 | 2.9% |
| Thai | 24 | 0.7% |
| Trinidadian and Tobagonian | 6 | 0.2% |
| Turkish | 21 | 0.6% |
| Welsh | 33 | 0.9% | View All 45 Rows |
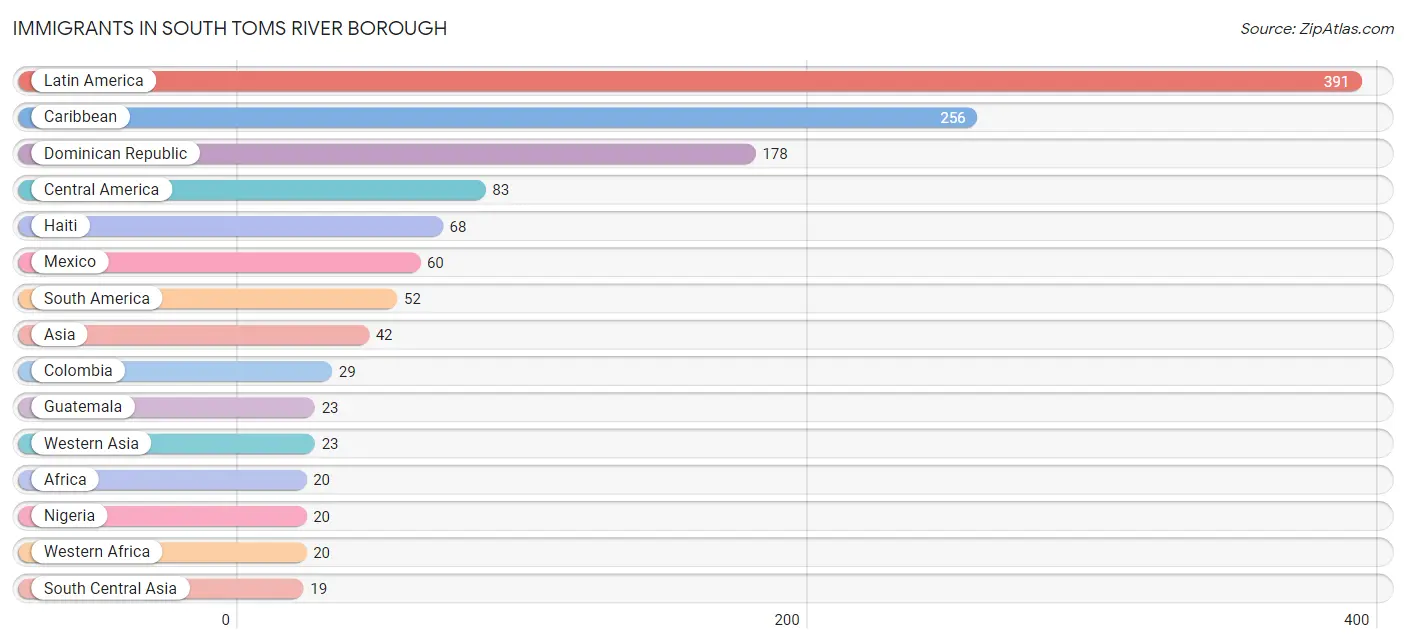
Immigrants in South Toms River borough
The most numerous immigrant groups reported in South Toms River borough came from Latin America (391 | 10.7%), Caribbean (256 | 7.0%), Dominican Republic (178 | 4.9%), Central America (83 | 2.3%), and Haiti (68 | 1.9%), together accounting for 26.7% of all South Toms River borough residents.
| Immigration Origin | # Population | % Population |
| Africa | 20 | 0.5% |
| Asia | 42 | 1.1% |
| Caribbean | 256 | 7.0% |
| Central America | 83 | 2.3% |
| Colombia | 29 | 0.8% |
| Dominican Republic | 178 | 4.9% |
| Ecuador | 15 | 0.4% |
| Guatemala | 23 | 0.6% |
| Haiti | 68 | 1.9% |
| Jamaica | 10 | 0.3% |
| Jordan | 9 | 0.3% |
| Latin America | 391 | 10.7% |
| Mexico | 60 | 1.6% |
| Nigeria | 20 | 0.5% |
| Peru | 8 | 0.2% |
| South America | 52 | 1.4% |
| South Central Asia | 19 | 0.5% |
| Turkey | 14 | 0.4% |
| Uzbekistan | 19 | 0.5% |
| Western Africa | 20 | 0.5% |
| Western Asia | 23 | 0.6% | View All 21 Rows |
Sex and Age in South Toms River borough
Sex and Age in South Toms River borough
The most populous age groups in South Toms River borough are 10 to 14 Years (223 | 13.0%) for men and 35 to 39 Years (207 | 10.6%) for women.
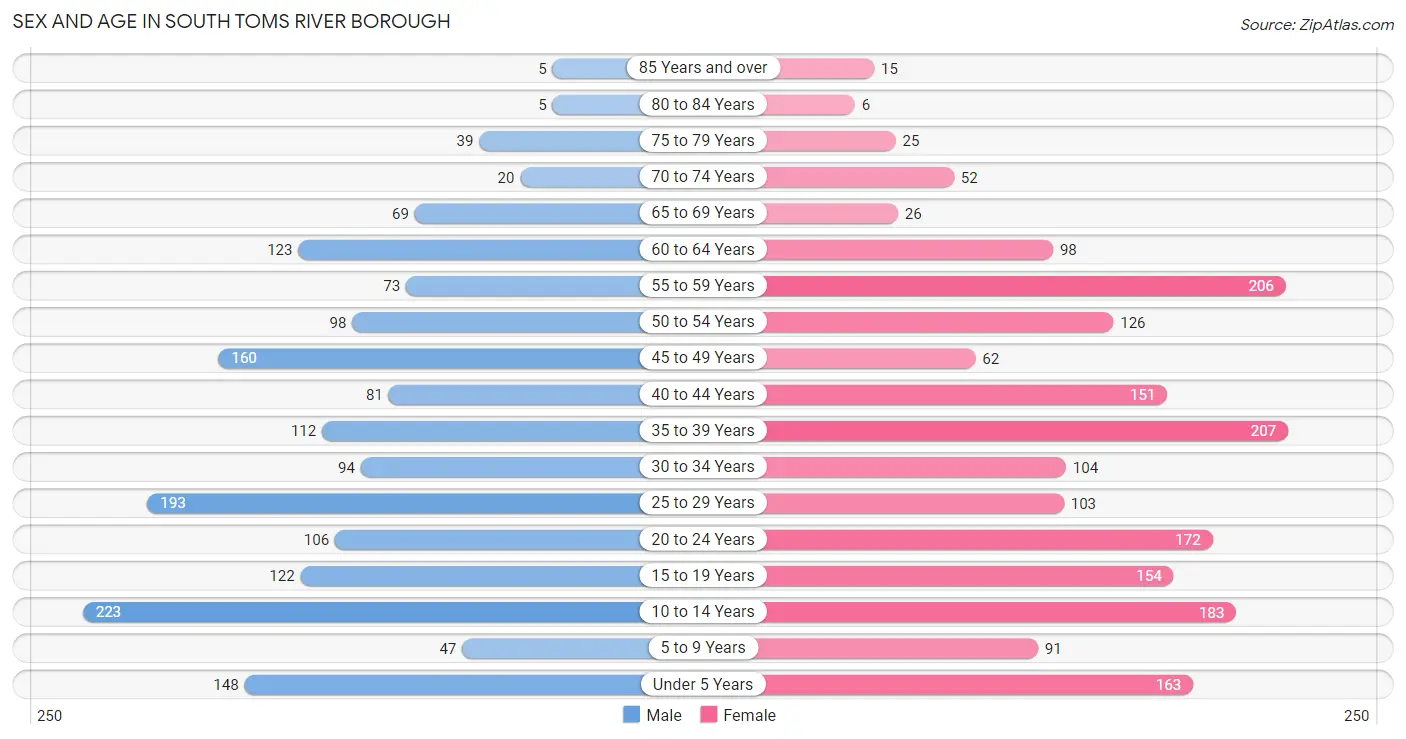
| Age Bracket | Male | Female |
| Under 5 Years | 148 (8.6%) | 163 (8.4%) |
| 5 to 9 Years | 47 (2.7%) | 91 (4.7%) |
| 10 to 14 Years | 223 (13.0%) | 183 (9.4%) |
| 15 to 19 Years | 122 (7.1%) | 154 (7.9%) |
| 20 to 24 Years | 106 (6.2%) | 172 (8.8%) |
| 25 to 29 Years | 193 (11.2%) | 103 (5.3%) |
| 30 to 34 Years | 94 (5.5%) | 104 (5.3%) |
| 35 to 39 Years | 112 (6.5%) | 207 (10.6%) |
| 40 to 44 Years | 81 (4.7%) | 151 (7.8%) |
| 45 to 49 Years | 160 (9.3%) | 62 (3.2%) |
| 50 to 54 Years | 98 (5.7%) | 126 (6.5%) |
| 55 to 59 Years | 73 (4.3%) | 206 (10.6%) |
| 60 to 64 Years | 123 (7.2%) | 98 (5.0%) |
| 65 to 69 Years | 69 (4.0%) | 26 (1.3%) |
| 70 to 74 Years | 20 (1.2%) | 52 (2.7%) |
| 75 to 79 Years | 39 (2.3%) | 25 (1.3%) |
| 80 to 84 Years | 5 (0.3%) | 6 (0.3%) |
| 85 Years and over | 5 (0.3%) | 15 (0.8%) |
| Total | 1,718 (100.0%) | 1,944 (100.0%) |
Families and Households in South Toms River borough
Median Family Size in South Toms River borough
The median family size in South Toms River borough is 3.48 persons per family, with single male/father families (91 | 9.6%) accounting for the largest median family size of 3.8 persons per family. On the other hand, single female/mother families (278 | 29.2%) represent the smallest median family size with 3.18 persons per family.
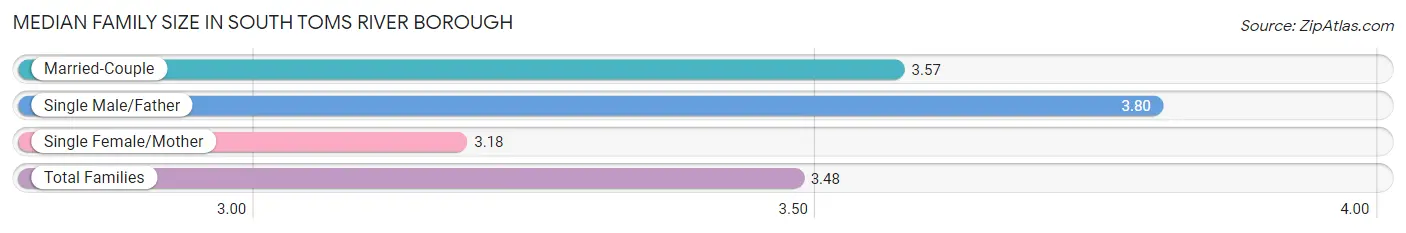
| Family Type | # Families | Family Size |
| Married-Couple | 582 (61.2%) | 3.57 |
| Single Male/Father | 91 (9.6%) | 3.80 |
| Single Female/Mother | 278 (29.2%) | 3.18 |
| Total Families | 951 (100.0%) | 3.48 |
Median Household Size in South Toms River borough
The median household size in South Toms River borough is 3.34 persons per household, with single male/father households (91 | 8.3%) accounting for the largest median household size of 4.47 persons per household. non-family households (147 | 13.4%) represent the smallest median household size with 1.27 persons per household.
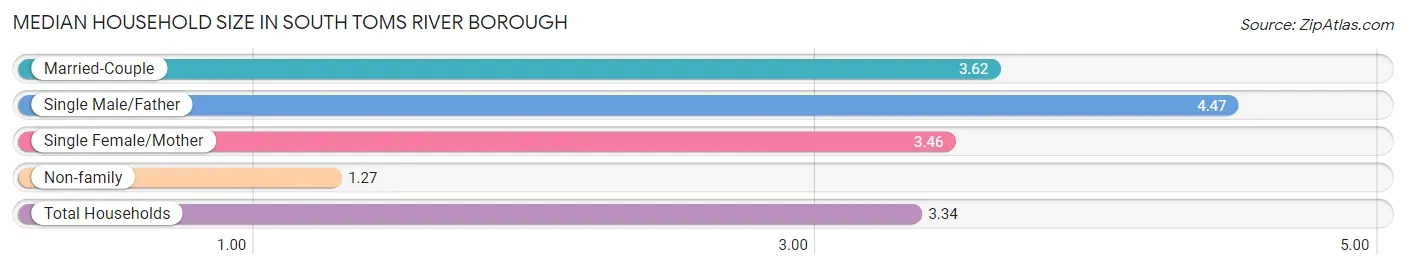
| Household Type | # Households | Household Size |
| Married-Couple | 582 (53.0%) | 3.62 |
| Single Male/Father | 91 (8.3%) | 4.47 |
| Single Female/Mother | 278 (25.3%) | 3.46 |
| Non-family | 147 (13.4%) | 1.27 |
| Total Households | 1,098 (100.0%) | 3.34 |
Household Size by Marriage Status in South Toms River borough
Out of a total of 1,098 households in South Toms River borough, 951 (86.6%) are family households, while 147 (13.4%) are nonfamily households. The most numerous type of family households are 3-person households, comprising 281, and the most common type of nonfamily households are 1-person households, comprising 102.
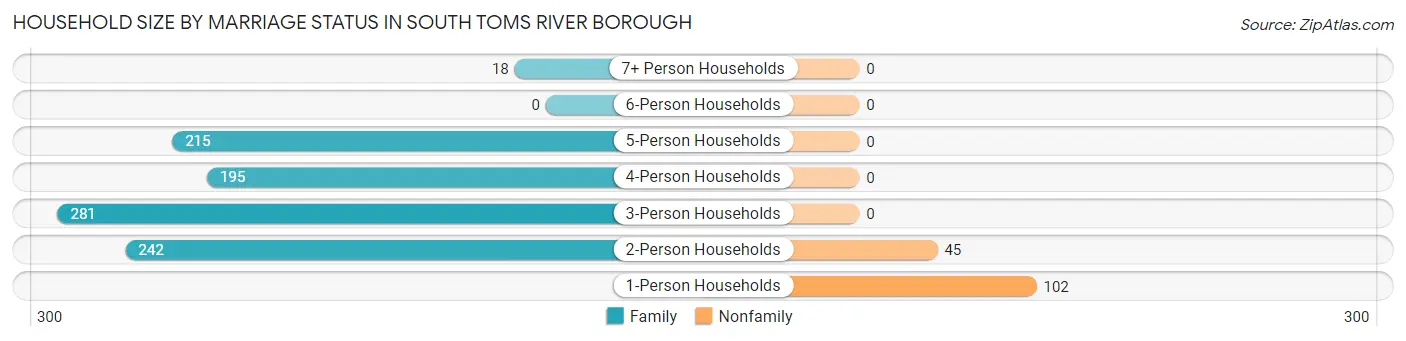
| Household Size | Family Households | Nonfamily Households |
| 1-Person Households | - | 102 (9.3%) |
| 2-Person Households | 242 (22.0%) | 45 (4.1%) |
| 3-Person Households | 281 (25.6%) | 0 (0.0%) |
| 4-Person Households | 195 (17.8%) | 0 (0.0%) |
| 5-Person Households | 215 (19.6%) | 0 (0.0%) |
| 6-Person Households | 0 (0.0%) | 0 (0.0%) |
| 7+ Person Households | 18 (1.6%) | 0 (0.0%) |
| Total | 951 (86.6%) | 147 (13.4%) |
Female Fertility in South Toms River borough
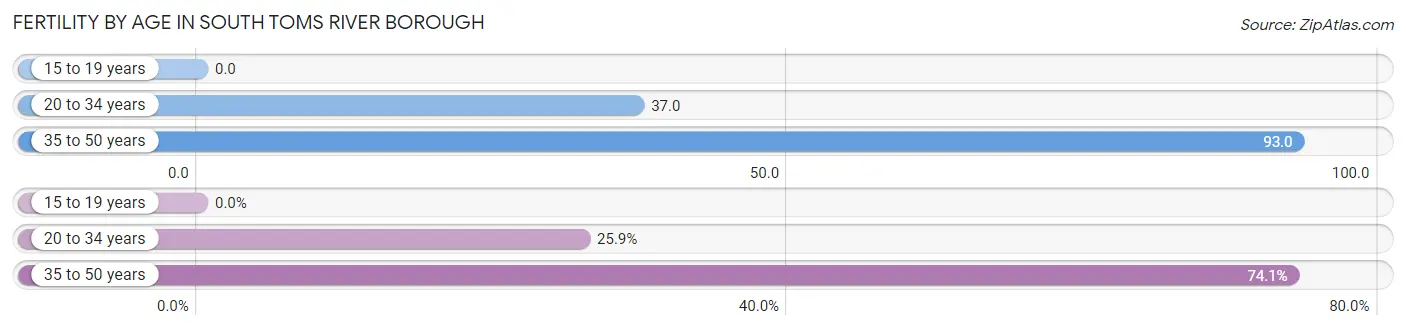
Fertility by Age in South Toms River borough
Average fertility rate in South Toms River borough is 56.0 births per 1,000 women. Women in the age bracket of 35 to 50 years have the highest fertility rate with 93.0 births per 1,000 women. Women in the age bracket of 35 to 50 years acount for 74.1% of all women with births.
| Age Bracket | Women with Births | Births / 1,000 Women |
| 15 to 19 years | 0 (0.0%) | 0.0 |
| 20 to 34 years | 14 (25.9%) | 37.0 |
| 35 to 50 years | 40 (74.1%) | 93.0 |
| Total | 54 (100.0%) | 56.0 |
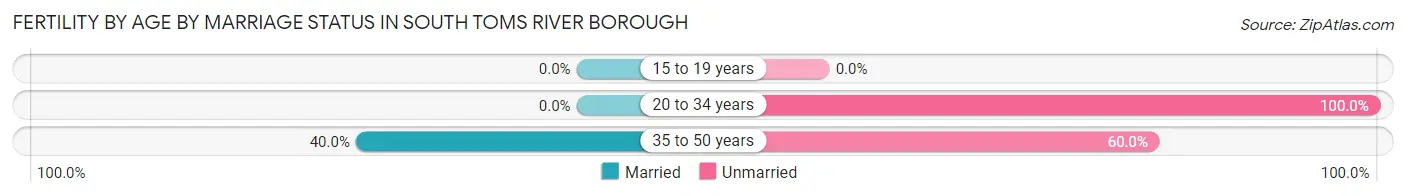
Fertility by Age by Marriage Status in South Toms River borough
29.6% of women with births (54) in South Toms River borough are married. The highest percentage of unmarried women with births falls into 20 to 34 years age bracket with 100.0% of them unmarried at the time of birth, while the lowest percentage of unmarried women with births belong to 35 to 50 years age bracket with 60.0% of them unmarried.
| Age Bracket | Married | Unmarried |
| 15 to 19 years | 0 (0.0%) | 0 (0.0%) |
| 20 to 34 years | 0 (0.0%) | 14 (100.0%) |
| 35 to 50 years | 16 (40.0%) | 24 (60.0%) |
| Total | 16 (29.6%) | 38 (70.4%) |
Fertility by Education in South Toms River borough
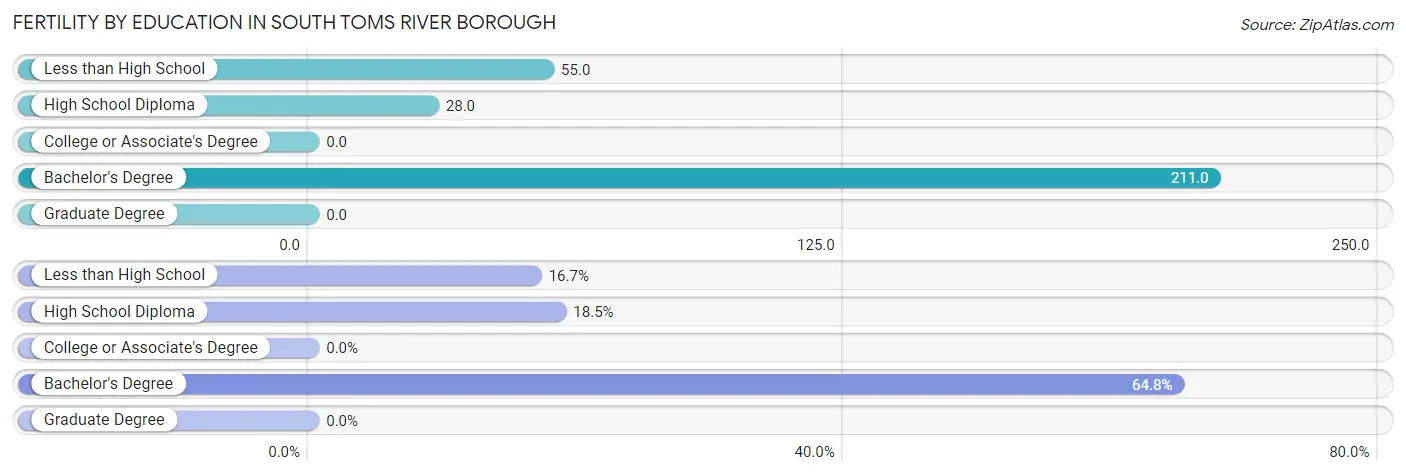
| Educational Attainment | Women with Births | Births / 1,000 Women |
| Less than High School | 9 (16.7%) | 55.0 |
| High School Diploma | 10 (18.5%) | 28.0 |
| College or Associate's Degree | 0 (0.0%) | 0.0 |
| Bachelor's Degree | 35 (64.8%) | 211.0 |
| Graduate Degree | 0 (0.0%) | 0.0 |
| Total | 54 (100.0%) | 56.0 |
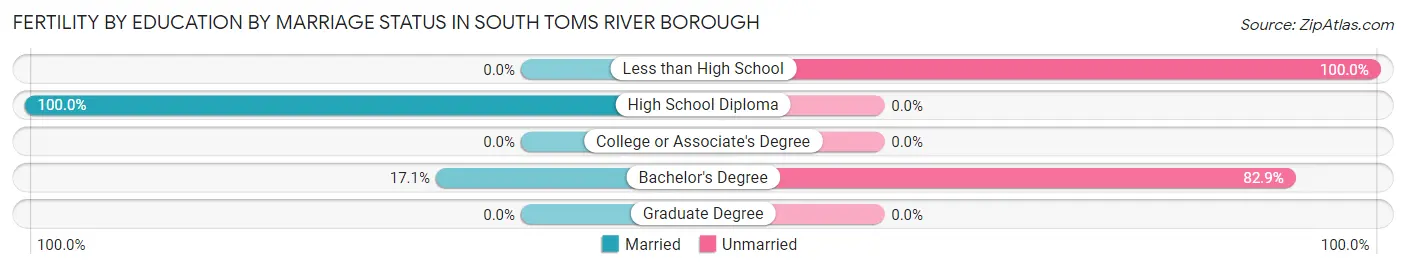
Fertility by Education by Marriage Status in South Toms River borough
70.4% of women with births in South Toms River borough are unmarried. Women with the educational attainment of high school diploma are most likely to be married with 100.0% of them married at childbirth, while women with the educational attainment of less than high school are least likely to be married with 100.0% of them unmarried at childbirth.
| Educational Attainment | Married | Unmarried |
| Less than High School | 0 (0.0%) | 9 (100.0%) |
| High School Diploma | 10 (100.0%) | 0 (0.0%) |
| College or Associate's Degree | 0 (0.0%) | 0 (0.0%) |
| Bachelor's Degree | 6 (17.1%) | 29 (82.9%) |
| Graduate Degree | 0 (0.0%) | 0 (0.0%) |
| Total | 16 (29.6%) | 38 (70.4%) |
Employment Characteristics in South Toms River borough
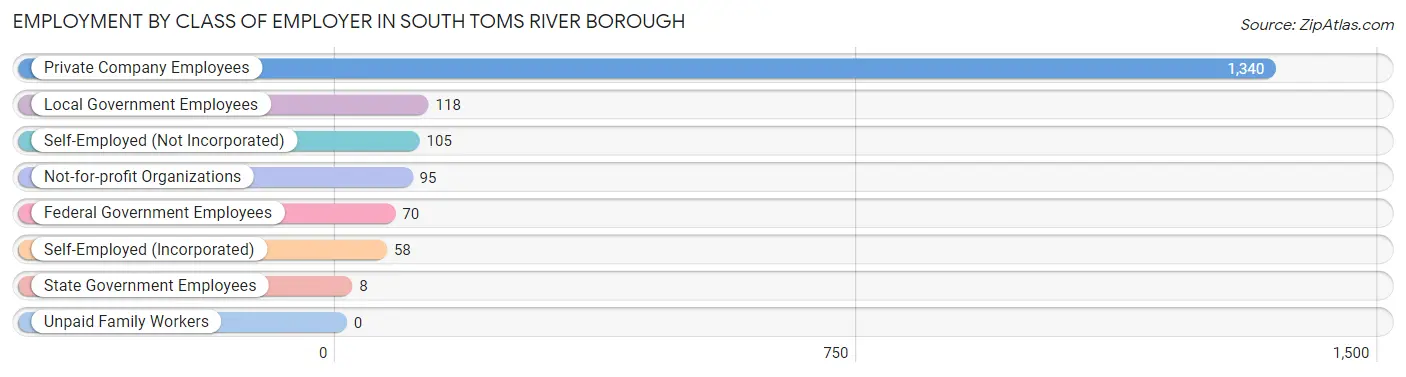
Employment by Class of Employer in South Toms River borough
Among the 1,794 employed individuals in South Toms River borough, private company employees (1,340 | 74.7%), local government employees (118 | 6.6%), and self-employed (not incorporated) (105 | 5.9%) make up the most common classes of employment.
| Employer Class | # Employees | % Employees |
| Private Company Employees | 1,340 | 74.7% |
| Self-Employed (Incorporated) | 58 | 3.2% |
| Self-Employed (Not Incorporated) | 105 | 5.9% |
| Not-for-profit Organizations | 95 | 5.3% |
| Local Government Employees | 118 | 6.6% |
| State Government Employees | 8 | 0.4% |
| Federal Government Employees | 70 | 3.9% |
| Unpaid Family Workers | 0 | 0.0% |
| Total | 1,794 | 100.0% |
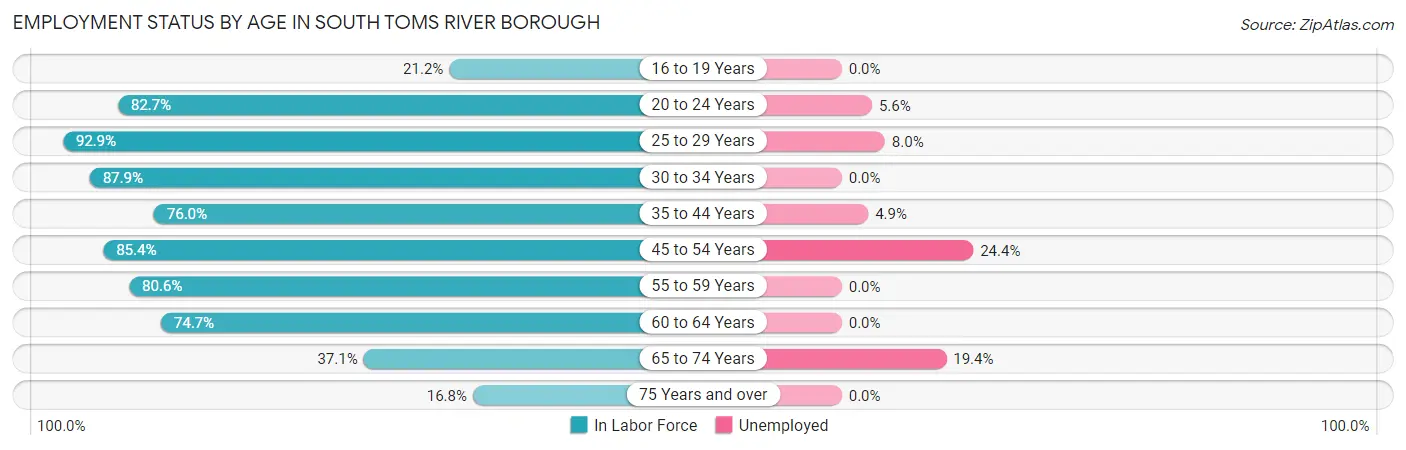
Employment Status by Age in South Toms River borough
According to the labor force statistics for South Toms River borough, out of the total population over 16 years of age (2,757), 72.4% or 1,996 individuals are in the labor force, with 8.1% or 162 of them unemployed. The age group with the highest labor force participation rate is 25 to 29 years, with 92.9% or 275 individuals in the labor force. Within the labor force, the 45 to 54 years age range has the highest percentage of unemployed individuals, with 24.4% or 93 of them being unemployed.
| Age Bracket | In Labor Force | Unemployed |
| 16 to 19 Years | 48 (21.2%) | 0 (0.0%) |
| 20 to 24 Years | 230 (82.7%) | 13 (5.6%) |
| 25 to 29 Years | 275 (92.9%) | 22 (8.0%) |
| 30 to 34 Years | 174 (87.9%) | 0 (0.0%) |
| 35 to 44 Years | 419 (76.0%) | 21 (4.9%) |
| 45 to 54 Years | 381 (85.4%) | 93 (24.4%) |
| 55 to 59 Years | 225 (80.6%) | 0 (0.0%) |
| 60 to 64 Years | 165 (74.7%) | 0 (0.0%) |
| 65 to 74 Years | 62 (37.1%) | 12 (19.4%) |
| 75 Years and over | 16 (16.8%) | 0 (0.0%) |
| Total | 1,996 (72.4%) | 162 (8.1%) |
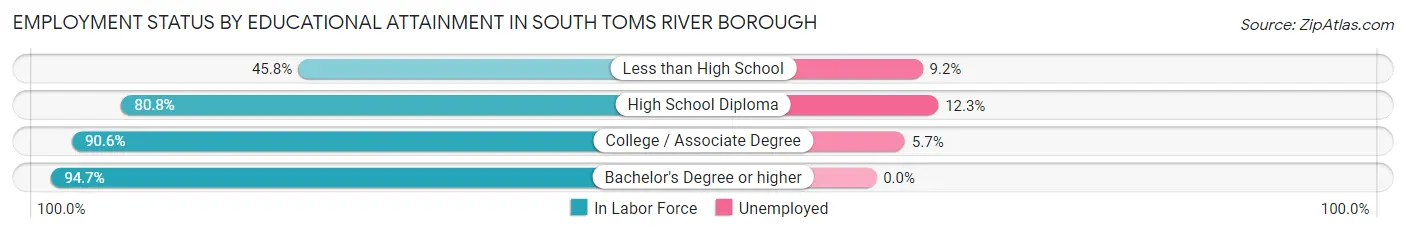
Employment Status by Educational Attainment in South Toms River borough
According to labor force statistics for South Toms River borough, 82.3% of individuals (1,639) out of the total population between 25 and 64 years of age (1,991) are in the labor force, with 8.3% or 136 of them being unemployed. The group with the highest labor force participation rate are those with the educational attainment of bachelor's degree or higher, with 94.7% or 321 individuals in the labor force. Within the labor force, individuals with high school diploma education have the highest percentage of unemployment, with 12.3% or 105 of them being unemployed.
| Educational Attainment | In Labor Force | Unemployed |
| Less than High School | 76 (45.8%) | 15 (9.2%) |
| High School Diploma | 857 (80.8%) | 131 (12.3%) |
| College / Associate Degree | 385 (90.6%) | 24 (5.7%) |
| Bachelor's Degree or higher | 321 (94.7%) | 0 (0.0%) |
| Total | 1,639 (82.3%) | 165 (8.3%) |
Employment Occupations by Sex in South Toms River borough
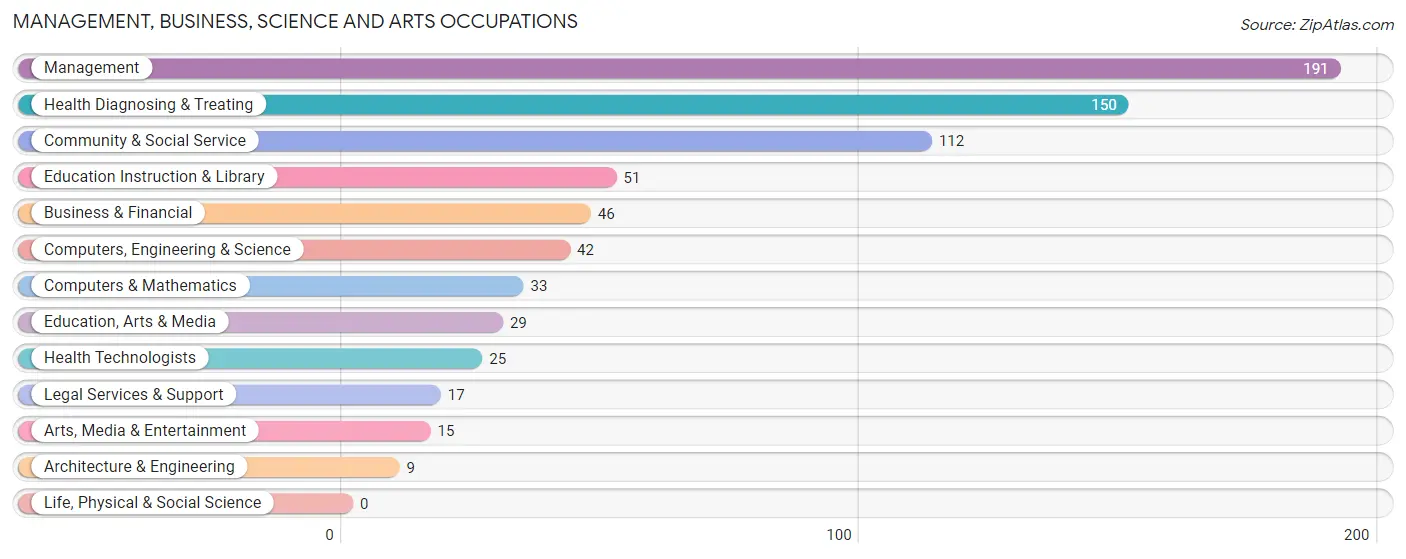
Management, Business, Science and Arts Occupations
The most common Management, Business, Science and Arts occupations in South Toms River borough are Management (191 | 10.7%), Health Diagnosing & Treating (150 | 8.4%), Community & Social Service (112 | 6.3%), Education Instruction & Library (51 | 2.9%), and Business & Financial (46 | 2.6%).
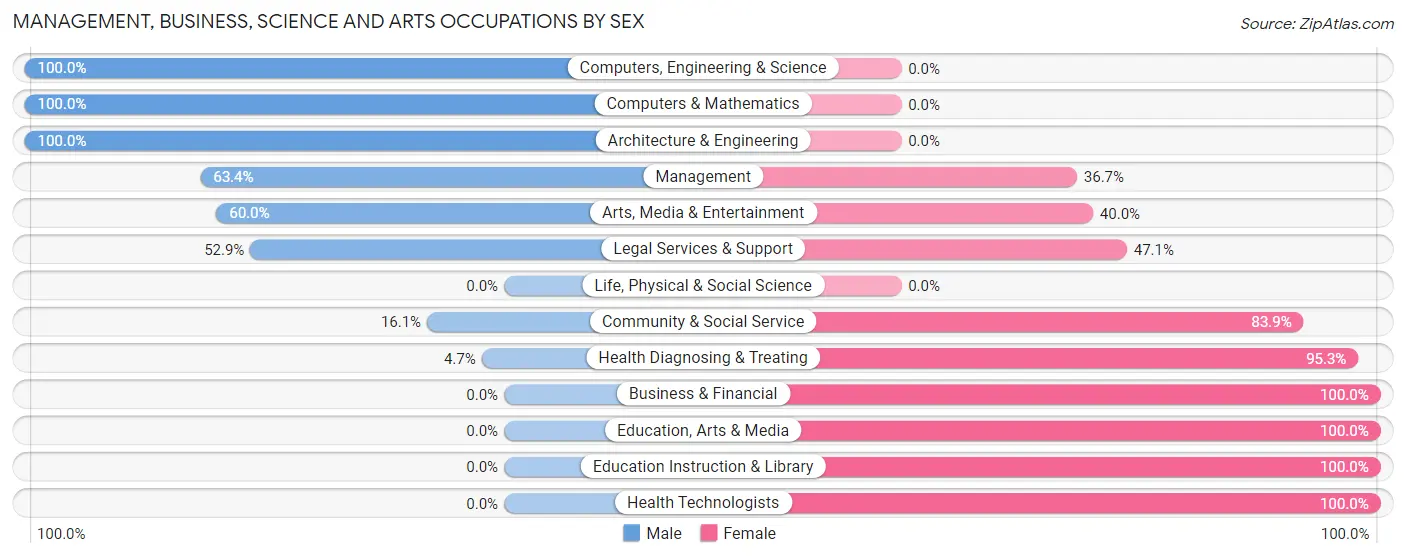
Management, Business, Science and Arts Occupations by Sex
Within the Management, Business, Science and Arts occupations in South Toms River borough, the most male-oriented occupations are Computers, Engineering & Science (100.0%), Computers & Mathematics (100.0%), and Architecture & Engineering (100.0%), while the most female-oriented occupations are Business & Financial (100.0%), Education, Arts & Media (100.0%), and Education Instruction & Library (100.0%).
| Occupation | Male | Female |
| Management | 121 (63.3%) | 70 (36.6%) |
| Business & Financial | 0 (0.0%) | 46 (100.0%) |
| Computers, Engineering & Science | 42 (100.0%) | 0 (0.0%) |
| Computers & Mathematics | 33 (100.0%) | 0 (0.0%) |
| Architecture & Engineering | 9 (100.0%) | 0 (0.0%) |
| Life, Physical & Social Science | 0 (0.0%) | 0 (0.0%) |
| Community & Social Service | 18 (16.1%) | 94 (83.9%) |
| Education, Arts & Media | 0 (0.0%) | 29 (100.0%) |
| Legal Services & Support | 9 (52.9%) | 8 (47.1%) |
| Education Instruction & Library | 0 (0.0%) | 51 (100.0%) |
| Arts, Media & Entertainment | 9 (60.0%) | 6 (40.0%) |
| Health Diagnosing & Treating | 7 (4.7%) | 143 (95.3%) |
| Health Technologists | 0 (0.0%) | 25 (100.0%) |
| Total (Category) | 188 (34.7%) | 353 (65.2%) |
| Total (Overall) | 863 (48.2%) | 927 (51.8%) |
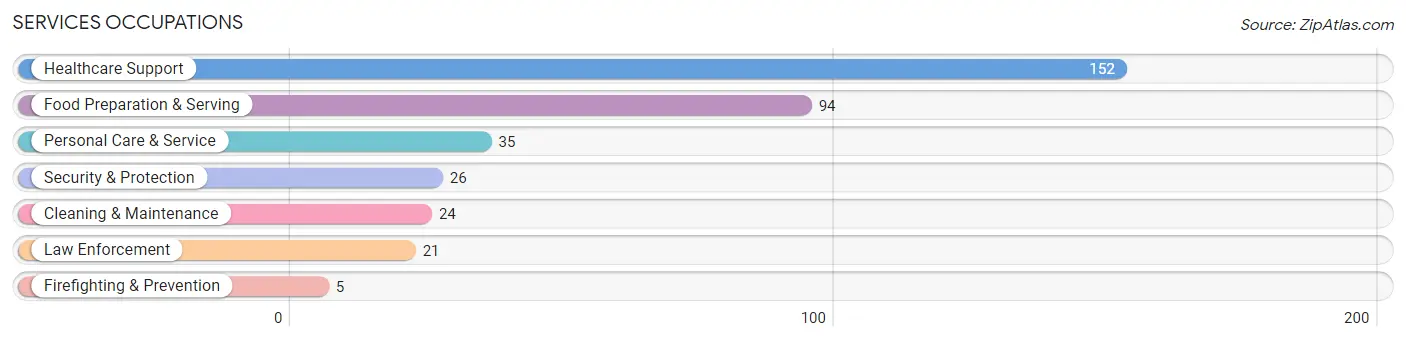
Services Occupations
The most common Services occupations in South Toms River borough are Healthcare Support (152 | 8.5%), Food Preparation & Serving (94 | 5.2%), Personal Care & Service (35 | 2.0%), Security & Protection (26 | 1.5%), and Cleaning & Maintenance (24 | 1.3%).
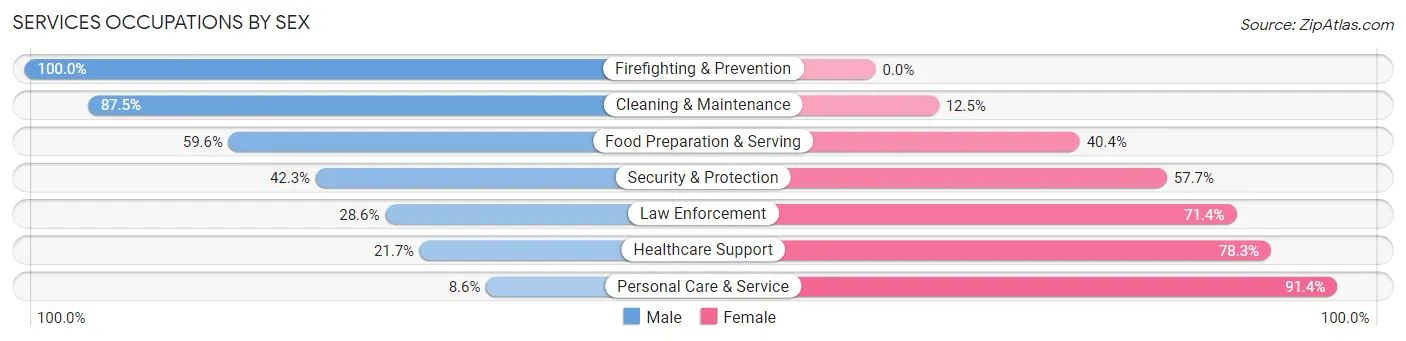
Services Occupations by Sex
Within the Services occupations in South Toms River borough, the most male-oriented occupations are Firefighting & Prevention (100.0%), Cleaning & Maintenance (87.5%), and Food Preparation & Serving (59.6%), while the most female-oriented occupations are Personal Care & Service (91.4%), Healthcare Support (78.3%), and Law Enforcement (71.4%).
| Occupation | Male | Female |
| Healthcare Support | 33 (21.7%) | 119 (78.3%) |
| Security & Protection | 11 (42.3%) | 15 (57.7%) |
| Firefighting & Prevention | 5 (100.0%) | 0 (0.0%) |
| Law Enforcement | 6 (28.6%) | 15 (71.4%) |
| Food Preparation & Serving | 56 (59.6%) | 38 (40.4%) |
| Cleaning & Maintenance | 21 (87.5%) | 3 (12.5%) |
| Personal Care & Service | 3 (8.6%) | 32 (91.4%) |
| Total (Category) | 124 (37.5%) | 207 (62.5%) |
| Total (Overall) | 863 (48.2%) | 927 (51.8%) |
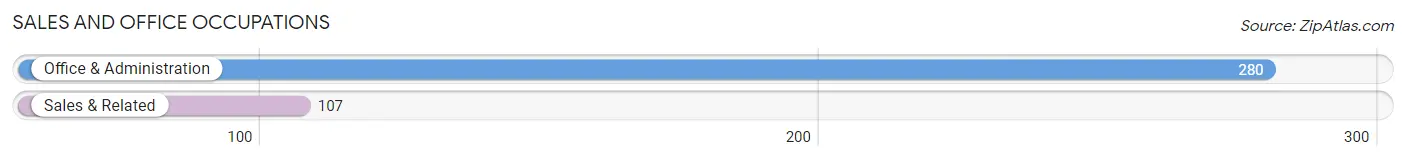
Sales and Office Occupations
The most common Sales and Office occupations in South Toms River borough are Office & Administration (280 | 15.6%), and Sales & Related (107 | 6.0%).
Sales and Office Occupations by Sex
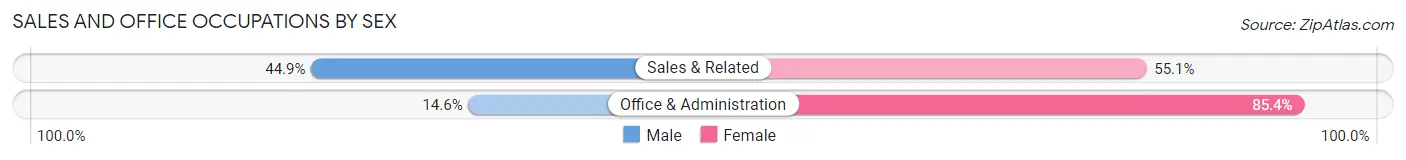
| Occupation | Male | Female |
| Sales & Related | 48 (44.9%) | 59 (55.1%) |
| Office & Administration | 41 (14.6%) | 239 (85.4%) |
| Total (Category) | 89 (23.0%) | 298 (77.0%) |
| Total (Overall) | 863 (48.2%) | 927 (51.8%) |
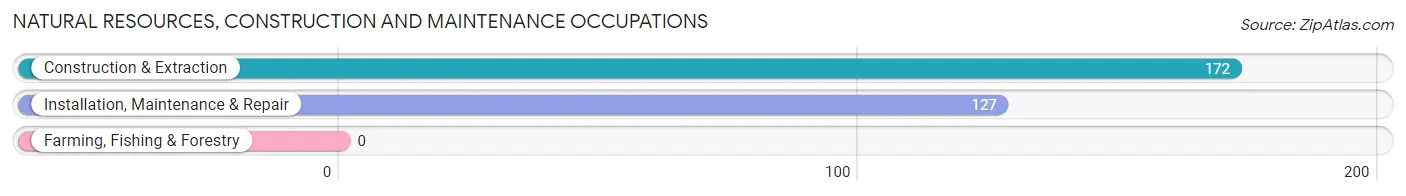
Natural Resources, Construction and Maintenance Occupations
The most common Natural Resources, Construction and Maintenance occupations in South Toms River borough are Construction & Extraction (172 | 9.6%), and Installation, Maintenance & Repair (127 | 7.1%).
Natural Resources, Construction and Maintenance Occupations by Sex
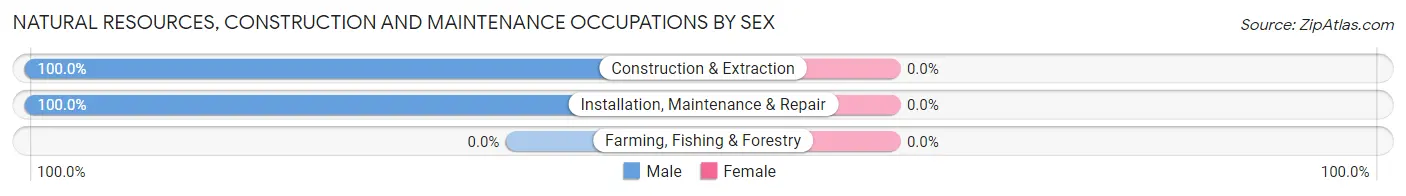
| Occupation | Male | Female |
| Farming, Fishing & Forestry | 0 (0.0%) | 0 (0.0%) |
| Construction & Extraction | 172 (100.0%) | 0 (0.0%) |
| Installation, Maintenance & Repair | 127 (100.0%) | 0 (0.0%) |
| Total (Category) | 299 (100.0%) | 0 (0.0%) |
| Total (Overall) | 863 (48.2%) | 927 (51.8%) |
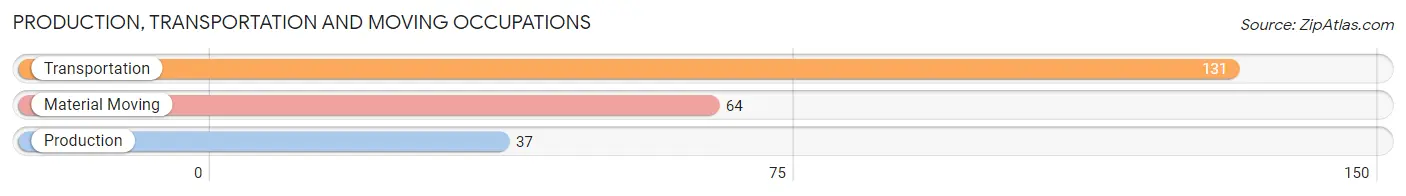
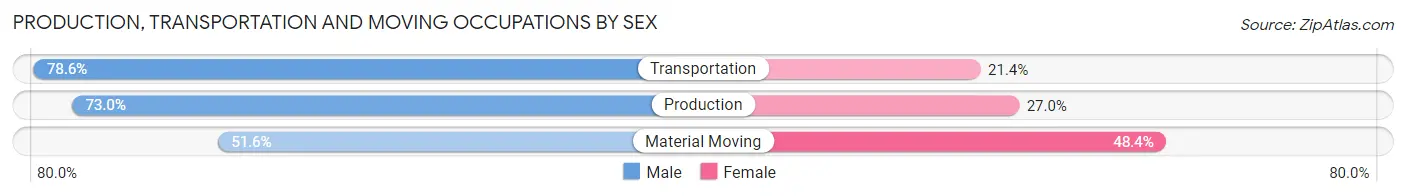
Production, Transportation and Moving Occupations
The most common Production, Transportation and Moving occupations in South Toms River borough are Transportation (131 | 7.3%), Material Moving (64 | 3.6%), and Production (37 | 2.1%).
Production, Transportation and Moving Occupations by Sex
| Occupation | Male | Female |
| Production | 27 (73.0%) | 10 (27.0%) |
| Transportation | 103 (78.6%) | 28 (21.4%) |
| Material Moving | 33 (51.6%) | 31 (48.4%) |
| Total (Category) | 163 (70.3%) | 69 (29.7%) |
| Total (Overall) | 863 (48.2%) | 927 (51.8%) |
Employment Industries by Sex in South Toms River borough
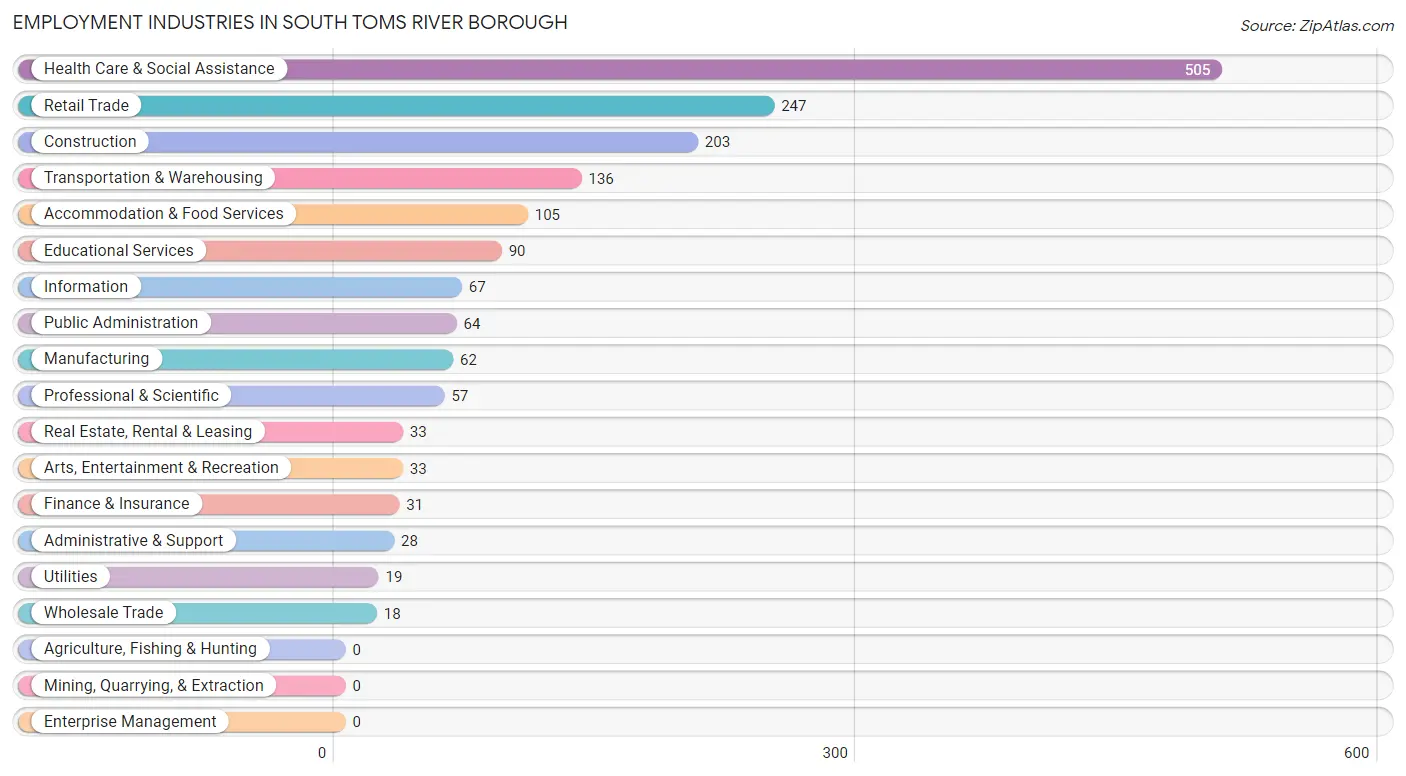
Employment Industries in South Toms River borough
The major employment industries in South Toms River borough include Health Care & Social Assistance (505 | 28.2%), Retail Trade (247 | 13.8%), Construction (203 | 11.3%), Transportation & Warehousing (136 | 7.6%), and Accommodation & Food Services (105 | 5.9%).
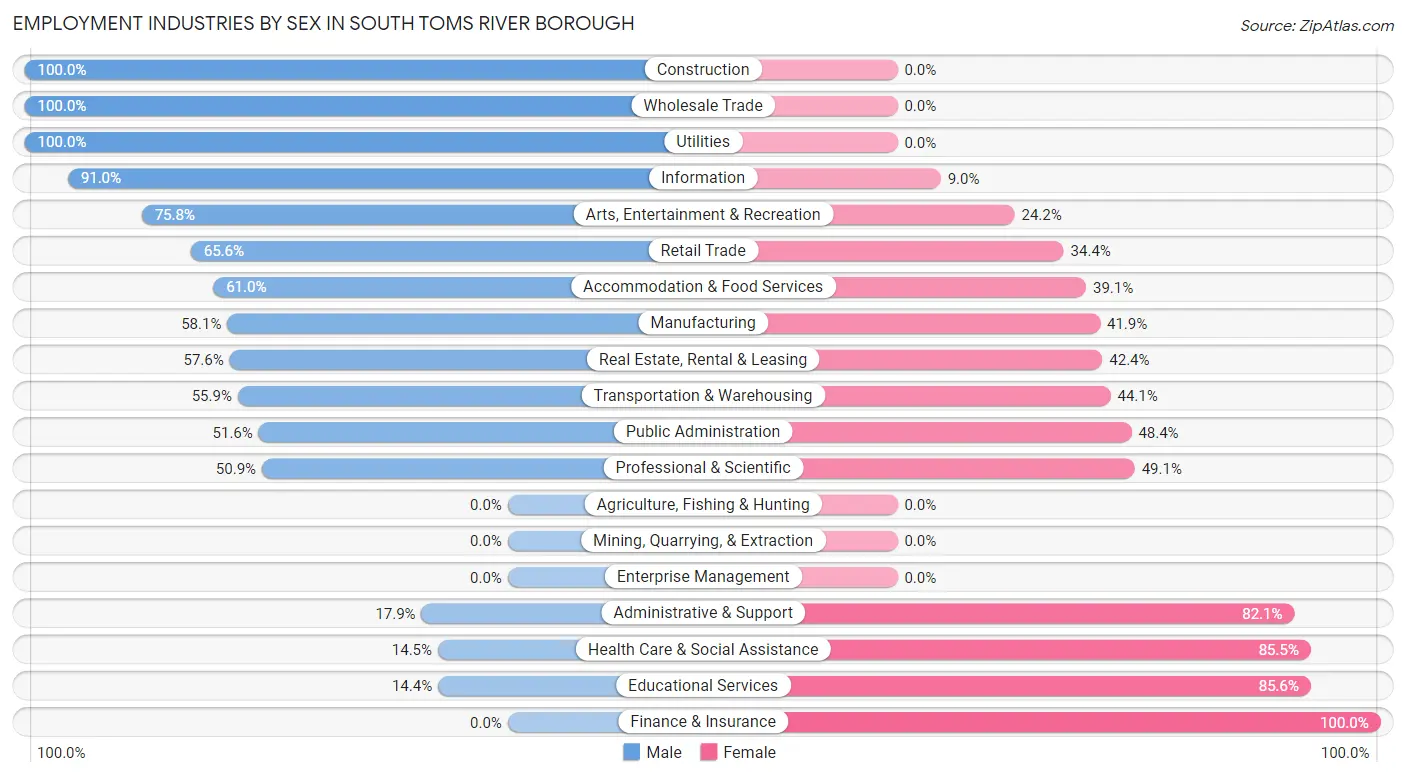
Employment Industries by Sex in South Toms River borough
The South Toms River borough industries that see more men than women are Construction (100.0%), Wholesale Trade (100.0%), and Utilities (100.0%), whereas the industries that tend to have a higher number of women are Finance & Insurance (100.0%), Educational Services (85.6%), and Health Care & Social Assistance (85.5%).
| Industry | Male | Female |
| Agriculture, Fishing & Hunting | 0 (0.0%) | 0 (0.0%) |
| Mining, Quarrying, & Extraction | 0 (0.0%) | 0 (0.0%) |
| Construction | 203 (100.0%) | 0 (0.0%) |
| Manufacturing | 36 (58.1%) | 26 (41.9%) |
| Wholesale Trade | 18 (100.0%) | 0 (0.0%) |
| Retail Trade | 162 (65.6%) | 85 (34.4%) |
| Transportation & Warehousing | 76 (55.9%) | 60 (44.1%) |
| Utilities | 19 (100.0%) | 0 (0.0%) |
| Information | 61 (91.0%) | 6 (9.0%) |
| Finance & Insurance | 0 (0.0%) | 31 (100.0%) |
| Real Estate, Rental & Leasing | 19 (57.6%) | 14 (42.4%) |
| Professional & Scientific | 29 (50.9%) | 28 (49.1%) |
| Enterprise Management | 0 (0.0%) | 0 (0.0%) |
| Administrative & Support | 5 (17.9%) | 23 (82.1%) |
| Educational Services | 13 (14.4%) | 77 (85.6%) |
| Health Care & Social Assistance | 73 (14.5%) | 432 (85.5%) |
| Arts, Entertainment & Recreation | 25 (75.8%) | 8 (24.2%) |
| Accommodation & Food Services | 64 (61.0%) | 41 (39.1%) |
| Public Administration | 33 (51.6%) | 31 (48.4%) |
| Total | 863 (48.2%) | 927 (51.8%) |
Education in South Toms River borough
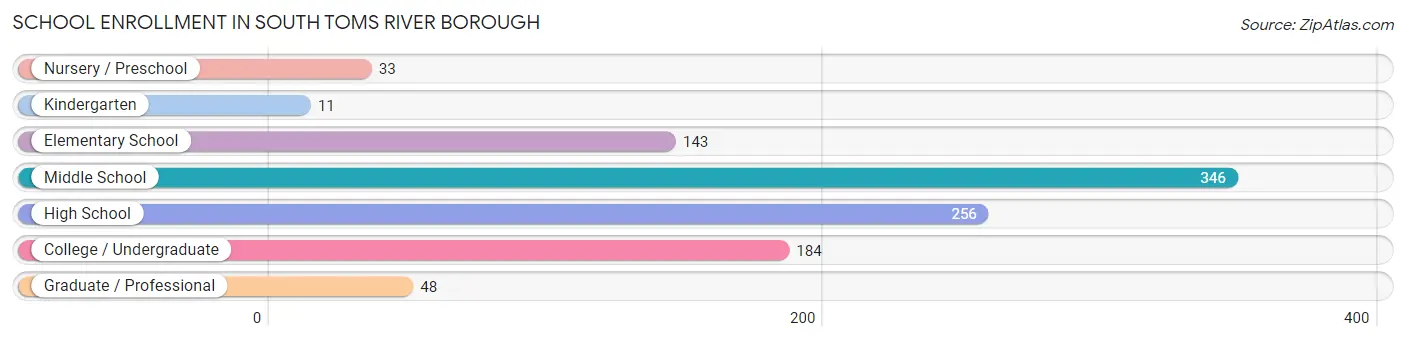
School Enrollment in South Toms River borough
The most common levels of schooling among the 1,021 students in South Toms River borough are middle school (346 | 33.9%), high school (256 | 25.1%), and college / undergraduate (184 | 18.0%).
| School Level | # Students | % Students |
| Nursery / Preschool | 33 | 3.2% |
| Kindergarten | 11 | 1.1% |
| Elementary School | 143 | 14.0% |
| Middle School | 346 | 33.9% |
| High School | 256 | 25.1% |
| College / Undergraduate | 184 | 18.0% |
| Graduate / Professional | 48 | 4.7% |
| Total | 1,021 | 100.0% |
School Enrollment by Age by Funding Source in South Toms River borough
Out of a total of 1,021 students who are enrolled in schools in South Toms River borough, 152 (14.9%) attend a private institution, while the remaining 869 (85.1%) are enrolled in public schools. The age group of 25 to 34 year olds has the highest likelihood of being enrolled in private schools, with 18 (58.1% in the age bracket) enrolled. Conversely, the age group of 15 to 17 year olds has the lowest likelihood of being enrolled in a private school, with 189 (96.4% in the age bracket) attending a public institution.
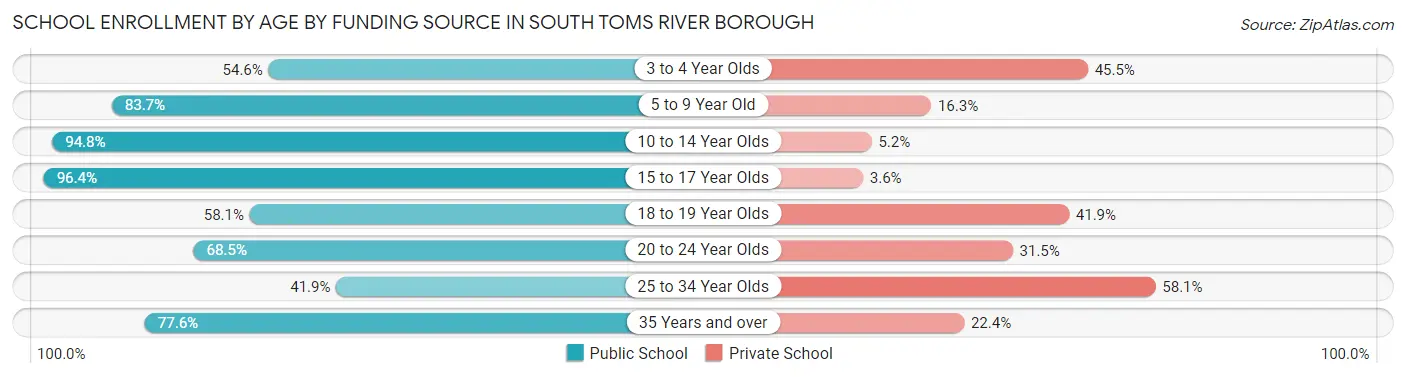
| Age Bracket | Public School | Private School |
| 3 to 4 Year Olds | 18 (54.5%) | 15 (45.5%) |
| 5 to 9 Year Old | 103 (83.7%) | 20 (16.3%) |
| 10 to 14 Year Olds | 385 (94.8%) | 21 (5.2%) |
| 15 to 17 Year Olds | 189 (96.4%) | 7 (3.6%) |
| 18 to 19 Year Olds | 18 (58.1%) | 13 (41.9%) |
| 20 to 24 Year Olds | 98 (68.5%) | 45 (31.5%) |
| 25 to 34 Year Olds | 13 (41.9%) | 18 (58.1%) |
| 35 Years and over | 45 (77.6%) | 13 (22.4%) |
| Total | 869 (85.1%) | 152 (14.9%) |
Educational Attainment by Field of Study in South Toms River borough
Business (105 | 28.6%), engineering (46 | 12.5%), liberal arts & history (45 | 12.3%), physical & health sciences (30 | 8.2%), and education (27 | 7.4%) are the most common fields of study among 367 individuals in South Toms River borough who have obtained a bachelor's degree or higher.
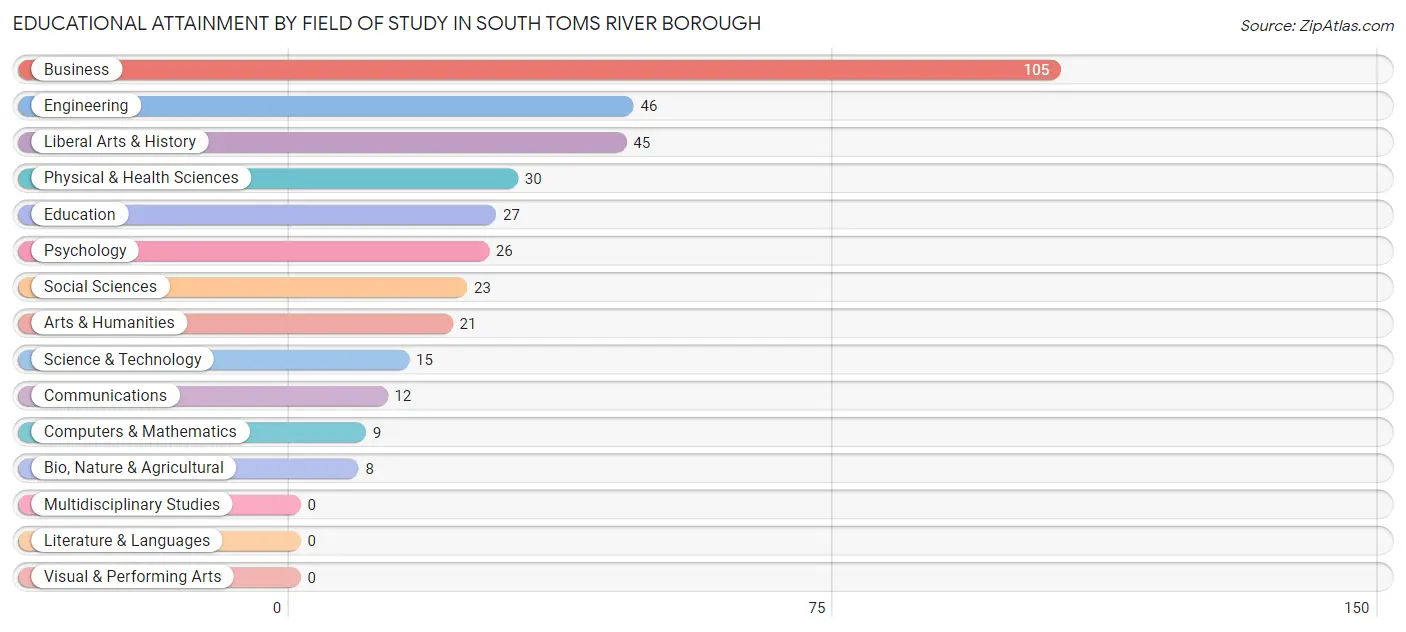
| Field of Study | # Graduates | % Graduates |
| Computers & Mathematics | 9 | 2.5% |
| Bio, Nature & Agricultural | 8 | 2.2% |
| Physical & Health Sciences | 30 | 8.2% |
| Psychology | 26 | 7.1% |
| Social Sciences | 23 | 6.3% |
| Engineering | 46 | 12.5% |
| Multidisciplinary Studies | 0 | 0.0% |
| Science & Technology | 15 | 4.1% |
| Business | 105 | 28.6% |
| Education | 27 | 7.4% |
| Literature & Languages | 0 | 0.0% |
| Liberal Arts & History | 45 | 12.3% |
| Visual & Performing Arts | 0 | 0.0% |
| Communications | 12 | 3.3% |
| Arts & Humanities | 21 | 5.7% |
| Total | 367 | 100.0% |
Transportation & Commute in South Toms River borough
Vehicle Availability by Sex in South Toms River borough
The most prevalent vehicle ownership categories in South Toms River borough are males with 2 vehicles (331, accounting for 37.7%) and females with 2 vehicles (324, making up 36.1%).
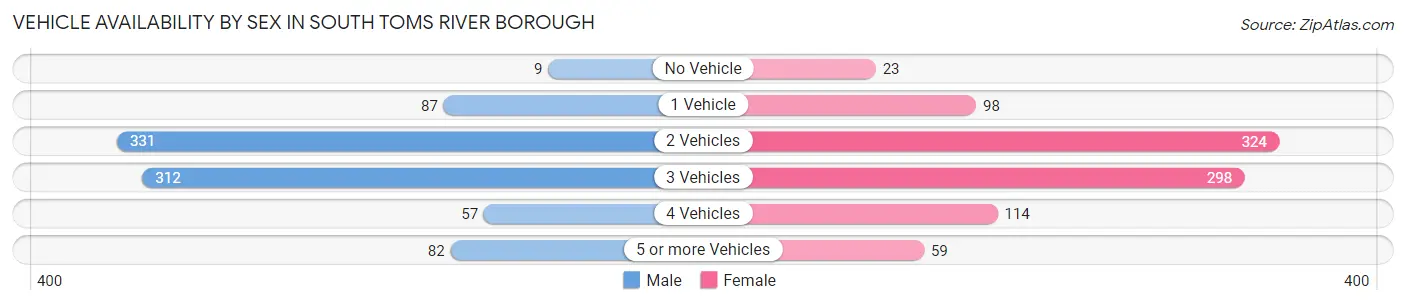
| Vehicles Available | Male | Female |
| No Vehicle | 9 (1.0%) | 23 (2.5%) |
| 1 Vehicle | 87 (9.9%) | 98 (10.7%) |
| 2 Vehicles | 331 (37.7%) | 324 (35.4%) |
| 3 Vehicles | 312 (35.5%) | 298 (32.5%) |
| 4 Vehicles | 57 (6.5%) | 114 (12.4%) |
| 5 or more Vehicles | 82 (9.3%) | 59 (6.4%) |
| Total | 878 (100.0%) | 916 (100.0%) |
Commute Time in South Toms River borough
The most frequently occuring commute durations in South Toms River borough are 10 to 14 minutes (352 commuters, 20.5%), 20 to 24 minutes (279 commuters, 16.2%), and 15 to 19 minutes (246 commuters, 14.3%).
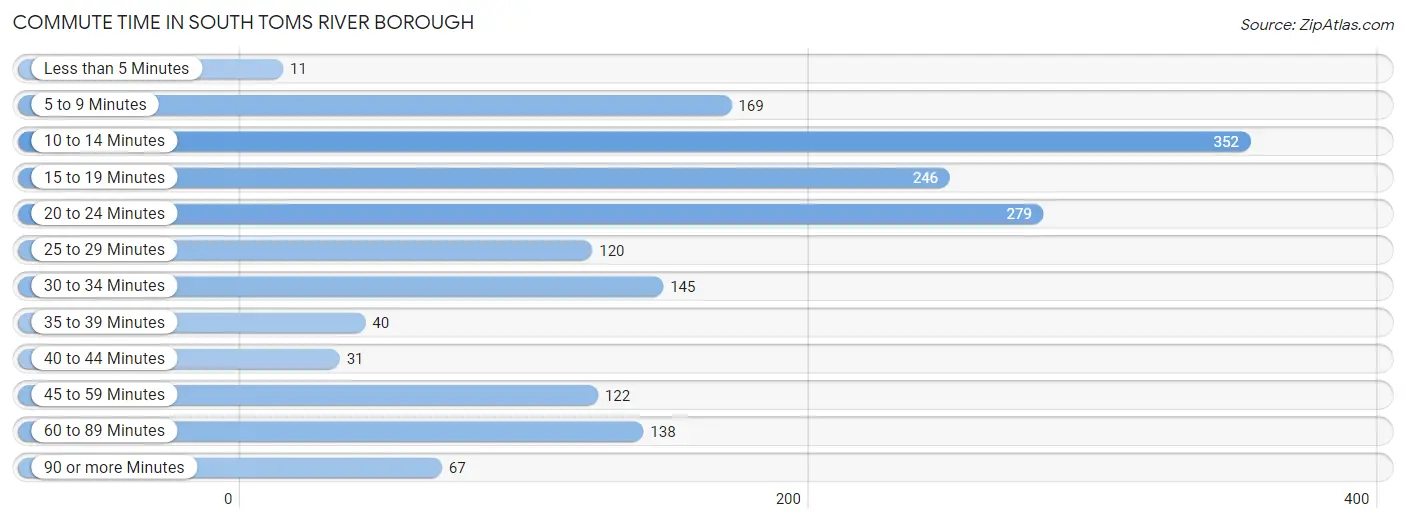
| Commute Time | # Commuters | % Commuters |
| Less than 5 Minutes | 11 | 0.6% |
| 5 to 9 Minutes | 169 | 9.8% |
| 10 to 14 Minutes | 352 | 20.5% |
| 15 to 19 Minutes | 246 | 14.3% |
| 20 to 24 Minutes | 279 | 16.2% |
| 25 to 29 Minutes | 120 | 7.0% |
| 30 to 34 Minutes | 145 | 8.4% |
| 35 to 39 Minutes | 40 | 2.3% |
| 40 to 44 Minutes | 31 | 1.8% |
| 45 to 59 Minutes | 122 | 7.1% |
| 60 to 89 Minutes | 138 | 8.0% |
| 90 or more Minutes | 67 | 3.9% |
Commute Time by Sex in South Toms River borough
The most common commute times in South Toms River borough are 20 to 24 minutes (177 commuters, 21.8%) for males and 10 to 14 minutes (251 commuters, 27.6%) for females.
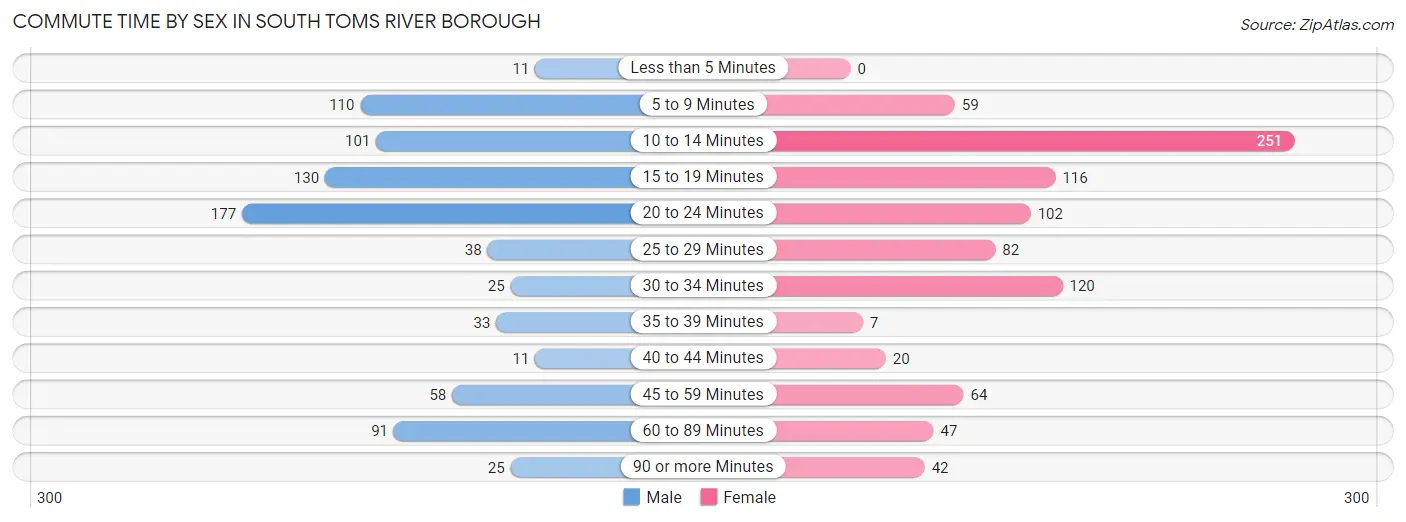
| Commute Time | Male | Female |
| Less than 5 Minutes | 11 (1.4%) | 0 (0.0%) |
| 5 to 9 Minutes | 110 (13.6%) | 59 (6.5%) |
| 10 to 14 Minutes | 101 (12.5%) | 251 (27.6%) |
| 15 to 19 Minutes | 130 (16.1%) | 116 (12.8%) |
| 20 to 24 Minutes | 177 (21.8%) | 102 (11.2%) |
| 25 to 29 Minutes | 38 (4.7%) | 82 (9.0%) |
| 30 to 34 Minutes | 25 (3.1%) | 120 (13.2%) |
| 35 to 39 Minutes | 33 (4.1%) | 7 (0.8%) |
| 40 to 44 Minutes | 11 (1.4%) | 20 (2.2%) |
| 45 to 59 Minutes | 58 (7.2%) | 64 (7.0%) |
| 60 to 89 Minutes | 91 (11.2%) | 47 (5.2%) |
| 90 or more Minutes | 25 (3.1%) | 42 (4.6%) |
Time of Departure to Work by Sex in South Toms River borough
The most frequent times of departure to work in South Toms River borough are 4:00 PM to 11:59 PM (110, 13.6%) for males and 7:30 AM to 7:59 AM (210, 23.1%) for females.
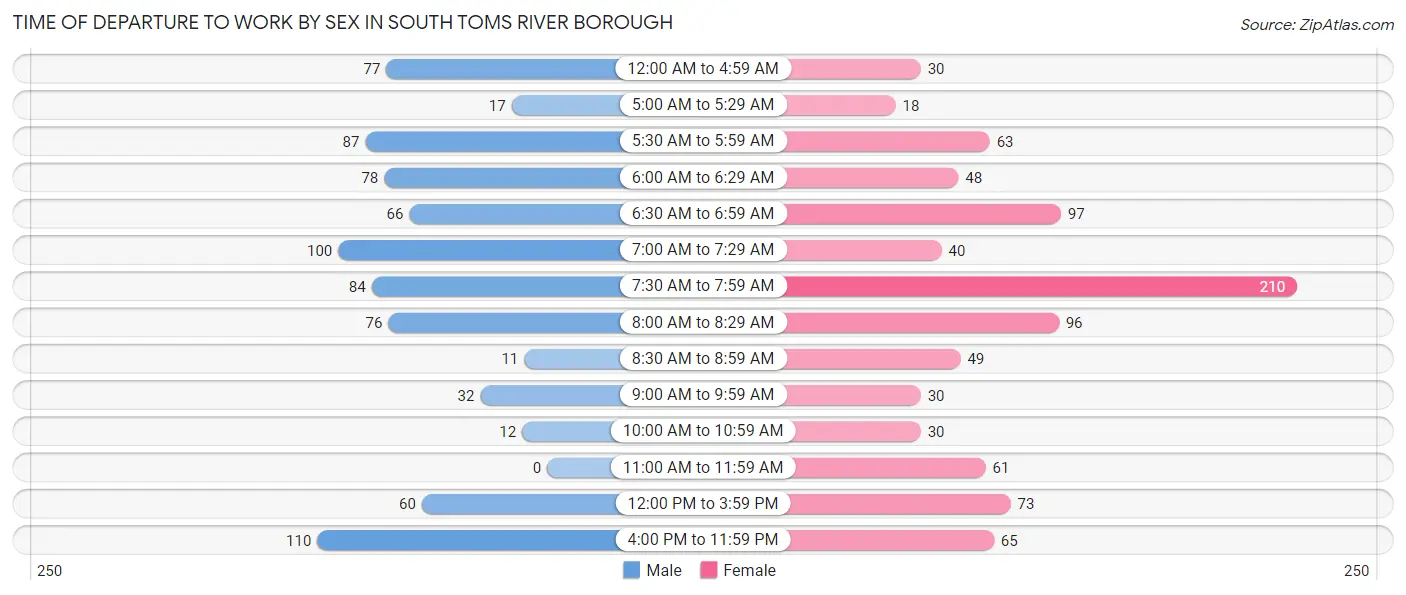
| Time of Departure | Male | Female |
| 12:00 AM to 4:59 AM | 77 (9.5%) | 30 (3.3%) |
| 5:00 AM to 5:29 AM | 17 (2.1%) | 18 (2.0%) |
| 5:30 AM to 5:59 AM | 87 (10.7%) | 63 (6.9%) |
| 6:00 AM to 6:29 AM | 78 (9.6%) | 48 (5.3%) |
| 6:30 AM to 6:59 AM | 66 (8.2%) | 97 (10.7%) |
| 7:00 AM to 7:29 AM | 100 (12.3%) | 40 (4.4%) |
| 7:30 AM to 7:59 AM | 84 (10.4%) | 210 (23.1%) |
| 8:00 AM to 8:29 AM | 76 (9.4%) | 96 (10.5%) |
| 8:30 AM to 8:59 AM | 11 (1.4%) | 49 (5.4%) |
| 9:00 AM to 9:59 AM | 32 (4.0%) | 30 (3.3%) |
| 10:00 AM to 10:59 AM | 12 (1.5%) | 30 (3.3%) |
| 11:00 AM to 11:59 AM | 0 (0.0%) | 61 (6.7%) |
| 12:00 PM to 3:59 PM | 60 (7.4%) | 73 (8.0%) |
| 4:00 PM to 11:59 PM | 110 (13.6%) | 65 (7.1%) |
| Total | 810 (100.0%) | 910 (100.0%) |
Housing Occupancy in South Toms River borough
Occupancy by Ownership in South Toms River borough
Of the total 1,098 dwellings in South Toms River borough, owner-occupied units account for 902 (82.2%), while renter-occupied units make up 196 (17.8%).
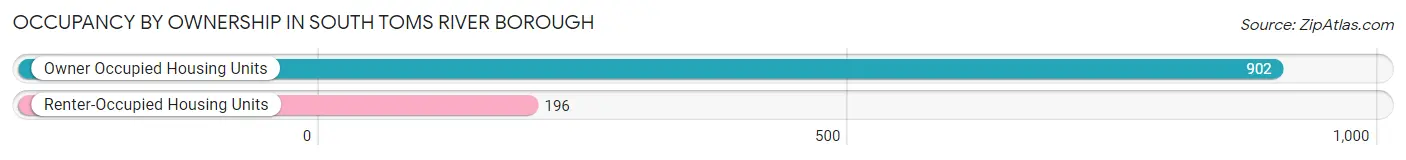
| Occupancy | # Housing Units | % Housing Units |
| Owner Occupied Housing Units | 902 | 82.2% |
| Renter-Occupied Housing Units | 196 | 17.8% |
| Total Occupied Housing Units | 1,098 | 100.0% |
Occupancy by Household Size in South Toms River borough
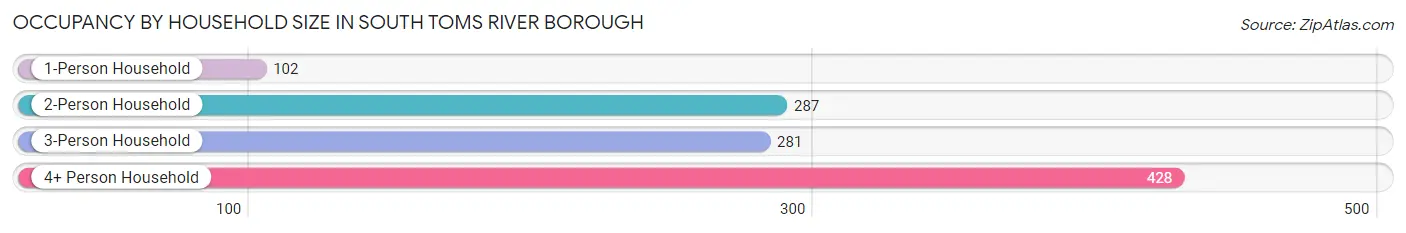
| Household Size | # Housing Units | % Housing Units |
| 1-Person Household | 102 | 9.3% |
| 2-Person Household | 287 | 26.1% |
| 3-Person Household | 281 | 25.6% |
| 4+ Person Household | 428 | 39.0% |
| Total Housing Units | 1,098 | 100.0% |
Occupancy by Ownership by Household Size in South Toms River borough
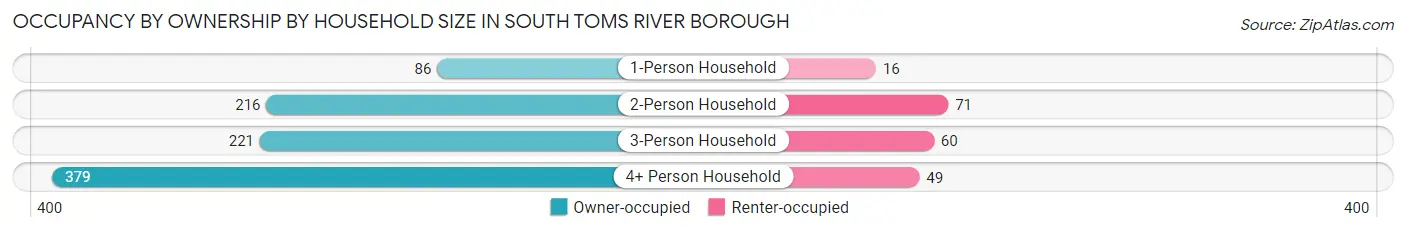
| Household Size | Owner-occupied | Renter-occupied |
| 1-Person Household | 86 (84.3%) | 16 (15.7%) |
| 2-Person Household | 216 (75.3%) | 71 (24.7%) |
| 3-Person Household | 221 (78.6%) | 60 (21.3%) |
| 4+ Person Household | 379 (88.5%) | 49 (11.5%) |
| Total Housing Units | 902 (82.2%) | 196 (17.8%) |
Occupancy by Educational Attainment in South Toms River borough
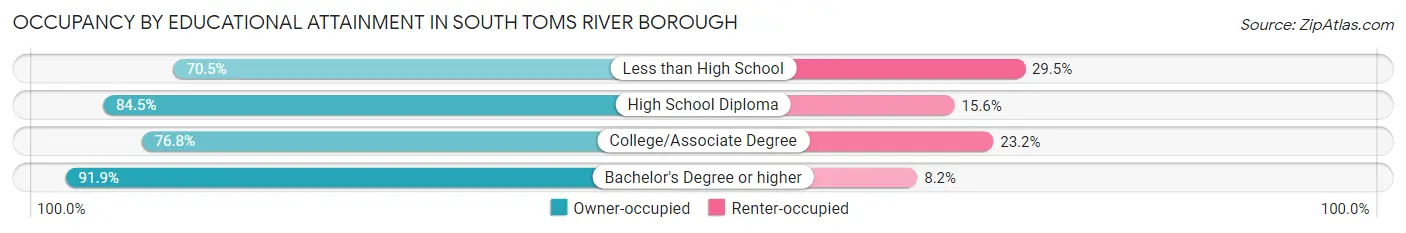
| Household Size | Owner-occupied | Renter-occupied |
| Less than High School | 98 (70.5%) | 41 (29.5%) |
| High School Diploma | 440 (84.5%) | 81 (15.5%) |
| College/Associate Degree | 195 (76.8%) | 59 (23.2%) |
| Bachelor's Degree or higher | 169 (91.8%) | 15 (8.2%) |
Occupancy by Age of Householder in South Toms River borough
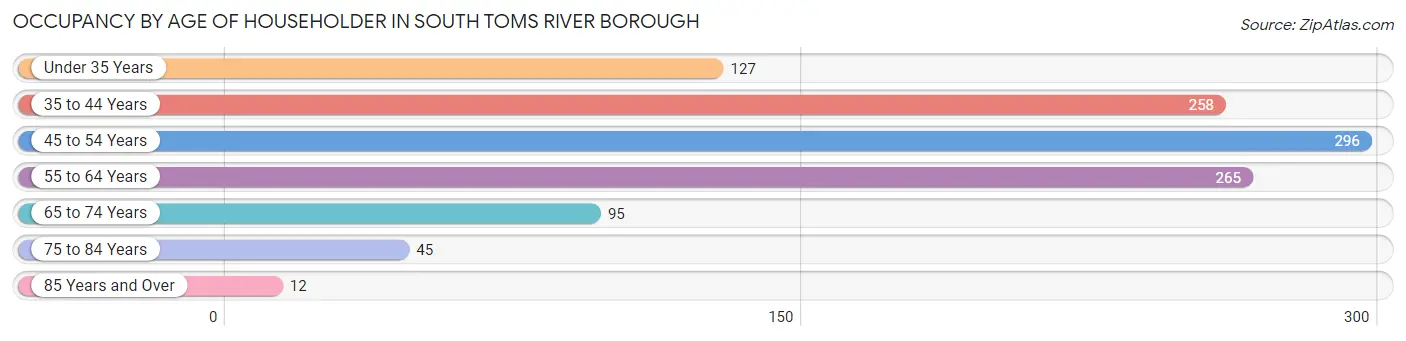
| Age Bracket | # Households | % Households |
| Under 35 Years | 127 | 11.6% |
| 35 to 44 Years | 258 | 23.5% |
| 45 to 54 Years | 296 | 27.0% |
| 55 to 64 Years | 265 | 24.1% |
| 65 to 74 Years | 95 | 8.6% |
| 75 to 84 Years | 45 | 4.1% |
| 85 Years and Over | 12 | 1.1% |
| Total | 1,098 | 100.0% |
Housing Finances in South Toms River borough
Median Income by Occupancy in South Toms River borough
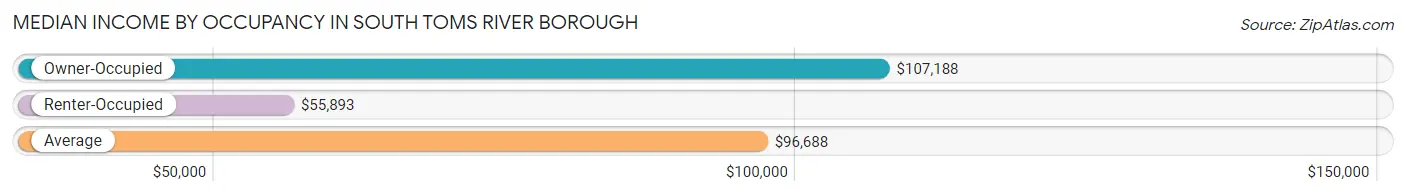
| Occupancy Type | # Households | Median Income |
| Owner-Occupied | 902 (82.2%) | $107,188 |
| Renter-Occupied | 196 (17.8%) | $55,893 |
| Average | 1,098 (100.0%) | $96,688 |
Occupancy by Householder Income Bracket in South Toms River borough
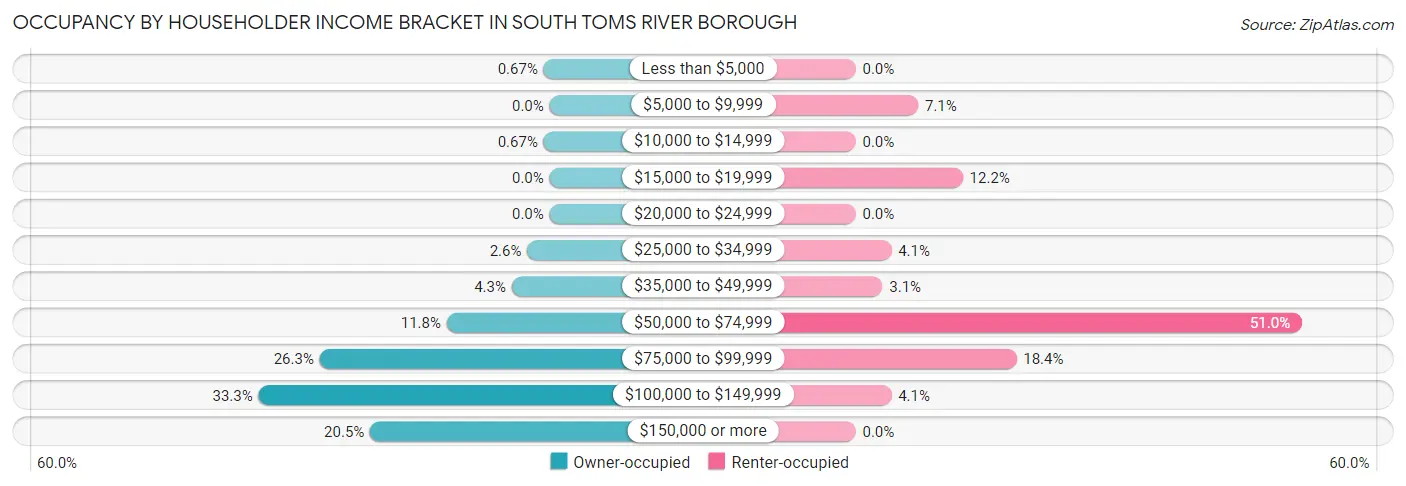
| Income Bracket | Owner-occupied | Renter-occupied |
| Less than $5,000 | 6 (0.7%) | 0 (0.0%) |
| $5,000 to $9,999 | 0 (0.0%) | 14 (7.1%) |
| $10,000 to $14,999 | 6 (0.7%) | 0 (0.0%) |
| $15,000 to $19,999 | 0 (0.0%) | 24 (12.2%) |
| $20,000 to $24,999 | 0 (0.0%) | 0 (0.0%) |
| $25,000 to $34,999 | 23 (2.5%) | 8 (4.1%) |
| $35,000 to $49,999 | 39 (4.3%) | 6 (3.1%) |
| $50,000 to $74,999 | 106 (11.7%) | 100 (51.0%) |
| $75,000 to $99,999 | 237 (26.3%) | 36 (18.4%) |
| $100,000 to $149,999 | 300 (33.3%) | 8 (4.1%) |
| $150,000 or more | 185 (20.5%) | 0 (0.0%) |
| Total | 902 (100.0%) | 196 (100.0%) |
Monthly Housing Cost Tiers in South Toms River borough
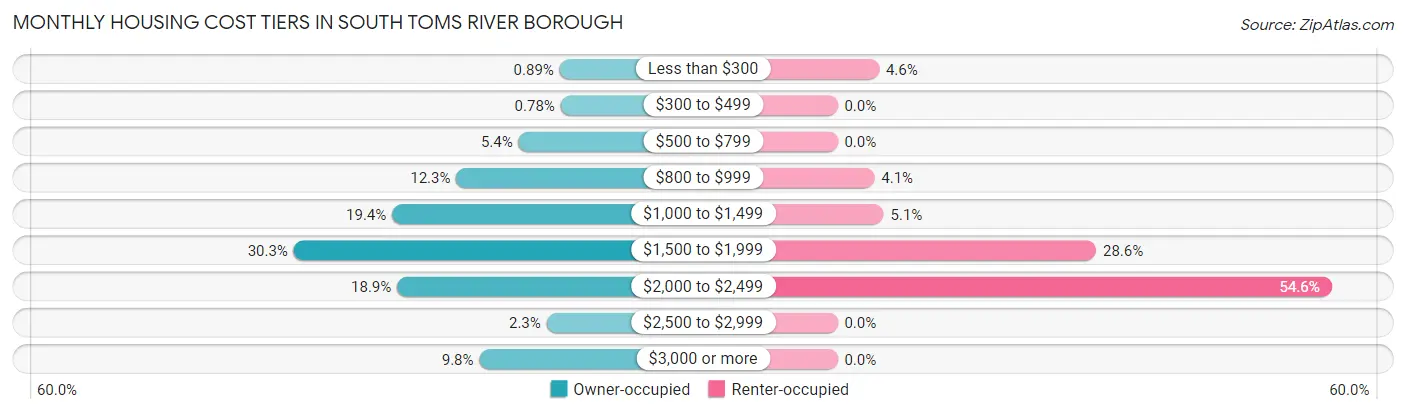
| Monthly Cost | Owner-occupied | Renter-occupied |
| Less than $300 | 8 (0.9%) | 9 (4.6%) |
| $300 to $499 | 7 (0.8%) | 0 (0.0%) |
| $500 to $799 | 49 (5.4%) | 0 (0.0%) |
| $800 to $999 | 111 (12.3%) | 8 (4.1%) |
| $1,000 to $1,499 | 175 (19.4%) | 10 (5.1%) |
| $1,500 to $1,999 | 273 (30.3%) | 56 (28.6%) |
| $2,000 to $2,499 | 170 (18.9%) | 107 (54.6%) |
| $2,500 to $2,999 | 21 (2.3%) | 0 (0.0%) |
| $3,000 or more | 88 (9.8%) | 0 (0.0%) |
| Total | 902 (100.0%) | 196 (100.0%) |
Physical Housing Characteristics in South Toms River borough
Housing Structures in South Toms River borough
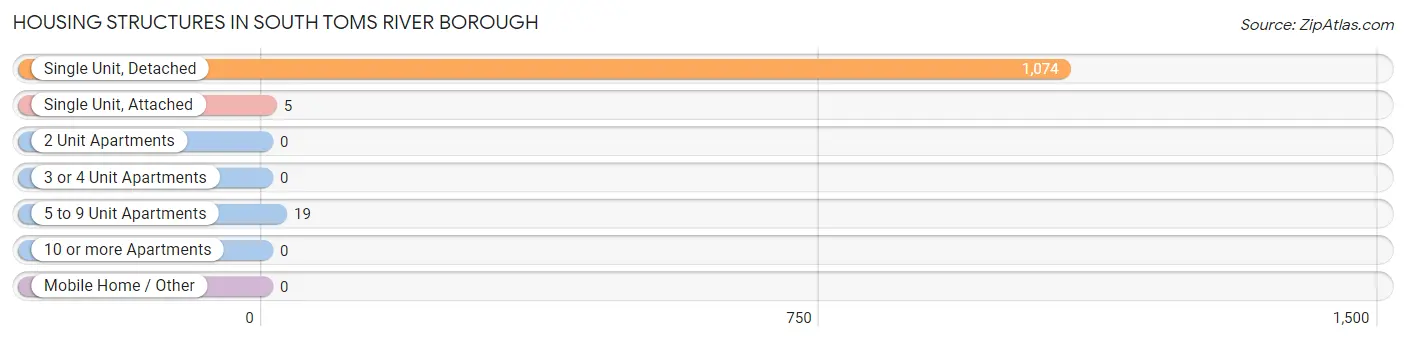
| Structure Type | # Housing Units | % Housing Units |
| Single Unit, Detached | 1,074 | 97.8% |
| Single Unit, Attached | 5 | 0.5% |
| 2 Unit Apartments | 0 | 0.0% |
| 3 or 4 Unit Apartments | 0 | 0.0% |
| 5 to 9 Unit Apartments | 19 | 1.7% |
| 10 or more Apartments | 0 | 0.0% |
| Mobile Home / Other | 0 | 0.0% |
| Total | 1,098 | 100.0% |
Housing Structures by Occupancy in South Toms River borough
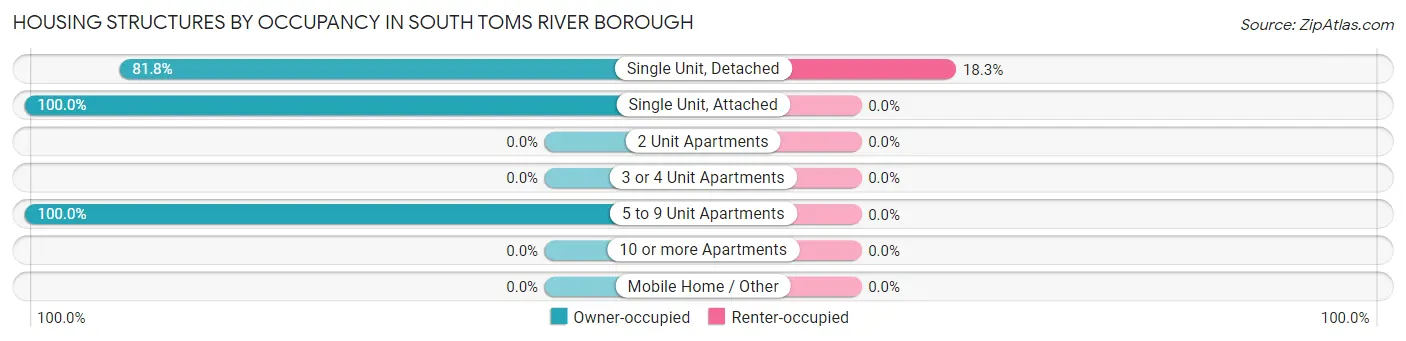
| Structure Type | Owner-occupied | Renter-occupied |
| Single Unit, Detached | 878 (81.8%) | 196 (18.2%) |
| Single Unit, Attached | 5 (100.0%) | 0 (0.0%) |
| 2 Unit Apartments | 0 (0.0%) | 0 (0.0%) |
| 3 or 4 Unit Apartments | 0 (0.0%) | 0 (0.0%) |
| 5 to 9 Unit Apartments | 19 (100.0%) | 0 (0.0%) |
| 10 or more Apartments | 0 (0.0%) | 0 (0.0%) |
| Mobile Home / Other | 0 (0.0%) | 0 (0.0%) |
| Total | 902 (82.2%) | 196 (17.8%) |
Housing Structures by Number of Rooms in South Toms River borough
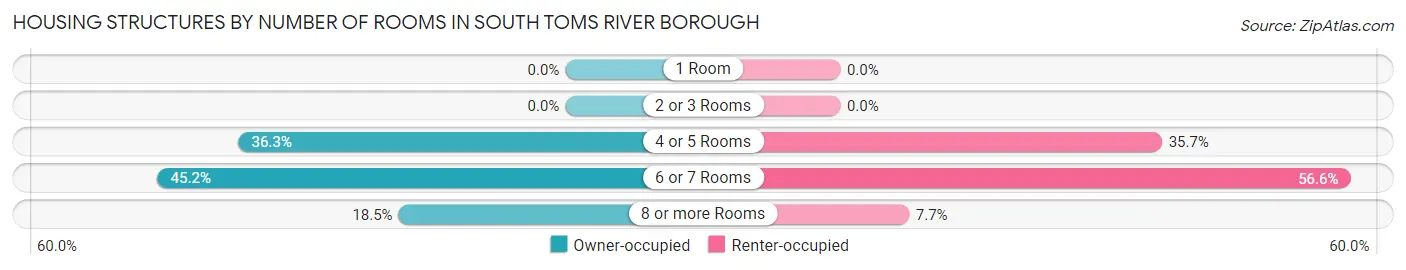
| Number of Rooms | Owner-occupied | Renter-occupied |
| 1 Room | 0 (0.0%) | 0 (0.0%) |
| 2 or 3 Rooms | 0 (0.0%) | 0 (0.0%) |
| 4 or 5 Rooms | 327 (36.2%) | 70 (35.7%) |
| 6 or 7 Rooms | 408 (45.2%) | 111 (56.6%) |
| 8 or more Rooms | 167 (18.5%) | 15 (7.6%) |
| Total | 902 (100.0%) | 196 (100.0%) |
Housing Structure by Heating Type in South Toms River borough
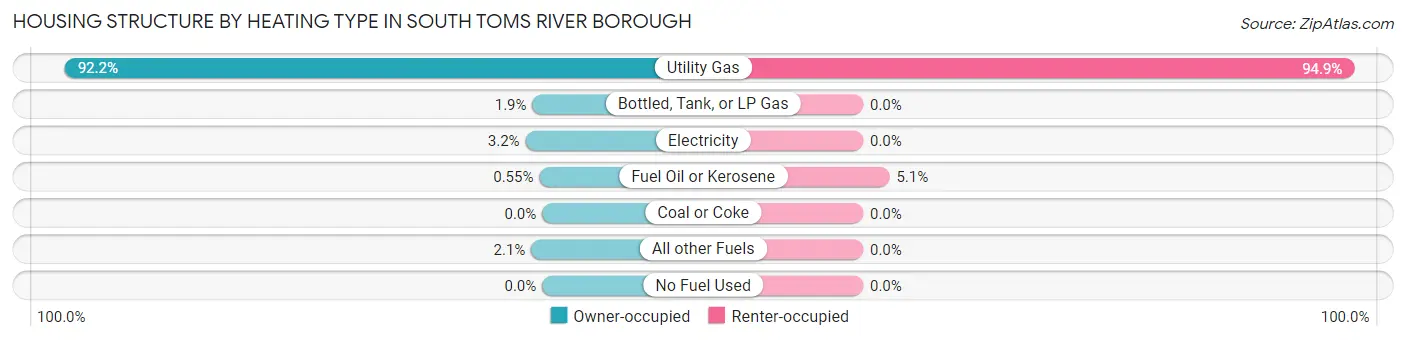
| Heating Type | Owner-occupied | Renter-occupied |
| Utility Gas | 832 (92.2%) | 186 (94.9%) |
| Bottled, Tank, or LP Gas | 17 (1.9%) | 0 (0.0%) |
| Electricity | 29 (3.2%) | 0 (0.0%) |
| Fuel Oil or Kerosene | 5 (0.5%) | 10 (5.1%) |
| Coal or Coke | 0 (0.0%) | 0 (0.0%) |
| All other Fuels | 19 (2.1%) | 0 (0.0%) |
| No Fuel Used | 0 (0.0%) | 0 (0.0%) |
| Total | 902 (100.0%) | 196 (100.0%) |
Household Vehicle Usage in South Toms River borough
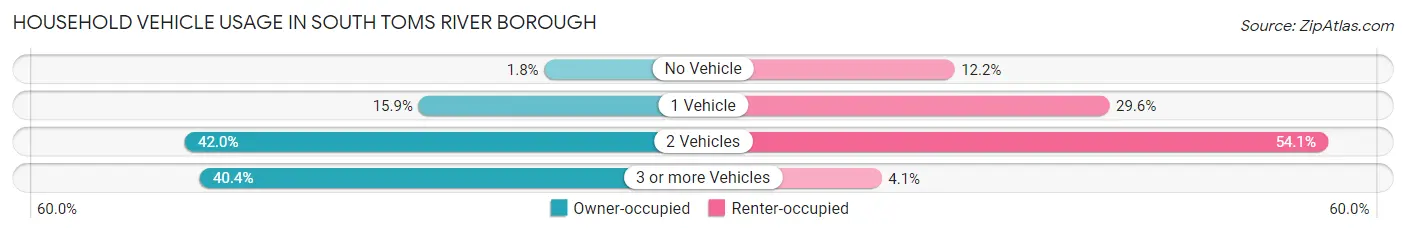
| Vehicles per Household | Owner-occupied | Renter-occupied |
| No Vehicle | 16 (1.8%) | 24 (12.2%) |
| 1 Vehicle | 143 (15.9%) | 58 (29.6%) |
| 2 Vehicles | 379 (42.0%) | 106 (54.1%) |
| 3 or more Vehicles | 364 (40.4%) | 8 (4.1%) |
| Total | 902 (100.0%) | 196 (100.0%) |
Real Estate & Mortgages in South Toms River borough
Real Estate and Mortgage Overview in South Toms River borough
| Characteristic | Without Mortgage | With Mortgage |
| Housing Units | 234 | 668 |
| Median Property Value | $200,000 | $255,400 |
| Median Household Income | $89,643 | $118 |
| Monthly Housing Costs | $904 | $88 |
| Real Estate Taxes | $5,880 | $5 |
Property Value by Mortgage Status in South Toms River borough
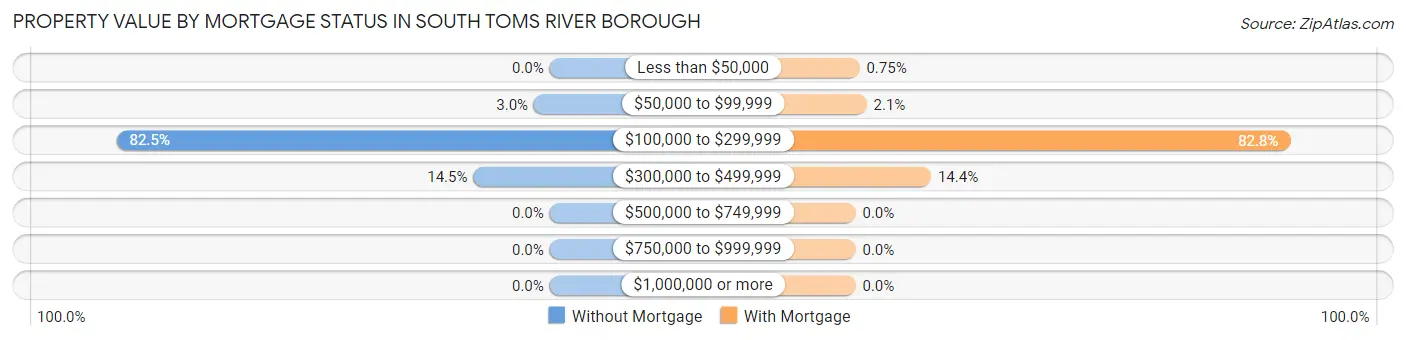
| Property Value | Without Mortgage | With Mortgage |
| Less than $50,000 | 0 (0.0%) | 5 (0.7%) |
| $50,000 to $99,999 | 7 (3.0%) | 14 (2.1%) |
| $100,000 to $299,999 | 193 (82.5%) | 553 (82.8%) |
| $300,000 to $499,999 | 34 (14.5%) | 96 (14.4%) |
| $500,000 to $749,999 | 0 (0.0%) | 0 (0.0%) |
| $750,000 to $999,999 | 0 (0.0%) | 0 (0.0%) |
| $1,000,000 or more | 0 (0.0%) | 0 (0.0%) |
| Total | 234 (100.0%) | 668 (100.0%) |
Household Income by Mortgage Status in South Toms River borough
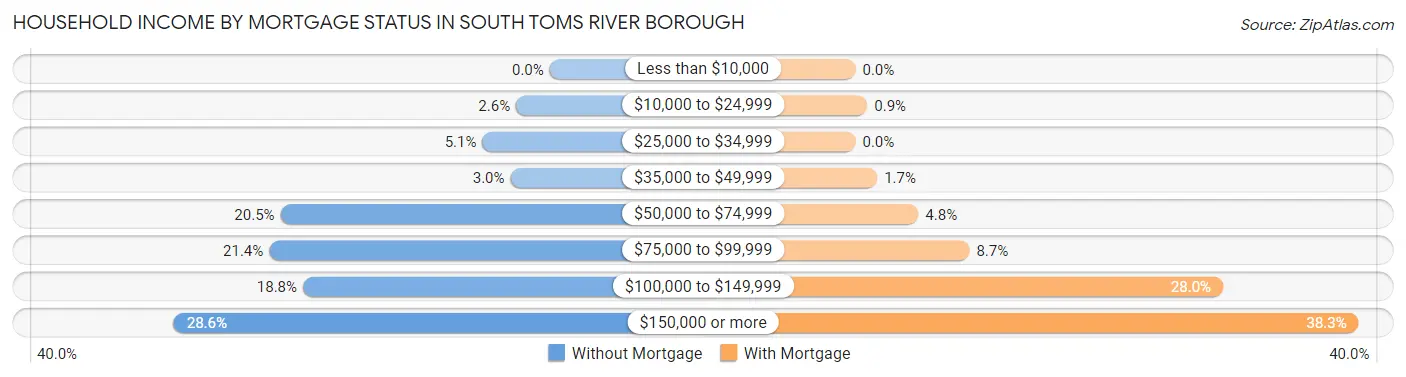
| Household Income | Without Mortgage | With Mortgage |
| Less than $10,000 | 0 (0.0%) | 0 (0.0%) |
| $10,000 to $24,999 | 6 (2.6%) | 6 (0.9%) |
| $25,000 to $34,999 | 12 (5.1%) | 0 (0.0%) |
| $35,000 to $49,999 | 7 (3.0%) | 11 (1.7%) |
| $50,000 to $74,999 | 48 (20.5%) | 32 (4.8%) |
| $75,000 to $99,999 | 50 (21.4%) | 58 (8.7%) |
| $100,000 to $149,999 | 44 (18.8%) | 187 (28.0%) |
| $150,000 or more | 67 (28.6%) | 256 (38.3%) |
| Total | 234 (100.0%) | 668 (100.0%) |
Property Value to Household Income Ratio in South Toms River borough
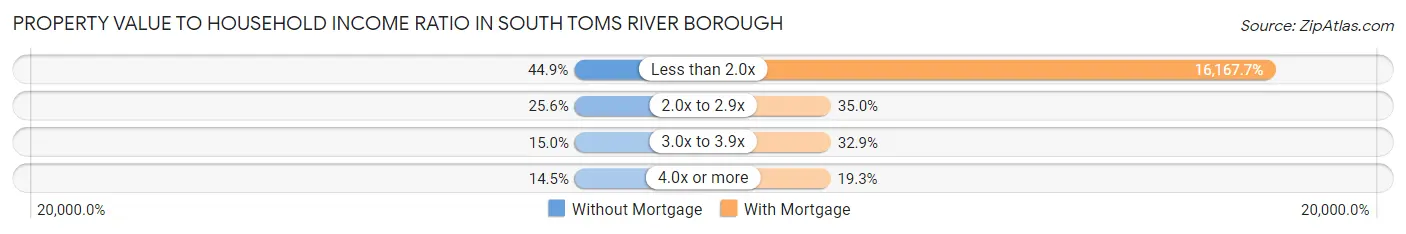
| Value-to-Income Ratio | Without Mortgage | With Mortgage |
| Less than 2.0x | 105 (44.9%) | 108,000 (16,167.7%) |
| 2.0x to 2.9x | 60 (25.6%) | 234 (35.0%) |
| 3.0x to 3.9x | 35 (15.0%) | 220 (32.9%) |
| 4.0x or more | 34 (14.5%) | 129 (19.3%) |
| Total | 234 (100.0%) | 668 (100.0%) |
Real Estate Taxes by Mortgage Status in South Toms River borough
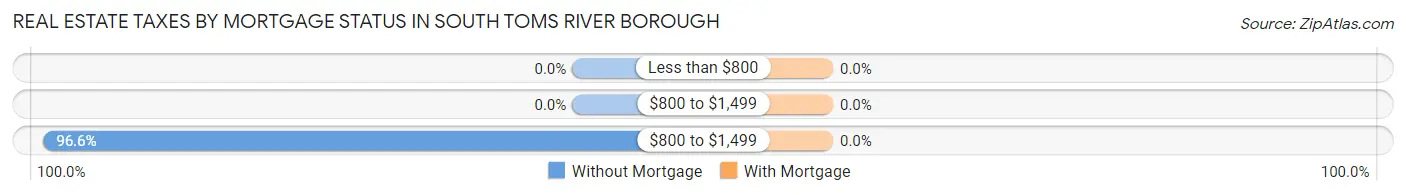
| Property Taxes | Without Mortgage | With Mortgage |
| Less than $800 | 0 (0.0%) | 0 (0.0%) |
| $800 to $1,499 | 0 (0.0%) | 0 (0.0%) |
| $800 to $1,499 | 226 (96.6%) | 0 (0.0%) |
| Total | 234 (100.0%) | 668 (100.0%) |
Health & Disability in South Toms River borough
Health Insurance Coverage by Age in South Toms River borough
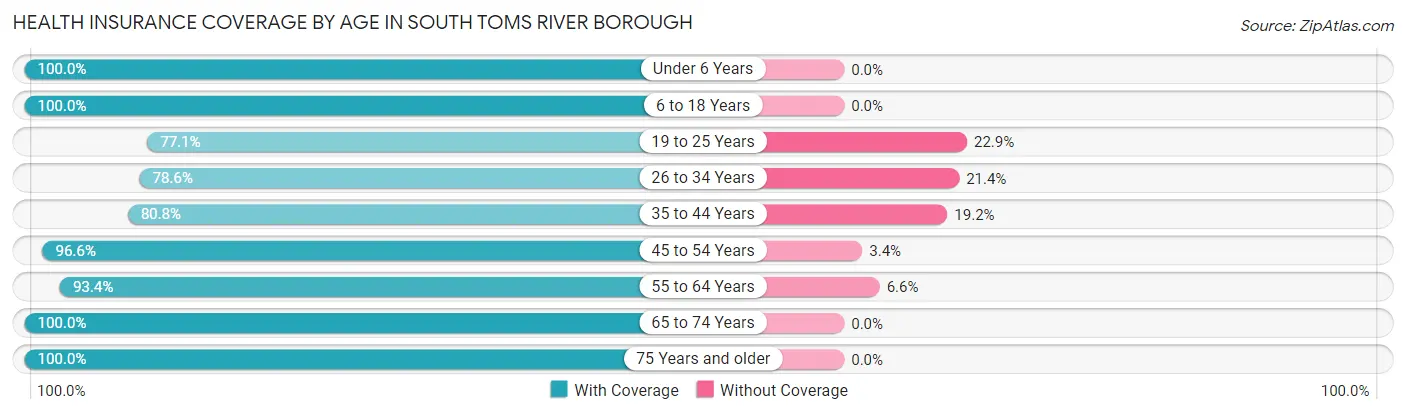
| Age Bracket | With Coverage | Without Coverage |
| Under 6 Years | 317 (100.0%) | 0 (0.0%) |
| 6 to 18 Years | 755 (100.0%) | 0 (0.0%) |
| 19 to 25 Years | 283 (77.1%) | 84 (22.9%) |
| 26 to 34 Years | 352 (78.6%) | 96 (21.4%) |
| 35 to 44 Years | 420 (80.8%) | 100 (19.2%) |
| 45 to 54 Years | 431 (96.6%) | 15 (3.4%) |
| 55 to 64 Years | 467 (93.4%) | 33 (6.6%) |
| 65 to 74 Years | 167 (100.0%) | 0 (0.0%) |
| 75 Years and older | 95 (100.0%) | 0 (0.0%) |
| Total | 3,287 (90.9%) | 328 (9.1%) |
Health Insurance Coverage by Citizenship Status in South Toms River borough
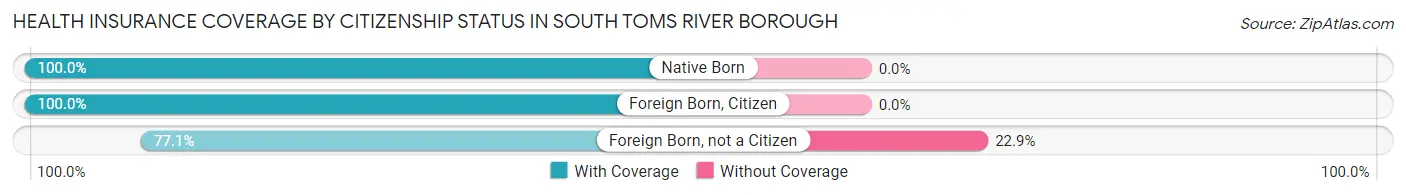
| Citizenship Status | With Coverage | Without Coverage |
| Native Born | 317 (100.0%) | 0 (0.0%) |
| Foreign Born, Citizen | 755 (100.0%) | 0 (0.0%) |
| Foreign Born, not a Citizen | 283 (77.1%) | 84 (22.9%) |
Health Insurance Coverage by Household Income in South Toms River borough
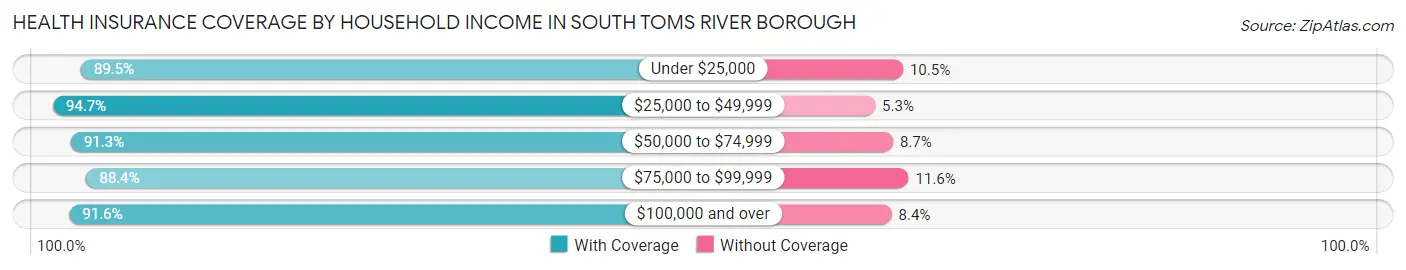
| Household Income | With Coverage | Without Coverage |
| Under $25,000 | 119 (89.5%) | 14 (10.5%) |
| $25,000 to $49,999 | 214 (94.7%) | 12 (5.3%) |
| $50,000 to $74,999 | 538 (91.3%) | 51 (8.7%) |
| $75,000 to $99,999 | 756 (88.4%) | 99 (11.6%) |
| $100,000 and over | 1,660 (91.6%) | 152 (8.4%) |
Public vs Private Health Insurance Coverage by Age in South Toms River borough
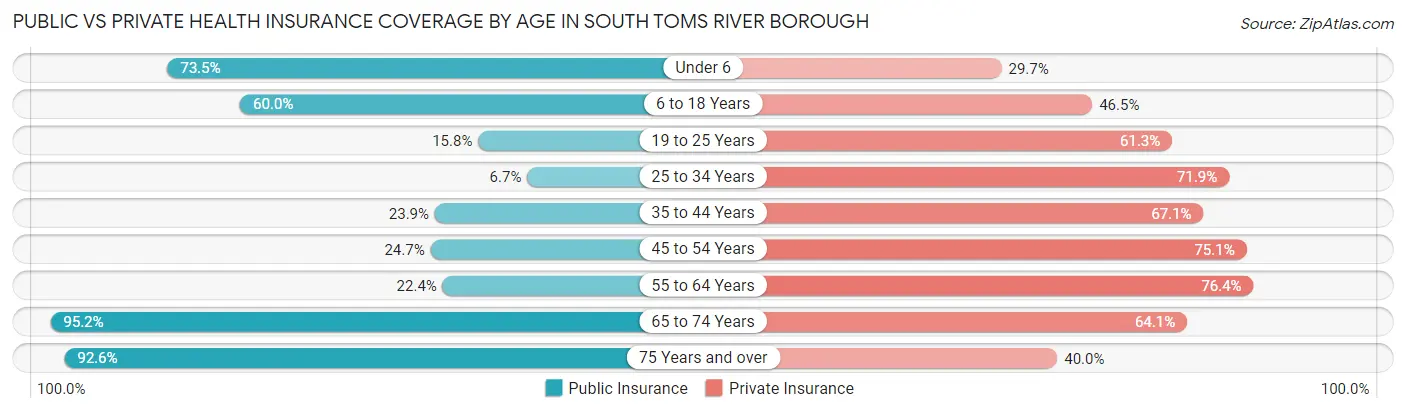
| Age Bracket | Public Insurance | Private Insurance |
| Under 6 | 233 (73.5%) | 94 (29.6%) |
| 6 to 18 Years | 453 (60.0%) | 351 (46.5%) |
| 19 to 25 Years | 58 (15.8%) | 225 (61.3%) |
| 25 to 34 Years | 30 (6.7%) | 322 (71.9%) |
| 35 to 44 Years | 124 (23.8%) | 349 (67.1%) |
| 45 to 54 Years | 110 (24.7%) | 335 (75.1%) |
| 55 to 64 Years | 112 (22.4%) | 382 (76.4%) |
| 65 to 74 Years | 159 (95.2%) | 107 (64.1%) |
| 75 Years and over | 88 (92.6%) | 38 (40.0%) |
| Total | 1,367 (37.8%) | 2,203 (60.9%) |
Disability Status by Sex by Age in South Toms River borough
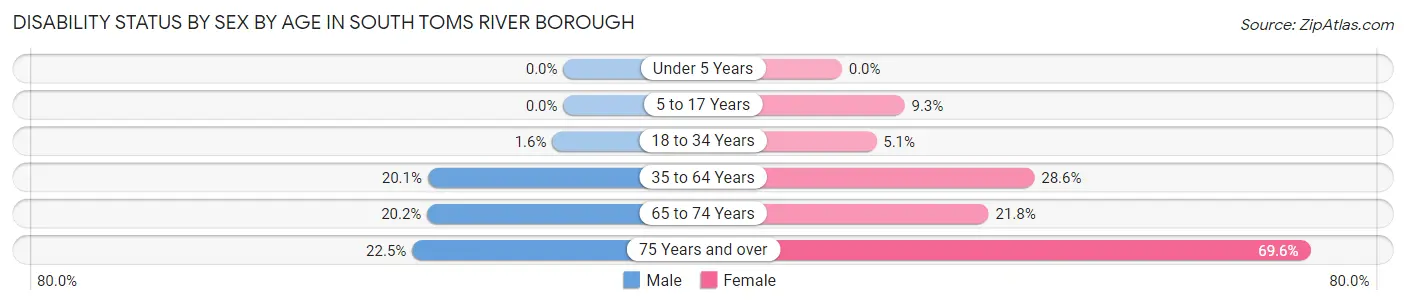
| Age Bracket | Male | Female |
| Under 5 Years | 0 (0.0%) | 0 (0.0%) |
| 5 to 17 Years | 0 (0.0%) | 37 (9.3%) |
| 18 to 34 Years | 7 (1.6%) | 21 (5.1%) |
| 35 to 64 Years | 124 (20.1%) | 243 (28.6%) |
| 65 to 74 Years | 18 (20.2%) | 17 (21.8%) |
| 75 Years and over | 11 (22.5%) | 32 (69.6%) |
Disability Class by Sex by Age in South Toms River borough
Disability Class: Hearing Difficulty
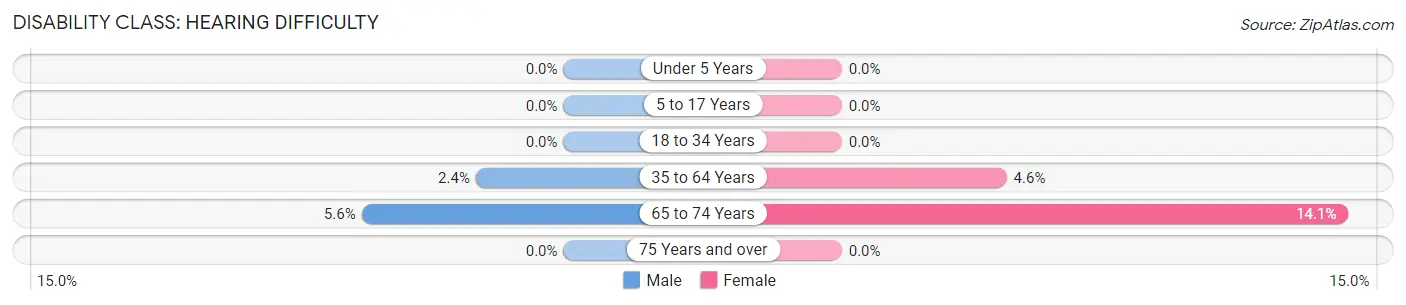
| Age Bracket | Male | Female |
| Under 5 Years | 0 (0.0%) | 0 (0.0%) |
| 5 to 17 Years | 0 (0.0%) | 0 (0.0%) |
| 18 to 34 Years | 0 (0.0%) | 0 (0.0%) |
| 35 to 64 Years | 15 (2.4%) | 39 (4.6%) |
| 65 to 74 Years | 5 (5.6%) | 11 (14.1%) |
| 75 Years and over | 0 (0.0%) | 0 (0.0%) |
Disability Class: Vision Difficulty
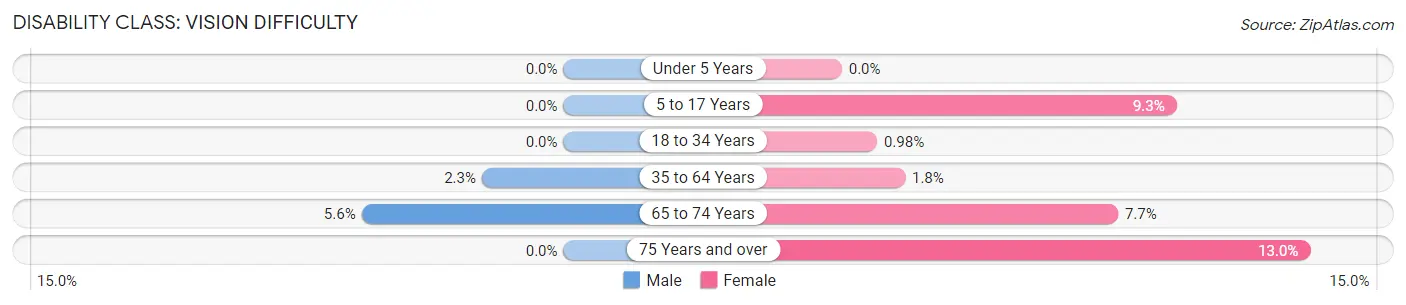
| Age Bracket | Male | Female |
| Under 5 Years | 0 (0.0%) | 0 (0.0%) |
| 5 to 17 Years | 0 (0.0%) | 37 (9.3%) |
| 18 to 34 Years | 0 (0.0%) | 4 (1.0%) |
| 35 to 64 Years | 14 (2.3%) | 15 (1.8%) |
| 65 to 74 Years | 5 (5.6%) | 6 (7.7%) |
| 75 Years and over | 0 (0.0%) | 6 (13.0%) |
Disability Class: Cognitive Difficulty
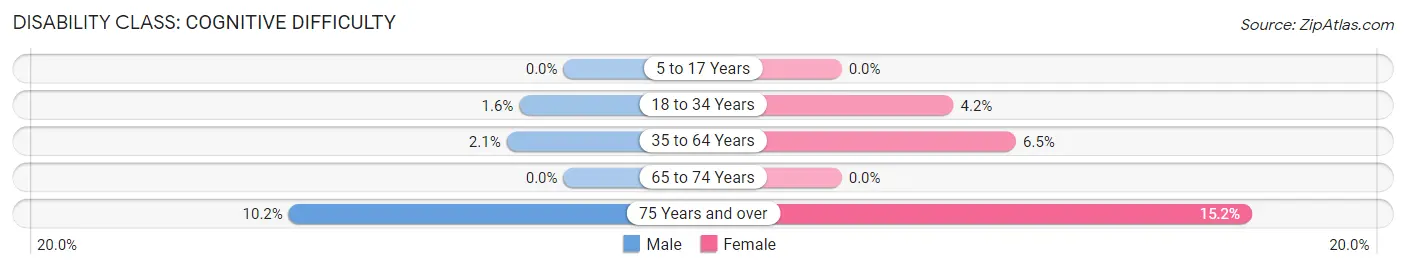
| Age Bracket | Male | Female |
| 5 to 17 Years | 0 (0.0%) | 0 (0.0%) |
| 18 to 34 Years | 7 (1.6%) | 17 (4.2%) |
| 35 to 64 Years | 13 (2.1%) | 55 (6.5%) |
| 65 to 74 Years | 0 (0.0%) | 0 (0.0%) |
| 75 Years and over | 5 (10.2%) | 7 (15.2%) |
Disability Class: Ambulatory Difficulty
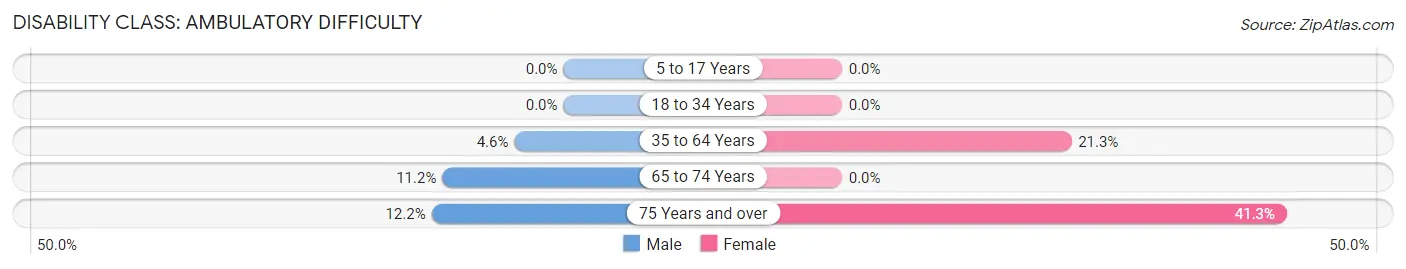
| Age Bracket | Male | Female |
| 5 to 17 Years | 0 (0.0%) | 0 (0.0%) |
| 18 to 34 Years | 0 (0.0%) | 0 (0.0%) |
| 35 to 64 Years | 28 (4.5%) | 181 (21.3%) |
| 65 to 74 Years | 10 (11.2%) | 0 (0.0%) |
| 75 Years and over | 6 (12.2%) | 19 (41.3%) |
Disability Class: Self-Care Difficulty
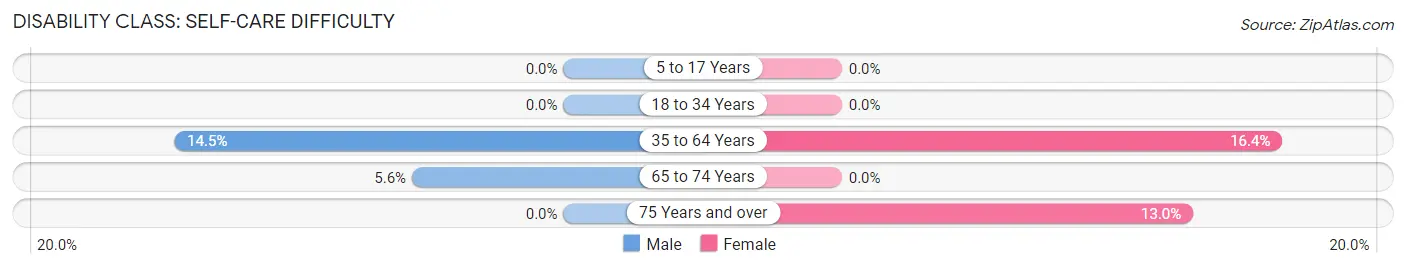
| Age Bracket | Male | Female |
| 5 to 17 Years | 0 (0.0%) | 0 (0.0%) |
| 18 to 34 Years | 0 (0.0%) | 0 (0.0%) |
| 35 to 64 Years | 89 (14.4%) | 139 (16.4%) |
| 65 to 74 Years | 5 (5.6%) | 0 (0.0%) |
| 75 Years and over | 0 (0.0%) | 6 (13.0%) |
Technology Access in South Toms River borough
Computing Device Access in South Toms River borough
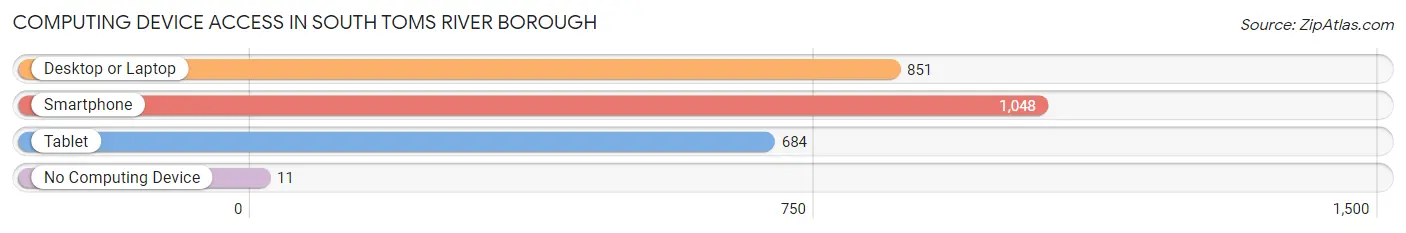
| Device Type | # Households | % Households |
| Desktop or Laptop | 851 | 77.5% |
| Smartphone | 1,048 | 95.5% |
| Tablet | 684 | 62.3% |
| No Computing Device | 11 | 1.0% |
| Total | 1,098 | 100.0% |
Internet Access in South Toms River borough
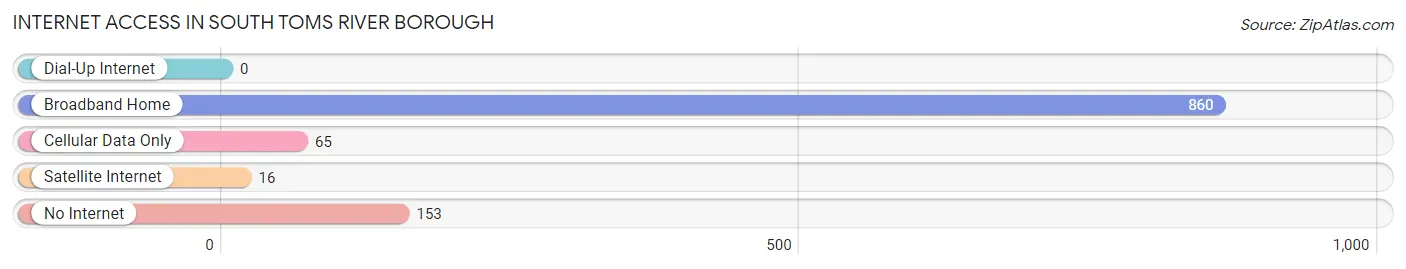
| Internet Type | # Households | % Households |
| Dial-Up Internet | 0 | 0.0% |
| Broadband Home | 860 | 78.3% |
| Cellular Data Only | 65 | 5.9% |
| Satellite Internet | 16 | 1.5% |
| No Internet | 153 | 13.9% |
| Total | 1,098 | 100.0% |
South Toms River borough Summary
South Toms River Borough is a small borough located in Ocean County, New Jersey. It is situated on the south side of the Toms River, which is the largest river in the state. The borough is bordered by Berkeley Township to the north, Beachwood Borough to the east, and Pine Beach Borough to the south. The population of South Toms River Borough was 2,845 as of the 2010 census.
History
The area that is now South Toms River Borough was originally inhabited by the Lenape Native Americans. The first European settlers arrived in the area in the late 17th century. The area was part of Shrewsbury Township until it was incorporated as South Toms River Borough in 1925.
Geography
South Toms River Borough is located at 39°56'N 74°14'W (39.9333, -74.2333). It has a total area of 1.2 square miles, all of which is land. The borough is located on the south side of the Toms River, which is the largest river in the state. The borough is bordered by Berkeley Township to the north, Beachwood Borough to the east, and Pine Beach Borough to the south.
Climate
South Toms River Borough has a humid subtropical climate, with hot, humid summers and mild winters. The average annual temperature is 54.3°F, with an average high of 73.2°F in July and an average low of 35.4°F in January. The average annual precipitation is 46.2 inches, with an average of 4.2 inches of snowfall per year.
Economy
The economy of South Toms River Borough is largely based on tourism and retail. The borough is home to several small businesses, including restaurants, shops, and other services. The borough also has a marina, which provides access to the Toms River for recreational boaters.
Demographics
As of the 2010 census, there were 2,845 people, 1,093 households, and 745 families residing in South Toms River Borough. The population density was 2,364.2 people per square mile. The racial makeup of the borough was 87.2% White, 8.2% African American, 0.3% Native American, 0.7% Asian, 0.1% Pacific Islander, 1.7% from other races, and 1.8% from two or more races. Hispanic or Latino of any race were 5.2% of the population.
The median income for a household in the borough was $50,938, and the median income for a family was $60,000. The per capita income for the borough was $22,945. About 8.2% of families and 10.2% of the population were below the poverty line, including 14.2% of those under age 18 and 8.2% of those age 65 or over.
Common Questions
What is Per Capita Income in South Toms River borough?
Per Capita income in South Toms River borough is $31,800.
What is the Median Family Income in South Toms River borough?
Median Family Income in South Toms River borough is $95,971.
What is the Median Household income in South Toms River borough?
Median Household Income in South Toms River borough is $96,688.
What is Income or Wage Gap in South Toms River borough?
Income or Wage Gap in South Toms River borough is 35.1%.
Women in South Toms River borough earn 64.9 cents for every dollar earned by a man.
What is Inequality or Gini Index in South Toms River borough?
Inequality or Gini Index in South Toms River borough is 0.29.
What is the Total Population of South Toms River borough?
Total Population of South Toms River borough is 3,662.
What is the Total Male Population of South Toms River borough?
Total Male Population of South Toms River borough is 1,718.
What is the Total Female Population of South Toms River borough?
Total Female Population of South Toms River borough is 1,944.
What is the Ratio of Males per 100 Females in South Toms River borough?
There are 88.37 Males per 100 Females in South Toms River borough.
What is the Ratio of Females per 100 Males in South Toms River borough?
There are 113.15 Females per 100 Males in South Toms River borough.
What is the Median Population Age in South Toms River borough?
Median Population Age in South Toms River borough is 33.7 Years.
What is the Average Family Size in South Toms River borough
Average Family Size in South Toms River borough is 3.5 People.
What is the Average Household Size in South Toms River borough
Average Household Size in South Toms River borough is 3.3 People.
How Large is the Labor Force in South Toms River borough?
There are 1,996 People in the Labor Forcein in South Toms River borough.
What is the Percentage of People in the Labor Force in South Toms River borough?
72.4% of People are in the Labor Force in South Toms River borough.
What is the Unemployment Rate in South Toms River borough?
Unemployment Rate in South Toms River borough is 8.1%.