Clifton, NJ Map & Demographics
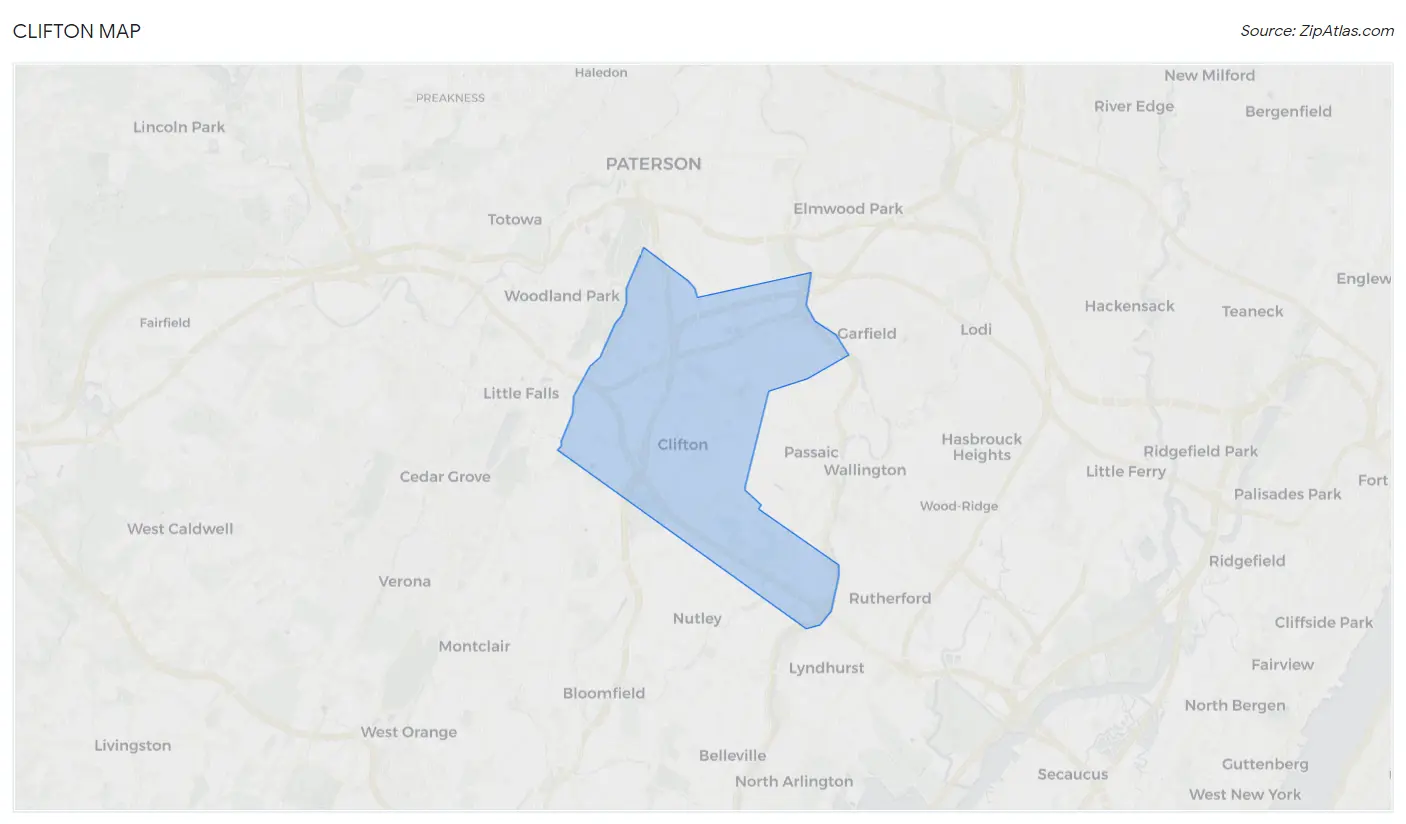
Clifton Map
Clifton Overview
$42,701
PER CAPITA INCOME
$109,153
AVG FAMILY INCOME
$94,179
AVG HOUSEHOLD INCOME
30.9%
WAGE / INCOME GAP [ % ]
69.1¢/ $1
WAGE / INCOME GAP [ $ ]
$11,243
FAMILY INCOME DEFICIT
0.43
INEQUALITY / GINI INDEX
89,451
TOTAL POPULATION
43,516
MALE POPULATION
45,935
FEMALE POPULATION
94.73
MALES / 100 FEMALES
105.56
FEMALES / 100 MALES
40.2
MEDIAN AGE
3.3
AVG FAMILY SIZE
2.7
AVG HOUSEHOLD SIZE
50,356
LABOR FORCE [ PEOPLE ]
68.6%
PERCENT IN LABOR FORCE
6.4%
UNEMPLOYMENT RATE
Clifton Area Codes
Income in Clifton
Income Overview in Clifton
Per Capita Income in Clifton is $42,701, while median incomes of families and households are $109,153 and $94,179 respectively.
| Characteristic | Number | Measure |
| Per Capita Income | 89,451 | $42,701 |
| Median Family Income | 22,747 | $109,153 |
| Mean Family Income | 22,747 | $131,001 |
| Median Household Income | 32,640 | $94,179 |
| Mean Household Income | 32,640 | $117,119 |
| Income Deficit | 22,747 | $11,243 |
| Wage / Income Gap (%) | 89,451 | 30.94% |
| Wage / Income Gap ($) | 89,451 | 69.06¢ per $1 |
| Gini / Inequality Index | 89,451 | 0.43 |
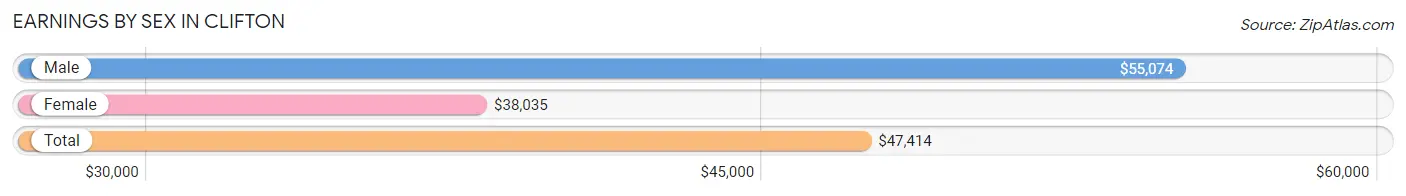
Earnings by Sex in Clifton
Average Earnings in Clifton are $47,414, $55,074 for men and $38,035 for women, a difference of 30.9%.
| Sex | Number | Average Earnings |
| Male | 27,224 (53.2%) | $55,074 |
| Female | 23,916 (46.8%) | $38,035 |
| Total | 51,140 (100.0%) | $47,414 |
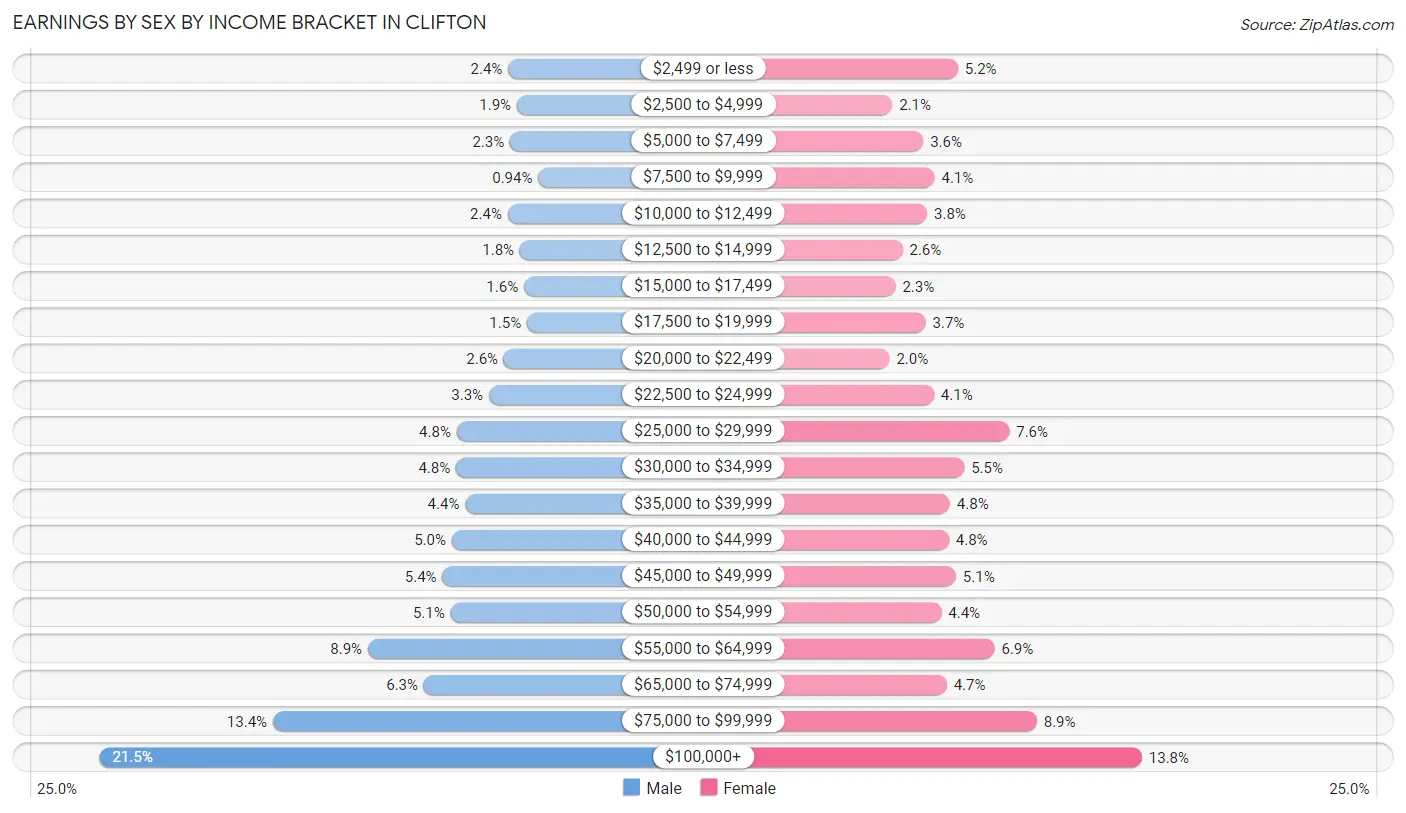
Earnings by Sex by Income Bracket in Clifton
The most common earnings brackets in Clifton are $100,000+ for men (5,851 | 21.5%) and $100,000+ for women (3,305 | 13.8%).
| Income | Male | Female |
| $2,499 or less | 641 (2.4%) | 1,243 (5.2%) |
| $2,500 to $4,999 | 528 (1.9%) | 510 (2.1%) |
| $5,000 to $7,499 | 615 (2.3%) | 856 (3.6%) |
| $7,500 to $9,999 | 256 (0.9%) | 983 (4.1%) |
| $10,000 to $12,499 | 645 (2.4%) | 900 (3.8%) |
| $12,500 to $14,999 | 491 (1.8%) | 624 (2.6%) |
| $15,000 to $17,499 | 438 (1.6%) | 545 (2.3%) |
| $17,500 to $19,999 | 399 (1.5%) | 882 (3.7%) |
| $20,000 to $22,499 | 693 (2.5%) | 478 (2.0%) |
| $22,500 to $24,999 | 886 (3.3%) | 975 (4.1%) |
| $25,000 to $29,999 | 1,296 (4.8%) | 1,820 (7.6%) |
| $30,000 to $34,999 | 1,303 (4.8%) | 1,315 (5.5%) |
| $35,000 to $39,999 | 1,186 (4.4%) | 1,154 (4.8%) |
| $40,000 to $44,999 | 1,359 (5.0%) | 1,143 (4.8%) |
| $45,000 to $49,999 | 1,479 (5.4%) | 1,221 (5.1%) |
| $50,000 to $54,999 | 1,375 (5.1%) | 1,060 (4.4%) |
| $55,000 to $64,999 | 2,429 (8.9%) | 1,654 (6.9%) |
| $65,000 to $74,999 | 1,715 (6.3%) | 1,119 (4.7%) |
| $75,000 to $99,999 | 3,639 (13.4%) | 2,129 (8.9%) |
| $100,000+ | 5,851 (21.5%) | 3,305 (13.8%) |
| Total | 27,224 (100.0%) | 23,916 (100.0%) |
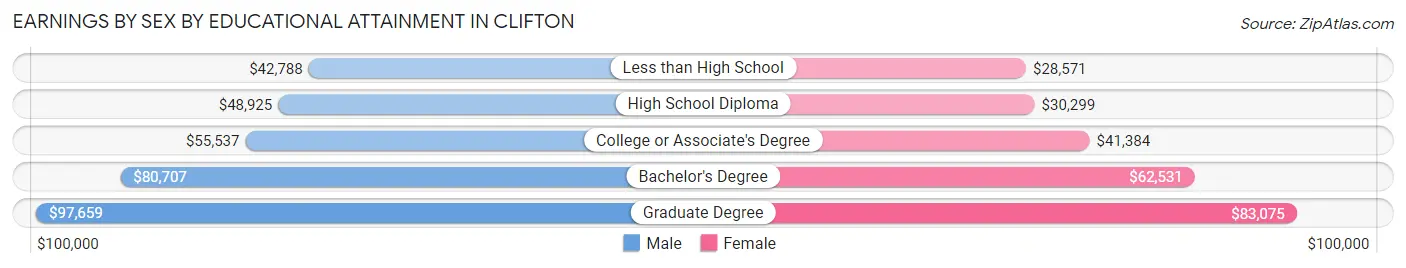
Earnings by Sex by Educational Attainment in Clifton
Average earnings in Clifton are $59,948 for men and $45,028 for women, a difference of 24.9%. Men with an educational attainment of graduate degree enjoy the highest average annual earnings of $97,659, while those with less than high school education earn the least with $42,788. Women with an educational attainment of graduate degree earn the most with the average annual earnings of $83,075, while those with less than high school education have the smallest earnings of $28,571.
| Educational Attainment | Male Income | Female Income |
| Less than High School | $42,788 | $28,571 |
| High School Diploma | $48,925 | $30,299 |
| College or Associate's Degree | $55,537 | $41,384 |
| Bachelor's Degree | $80,707 | $62,531 |
| Graduate Degree | $97,659 | $83,075 |
| Total | $59,948 | $45,028 |
Family Income in Clifton
Family Income Brackets in Clifton
According to the Clifton family income data, there are 5,459 families falling into the $100,000 to $149,999 income range, which is the most common income bracket and makes up 24.0% of all families. Conversely, the less than $10,000 income bracket is the least frequent group with only 432 families (1.9%) belonging to this category.
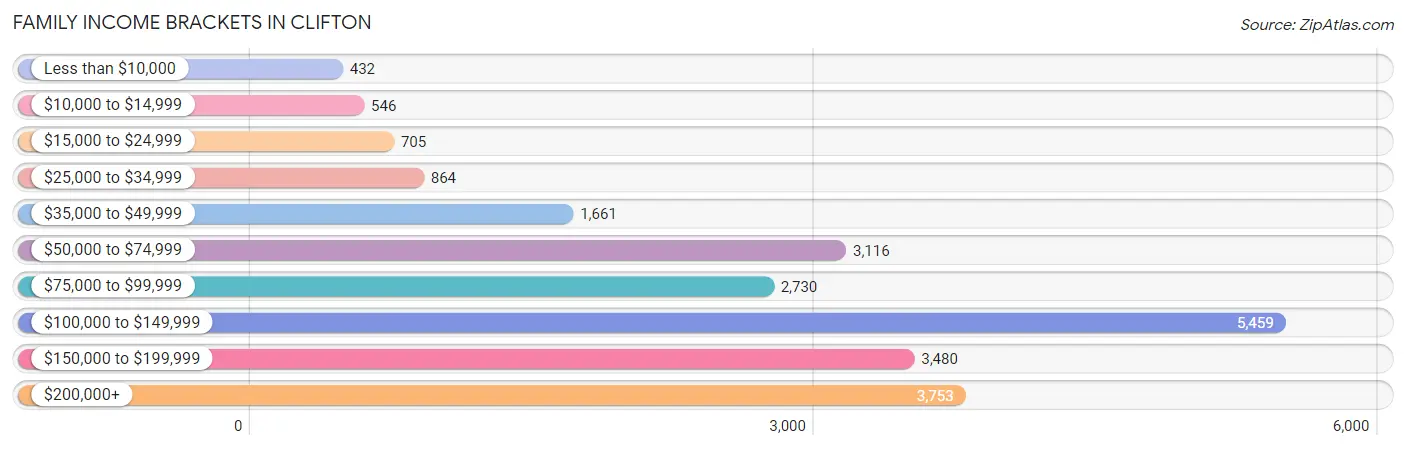
| Income Bracket | # Families | % Families |
| Less than $10,000 | 432 | 1.9% |
| $10,000 to $14,999 | 546 | 2.4% |
| $15,000 to $24,999 | 705 | 3.1% |
| $25,000 to $34,999 | 864 | 3.8% |
| $35,000 to $49,999 | 1,661 | 7.3% |
| $50,000 to $74,999 | 3,116 | 13.7% |
| $75,000 to $99,999 | 2,730 | 12.0% |
| $100,000 to $149,999 | 5,459 | 24.0% |
| $150,000 to $199,999 | 3,480 | 15.3% |
| $200,000+ | 3,753 | 16.5% |
Family Income by Famaliy Size in Clifton
7+ person families (516 | 2.3%) account for the highest median family income in Clifton with $197,955 per family, while 2-person families (8,778 | 38.6%) have the highest median income of $44,586 per family member.
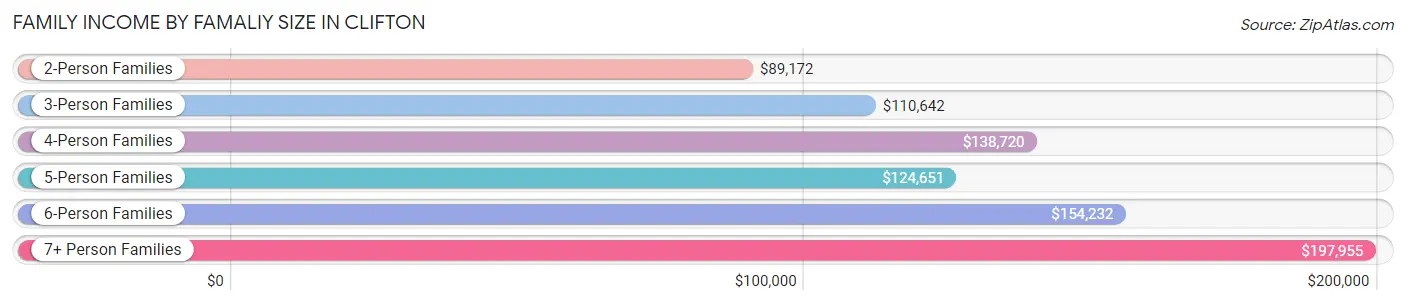
| Income Bracket | # Families | Median Income |
| 2-Person Families | 8,778 (38.6%) | $89,172 |
| 3-Person Families | 5,607 (24.6%) | $110,642 |
| 4-Person Families | 4,794 (21.1%) | $138,720 |
| 5-Person Families | 2,279 (10.0%) | $124,651 |
| 6-Person Families | 773 (3.4%) | $154,232 |
| 7+ Person Families | 516 (2.3%) | $197,955 |
| Total | 22,747 (100.0%) | $109,153 |
Family Income by Number of Earners in Clifton
The median family income in Clifton is $109,153, with families comprising 3+ earners (4,836) having the highest median family income of $152,126, while families with no earners (2,428) have the lowest median family income of $40,714, accounting for 21.3% and 10.7% of families, respectively.
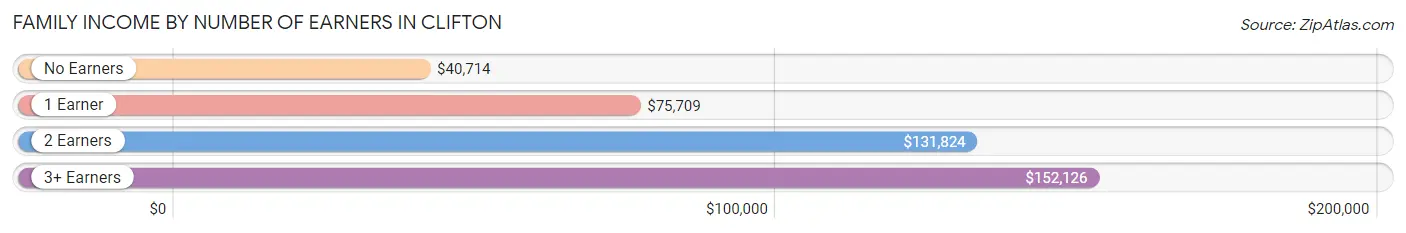
| Number of Earners | # Families | Median Income |
| No Earners | 2,428 (10.7%) | $40,714 |
| 1 Earner | 5,903 (26.0%) | $75,709 |
| 2 Earners | 9,580 (42.1%) | $131,824 |
| 3+ Earners | 4,836 (21.3%) | $152,126 |
| Total | 22,747 (100.0%) | $109,153 |
Household Income in Clifton
Household Income Brackets in Clifton
With 6,463 households falling in the category, the $100,000 to $149,999 income range is the most frequent in Clifton, accounting for 19.8% of all households. In contrast, only 1,012 households (3.1%) fall into the less than $10,000 income bracket, making it the least populous group.
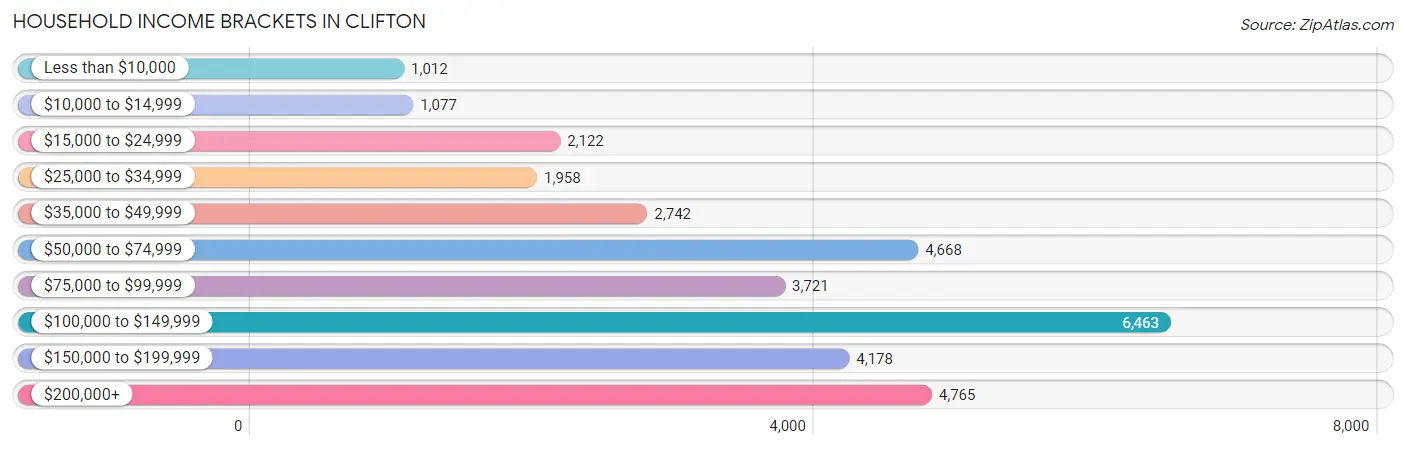
| Income Bracket | # Households | % Households |
| Less than $10,000 | 1,012 | 3.1% |
| $10,000 to $14,999 | 1,077 | 3.3% |
| $15,000 to $24,999 | 2,122 | 6.5% |
| $25,000 to $34,999 | 1,958 | 6.0% |
| $35,000 to $49,999 | 2,742 | 8.4% |
| $50,000 to $74,999 | 4,668 | 14.3% |
| $75,000 to $99,999 | 3,721 | 11.4% |
| $100,000 to $149,999 | 6,463 | 19.8% |
| $150,000 to $199,999 | 4,178 | 12.8% |
| $200,000+ | 4,765 | 14.6% |
Household Income by Householder Age in Clifton
The median household income in Clifton is $94,179, with the highest median household income of $104,624 found in the 45 to 64 years age bracket for the primary householder. A total of 13,152 households (40.3%) fall into this category. Meanwhile, the 15 to 24 years age bracket for the primary householder has the lowest median household income of $0, with 400 households (1.2%) in this group.
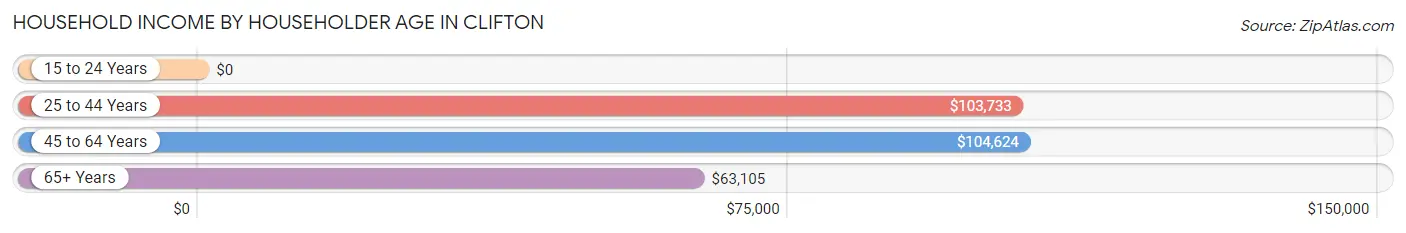
| Income Bracket | # Households | Median Income |
| 15 to 24 Years | 400 (1.2%) | $0 |
| 25 to 44 Years | 10,114 (31.0%) | $103,733 |
| 45 to 64 Years | 13,152 (40.3%) | $104,624 |
| 65+ Years | 8,974 (27.5%) | $63,105 |
| Total | 32,640 (100.0%) | $94,179 |
Poverty in Clifton
Income Below Poverty by Sex and Age in Clifton
With 6.4% poverty level for males and 8.1% for females among the residents of Clifton, 75 year old and over males and 5 year old females are the most vulnerable to poverty, with 315 males (13.3%) and 146 females (26.1%) in their respective age groups living below the poverty level.
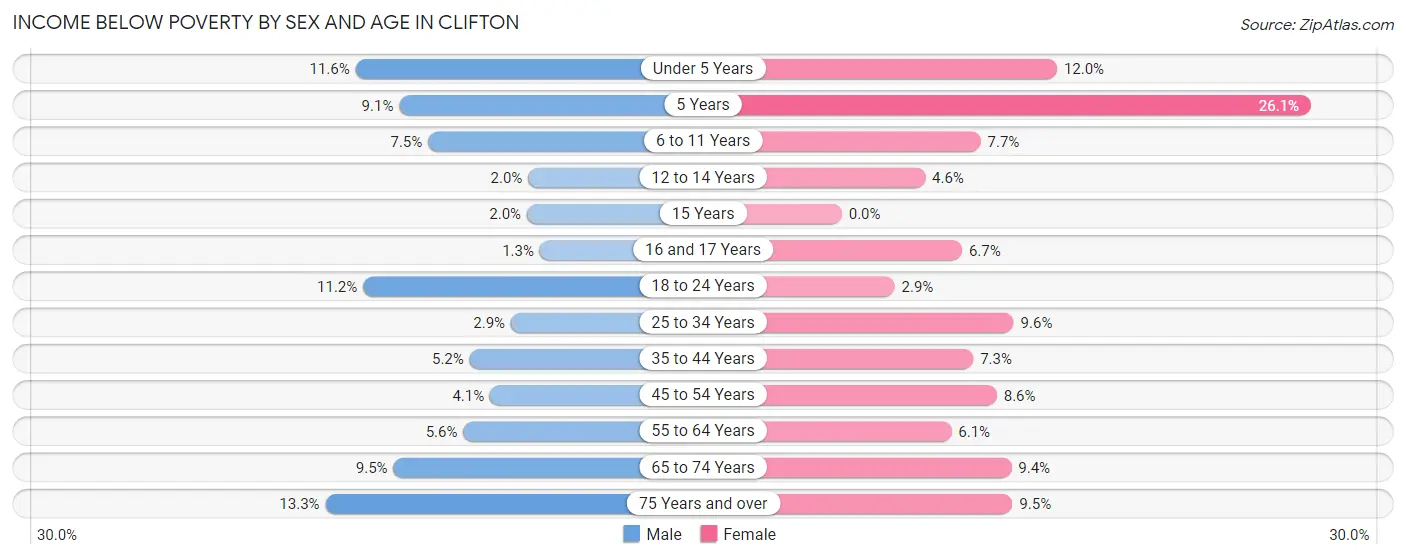
| Age Bracket | Male | Female |
| Under 5 Years | 264 (11.6%) | 308 (12.0%) |
| 5 Years | 37 (9.1%) | 146 (26.1%) |
| 6 to 11 Years | 238 (7.5%) | 229 (7.7%) |
| 12 to 14 Years | 28 (2.0%) | 74 (4.6%) |
| 15 Years | 12 (2.0%) | 0 (0.0%) |
| 16 and 17 Years | 10 (1.3%) | 52 (6.7%) |
| 18 to 24 Years | 390 (11.2%) | 106 (2.9%) |
| 25 to 34 Years | 197 (2.9%) | 629 (9.6%) |
| 35 to 44 Years | 332 (5.2%) | 406 (7.3%) |
| 45 to 54 Years | 216 (4.1%) | 454 (8.6%) |
| 55 to 64 Years | 356 (5.6%) | 403 (6.1%) |
| 65 to 74 Years | 378 (9.5%) | 487 (9.4%) |
| 75 Years and over | 315 (13.3%) | 377 (9.5%) |
| Total | 2,773 (6.4%) | 3,671 (8.1%) |
Income Above Poverty by Sex and Age in Clifton
According to the poverty statistics in Clifton, males aged 16 and 17 years and females aged 15 years are the age groups that are most secure financially, with 98.7% of males and 100.0% of females in these age groups living above the poverty line.
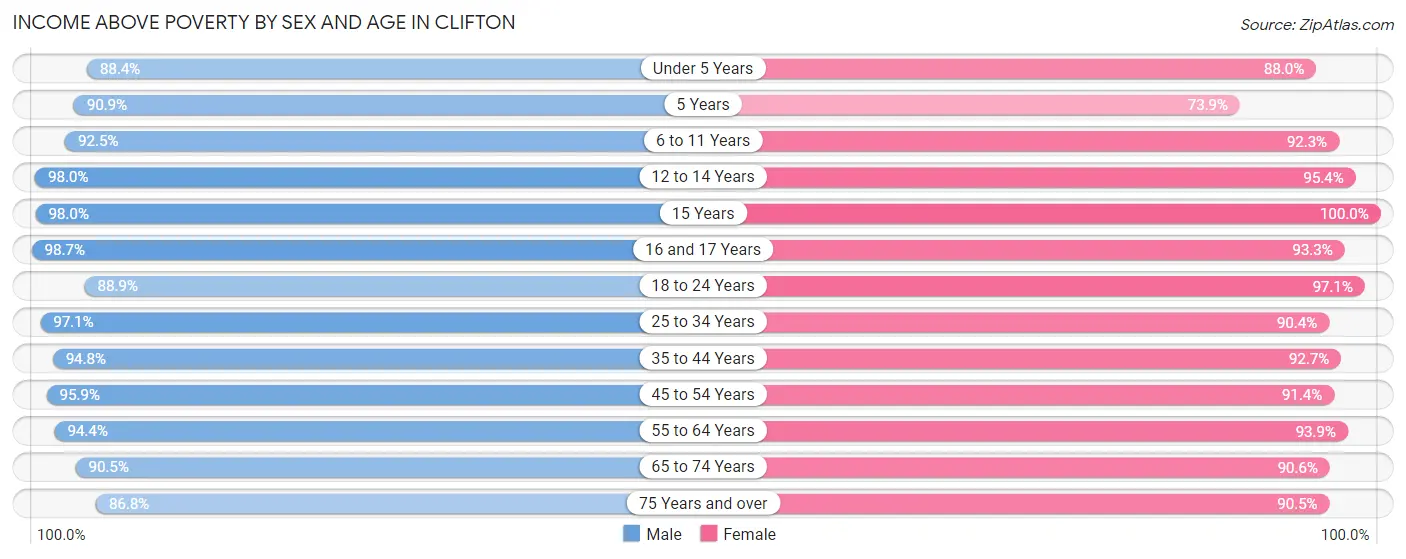
| Age Bracket | Male | Female |
| Under 5 Years | 2,017 (88.4%) | 2,262 (88.0%) |
| 5 Years | 368 (90.9%) | 413 (73.9%) |
| 6 to 11 Years | 2,923 (92.5%) | 2,735 (92.3%) |
| 12 to 14 Years | 1,400 (98.0%) | 1,521 (95.4%) |
| 15 Years | 578 (98.0%) | 420 (100.0%) |
| 16 and 17 Years | 755 (98.7%) | 725 (93.3%) |
| 18 to 24 Years | 3,107 (88.8%) | 3,497 (97.1%) |
| 25 to 34 Years | 6,551 (97.1%) | 5,941 (90.4%) |
| 35 to 44 Years | 6,032 (94.8%) | 5,138 (92.7%) |
| 45 to 54 Years | 5,074 (95.9%) | 4,807 (91.4%) |
| 55 to 64 Years | 6,034 (94.4%) | 6,201 (93.9%) |
| 65 to 74 Years | 3,618 (90.5%) | 4,671 (90.6%) |
| 75 Years and over | 2,063 (86.8%) | 3,591 (90.5%) |
| Total | 40,520 (93.6%) | 41,922 (91.9%) |
Income Below Poverty Among Married-Couple Families in Clifton
The poverty statistics for married-couple families in Clifton show that 4.4% or 714 of the total 16,144 families live below the poverty line. Families with 3 or 4 children have the highest poverty rate of 11.7%, comprising of 110 families. On the other hand, families with 5 or more children have the lowest poverty rate of 0.0%, which includes 0 families.
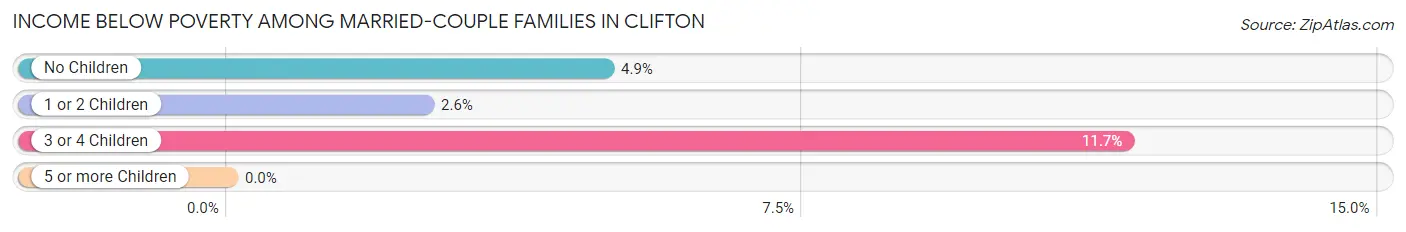
| Children | Above Poverty | Below Poverty |
| No Children | 8,892 (95.1%) | 459 (4.9%) |
| 1 or 2 Children | 5,523 (97.4%) | 145 (2.6%) |
| 3 or 4 Children | 830 (88.3%) | 110 (11.7%) |
| 5 or more Children | 185 (100.0%) | 0 (0.0%) |
| Total | 15,430 (95.6%) | 714 (4.4%) |
Income Below Poverty Among Single-Parent Households in Clifton
According to the poverty data in Clifton, 8.4% or 188 single-father households and 9.5% or 414 single-mother households are living below the poverty line. Among single-father households, those with 1 or 2 children have the highest poverty rate, with 112 households (15.9%) experiencing poverty. Likewise, among single-mother households, those with 3 or 4 children have the highest poverty rate, with 18 households (33.3%) falling below the poverty line.
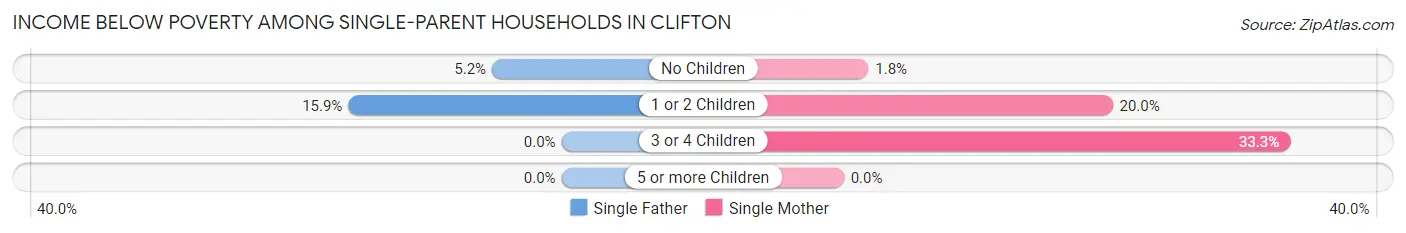
| Children | Single Father | Single Mother |
| No Children | 76 (5.2%) | 47 (1.8%) |
| 1 or 2 Children | 112 (15.9%) | 349 (20.0%) |
| 3 or 4 Children | 0 (0.0%) | 18 (33.3%) |
| 5 or more Children | 0 (0.0%) | 0 (0.0%) |
| Total | 188 (8.4%) | 414 (9.5%) |
Income Below Poverty Among Married-Couple vs Single-Parent Households in Clifton
The poverty data for Clifton shows that 714 of the married-couple family households (4.4%) and 602 of the single-parent households (9.1%) are living below the poverty level. Within the married-couple family households, those with 3 or 4 children have the highest poverty rate, with 110 households (11.7%) falling below the poverty line. Among the single-parent households, those with 1 or 2 children have the highest poverty rate, with 461 household (18.8%) living below poverty.
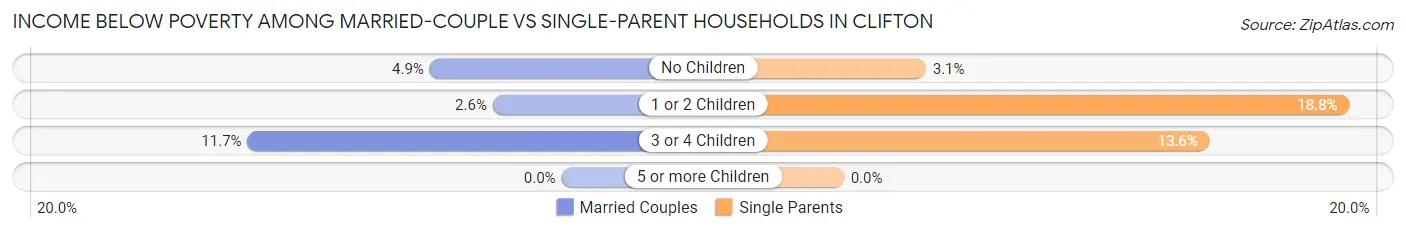
| Children | Married-Couple Families | Single-Parent Households |
| No Children | 459 (4.9%) | 123 (3.1%) |
| 1 or 2 Children | 145 (2.6%) | 461 (18.8%) |
| 3 or 4 Children | 110 (11.7%) | 18 (13.6%) |
| 5 or more Children | 0 (0.0%) | 0 (0.0%) |
| Total | 714 (4.4%) | 602 (9.1%) |
Race in Clifton
The most populous races in Clifton are White / Caucasian (52,784 | 59.0%), Hispanic or Latino (34,479 | 38.6%), and Some other Race (13,223 | 14.8%).
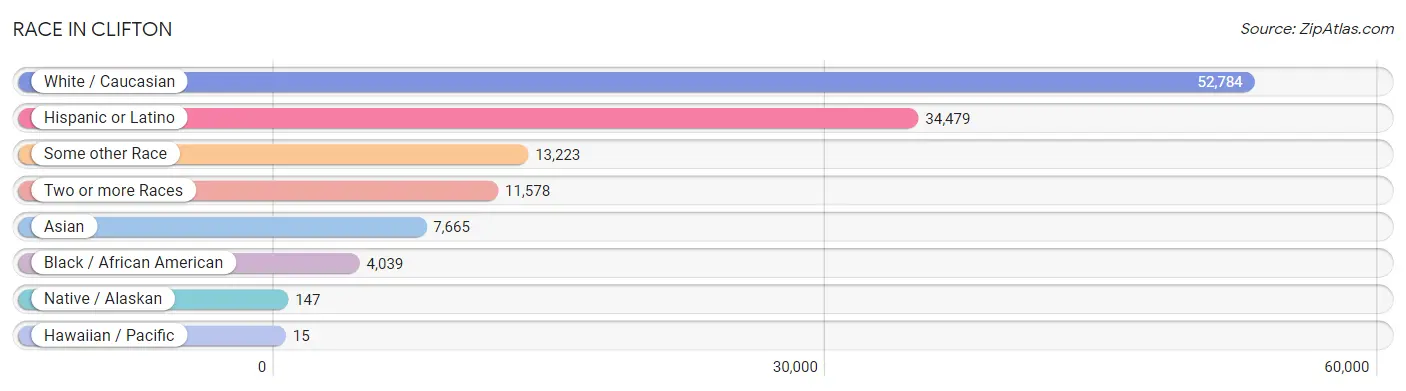
| Race | # Population | % Population |
| Asian | 7,665 | 8.6% |
| Black / African American | 4,039 | 4.5% |
| Hawaiian / Pacific | 15 | 0.0% |
| Hispanic or Latino | 34,479 | 38.6% |
| Native / Alaskan | 147 | 0.2% |
| White / Caucasian | 52,784 | 59.0% |
| Two or more Races | 11,578 | 12.9% |
| Some other Race | 13,223 | 14.8% |
| Total | 89,451 | 100.0% |
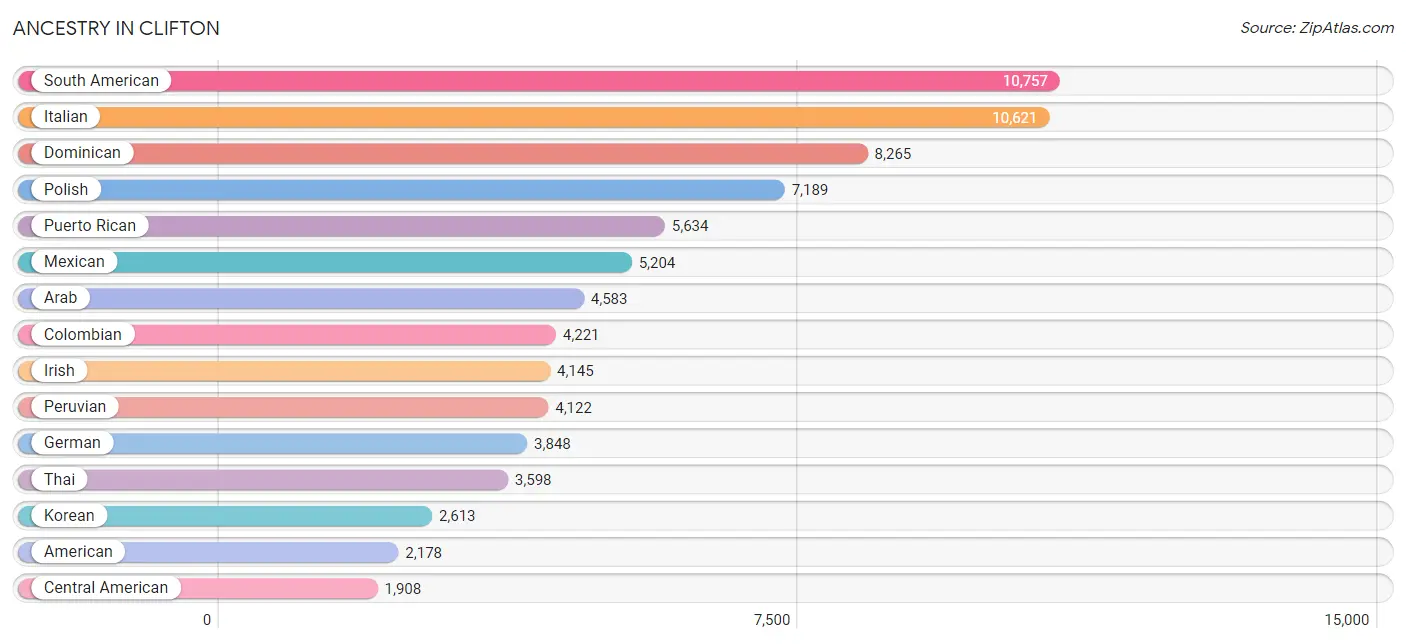
Ancestry in Clifton
The most populous ancestries reported in Clifton are South American (10,757 | 12.0%), Italian (10,621 | 11.9%), Dominican (8,265 | 9.2%), Polish (7,189 | 8.0%), and Puerto Rican (5,634 | 6.3%), together accounting for 47.5% of all Clifton residents.
| Ancestry | # Population | % Population |
| Afghan | 24 | 0.0% |
| African | 107 | 0.1% |
| Albanian | 642 | 0.7% |
| American | 2,178 | 2.4% |
| Arab | 4,583 | 5.1% |
| Argentinean | 256 | 0.3% |
| Armenian | 105 | 0.1% |
| Assyrian / Chaldean / Syriac | 12 | 0.0% |
| Austrian | 371 | 0.4% |
| Bangladeshi | 13 | 0.0% |
| Basque | 8 | 0.0% |
| Belgian | 23 | 0.0% |
| Bhutanese | 85 | 0.1% |
| Bolivian | 32 | 0.0% |
| Brazilian | 395 | 0.4% |
| British | 177 | 0.2% |
| Burmese | 840 | 0.9% |
| Canadian | 22 | 0.0% |
| Central American | 1,908 | 2.1% |
| Central American Indian | 188 | 0.2% |
| Cherokee | 106 | 0.1% |
| Chilean | 364 | 0.4% |
| Colombian | 4,221 | 4.7% |
| Costa Rican | 132 | 0.2% |
| Croatian | 26 | 0.0% |
| Cuban | 1,373 | 1.5% |
| Czech | 159 | 0.2% |
| Czechoslovakian | 37 | 0.0% |
| Danish | 84 | 0.1% |
| Dominican | 8,265 | 9.2% |
| Dutch | 682 | 0.8% |
| Eastern European | 687 | 0.8% |
| Ecuadorian | 1,508 | 1.7% |
| Egyptian | 938 | 1.1% |
| English | 1,295 | 1.5% |
| European | 702 | 0.8% |
| Finnish | 129 | 0.1% |
| French | 383 | 0.4% |
| French Canadian | 308 | 0.3% |
| German | 3,848 | 4.3% |
| Greek | 354 | 0.4% |
| Guamanian / Chamorro | 21 | 0.0% |
| Guatemalan | 408 | 0.5% |
| Guyanese | 25 | 0.0% |
| Haitian | 94 | 0.1% |
| Honduran | 118 | 0.1% |
| Hungarian | 1,066 | 1.2% |
| Indian (Asian) | 621 | 0.7% |
| Iranian | 87 | 0.1% |
| Iraqi | 189 | 0.2% |
| Irish | 4,145 | 4.6% |
| Israeli | 233 | 0.3% |
| Italian | 10,621 | 11.9% |
| Jamaican | 257 | 0.3% |
| Jordanian | 392 | 0.4% |
| Korean | 2,613 | 2.9% |
| Laotian | 243 | 0.3% |
| Latvian | 41 | 0.1% |
| Lebanese | 347 | 0.4% |
| Lithuanian | 60 | 0.1% |
| Macedonian | 69 | 0.1% |
| Maltese | 1 | 0.0% |
| Menominee | 60 | 0.1% |
| Mexican | 5,204 | 5.8% |
| Moroccan | 588 | 0.7% |
| Navajo | 11 | 0.0% |
| New Zealander | 15 | 0.0% |
| Nicaraguan | 17 | 0.0% |
| Nigerian | 91 | 0.1% |
| Northern European | 8 | 0.0% |
| Norwegian | 70 | 0.1% |
| Pakistani | 30 | 0.0% |
| Palestinian | 824 | 0.9% |
| Panamanian | 70 | 0.1% |
| Paraguayan | 58 | 0.1% |
| Peruvian | 4,122 | 4.6% |
| Polish | 7,189 | 8.0% |
| Portuguese | 393 | 0.4% |
| Puerto Rican | 5,634 | 6.3% |
| Romanian | 141 | 0.2% |
| Russian | 848 | 0.9% |
| Salvadoran | 1,163 | 1.3% |
| Scandinavian | 9 | 0.0% |
| Scotch-Irish | 51 | 0.1% |
| Scottish | 259 | 0.3% |
| Serbian | 129 | 0.1% |
| Slavic | 213 | 0.2% |
| Slovak | 370 | 0.4% |
| South African | 13 | 0.0% |
| South American | 10,757 | 12.0% |
| South American Indian | 63 | 0.1% |
| Spaniard | 377 | 0.4% |
| Spanish | 123 | 0.1% |
| Spanish American Indian | 9 | 0.0% |
| Sri Lankan | 41 | 0.1% |
| Subsaharan African | 256 | 0.3% |
| Sudanese | 32 | 0.0% |
| Swedish | 274 | 0.3% |
| Swiss | 135 | 0.2% |
| Syrian | 531 | 0.6% |
| Thai | 3,598 | 4.0% |
| Trinidadian and Tobagonian | 109 | 0.1% |
| Turkish | 1,231 | 1.4% |
| Ukrainian | 1,068 | 1.2% |
| Uruguayan | 16 | 0.0% |
| Venezuelan | 180 | 0.2% |
| Vietnamese | 155 | 0.2% |
| Welsh | 21 | 0.0% |
| West Indian | 35 | 0.0% |
| Yugoslavian | 208 | 0.2% | View All 110 Rows |
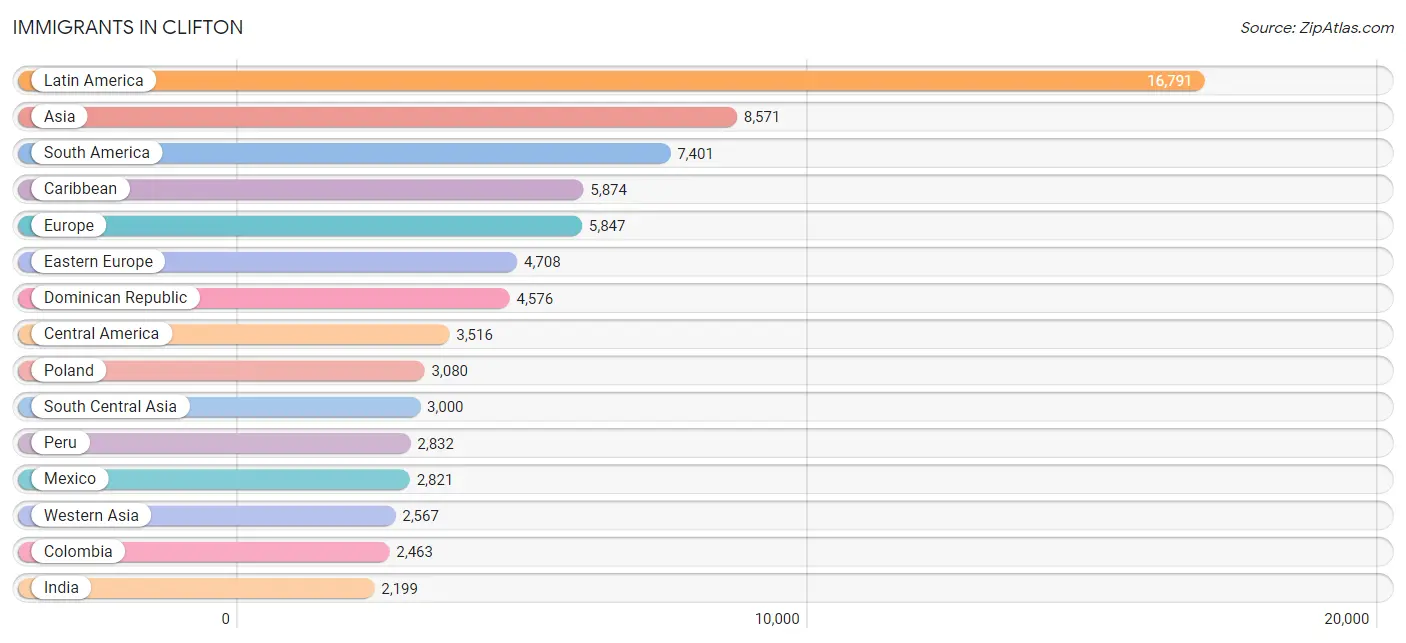
Immigrants in Clifton
The most numerous immigrant groups reported in Clifton came from Latin America (16,791 | 18.8%), Asia (8,571 | 9.6%), South America (7,401 | 8.3%), Caribbean (5,874 | 6.6%), and Europe (5,847 | 6.5%), together accounting for 49.7% of all Clifton residents.
| Immigration Origin | # Population | % Population |
| Afghanistan | 24 | 0.0% |
| Africa | 1,243 | 1.4% |
| Albania | 375 | 0.4% |
| Argentina | 267 | 0.3% |
| Asia | 8,571 | 9.6% |
| Australia | 18 | 0.0% |
| Austria | 44 | 0.1% |
| Bahamas | 9 | 0.0% |
| Bangladesh | 214 | 0.2% |
| Belarus | 12 | 0.0% |
| Belgium | 20 | 0.0% |
| Bolivia | 22 | 0.0% |
| Bosnia and Herzegovina | 182 | 0.2% |
| Brazil | 504 | 0.6% |
| Cambodia | 5 | 0.0% |
| Canada | 32 | 0.0% |
| Caribbean | 5,874 | 6.6% |
| Central America | 3,516 | 3.9% |
| Chile | 272 | 0.3% |
| China | 253 | 0.3% |
| Colombia | 2,463 | 2.8% |
| Costa Rica | 120 | 0.1% |
| Croatia | 22 | 0.0% |
| Cuba | 829 | 0.9% |
| Czechoslovakia | 72 | 0.1% |
| Denmark | 12 | 0.0% |
| Dominica | 158 | 0.2% |
| Dominican Republic | 4,576 | 5.1% |
| Eastern Africa | 95 | 0.1% |
| Eastern Asia | 1,090 | 1.2% |
| Eastern Europe | 4,708 | 5.3% |
| Ecuador | 775 | 0.9% |
| Egypt | 531 | 0.6% |
| El Salvador | 233 | 0.3% |
| England | 5 | 0.0% |
| Europe | 5,847 | 6.5% |
| France | 10 | 0.0% |
| Germany | 118 | 0.1% |
| Greece | 83 | 0.1% |
| Guatemala | 201 | 0.2% |
| Guyana | 126 | 0.1% |
| Haiti | 23 | 0.0% |
| Honduras | 96 | 0.1% |
| Hong Kong | 79 | 0.1% |
| Hungary | 22 | 0.0% |
| India | 2,199 | 2.5% |
| Indonesia | 132 | 0.2% |
| Iran | 77 | 0.1% |
| Iraq | 254 | 0.3% |
| Ireland | 47 | 0.1% |
| Israel | 233 | 0.3% |
| Italy | 248 | 0.3% |
| Jamaica | 152 | 0.2% |
| Japan | 17 | 0.0% |
| Jordan | 402 | 0.4% |
| Kenya | 54 | 0.1% |
| Korea | 820 | 0.9% |
| Latin America | 16,791 | 18.8% |
| Latvia | 16 | 0.0% |
| Lebanon | 233 | 0.3% |
| Lithuania | 14 | 0.0% |
| Malaysia | 10 | 0.0% |
| Mexico | 2,821 | 3.2% |
| Middle Africa | 51 | 0.1% |
| Moldova | 90 | 0.1% |
| Morocco | 434 | 0.5% |
| Netherlands | 67 | 0.1% |
| Nicaragua | 17 | 0.0% |
| North Macedonia | 92 | 0.1% |
| Northern Africa | 1,053 | 1.2% |
| Northern Europe | 228 | 0.3% |
| Oceania | 18 | 0.0% |
| Pakistan | 174 | 0.2% |
| Panama | 28 | 0.0% |
| Peru | 2,832 | 3.2% |
| Philippines | 1,506 | 1.7% |
| Poland | 3,080 | 3.4% |
| Portugal | 42 | 0.1% |
| Romania | 89 | 0.1% |
| Russia | 101 | 0.1% |
| Saudi Arabia | 38 | 0.0% |
| Senegal | 13 | 0.0% |
| Serbia | 113 | 0.1% |
| South Africa | 13 | 0.0% |
| South America | 7,401 | 8.3% |
| South Central Asia | 3,000 | 3.4% |
| South Eastern Asia | 1,730 | 1.9% |
| Southern Europe | 652 | 0.7% |
| Spain | 262 | 0.3% |
| Sri Lanka | 47 | 0.1% |
| St. Vincent and the Grenadines | 19 | 0.0% |
| Sudan | 71 | 0.1% |
| Syria | 455 | 0.5% |
| Taiwan | 41 | 0.1% |
| Thailand | 7 | 0.0% |
| Trinidad and Tobago | 108 | 0.1% |
| Turkey | 880 | 1.0% |
| Ukraine | 359 | 0.4% |
| Uruguay | 23 | 0.0% |
| Uzbekistan | 247 | 0.3% |
| Venezuela | 100 | 0.1% |
| Vietnam | 47 | 0.1% |
| Western Africa | 13 | 0.0% |
| Western Asia | 2,567 | 2.9% |
| Western Europe | 259 | 0.3% |
| Yemen | 28 | 0.0% | View All 106 Rows |
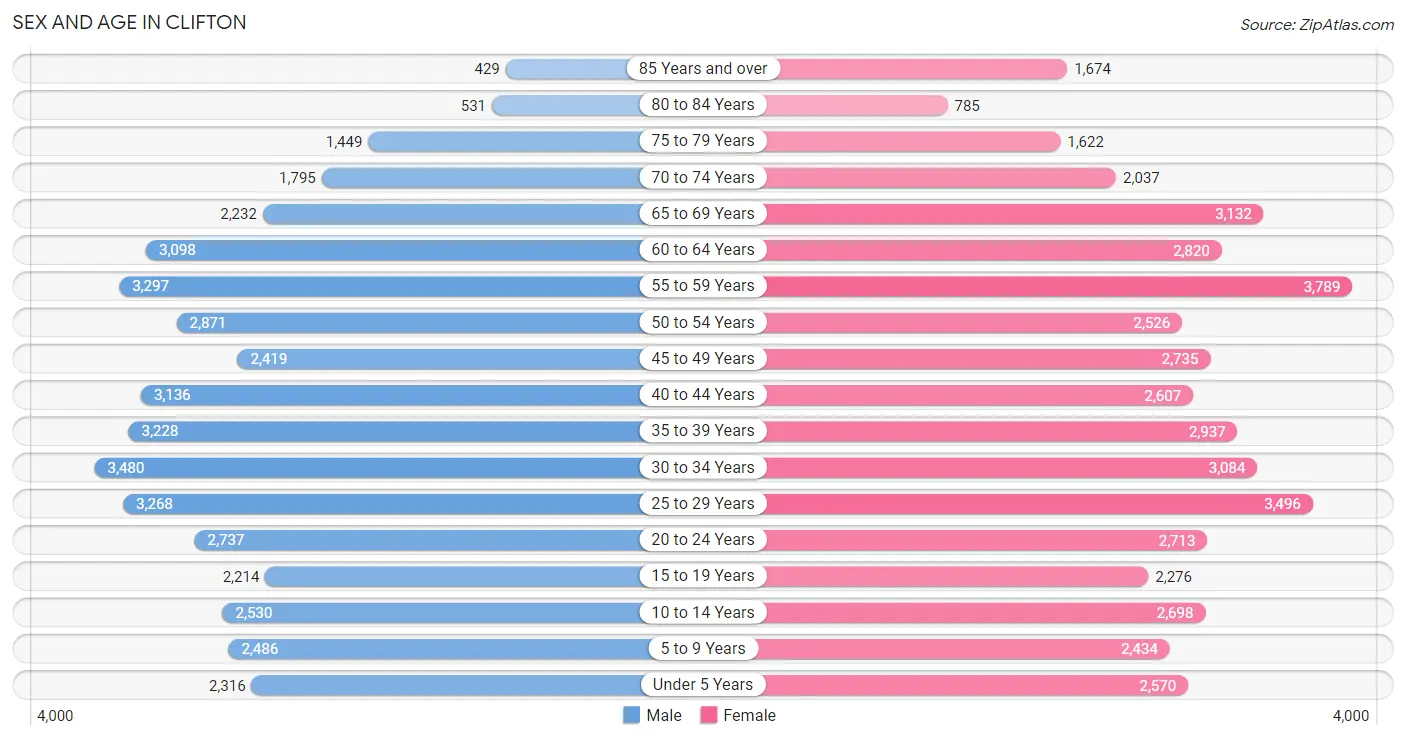
Sex and Age in Clifton
Sex and Age in Clifton
The most populous age groups in Clifton are 30 to 34 Years (3,480 | 8.0%) for men and 55 to 59 Years (3,789 | 8.3%) for women.
| Age Bracket | Male | Female |
| Under 5 Years | 2,316 (5.3%) | 2,570 (5.6%) |
| 5 to 9 Years | 2,486 (5.7%) | 2,434 (5.3%) |
| 10 to 14 Years | 2,530 (5.8%) | 2,698 (5.9%) |
| 15 to 19 Years | 2,214 (5.1%) | 2,276 (5.0%) |
| 20 to 24 Years | 2,737 (6.3%) | 2,713 (5.9%) |
| 25 to 29 Years | 3,268 (7.5%) | 3,496 (7.6%) |
| 30 to 34 Years | 3,480 (8.0%) | 3,084 (6.7%) |
| 35 to 39 Years | 3,228 (7.4%) | 2,937 (6.4%) |
| 40 to 44 Years | 3,136 (7.2%) | 2,607 (5.7%) |
| 45 to 49 Years | 2,419 (5.6%) | 2,735 (5.9%) |
| 50 to 54 Years | 2,871 (6.6%) | 2,526 (5.5%) |
| 55 to 59 Years | 3,297 (7.6%) | 3,789 (8.3%) |
| 60 to 64 Years | 3,098 (7.1%) | 2,820 (6.1%) |
| 65 to 69 Years | 2,232 (5.1%) | 3,132 (6.8%) |
| 70 to 74 Years | 1,795 (4.1%) | 2,037 (4.4%) |
| 75 to 79 Years | 1,449 (3.3%) | 1,622 (3.5%) |
| 80 to 84 Years | 531 (1.2%) | 785 (1.7%) |
| 85 Years and over | 429 (1.0%) | 1,674 (3.6%) |
| Total | 43,516 (100.0%) | 45,935 (100.0%) |
Families and Households in Clifton
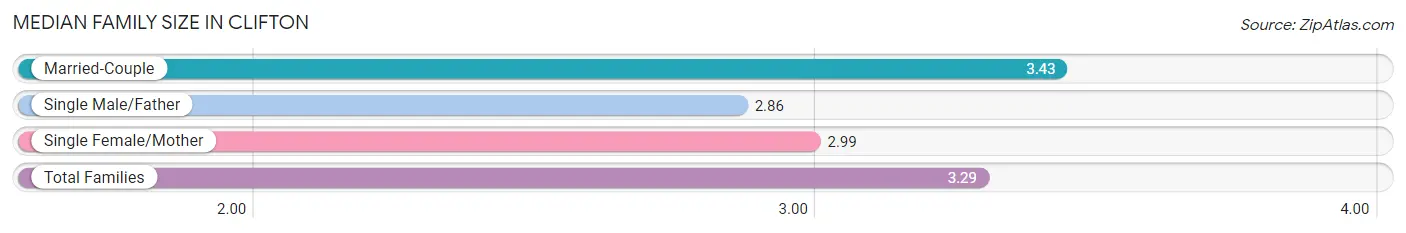
Median Family Size in Clifton
The median family size in Clifton is 3.29 persons per family, with married-couple families (16,144 | 71.0%) accounting for the largest median family size of 3.43 persons per family. On the other hand, single male/father families (2,249 | 9.9%) represent the smallest median family size with 2.86 persons per family.
| Family Type | # Families | Family Size |
| Married-Couple | 16,144 (71.0%) | 3.43 |
| Single Male/Father | 2,249 (9.9%) | 2.86 |
| Single Female/Mother | 4,354 (19.1%) | 2.99 |
| Total Families | 22,747 (100.0%) | 3.29 |
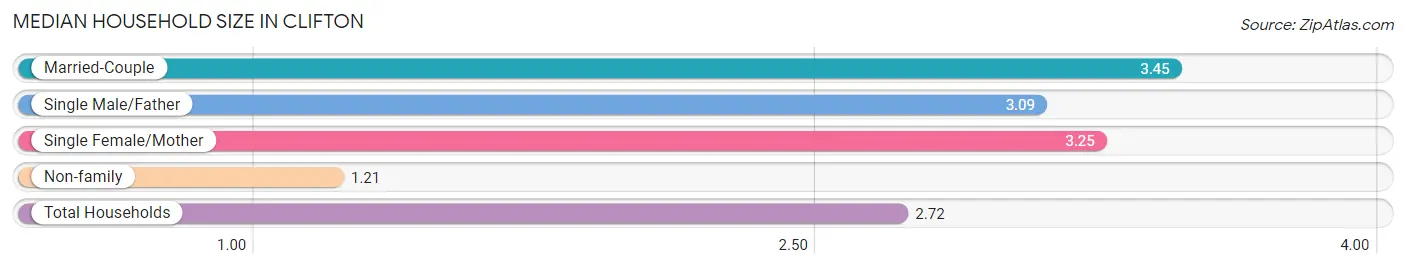
Median Household Size in Clifton
The median household size in Clifton is 2.72 persons per household, with married-couple households (16,144 | 49.5%) accounting for the largest median household size of 3.45 persons per household. non-family households (9,893 | 30.3%) represent the smallest median household size with 1.21 persons per household.
| Household Type | # Households | Household Size |
| Married-Couple | 16,144 (49.5%) | 3.45 |
| Single Male/Father | 2,249 (6.9%) | 3.09 |
| Single Female/Mother | 4,354 (13.3%) | 3.25 |
| Non-family | 9,893 (30.3%) | 1.21 |
| Total Households | 32,640 (100.0%) | 2.72 |
Household Size by Marriage Status in Clifton
Out of a total of 32,640 households in Clifton, 22,747 (69.7%) are family households, while 9,893 (30.3%) are nonfamily households. The most numerous type of family households are 2-person households, comprising 8,094, and the most common type of nonfamily households are 1-person households, comprising 8,261.
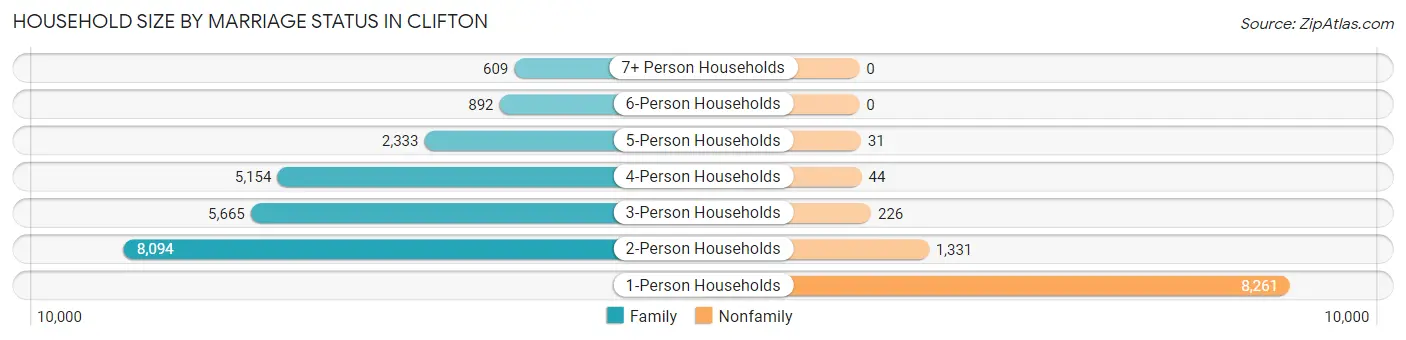
| Household Size | Family Households | Nonfamily Households |
| 1-Person Households | - | 8,261 (25.3%) |
| 2-Person Households | 8,094 (24.8%) | 1,331 (4.1%) |
| 3-Person Households | 5,665 (17.4%) | 226 (0.7%) |
| 4-Person Households | 5,154 (15.8%) | 44 (0.1%) |
| 5-Person Households | 2,333 (7.1%) | 31 (0.1%) |
| 6-Person Households | 892 (2.7%) | 0 (0.0%) |
| 7+ Person Households | 609 (1.9%) | 0 (0.0%) |
| Total | 22,747 (69.7%) | 9,893 (30.3%) |
Female Fertility in Clifton
Fertility by Age in Clifton
Average fertility rate in Clifton is 72.0 births per 1,000 women. Women in the age bracket of 35 to 50 years have the highest fertility rate with 88.0 births per 1,000 women. Women in the age bracket of 35 to 50 years acount for 52.5% of all women with births.
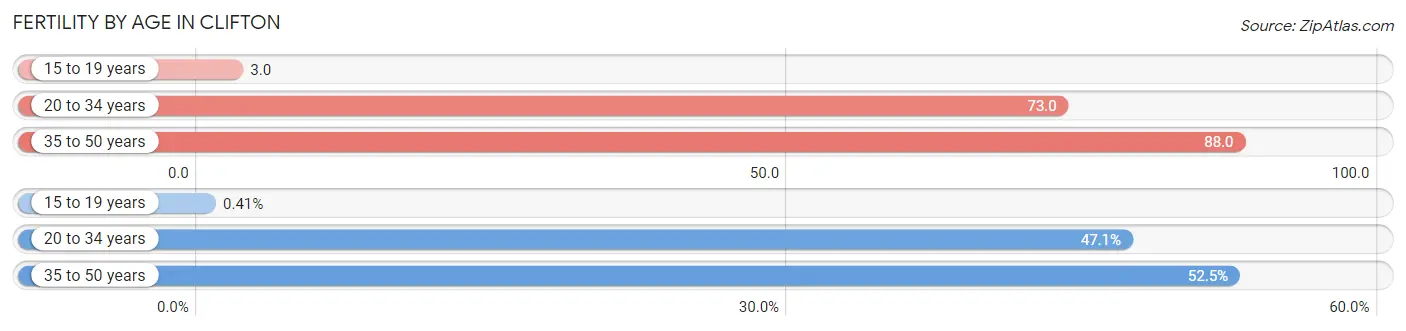
| Age Bracket | Women with Births | Births / 1,000 Women |
| 15 to 19 years | 6 (0.4%) | 3.0 |
| 20 to 34 years | 683 (47.1%) | 73.0 |
| 35 to 50 years | 762 (52.5%) | 88.0 |
| Total | 1,451 (100.0%) | 72.0 |
Fertility by Age by Marriage Status in Clifton
79.3% of women with births (1,451) in Clifton are married. The highest percentage of unmarried women with births falls into 20 to 34 years age bracket with 27.4% of them unmarried at the time of birth, while the lowest percentage of unmarried women with births belong to 15 to 19 years age bracket with 0.0% of them unmarried.
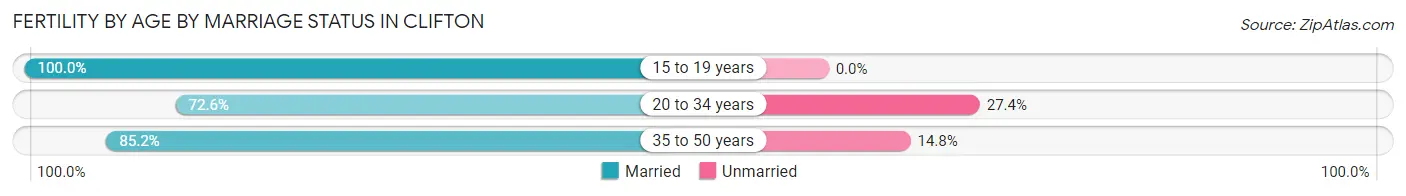
| Age Bracket | Married | Unmarried |
| 15 to 19 years | 6 (100.0%) | 0 (0.0%) |
| 20 to 34 years | 496 (72.6%) | 187 (27.4%) |
| 35 to 50 years | 649 (85.2%) | 113 (14.8%) |
| Total | 1,151 (79.3%) | 300 (20.7%) |
Fertility by Education in Clifton
Average fertility rate in Clifton is 72.0 births per 1,000 women. Women with the education attainment of high school diploma have the highest fertility rate of 94.0 births per 1,000 women, while women with the education attainment of less than high school have the lowest fertility at 32.0 births per 1,000 women. Women with the education attainment of high school diploma represent 33.4% of all women with births.
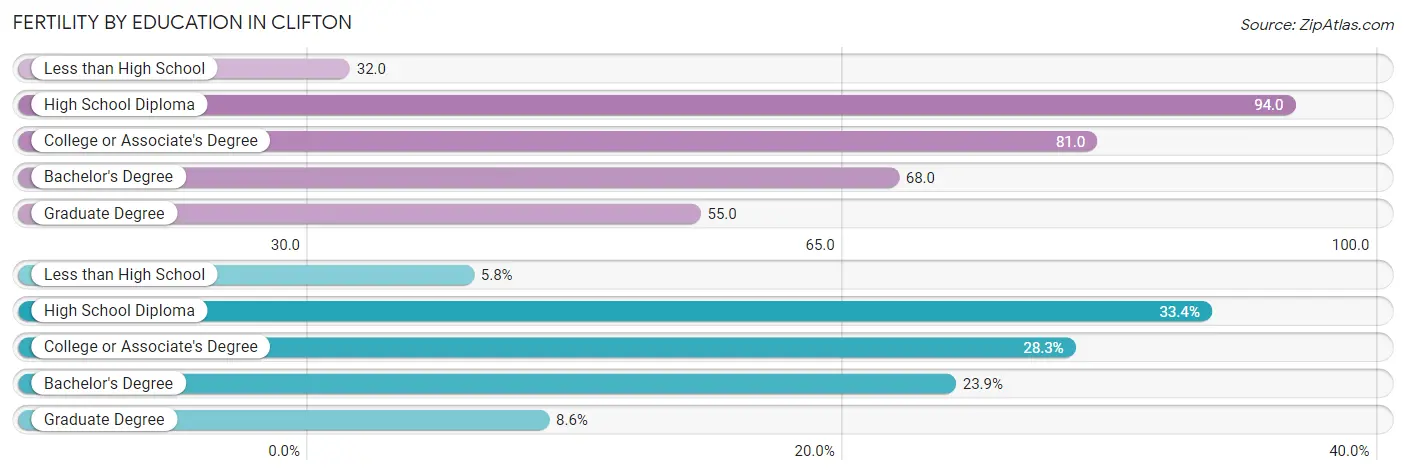
| Educational Attainment | Women with Births | Births / 1,000 Women |
| Less than High School | 84 (5.8%) | 32.0 |
| High School Diploma | 485 (33.4%) | 94.0 |
| College or Associate's Degree | 411 (28.3%) | 81.0 |
| Bachelor's Degree | 346 (23.8%) | 68.0 |
| Graduate Degree | 125 (8.6%) | 55.0 |
| Total | 1,451 (100.0%) | 72.0 |
Fertility by Education by Marriage Status in Clifton
20.7% of women with births in Clifton are unmarried. Women with the educational attainment of less than high school are most likely to be married with 100.0% of them married at childbirth, while women with the educational attainment of college or associate's degree are least likely to be married with 32.9% of them unmarried at childbirth.
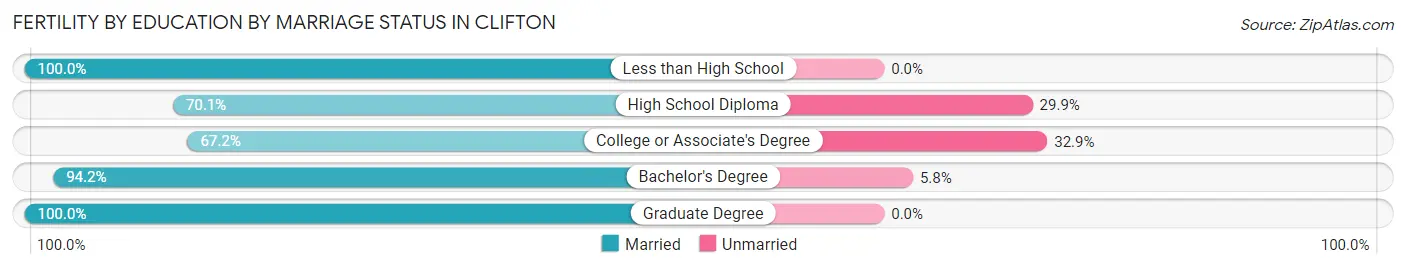
| Educational Attainment | Married | Unmarried |
| Less than High School | 84 (100.0%) | 0 (0.0%) |
| High School Diploma | 340 (70.1%) | 145 (29.9%) |
| College or Associate's Degree | 276 (67.1%) | 135 (32.9%) |
| Bachelor's Degree | 326 (94.2%) | 20 (5.8%) |
| Graduate Degree | 125 (100.0%) | 0 (0.0%) |
| Total | 1,151 (79.3%) | 300 (20.7%) |
Employment Characteristics in Clifton
Employment by Class of Employer in Clifton
Among the 46,157 employed individuals in Clifton, private company employees (33,806 | 73.2%), not-for-profit organizations (3,091 | 6.7%), and local government employees (3,015 | 6.5%) make up the most common classes of employment.
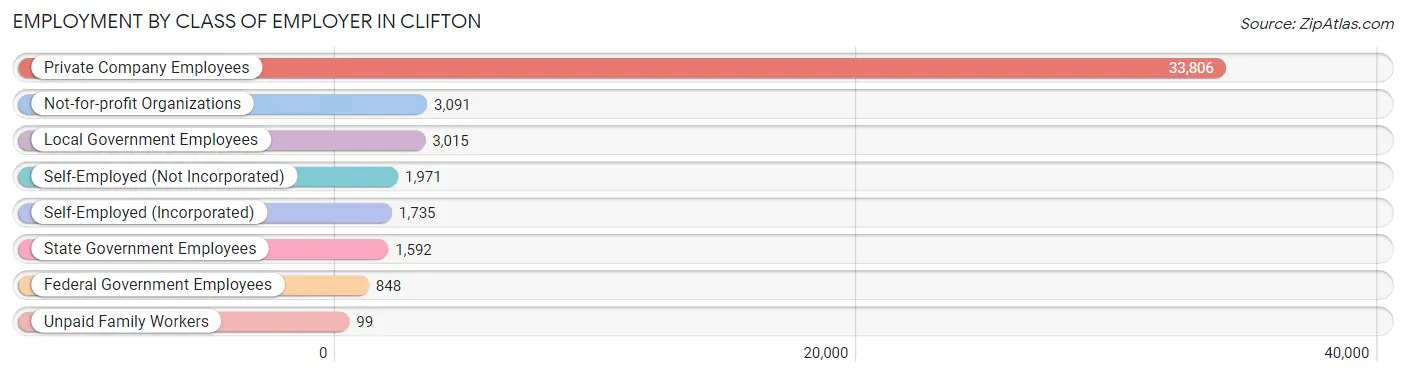
| Employer Class | # Employees | % Employees |
| Private Company Employees | 33,806 | 73.2% |
| Self-Employed (Incorporated) | 1,735 | 3.8% |
| Self-Employed (Not Incorporated) | 1,971 | 4.3% |
| Not-for-profit Organizations | 3,091 | 6.7% |
| Local Government Employees | 3,015 | 6.5% |
| State Government Employees | 1,592 | 3.5% |
| Federal Government Employees | 848 | 1.8% |
| Unpaid Family Workers | 99 | 0.2% |
| Total | 46,157 | 100.0% |
Employment Status by Age in Clifton
According to the labor force statistics for Clifton, out of the total population over 16 years of age (73,405), 68.6% or 50,356 individuals are in the labor force, with 6.4% or 3,223 of them unemployed. The age group with the highest labor force participation rate is 35 to 44 years, with 88.3% or 10,515 individuals in the labor force. Within the labor force, the 16 to 19 years age range has the highest percentage of unemployed individuals, with 17.6% or 256 of them being unemployed.
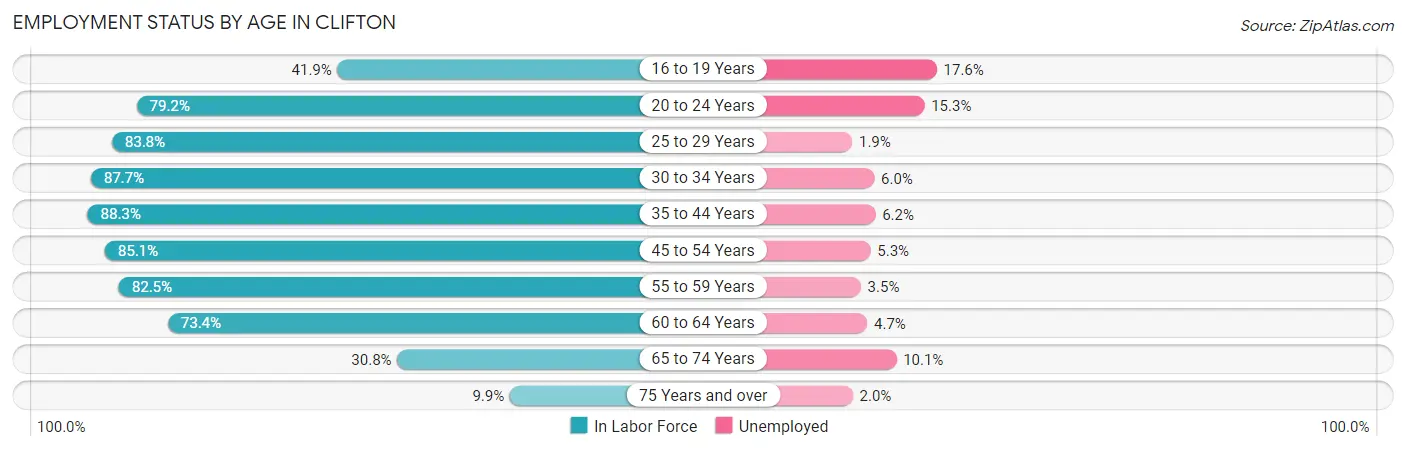
| Age Bracket | In Labor Force | Unemployed |
| 16 to 19 Years | 1,457 (41.9%) | 256 (17.6%) |
| 20 to 24 Years | 4,316 (79.2%) | 660 (15.3%) |
| 25 to 29 Years | 5,668 (83.8%) | 108 (1.9%) |
| 30 to 34 Years | 5,757 (87.7%) | 345 (6.0%) |
| 35 to 44 Years | 10,515 (88.3%) | 652 (6.2%) |
| 45 to 54 Years | 8,979 (85.1%) | 476 (5.3%) |
| 55 to 59 Years | 5,846 (82.5%) | 205 (3.5%) |
| 60 to 64 Years | 4,344 (73.4%) | 204 (4.7%) |
| 65 to 74 Years | 2,832 (30.8%) | 286 (10.1%) |
| 75 Years and over | 643 (9.9%) | 13 (2.0%) |
| Total | 50,356 (68.6%) | 3,223 (6.4%) |
Employment Status by Educational Attainment in Clifton
According to labor force statistics for Clifton, 84.3% of individuals (41,131) out of the total population between 25 and 64 years of age (48,791) are in the labor force, with 4.8% or 1,974 of them being unemployed. The group with the highest labor force participation rate are those with the educational attainment of bachelor's degree or higher, with 91.4% or 16,258 individuals in the labor force. Within the labor force, individuals with less than high school education have the highest percentage of unemployment, with 8.1% or 238 of them being unemployed.
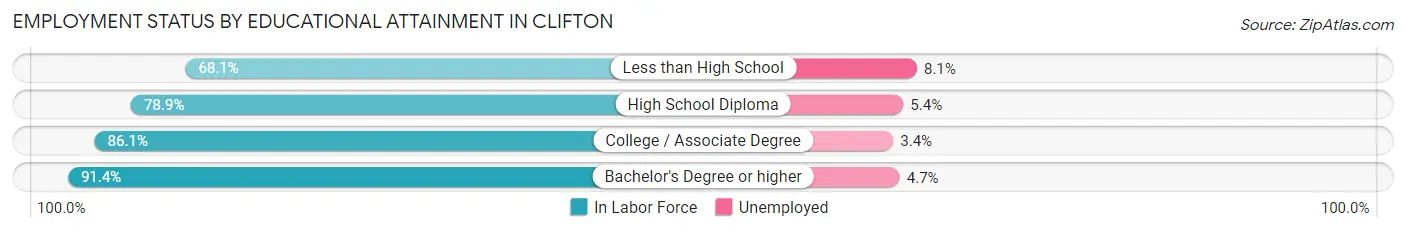
| Educational Attainment | In Labor Force | Unemployed |
| Less than High School | 2,934 (68.1%) | 349 (8.1%) |
| High School Diploma | 11,725 (78.9%) | 802 (5.4%) |
| College / Associate Degree | 10,189 (86.1%) | 402 (3.4%) |
| Bachelor's Degree or higher | 16,258 (91.4%) | 836 (4.7%) |
| Total | 41,131 (84.3%) | 2,342 (4.8%) |
Employment Occupations by Sex in Clifton
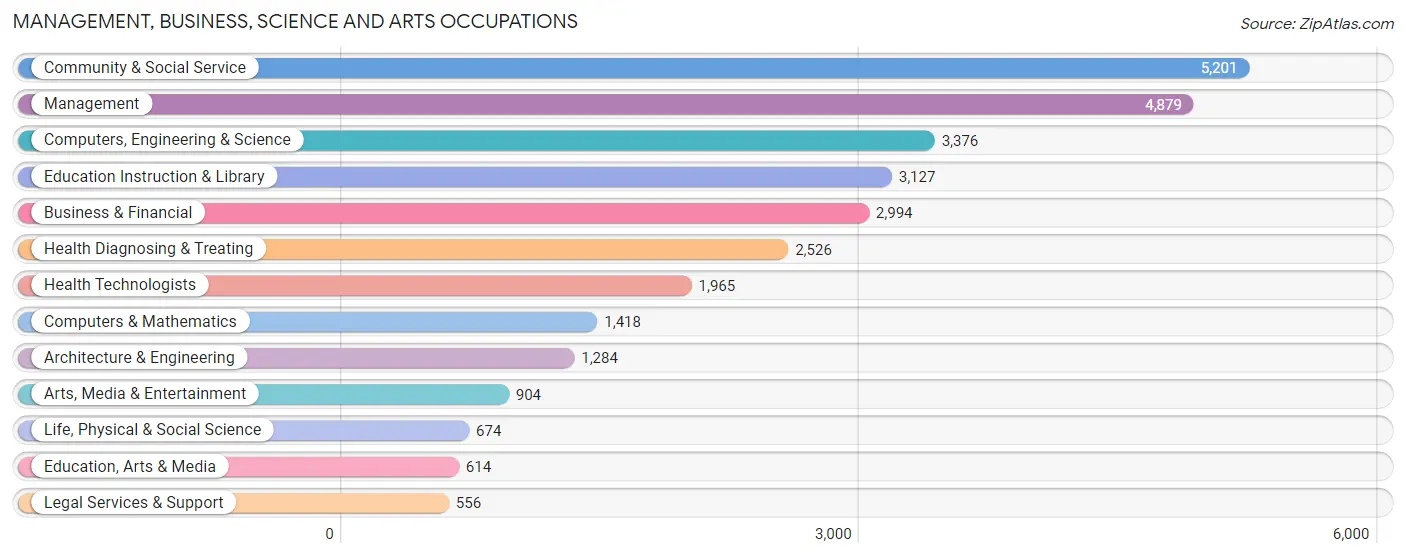
Management, Business, Science and Arts Occupations
The most common Management, Business, Science and Arts occupations in Clifton are Community & Social Service (5,201 | 11.0%), Management (4,879 | 10.3%), Computers, Engineering & Science (3,376 | 7.2%), Education Instruction & Library (3,127 | 6.6%), and Business & Financial (2,994 | 6.4%).
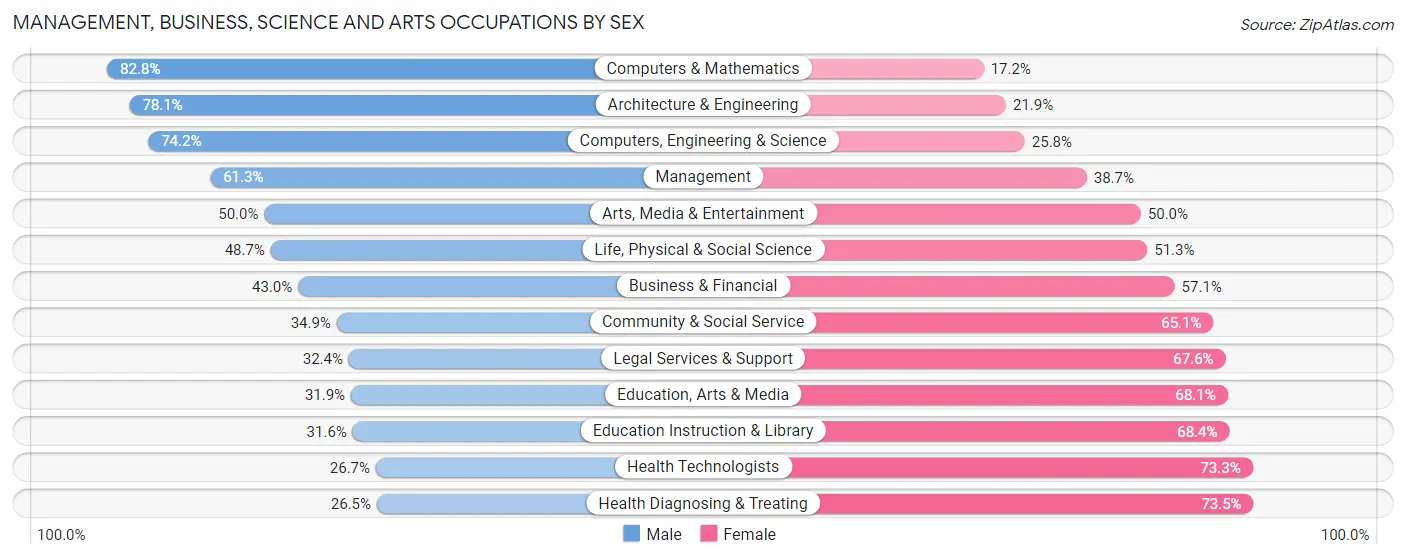
Management, Business, Science and Arts Occupations by Sex
Within the Management, Business, Science and Arts occupations in Clifton, the most male-oriented occupations are Computers & Mathematics (82.8%), Architecture & Engineering (78.1%), and Computers, Engineering & Science (74.2%), while the most female-oriented occupations are Health Diagnosing & Treating (73.5%), Health Technologists (73.3%), and Education Instruction & Library (68.4%).
| Occupation | Male | Female |
| Management | 2,990 (61.3%) | 1,889 (38.7%) |
| Business & Financial | 1,286 (42.9%) | 1,708 (57.1%) |
| Computers, Engineering & Science | 2,505 (74.2%) | 871 (25.8%) |
| Computers & Mathematics | 1,174 (82.8%) | 244 (17.2%) |
| Architecture & Engineering | 1,003 (78.1%) | 281 (21.9%) |
| Life, Physical & Social Science | 328 (48.7%) | 346 (51.3%) |
| Community & Social Service | 1,815 (34.9%) | 3,386 (65.1%) |
| Education, Arts & Media | 196 (31.9%) | 418 (68.1%) |
| Legal Services & Support | 180 (32.4%) | 376 (67.6%) |
| Education Instruction & Library | 987 (31.6%) | 2,140 (68.4%) |
| Arts, Media & Entertainment | 452 (50.0%) | 452 (50.0%) |
| Health Diagnosing & Treating | 670 (26.5%) | 1,856 (73.5%) |
| Health Technologists | 525 (26.7%) | 1,440 (73.3%) |
| Total (Category) | 9,266 (48.8%) | 9,710 (51.2%) |
| Total (Overall) | 25,232 (53.5%) | 21,921 (46.5%) |
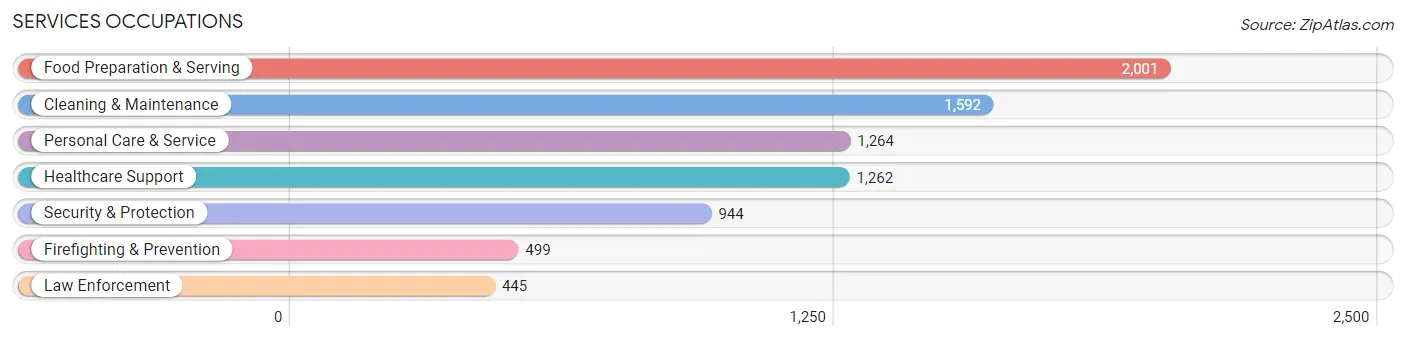
Services Occupations
The most common Services occupations in Clifton are Food Preparation & Serving (2,001 | 4.2%), Cleaning & Maintenance (1,592 | 3.4%), Personal Care & Service (1,264 | 2.7%), Healthcare Support (1,262 | 2.7%), and Security & Protection (944 | 2.0%).
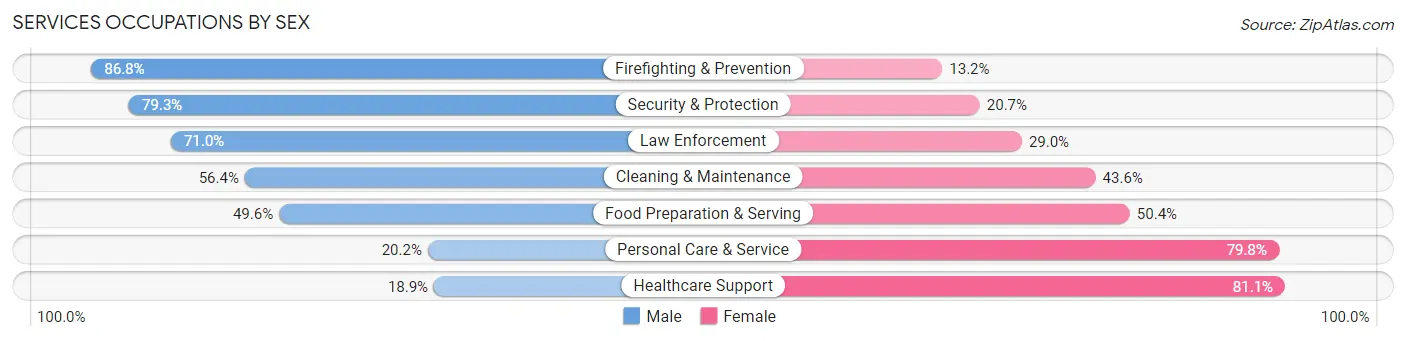
Services Occupations by Sex
Within the Services occupations in Clifton, the most male-oriented occupations are Firefighting & Prevention (86.8%), Security & Protection (79.3%), and Law Enforcement (71.0%), while the most female-oriented occupations are Healthcare Support (81.1%), Personal Care & Service (79.8%), and Food Preparation & Serving (50.4%).
| Occupation | Male | Female |
| Healthcare Support | 239 (18.9%) | 1,023 (81.1%) |
| Security & Protection | 749 (79.3%) | 195 (20.7%) |
| Firefighting & Prevention | 433 (86.8%) | 66 (13.2%) |
| Law Enforcement | 316 (71.0%) | 129 (29.0%) |
| Food Preparation & Serving | 993 (49.6%) | 1,008 (50.4%) |
| Cleaning & Maintenance | 898 (56.4%) | 694 (43.6%) |
| Personal Care & Service | 255 (20.2%) | 1,009 (79.8%) |
| Total (Category) | 3,134 (44.4%) | 3,929 (55.6%) |
| Total (Overall) | 25,232 (53.5%) | 21,921 (46.5%) |
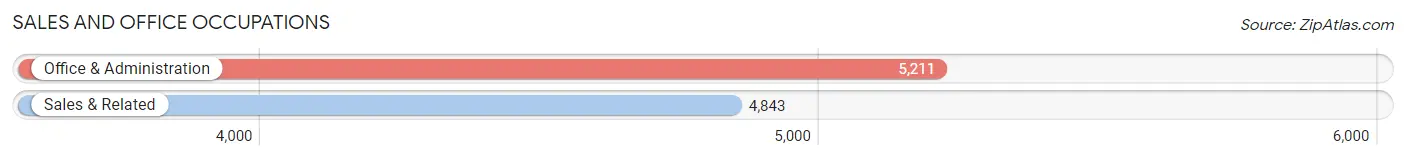
Sales and Office Occupations
The most common Sales and Office occupations in Clifton are Office & Administration (5,211 | 11.1%), and Sales & Related (4,843 | 10.3%).
Sales and Office Occupations by Sex
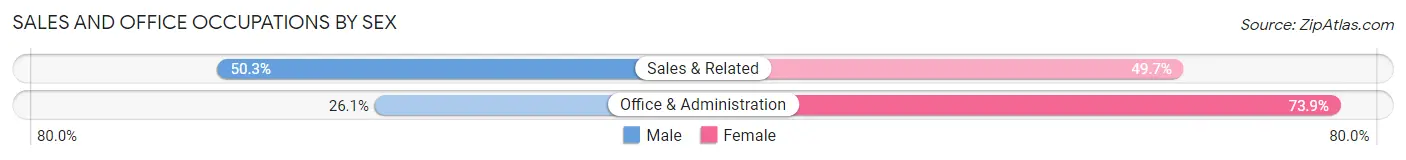
| Occupation | Male | Female |
| Sales & Related | 2,436 (50.3%) | 2,407 (49.7%) |
| Office & Administration | 1,361 (26.1%) | 3,850 (73.9%) |
| Total (Category) | 3,797 (37.8%) | 6,257 (62.2%) |
| Total (Overall) | 25,232 (53.5%) | 21,921 (46.5%) |
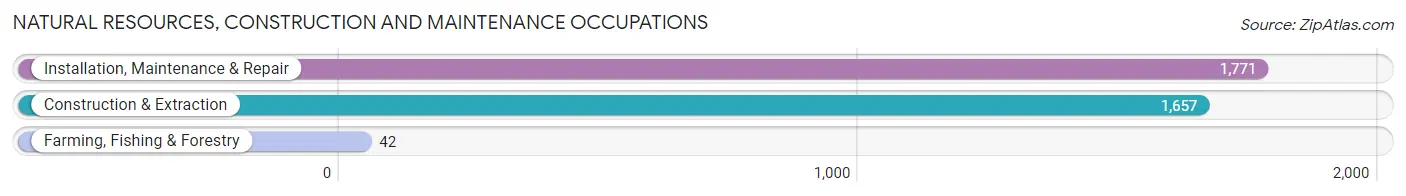
Natural Resources, Construction and Maintenance Occupations
The most common Natural Resources, Construction and Maintenance occupations in Clifton are Installation, Maintenance & Repair (1,771 | 3.8%), Construction & Extraction (1,657 | 3.5%), and Farming, Fishing & Forestry (42 | 0.1%).
Natural Resources, Construction and Maintenance Occupations by Sex
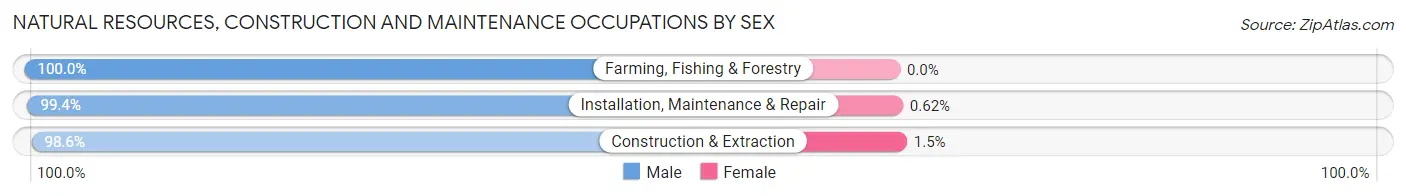
| Occupation | Male | Female |
| Farming, Fishing & Forestry | 42 (100.0%) | 0 (0.0%) |
| Construction & Extraction | 1,633 (98.6%) | 24 (1.5%) |
| Installation, Maintenance & Repair | 1,760 (99.4%) | 11 (0.6%) |
| Total (Category) | 3,435 (99.0%) | 35 (1.0%) |
| Total (Overall) | 25,232 (53.5%) | 21,921 (46.5%) |
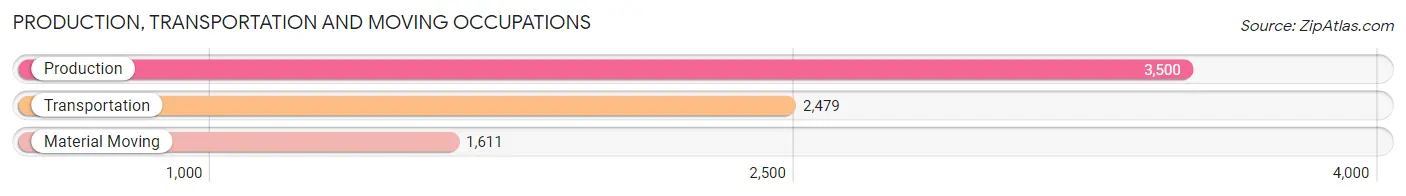
Production, Transportation and Moving Occupations
The most common Production, Transportation and Moving occupations in Clifton are Production (3,500 | 7.4%), Transportation (2,479 | 5.3%), and Material Moving (1,611 | 3.4%).
Production, Transportation and Moving Occupations by Sex
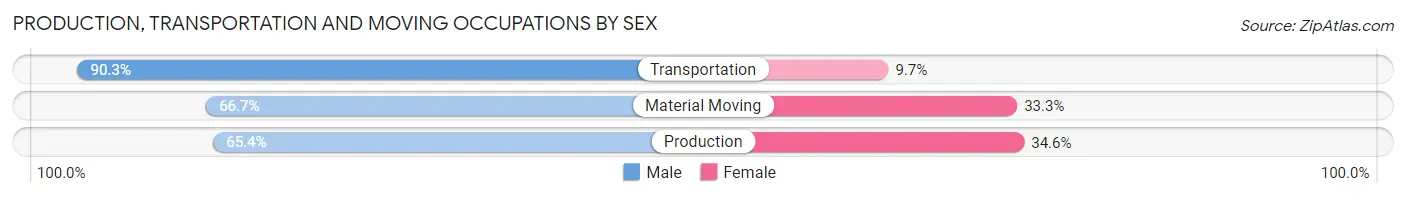
| Occupation | Male | Female |
| Production | 2,288 (65.4%) | 1,212 (34.6%) |
| Transportation | 2,238 (90.3%) | 241 (9.7%) |
| Material Moving | 1,074 (66.7%) | 537 (33.3%) |
| Total (Category) | 5,600 (73.8%) | 1,990 (26.2%) |
| Total (Overall) | 25,232 (53.5%) | 21,921 (46.5%) |
Employment Industries by Sex in Clifton
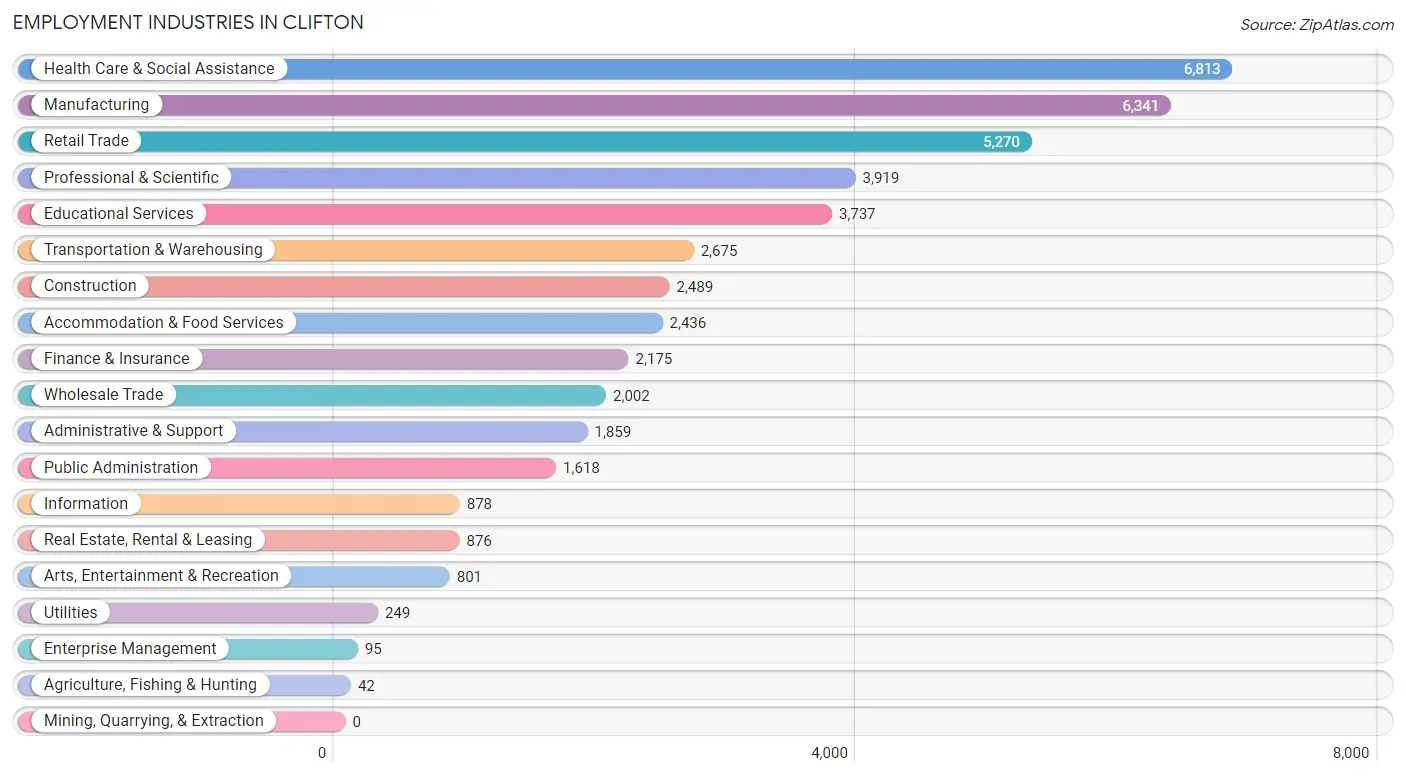
Employment Industries in Clifton
The major employment industries in Clifton include Health Care & Social Assistance (6,813 | 14.4%), Manufacturing (6,341 | 13.5%), Retail Trade (5,270 | 11.2%), Professional & Scientific (3,919 | 8.3%), and Educational Services (3,737 | 7.9%).
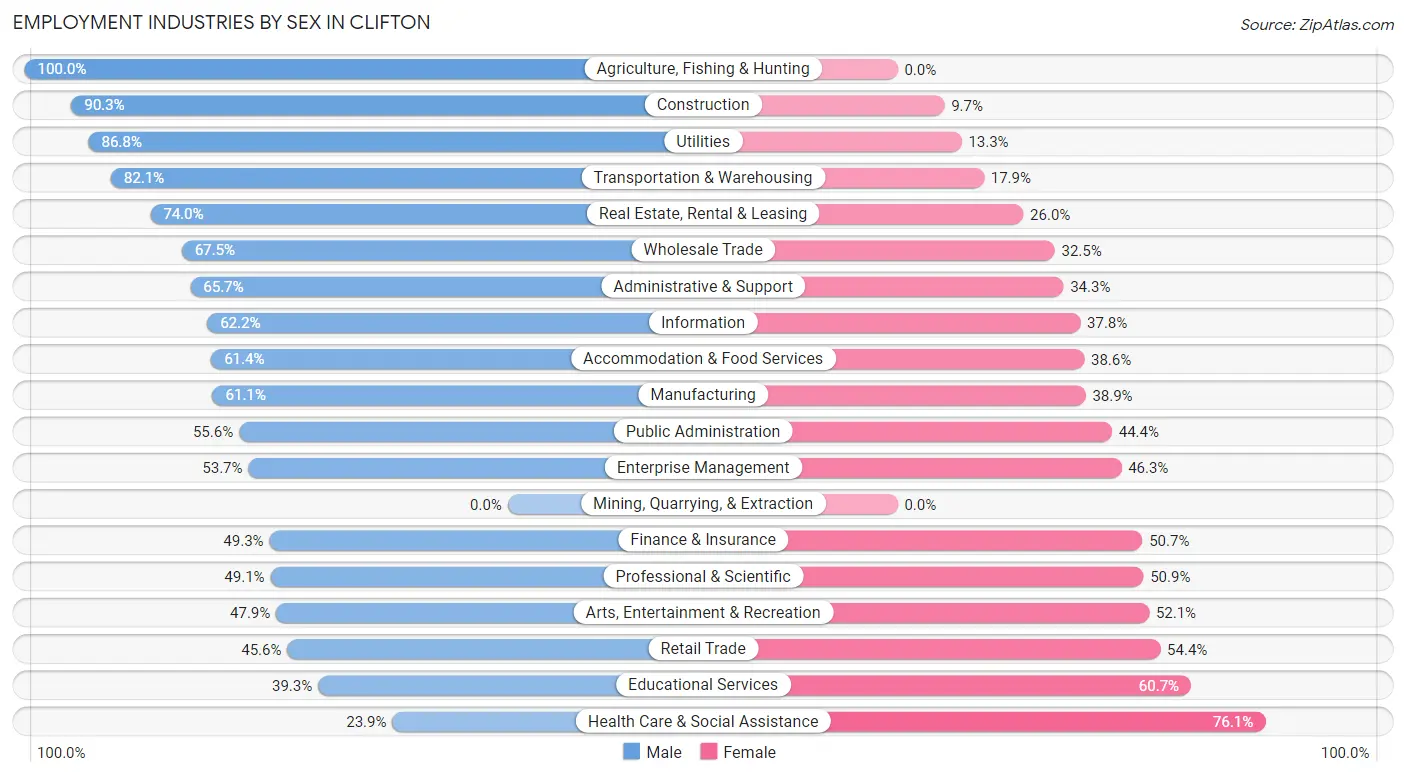
Employment Industries by Sex in Clifton
The Clifton industries that see more men than women are Agriculture, Fishing & Hunting (100.0%), Construction (90.3%), and Utilities (86.8%), whereas the industries that tend to have a higher number of women are Health Care & Social Assistance (76.1%), Educational Services (60.7%), and Retail Trade (54.4%).
| Industry | Male | Female |
| Agriculture, Fishing & Hunting | 42 (100.0%) | 0 (0.0%) |
| Mining, Quarrying, & Extraction | 0 (0.0%) | 0 (0.0%) |
| Construction | 2,248 (90.3%) | 241 (9.7%) |
| Manufacturing | 3,873 (61.1%) | 2,468 (38.9%) |
| Wholesale Trade | 1,351 (67.5%) | 651 (32.5%) |
| Retail Trade | 2,404 (45.6%) | 2,866 (54.4%) |
| Transportation & Warehousing | 2,197 (82.1%) | 478 (17.9%) |
| Utilities | 216 (86.8%) | 33 (13.3%) |
| Information | 546 (62.2%) | 332 (37.8%) |
| Finance & Insurance | 1,073 (49.3%) | 1,102 (50.7%) |
| Real Estate, Rental & Leasing | 648 (74.0%) | 228 (26.0%) |
| Professional & Scientific | 1,925 (49.1%) | 1,994 (50.9%) |
| Enterprise Management | 51 (53.7%) | 44 (46.3%) |
| Administrative & Support | 1,221 (65.7%) | 638 (34.3%) |
| Educational Services | 1,467 (39.3%) | 2,270 (60.7%) |
| Health Care & Social Assistance | 1,628 (23.9%) | 5,185 (76.1%) |
| Arts, Entertainment & Recreation | 384 (47.9%) | 417 (52.1%) |
| Accommodation & Food Services | 1,495 (61.4%) | 941 (38.6%) |
| Public Administration | 900 (55.6%) | 718 (44.4%) |
| Total | 25,232 (53.5%) | 21,921 (46.5%) |
Education in Clifton
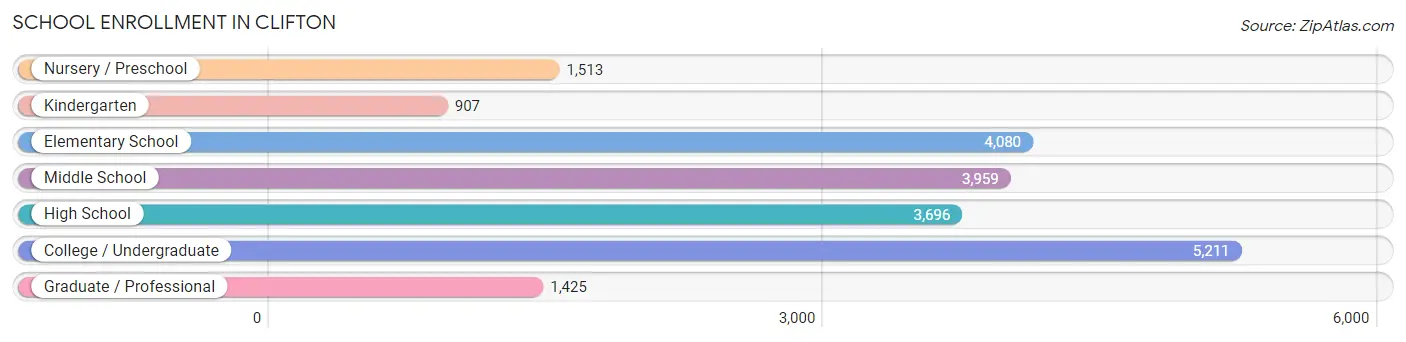
School Enrollment in Clifton
The most common levels of schooling among the 20,791 students in Clifton are college / undergraduate (5,211 | 25.1%), elementary school (4,080 | 19.6%), and middle school (3,959 | 19.0%).
| School Level | # Students | % Students |
| Nursery / Preschool | 1,513 | 7.3% |
| Kindergarten | 907 | 4.4% |
| Elementary School | 4,080 | 19.6% |
| Middle School | 3,959 | 19.0% |
| High School | 3,696 | 17.8% |
| College / Undergraduate | 5,211 | 25.1% |
| Graduate / Professional | 1,425 | 6.9% |
| Total | 20,791 | 100.0% |
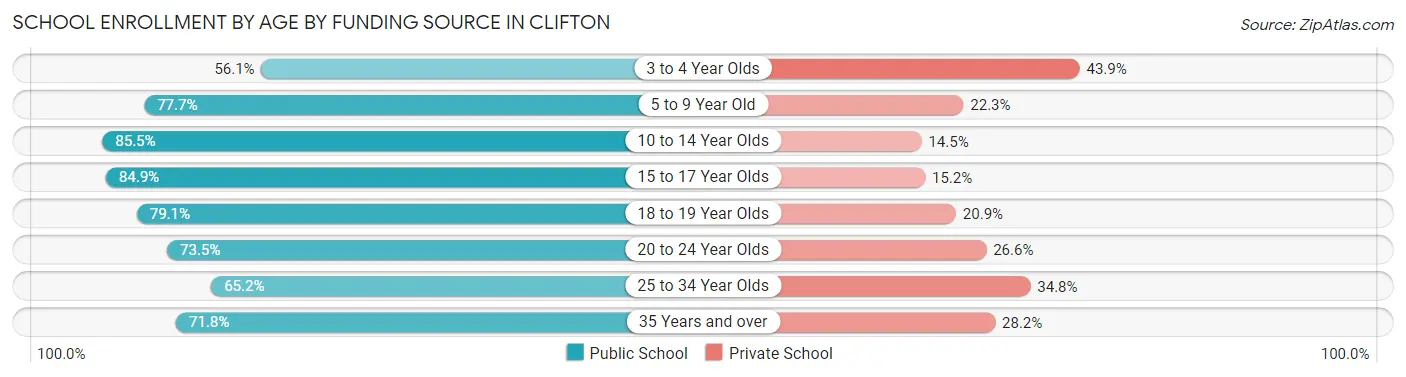
School Enrollment by Age by Funding Source in Clifton
Out of a total of 20,791 students who are enrolled in schools in Clifton, 4,678 (22.5%) attend a private institution, while the remaining 16,113 (77.5%) are enrolled in public schools. The age group of 3 to 4 year olds has the highest likelihood of being enrolled in private schools, with 470 (43.9% in the age bracket) enrolled. Conversely, the age group of 10 to 14 year olds has the lowest likelihood of being enrolled in a private school, with 4,396 (85.5% in the age bracket) attending a public institution.
| Age Bracket | Public School | Private School |
| 3 to 4 Year Olds | 600 (56.1%) | 470 (43.9%) |
| 5 to 9 Year Old | 3,752 (77.7%) | 1,076 (22.3%) |
| 10 to 14 Year Olds | 4,396 (85.5%) | 745 (14.5%) |
| 15 to 17 Year Olds | 2,129 (84.9%) | 380 (15.1%) |
| 18 to 19 Year Olds | 1,324 (79.1%) | 350 (20.9%) |
| 20 to 24 Year Olds | 1,757 (73.5%) | 635 (26.6%) |
| 25 to 34 Year Olds | 1,270 (65.2%) | 677 (34.8%) |
| 35 Years and over | 883 (71.8%) | 347 (28.2%) |
| Total | 16,113 (77.5%) | 4,678 (22.5%) |
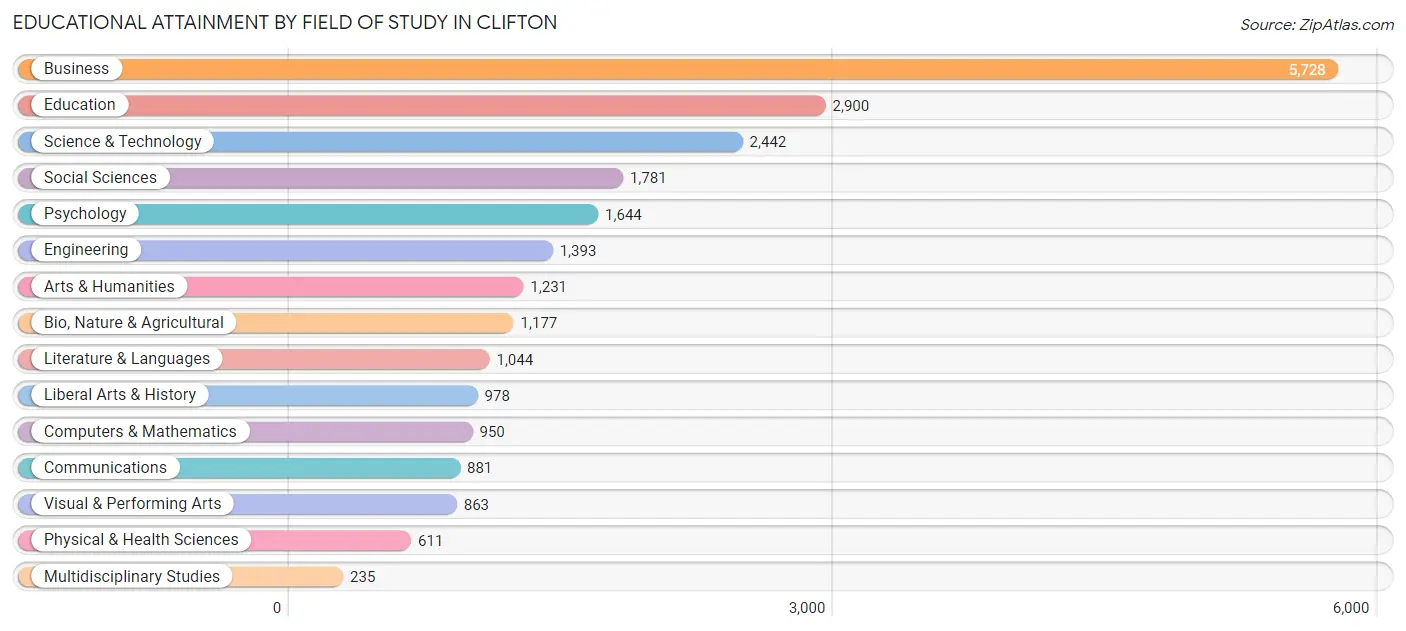
Educational Attainment by Field of Study in Clifton
Business (5,728 | 24.0%), education (2,900 | 12.2%), science & technology (2,442 | 10.2%), social sciences (1,781 | 7.5%), and psychology (1,644 | 6.9%) are the most common fields of study among 23,858 individuals in Clifton who have obtained a bachelor's degree or higher.
| Field of Study | # Graduates | % Graduates |
| Computers & Mathematics | 950 | 4.0% |
| Bio, Nature & Agricultural | 1,177 | 4.9% |
| Physical & Health Sciences | 611 | 2.6% |
| Psychology | 1,644 | 6.9% |
| Social Sciences | 1,781 | 7.5% |
| Engineering | 1,393 | 5.8% |
| Multidisciplinary Studies | 235 | 1.0% |
| Science & Technology | 2,442 | 10.2% |
| Business | 5,728 | 24.0% |
| Education | 2,900 | 12.2% |
| Literature & Languages | 1,044 | 4.4% |
| Liberal Arts & History | 978 | 4.1% |
| Visual & Performing Arts | 863 | 3.6% |
| Communications | 881 | 3.7% |
| Arts & Humanities | 1,231 | 5.2% |
| Total | 23,858 | 100.0% |
Transportation & Commute in Clifton
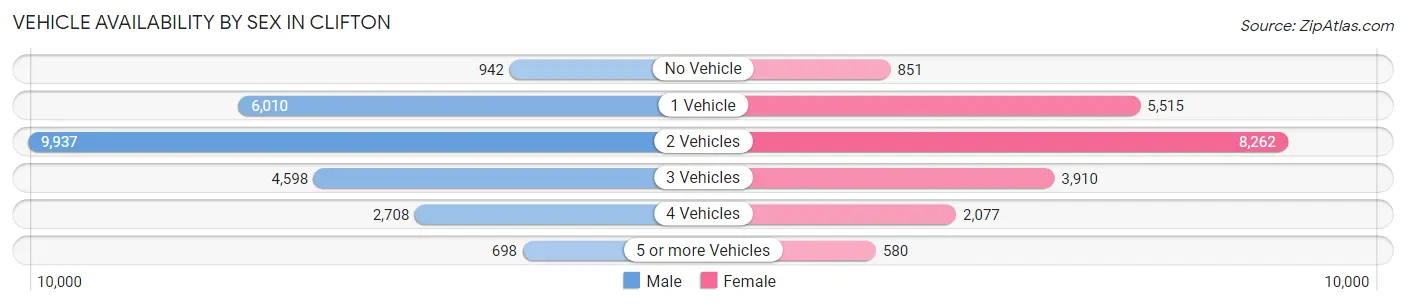
Vehicle Availability by Sex in Clifton
The most prevalent vehicle ownership categories in Clifton are males with 2 vehicles (9,937, accounting for 39.9%) and females with 2 vehicles (8,262, making up 46.9%).
| Vehicles Available | Male | Female |
| No Vehicle | 942 (3.8%) | 851 (4.0%) |
| 1 Vehicle | 6,010 (24.1%) | 5,515 (26.0%) |
| 2 Vehicles | 9,937 (39.9%) | 8,262 (39.0%) |
| 3 Vehicles | 4,598 (18.5%) | 3,910 (18.4%) |
| 4 Vehicles | 2,708 (10.9%) | 2,077 (9.8%) |
| 5 or more Vehicles | 698 (2.8%) | 580 (2.7%) |
| Total | 24,893 (100.0%) | 21,195 (100.0%) |
Commute Time in Clifton
The most frequently occuring commute durations in Clifton are 20 to 24 minutes (6,825 commuters, 16.1%), 30 to 34 minutes (6,357 commuters, 15.0%), and 10 to 14 minutes (6,327 commuters, 14.9%).
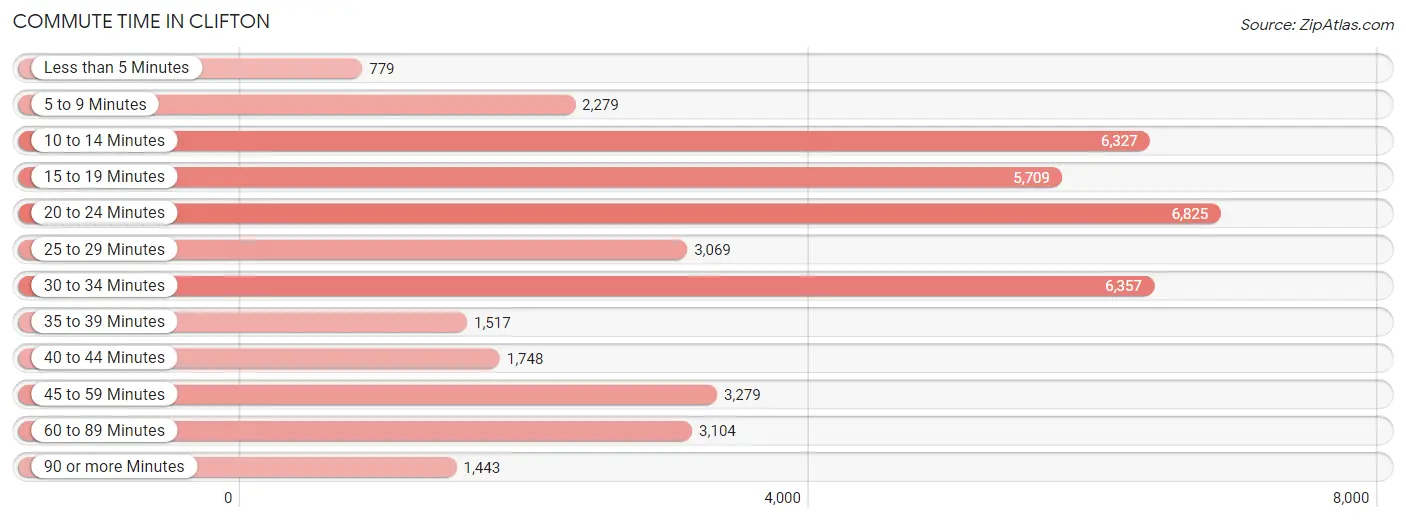
| Commute Time | # Commuters | % Commuters |
| Less than 5 Minutes | 779 | 1.8% |
| 5 to 9 Minutes | 2,279 | 5.4% |
| 10 to 14 Minutes | 6,327 | 14.9% |
| 15 to 19 Minutes | 5,709 | 13.5% |
| 20 to 24 Minutes | 6,825 | 16.1% |
| 25 to 29 Minutes | 3,069 | 7.2% |
| 30 to 34 Minutes | 6,357 | 15.0% |
| 35 to 39 Minutes | 1,517 | 3.6% |
| 40 to 44 Minutes | 1,748 | 4.1% |
| 45 to 59 Minutes | 3,279 | 7.7% |
| 60 to 89 Minutes | 3,104 | 7.3% |
| 90 or more Minutes | 1,443 | 3.4% |
Commute Time by Sex in Clifton
The most common commute times in Clifton are 20 to 24 minutes (3,627 commuters, 15.6%) for males and 20 to 24 minutes (3,198 commuters, 16.7%) for females.
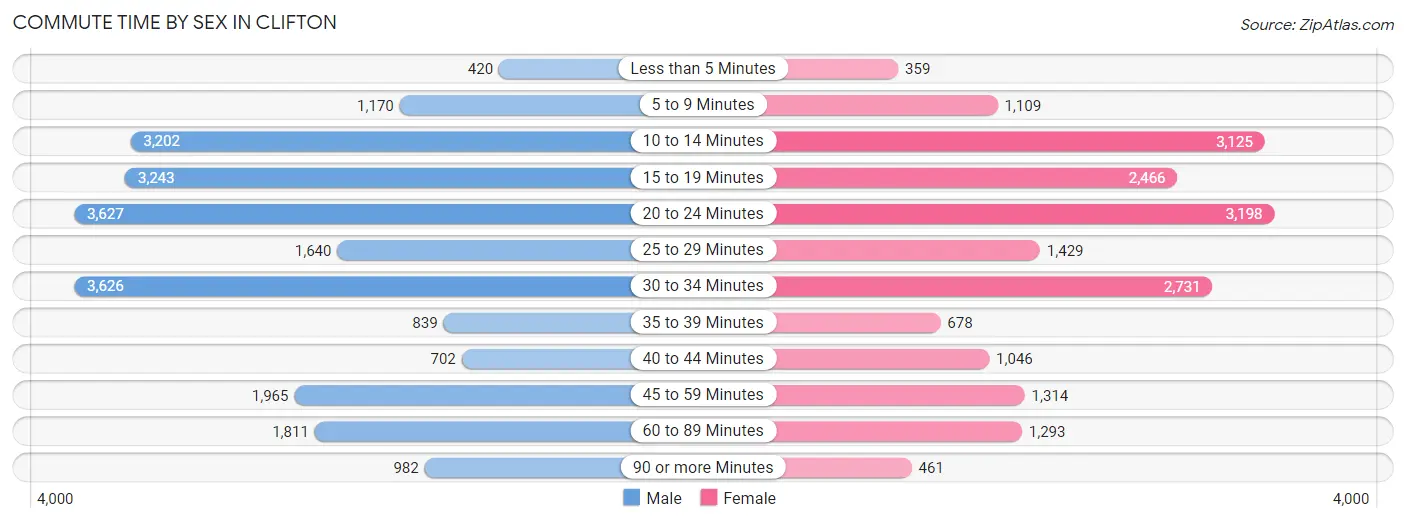
| Commute Time | Male | Female |
| Less than 5 Minutes | 420 (1.8%) | 359 (1.9%) |
| 5 to 9 Minutes | 1,170 (5.0%) | 1,109 (5.8%) |
| 10 to 14 Minutes | 3,202 (13.8%) | 3,125 (16.3%) |
| 15 to 19 Minutes | 3,243 (14.0%) | 2,466 (12.8%) |
| 20 to 24 Minutes | 3,627 (15.6%) | 3,198 (16.7%) |
| 25 to 29 Minutes | 1,640 (7.1%) | 1,429 (7.4%) |
| 30 to 34 Minutes | 3,626 (15.6%) | 2,731 (14.2%) |
| 35 to 39 Minutes | 839 (3.6%) | 678 (3.5%) |
| 40 to 44 Minutes | 702 (3.0%) | 1,046 (5.4%) |
| 45 to 59 Minutes | 1,965 (8.5%) | 1,314 (6.8%) |
| 60 to 89 Minutes | 1,811 (7.8%) | 1,293 (6.7%) |
| 90 or more Minutes | 982 (4.2%) | 461 (2.4%) |
Time of Departure to Work by Sex in Clifton
The most frequent times of departure to work in Clifton are 7:00 AM to 7:29 AM (3,650, 15.7%) for males and 8:00 AM to 8:29 AM (3,032, 15.8%) for females.
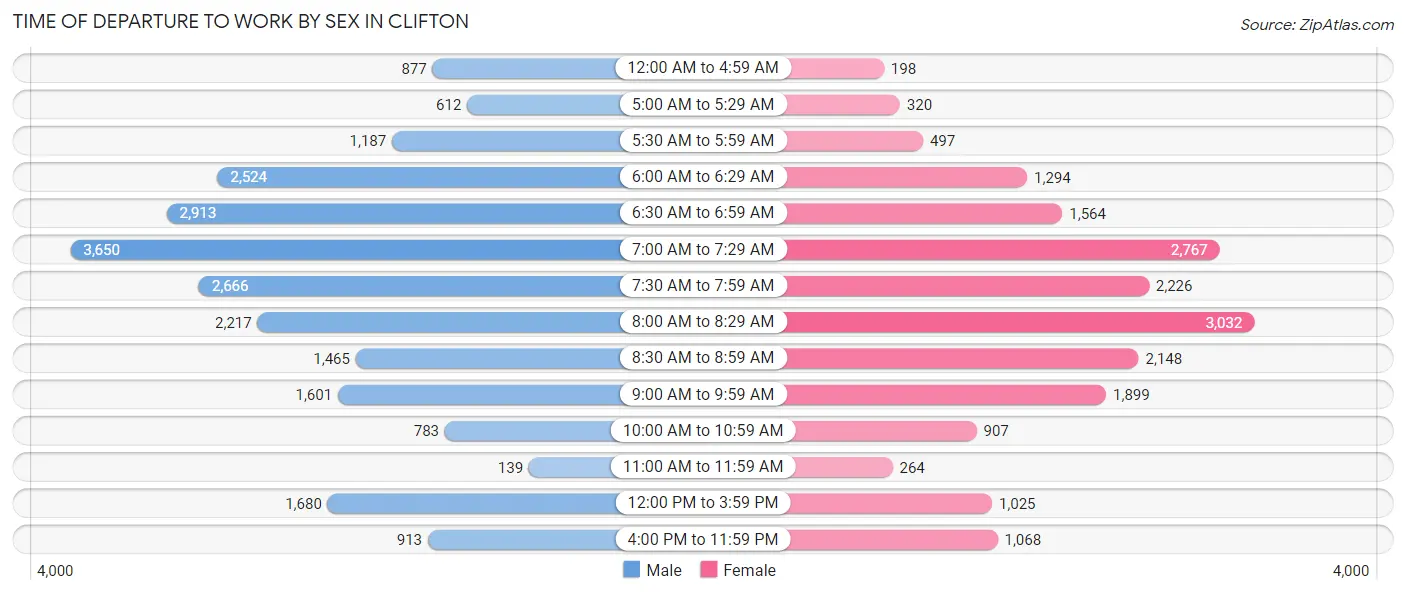
| Time of Departure | Male | Female |
| 12:00 AM to 4:59 AM | 877 (3.8%) | 198 (1.0%) |
| 5:00 AM to 5:29 AM | 612 (2.6%) | 320 (1.7%) |
| 5:30 AM to 5:59 AM | 1,187 (5.1%) | 497 (2.6%) |
| 6:00 AM to 6:29 AM | 2,524 (10.9%) | 1,294 (6.7%) |
| 6:30 AM to 6:59 AM | 2,913 (12.5%) | 1,564 (8.1%) |
| 7:00 AM to 7:29 AM | 3,650 (15.7%) | 2,767 (14.4%) |
| 7:30 AM to 7:59 AM | 2,666 (11.5%) | 2,226 (11.6%) |
| 8:00 AM to 8:29 AM | 2,217 (9.5%) | 3,032 (15.8%) |
| 8:30 AM to 8:59 AM | 1,465 (6.3%) | 2,148 (11.2%) |
| 9:00 AM to 9:59 AM | 1,601 (6.9%) | 1,899 (9.9%) |
| 10:00 AM to 10:59 AM | 783 (3.4%) | 907 (4.7%) |
| 11:00 AM to 11:59 AM | 139 (0.6%) | 264 (1.4%) |
| 12:00 PM to 3:59 PM | 1,680 (7.2%) | 1,025 (5.3%) |
| 4:00 PM to 11:59 PM | 913 (3.9%) | 1,068 (5.6%) |
| Total | 23,227 (100.0%) | 19,209 (100.0%) |
Housing Occupancy in Clifton
Occupancy by Ownership in Clifton
Of the total 32,640 dwellings in Clifton, owner-occupied units account for 18,783 (57.6%), while renter-occupied units make up 13,857 (42.4%).
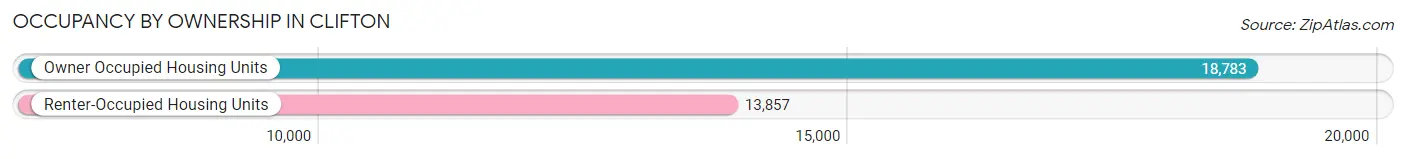
| Occupancy | # Housing Units | % Housing Units |
| Owner Occupied Housing Units | 18,783 | 57.6% |
| Renter-Occupied Housing Units | 13,857 | 42.4% |
| Total Occupied Housing Units | 32,640 | 100.0% |
Occupancy by Household Size in Clifton
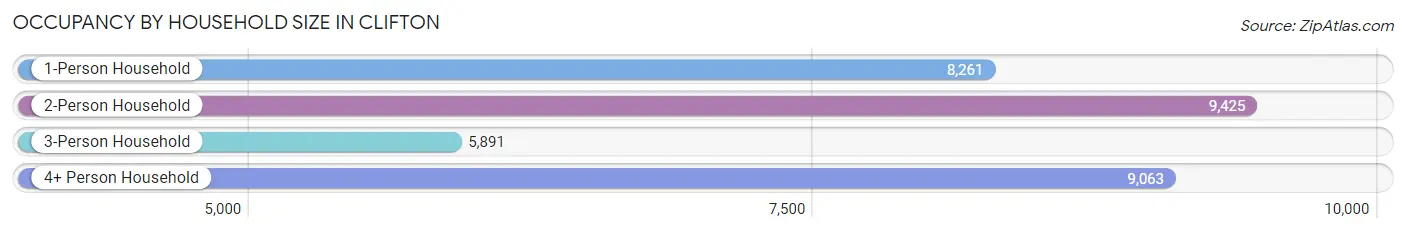
| Household Size | # Housing Units | % Housing Units |
| 1-Person Household | 8,261 | 25.3% |
| 2-Person Household | 9,425 | 28.9% |
| 3-Person Household | 5,891 | 18.0% |
| 4+ Person Household | 9,063 | 27.8% |
| Total Housing Units | 32,640 | 100.0% |
Occupancy by Ownership by Household Size in Clifton
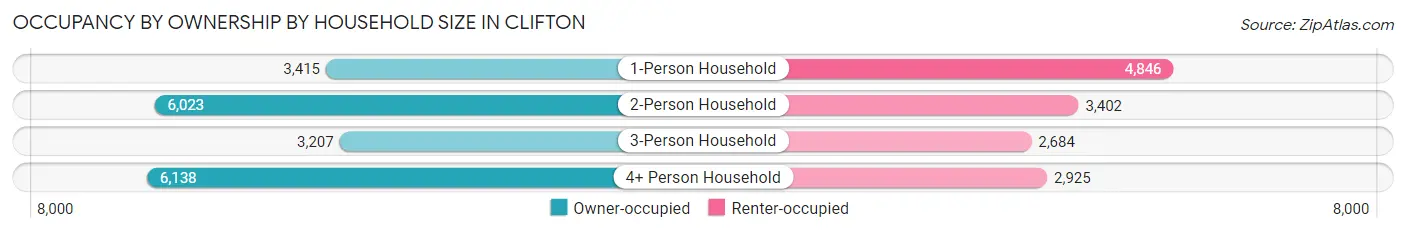
| Household Size | Owner-occupied | Renter-occupied |
| 1-Person Household | 3,415 (41.3%) | 4,846 (58.7%) |
| 2-Person Household | 6,023 (63.9%) | 3,402 (36.1%) |
| 3-Person Household | 3,207 (54.4%) | 2,684 (45.6%) |
| 4+ Person Household | 6,138 (67.7%) | 2,925 (32.3%) |
| Total Housing Units | 18,783 (57.6%) | 13,857 (42.4%) |
Occupancy by Educational Attainment in Clifton
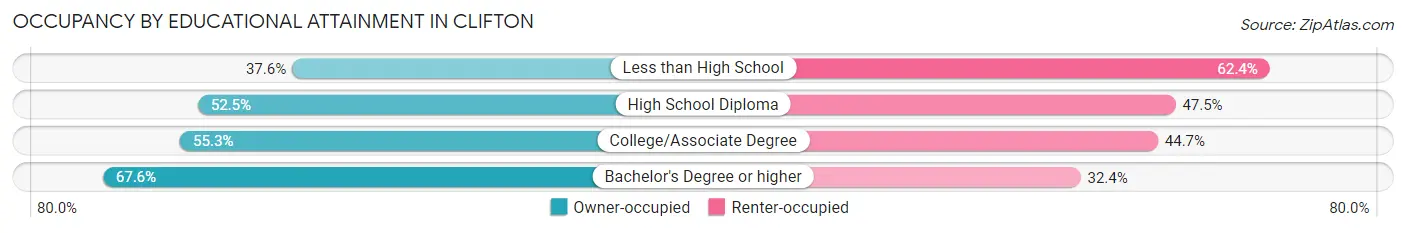
| Household Size | Owner-occupied | Renter-occupied |
| Less than High School | 1,043 (37.6%) | 1,732 (62.4%) |
| High School Diploma | 5,162 (52.5%) | 4,665 (47.5%) |
| College/Associate Degree | 4,350 (55.3%) | 3,513 (44.7%) |
| Bachelor's Degree or higher | 8,228 (67.6%) | 3,947 (32.4%) |
Occupancy by Age of Householder in Clifton
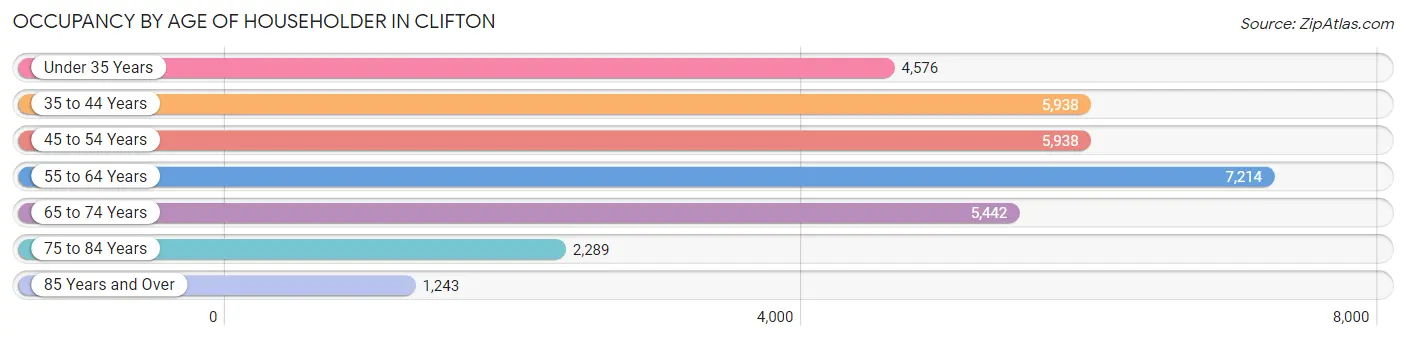
| Age Bracket | # Households | % Households |
| Under 35 Years | 4,576 | 14.0% |
| 35 to 44 Years | 5,938 | 18.2% |
| 45 to 54 Years | 5,938 | 18.2% |
| 55 to 64 Years | 7,214 | 22.1% |
| 65 to 74 Years | 5,442 | 16.7% |
| 75 to 84 Years | 2,289 | 7.0% |
| 85 Years and Over | 1,243 | 3.8% |
| Total | 32,640 | 100.0% |
Housing Finances in Clifton
Median Income by Occupancy in Clifton
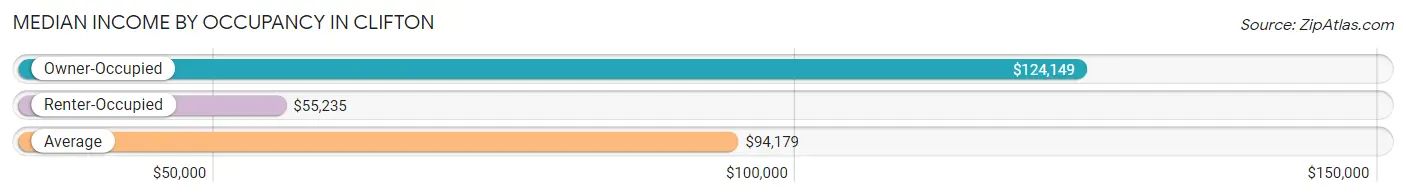
| Occupancy Type | # Households | Median Income |
| Owner-Occupied | 18,783 (57.6%) | $124,149 |
| Renter-Occupied | 13,857 (42.4%) | $55,235 |
| Average | 32,640 (100.0%) | $94,179 |
Occupancy by Householder Income Bracket in Clifton
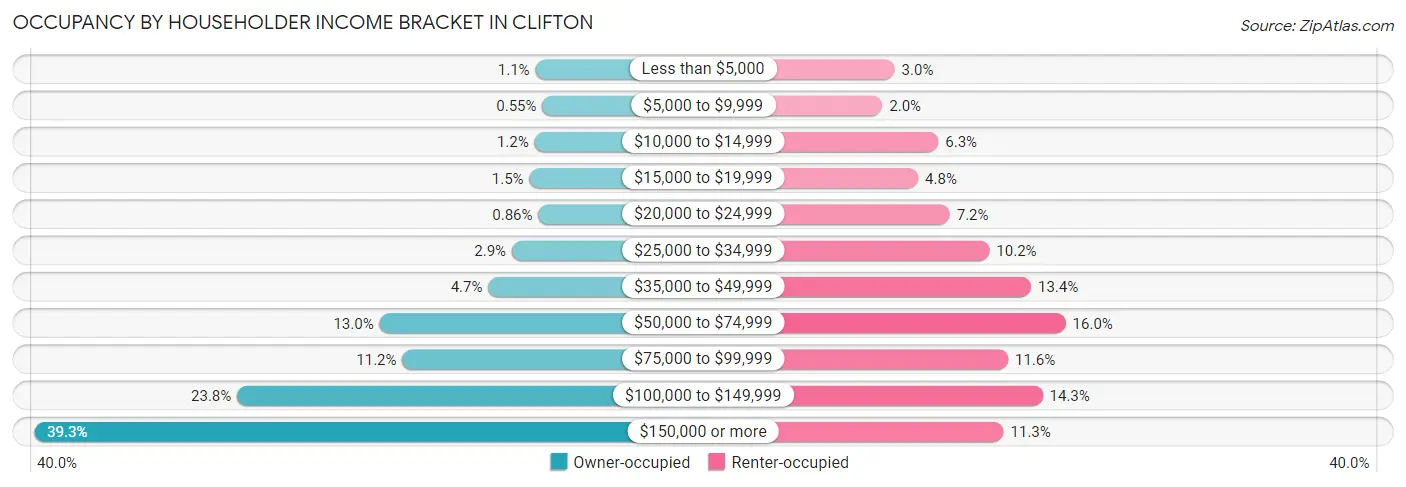
| Income Bracket | Owner-occupied | Renter-occupied |
| Less than $5,000 | 203 (1.1%) | 413 (3.0%) |
| $5,000 to $9,999 | 104 (0.5%) | 282 (2.0%) |
| $10,000 to $14,999 | 216 (1.1%) | 875 (6.3%) |
| $15,000 to $19,999 | 290 (1.5%) | 661 (4.8%) |
| $20,000 to $24,999 | 162 (0.9%) | 995 (7.2%) |
| $25,000 to $34,999 | 540 (2.9%) | 1,413 (10.2%) |
| $35,000 to $49,999 | 878 (4.7%) | 1,852 (13.4%) |
| $50,000 to $74,999 | 2,434 (13.0%) | 2,219 (16.0%) |
| $75,000 to $99,999 | 2,107 (11.2%) | 1,610 (11.6%) |
| $100,000 to $149,999 | 4,473 (23.8%) | 1,974 (14.2%) |
| $150,000 or more | 7,376 (39.3%) | 1,563 (11.3%) |
| Total | 18,783 (100.0%) | 13,857 (100.0%) |
Monthly Housing Cost Tiers in Clifton
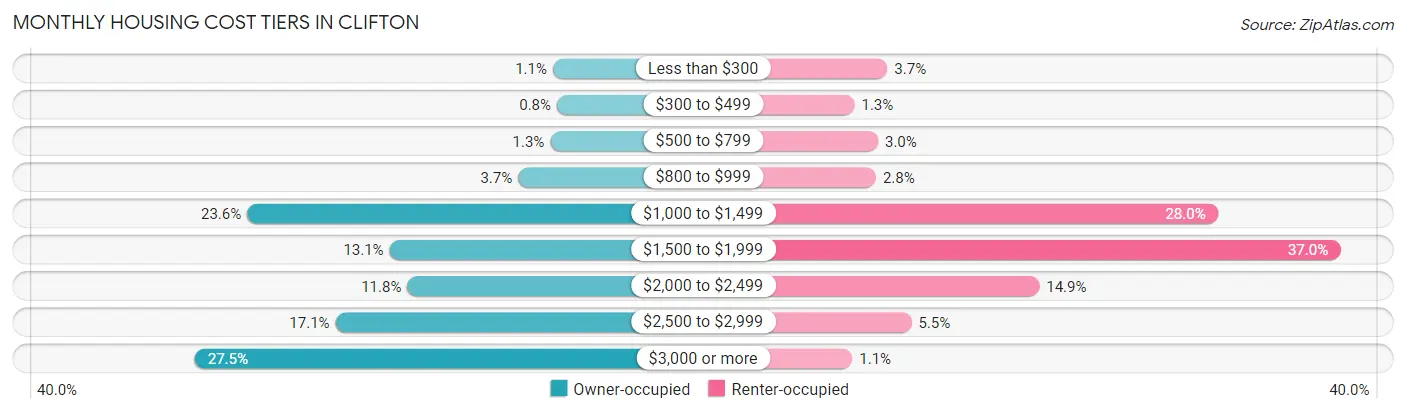
| Monthly Cost | Owner-occupied | Renter-occupied |
| Less than $300 | 206 (1.1%) | 510 (3.7%) |
| $300 to $499 | 151 (0.8%) | 175 (1.3%) |
| $500 to $799 | 243 (1.3%) | 415 (3.0%) |
| $800 to $999 | 687 (3.7%) | 393 (2.8%) |
| $1,000 to $1,499 | 4,437 (23.6%) | 3,879 (28.0%) |
| $1,500 to $1,999 | 2,466 (13.1%) | 5,129 (37.0%) |
| $2,000 to $2,499 | 2,221 (11.8%) | 2,061 (14.9%) |
| $2,500 to $2,999 | 3,214 (17.1%) | 757 (5.5%) |
| $3,000 or more | 5,158 (27.5%) | 153 (1.1%) |
| Total | 18,783 (100.0%) | 13,857 (100.0%) |
Physical Housing Characteristics in Clifton
Housing Structures in Clifton
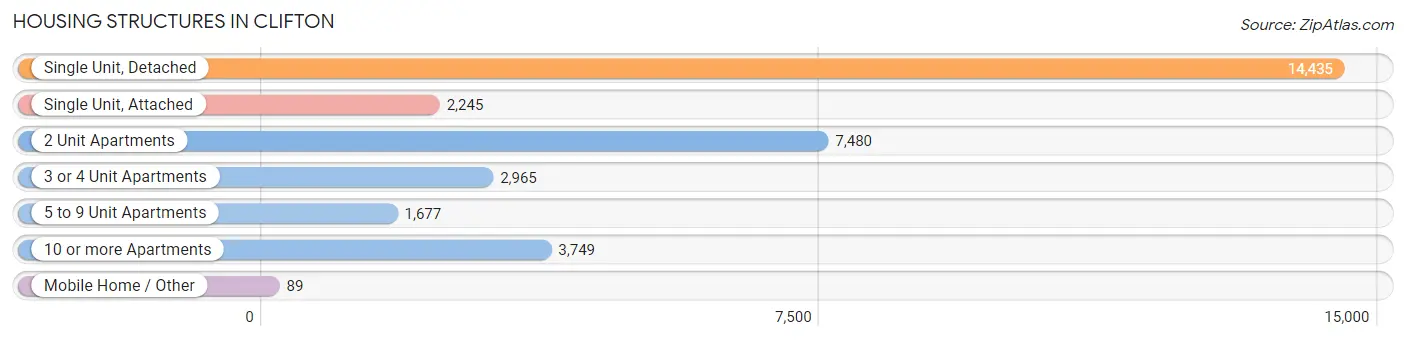
| Structure Type | # Housing Units | % Housing Units |
| Single Unit, Detached | 14,435 | 44.2% |
| Single Unit, Attached | 2,245 | 6.9% |
| 2 Unit Apartments | 7,480 | 22.9% |
| 3 or 4 Unit Apartments | 2,965 | 9.1% |
| 5 to 9 Unit Apartments | 1,677 | 5.1% |
| 10 or more Apartments | 3,749 | 11.5% |
| Mobile Home / Other | 89 | 0.3% |
| Total | 32,640 | 100.0% |
Housing Structures by Occupancy in Clifton
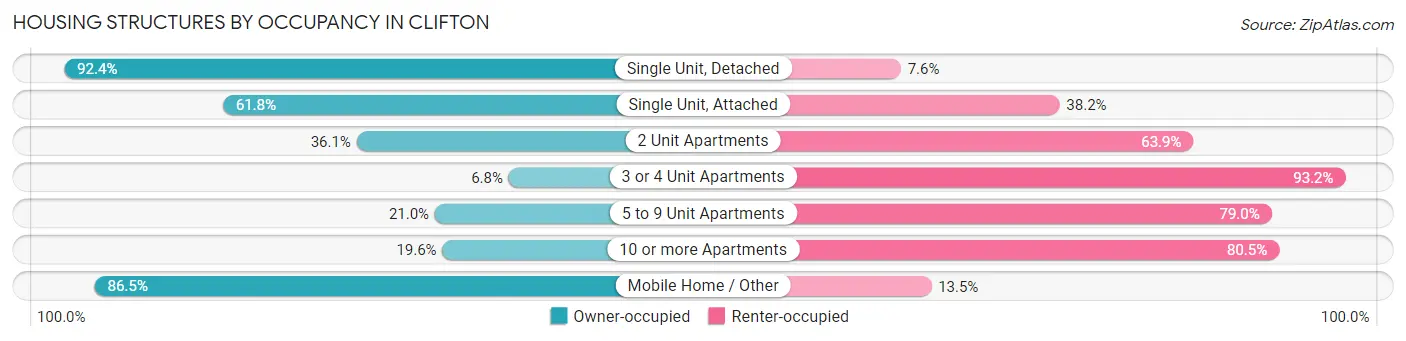
| Structure Type | Owner-occupied | Renter-occupied |
| Single Unit, Detached | 13,335 (92.4%) | 1,100 (7.6%) |
| Single Unit, Attached | 1,388 (61.8%) | 857 (38.2%) |
| 2 Unit Apartments | 2,697 (36.1%) | 4,783 (63.9%) |
| 3 or 4 Unit Apartments | 201 (6.8%) | 2,764 (93.2%) |
| 5 to 9 Unit Apartments | 352 (21.0%) | 1,325 (79.0%) |
| 10 or more Apartments | 733 (19.6%) | 3,016 (80.4%) |
| Mobile Home / Other | 77 (86.5%) | 12 (13.5%) |
| Total | 18,783 (57.6%) | 13,857 (42.4%) |
Housing Structures by Number of Rooms in Clifton
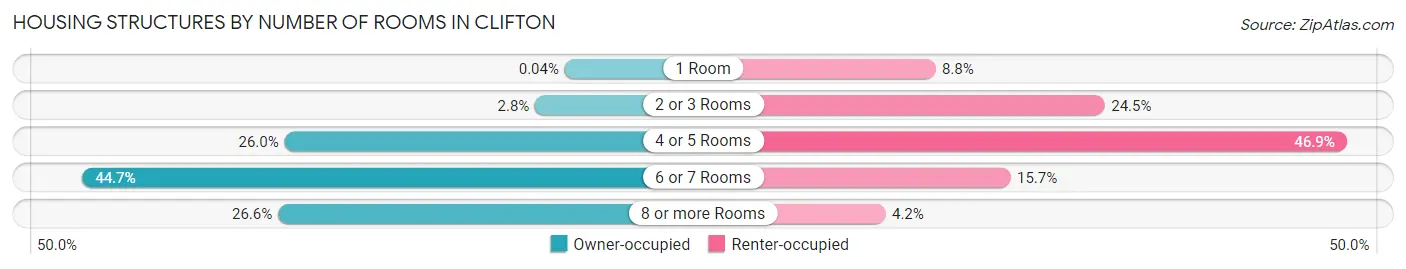
| Number of Rooms | Owner-occupied | Renter-occupied |
| 1 Room | 7 (0.0%) | 1,218 (8.8%) |
| 2 or 3 Rooms | 522 (2.8%) | 3,388 (24.4%) |
| 4 or 5 Rooms | 4,876 (26.0%) | 6,493 (46.9%) |
| 6 or 7 Rooms | 8,389 (44.7%) | 2,180 (15.7%) |
| 8 or more Rooms | 4,989 (26.6%) | 578 (4.2%) |
| Total | 18,783 (100.0%) | 13,857 (100.0%) |
Housing Structure by Heating Type in Clifton
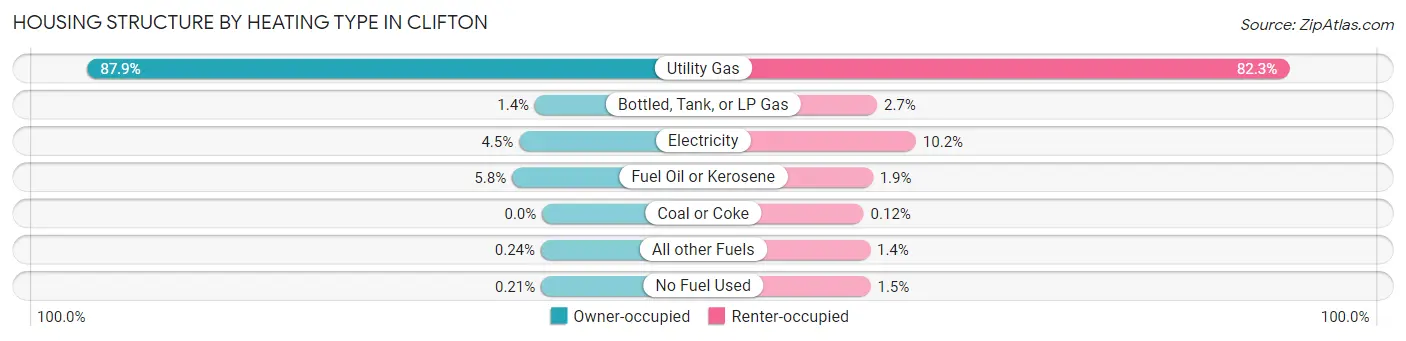
| Heating Type | Owner-occupied | Renter-occupied |
| Utility Gas | 16,505 (87.9%) | 11,404 (82.3%) |
| Bottled, Tank, or LP Gas | 262 (1.4%) | 374 (2.7%) |
| Electricity | 836 (4.4%) | 1,416 (10.2%) |
| Fuel Oil or Kerosene | 1,094 (5.8%) | 259 (1.9%) |
| Coal or Coke | 0 (0.0%) | 16 (0.1%) |
| All other Fuels | 46 (0.2%) | 187 (1.3%) |
| No Fuel Used | 40 (0.2%) | 201 (1.5%) |
| Total | 18,783 (100.0%) | 13,857 (100.0%) |
Household Vehicle Usage in Clifton
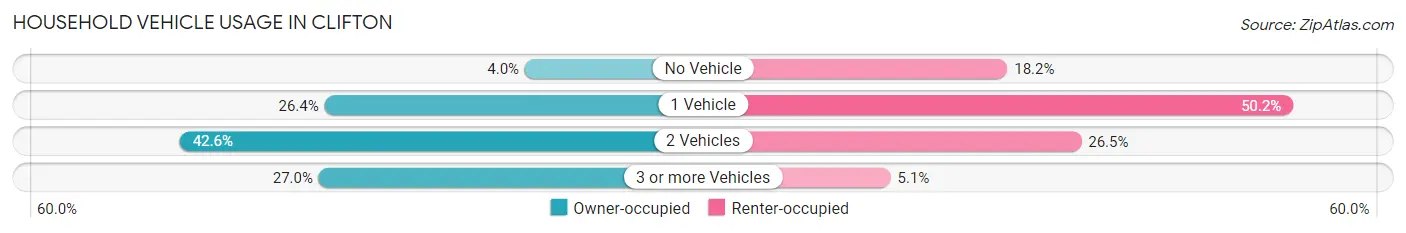
| Vehicles per Household | Owner-occupied | Renter-occupied |
| No Vehicle | 742 (4.0%) | 2,520 (18.2%) |
| 1 Vehicle | 4,958 (26.4%) | 6,958 (50.2%) |
| 2 Vehicles | 8,005 (42.6%) | 3,670 (26.5%) |
| 3 or more Vehicles | 5,078 (27.0%) | 709 (5.1%) |
| Total | 18,783 (100.0%) | 13,857 (100.0%) |
Real Estate & Mortgages in Clifton
Real Estate and Mortgage Overview in Clifton
| Characteristic | Without Mortgage | With Mortgage |
| Housing Units | 7,124 | 11,659 |
| Median Property Value | $414,700 | $437,200 |
| Median Household Income | $100,184 | $5,202 |
| Monthly Housing Costs | $1,244 | $5,144 |
| Real Estate Taxes | $10,001 | $159 |
Property Value by Mortgage Status in Clifton
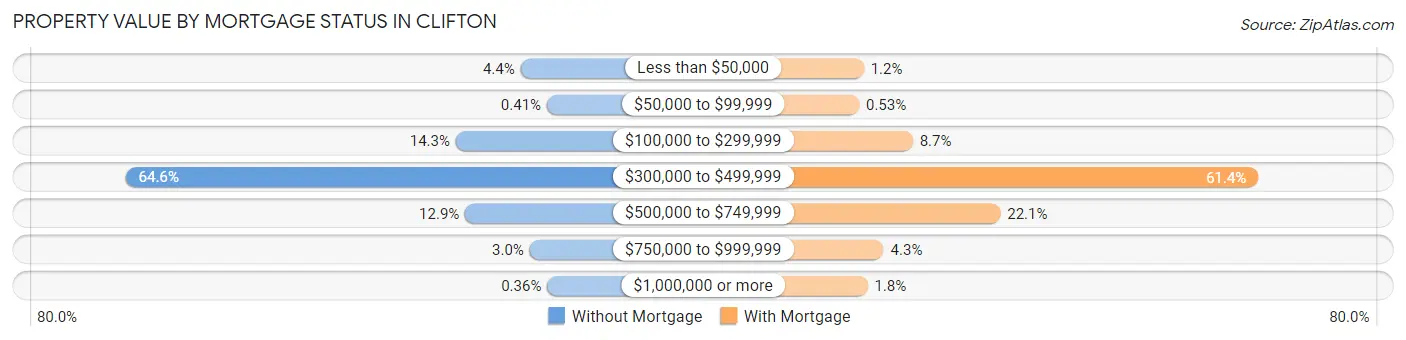
| Property Value | Without Mortgage | With Mortgage |
| Less than $50,000 | 315 (4.4%) | 145 (1.2%) |
| $50,000 to $99,999 | 29 (0.4%) | 62 (0.5%) |
| $100,000 to $299,999 | 1,019 (14.3%) | 1,016 (8.7%) |
| $300,000 to $499,999 | 4,602 (64.6%) | 7,153 (61.4%) |
| $500,000 to $749,999 | 917 (12.9%) | 2,572 (22.1%) |
| $750,000 to $999,999 | 216 (3.0%) | 499 (4.3%) |
| $1,000,000 or more | 26 (0.4%) | 212 (1.8%) |
| Total | 7,124 (100.0%) | 11,659 (100.0%) |
Household Income by Mortgage Status in Clifton
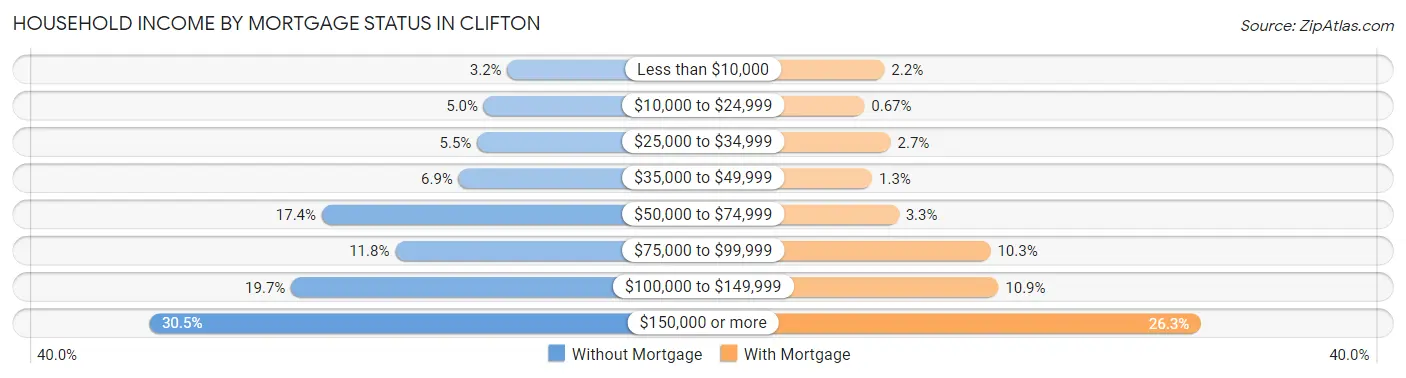
| Household Income | Without Mortgage | With Mortgage |
| Less than $10,000 | 229 (3.2%) | 256 (2.2%) |
| $10,000 to $24,999 | 357 (5.0%) | 78 (0.7%) |
| $25,000 to $34,999 | 393 (5.5%) | 311 (2.7%) |
| $35,000 to $49,999 | 494 (6.9%) | 147 (1.3%) |
| $50,000 to $74,999 | 1,236 (17.3%) | 384 (3.3%) |
| $75,000 to $99,999 | 838 (11.8%) | 1,198 (10.3%) |
| $100,000 to $149,999 | 1,403 (19.7%) | 1,269 (10.9%) |
| $150,000 or more | 2,174 (30.5%) | 3,070 (26.3%) |
| Total | 7,124 (100.0%) | 11,659 (100.0%) |
Property Value to Household Income Ratio in Clifton
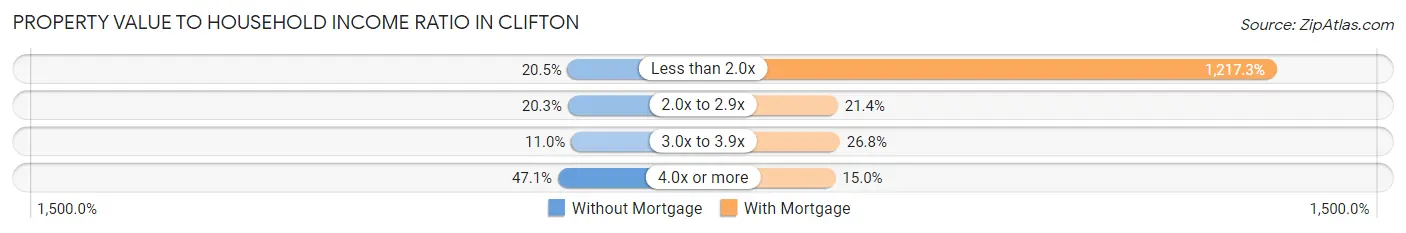
| Value-to-Income Ratio | Without Mortgage | With Mortgage |
| Less than 2.0x | 1,460 (20.5%) | 141,924 (1,217.3%) |
| 2.0x to 2.9x | 1,444 (20.3%) | 2,489 (21.3%) |
| 3.0x to 3.9x | 786 (11.0%) | 3,127 (26.8%) |
| 4.0x or more | 3,356 (47.1%) | 1,745 (15.0%) |
| Total | 7,124 (100.0%) | 11,659 (100.0%) |
Real Estate Taxes by Mortgage Status in Clifton
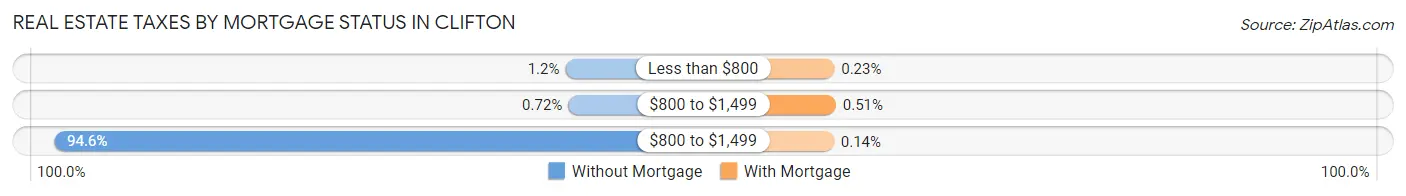
| Property Taxes | Without Mortgage | With Mortgage |
| Less than $800 | 88 (1.2%) | 27 (0.2%) |
| $800 to $1,499 | 51 (0.7%) | 60 (0.5%) |
| $800 to $1,499 | 6,739 (94.6%) | 16 (0.1%) |
| Total | 7,124 (100.0%) | 11,659 (100.0%) |
Health & Disability in Clifton
Health Insurance Coverage by Age in Clifton
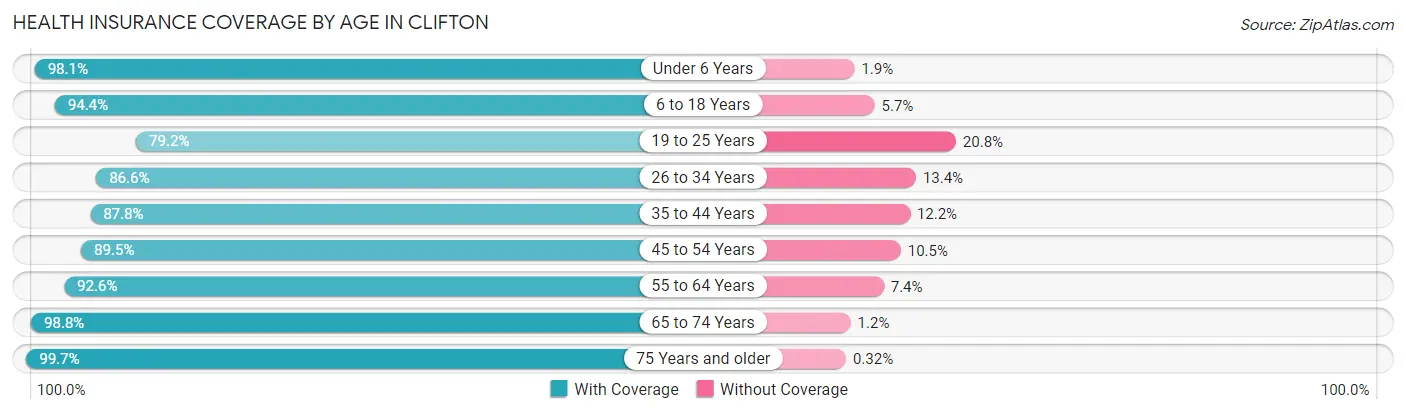
| Age Bracket | With Coverage | Without Coverage |
| Under 6 Years | 5,738 (98.1%) | 111 (1.9%) |
| 6 to 18 Years | 12,045 (94.4%) | 721 (5.7%) |
| 19 to 25 Years | 6,165 (79.2%) | 1,620 (20.8%) |
| 26 to 34 Years | 10,306 (86.6%) | 1,589 (13.4%) |
| 35 to 44 Years | 10,451 (87.8%) | 1,457 (12.2%) |
| 45 to 54 Years | 9,440 (89.5%) | 1,111 (10.5%) |
| 55 to 64 Years | 12,038 (92.6%) | 956 (7.4%) |
| 65 to 74 Years | 9,045 (98.8%) | 109 (1.2%) |
| 75 Years and older | 6,326 (99.7%) | 20 (0.3%) |
| Total | 81,554 (91.4%) | 7,694 (8.6%) |
Health Insurance Coverage by Citizenship Status in Clifton
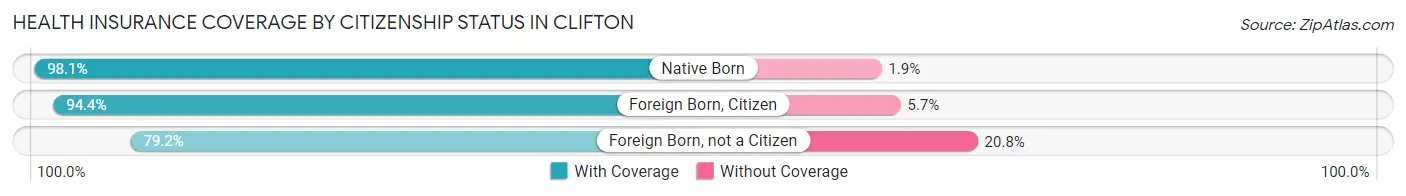
| Citizenship Status | With Coverage | Without Coverage |
| Native Born | 5,738 (98.1%) | 111 (1.9%) |
| Foreign Born, Citizen | 12,045 (94.4%) | 721 (5.7%) |
| Foreign Born, not a Citizen | 6,165 (79.2%) | 1,620 (20.8%) |
Health Insurance Coverage by Household Income in Clifton
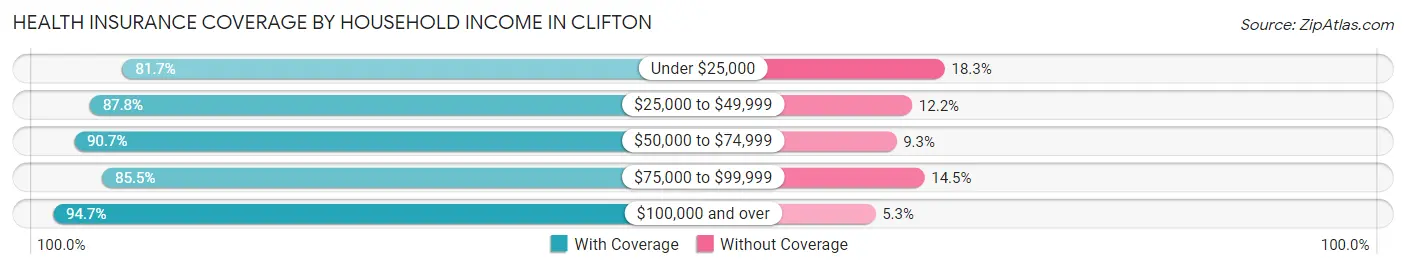
| Household Income | With Coverage | Without Coverage |
| Under $25,000 | 5,652 (81.7%) | 1,268 (18.3%) |
| $25,000 to $49,999 | 8,867 (87.8%) | 1,232 (12.2%) |
| $50,000 to $74,999 | 10,142 (90.7%) | 1,035 (9.3%) |
| $75,000 to $99,999 | 8,245 (85.5%) | 1,400 (14.5%) |
| $100,000 and over | 48,274 (94.7%) | 2,718 (5.3%) |
Public vs Private Health Insurance Coverage by Age in Clifton
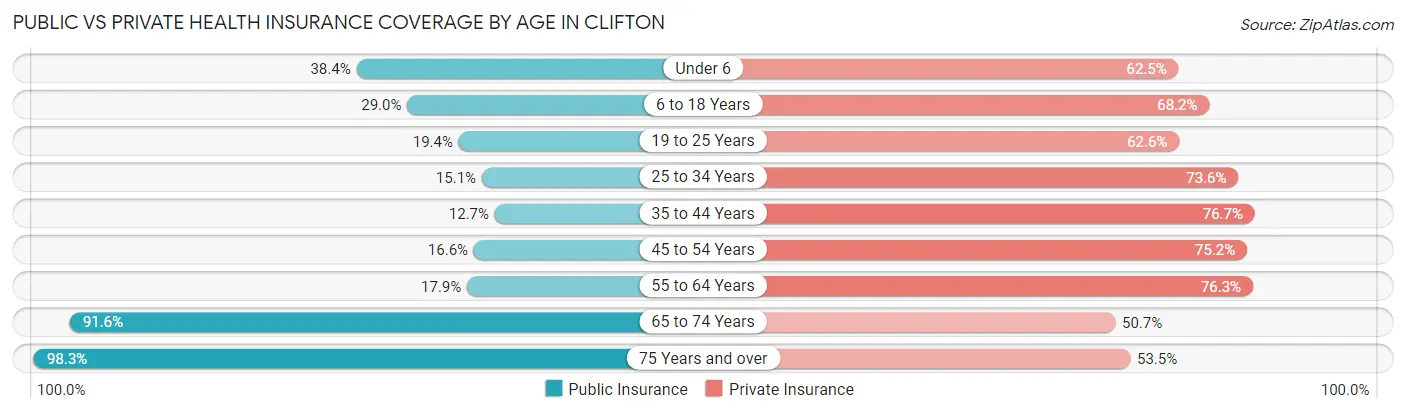
| Age Bracket | Public Insurance | Private Insurance |
| Under 6 | 2,246 (38.4%) | 3,656 (62.5%) |
| 6 to 18 Years | 3,697 (29.0%) | 8,708 (68.2%) |
| 19 to 25 Years | 1,510 (19.4%) | 4,875 (62.6%) |
| 25 to 34 Years | 1,798 (15.1%) | 8,754 (73.6%) |
| 35 to 44 Years | 1,513 (12.7%) | 9,127 (76.6%) |
| 45 to 54 Years | 1,751 (16.6%) | 7,938 (75.2%) |
| 55 to 64 Years | 2,321 (17.9%) | 9,916 (76.3%) |
| 65 to 74 Years | 8,385 (91.6%) | 4,644 (50.7%) |
| 75 Years and over | 6,236 (98.3%) | 3,395 (53.5%) |
| Total | 29,457 (33.0%) | 61,013 (68.4%) |
Disability Status by Sex by Age in Clifton
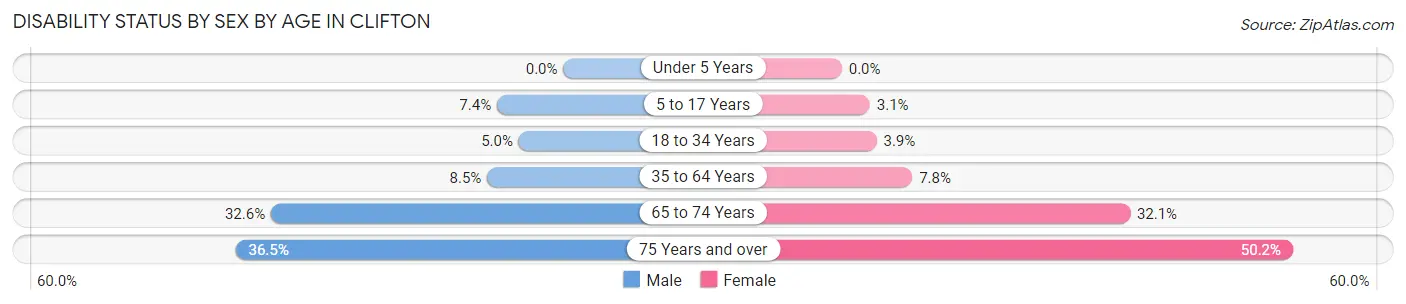
| Age Bracket | Male | Female |
| Under 5 Years | 0 (0.0%) | 0 (0.0%) |
| 5 to 17 Years | 471 (7.4%) | 198 (3.1%) |
| 18 to 34 Years | 513 (5.0%) | 401 (3.9%) |
| 35 to 64 Years | 1,531 (8.5%) | 1,365 (7.8%) |
| 65 to 74 Years | 1,301 (32.6%) | 1,655 (32.1%) |
| 75 Years and over | 868 (36.5%) | 1,993 (50.2%) |
Disability Class by Sex by Age in Clifton
Disability Class: Hearing Difficulty
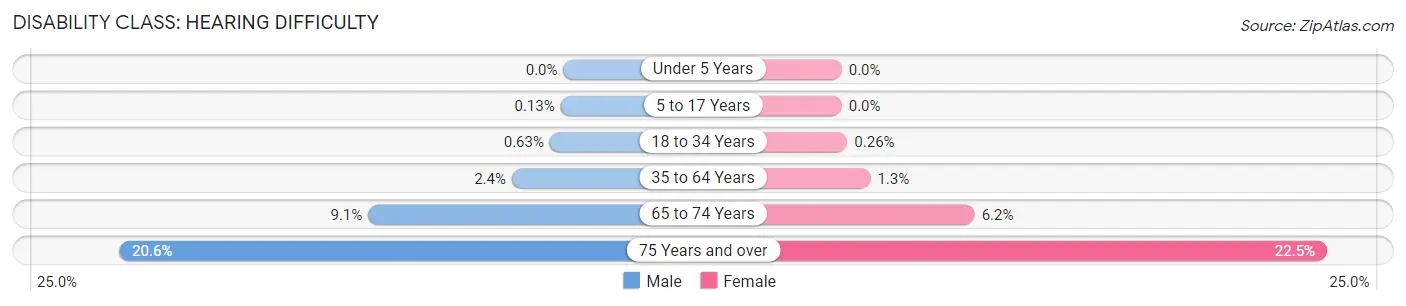
| Age Bracket | Male | Female |
| Under 5 Years | 0 (0.0%) | 0 (0.0%) |
| 5 to 17 Years | 8 (0.1%) | 0 (0.0%) |
| 18 to 34 Years | 65 (0.6%) | 27 (0.3%) |
| 35 to 64 Years | 431 (2.4%) | 232 (1.3%) |
| 65 to 74 Years | 362 (9.1%) | 318 (6.2%) |
| 75 Years and over | 490 (20.6%) | 893 (22.5%) |
Disability Class: Vision Difficulty
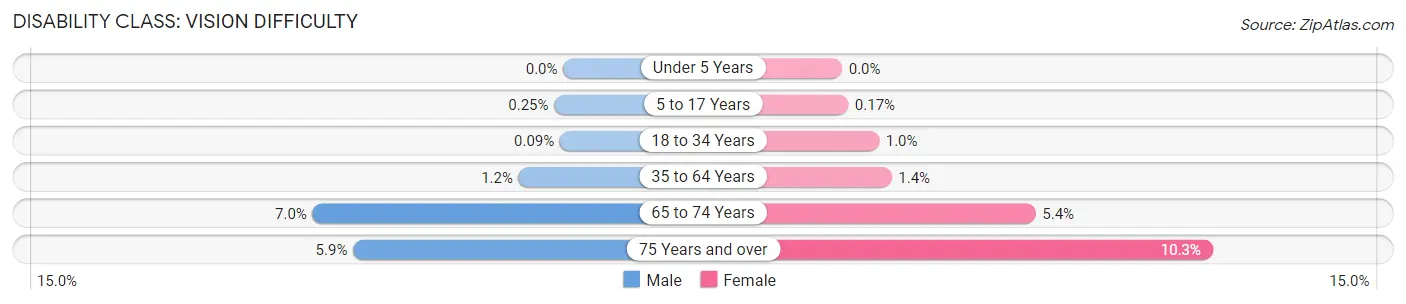
| Age Bracket | Male | Female |
| Under 5 Years | 0 (0.0%) | 0 (0.0%) |
| 5 to 17 Years | 16 (0.3%) | 11 (0.2%) |
| 18 to 34 Years | 9 (0.1%) | 107 (1.0%) |
| 35 to 64 Years | 223 (1.2%) | 241 (1.4%) |
| 65 to 74 Years | 279 (7.0%) | 278 (5.4%) |
| 75 Years and over | 139 (5.9%) | 410 (10.3%) |
Disability Class: Cognitive Difficulty
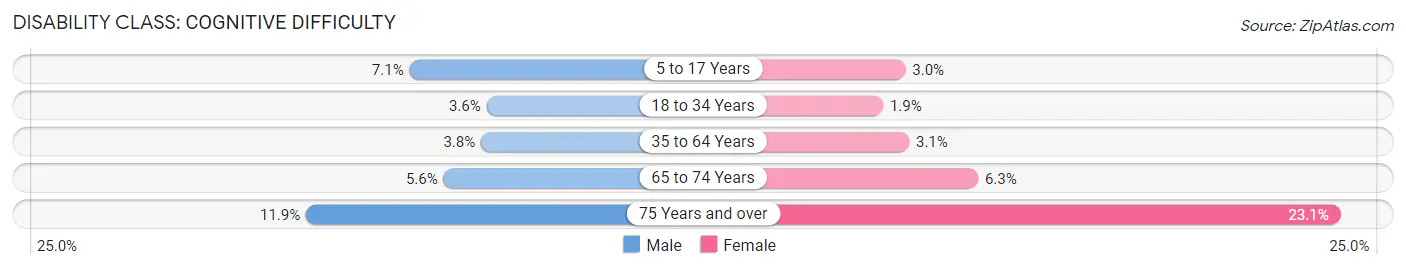
| Age Bracket | Male | Female |
| 5 to 17 Years | 455 (7.1%) | 187 (2.9%) |
| 18 to 34 Years | 368 (3.6%) | 198 (1.9%) |
| 35 to 64 Years | 690 (3.8%) | 544 (3.1%) |
| 65 to 74 Years | 222 (5.6%) | 326 (6.3%) |
| 75 Years and over | 284 (11.9%) | 918 (23.1%) |
Disability Class: Ambulatory Difficulty
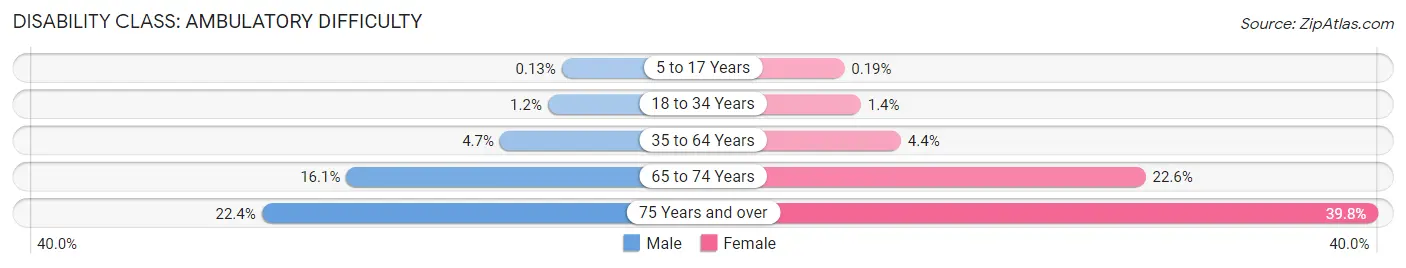
| Age Bracket | Male | Female |
| 5 to 17 Years | 8 (0.1%) | 12 (0.2%) |
| 18 to 34 Years | 120 (1.2%) | 146 (1.4%) |
| 35 to 64 Years | 852 (4.7%) | 764 (4.4%) |
| 65 to 74 Years | 644 (16.1%) | 1,163 (22.6%) |
| 75 Years and over | 533 (22.4%) | 1,580 (39.8%) |
Disability Class: Self-Care Difficulty
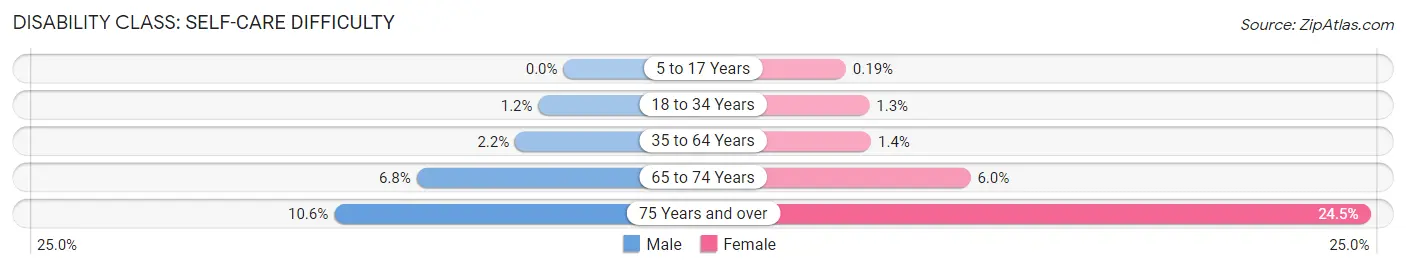
| Age Bracket | Male | Female |
| 5 to 17 Years | 0 (0.0%) | 12 (0.2%) |
| 18 to 34 Years | 120 (1.2%) | 133 (1.3%) |
| 35 to 64 Years | 405 (2.2%) | 236 (1.4%) |
| 65 to 74 Years | 272 (6.8%) | 308 (6.0%) |
| 75 Years and over | 253 (10.6%) | 973 (24.5%) |
Technology Access in Clifton
Computing Device Access in Clifton
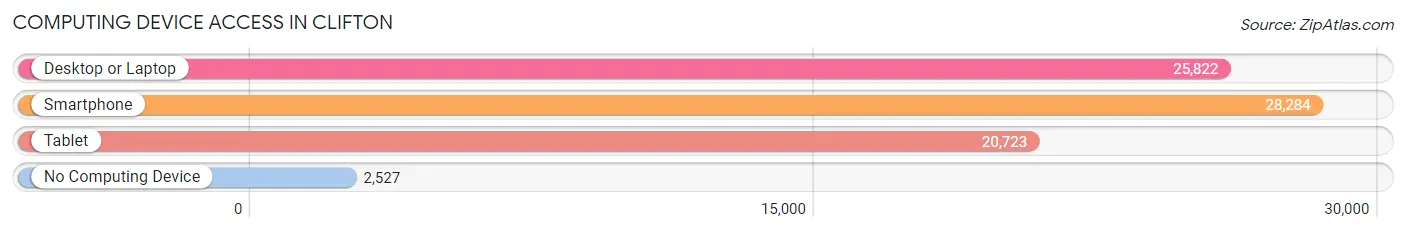
| Device Type | # Households | % Households |
| Desktop or Laptop | 25,822 | 79.1% |
| Smartphone | 28,284 | 86.7% |
| Tablet | 20,723 | 63.5% |
| No Computing Device | 2,527 | 7.7% |
| Total | 32,640 | 100.0% |
Internet Access in Clifton
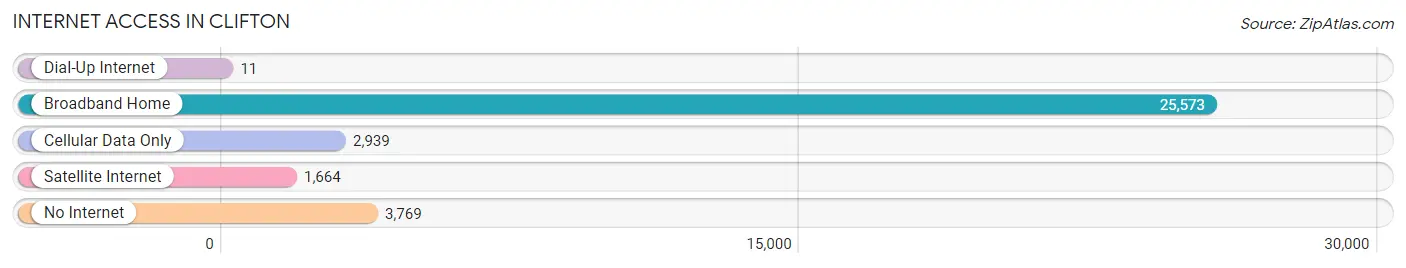
| Internet Type | # Households | % Households |
| Dial-Up Internet | 11 | 0.0% |
| Broadband Home | 25,573 | 78.3% |
| Cellular Data Only | 2,939 | 9.0% |
| Satellite Internet | 1,664 | 5.1% |
| No Internet | 3,769 | 11.6% |
| Total | 32,640 | 100.0% |
Clifton Summary
Clifton, New Jersey is a city located in Passaic County, New Jersey. It is situated 8 miles west of New York City and is part of the New York metropolitan area. As of the 2010 United States Census, the city had a total population of 84,136, making it the 11th largest municipality in New Jersey.
History
Clifton was originally formed as a township on April 14, 1917, from portions of Acquackanonk Township and the now-defunct Manchester Township. Clifton was incorporated as a city by an Act of the New Jersey Legislature on April 26, 1917, replacing Acquackanonk Township, based on the results of a referendum held on May 8, 1917. Clifton is named after a nearby cliff and was first settled in the early 1700s by Dutch and English settlers.
Geography
Clifton is located at 40°52'45" North, 74°09'38" West (40.879167, -74.160556). According to the United States Census Bureau, the city has a total area of 11.4 square miles, of which 11.2 square miles is land and 0.2 square miles is water. Clifton is bordered by the Passaic River to the north, the city of Paterson to the south, and the cities of Passaic and Nutley to the east.
Economy
Clifton is home to a variety of businesses, including manufacturing, retail, and service industries. The city is also home to several large employers, including Clifton Savings Bank, St. Joseph's Regional Medical Center, and the Clifton Public Schools. The city also has a number of small businesses, including restaurants, shops, and professional services.
Demographics
As of the 2010 United States Census, there were 84,136 people, 32,845 households, and 21,845 families residing in the city. The population density was 7,478.3 per square mile. The racial makeup of the city was 64.2% White, 11.2% African American, 0.2% Native American, 8.3% Asian, 0.1% Pacific Islander, 13.2% from other races, and 3.0% from two or more races. Hispanic or Latino of any race were 28.9% of the population.
Out of the 32,845 households, 33.2% had children under the age of 18 living with them, 45.2% were married couples living together, 15.7% had a female householder with no husband present, and 33.2% were non-families. 27.2% of all households were made up of individuals, and 11.2% had someone living alone who was 65 years of age or older. The average household size was 2.58 and the average family size was 3.17.
In the city, the population was spread out, with 24.2% under the age of 18, 8.7% from 18 to 24, 30.2% from 25 to 44, 22.3% from 45 to 64, and 14.6% who were 65 years of age or older. The median age was 37 years. For every 100 females, there were 93.2 males. For every 100 females age 18 and over, there were 89.7 males.
The median income for a household in the city was $50,945, and the median income for a family was $60,872. Males had a median income of $41,945 versus $35,836 for females. The per capita income for the city was $24,921. About 6.2% of families and 8.3% of the population were below the poverty line, including 11.2% of those under age 18 and 8.2% of those age 65 or over.
Common Questions
What is Per Capita Income in Clifton?
Per Capita income in Clifton is $42,701.
What is the Median Family Income in Clifton?
Median Family Income in Clifton is $109,153.
What is the Median Household income in Clifton?
Median Household Income in Clifton is $94,179.
What is Income or Wage Gap in Clifton?
Income or Wage Gap in Clifton is 30.9%.
Women in Clifton earn 69.1 cents for every dollar earned by a man.
What is Family Income Deficit in Clifton?
Family Income Deficit in Clifton is $11,243.
Families that are below poverty line in Clifton earn $11,243 less on average than the poverty threshold level.
What is Inequality or Gini Index in Clifton?
Inequality or Gini Index in Clifton is 0.43.
What is the Total Population of Clifton?
Total Population of Clifton is 89,451.
What is the Total Male Population of Clifton?
Total Male Population of Clifton is 43,516.
What is the Total Female Population of Clifton?
Total Female Population of Clifton is 45,935.
What is the Ratio of Males per 100 Females in Clifton?
There are 94.73 Males per 100 Females in Clifton.
What is the Ratio of Females per 100 Males in Clifton?
There are 105.56 Females per 100 Males in Clifton.
What is the Median Population Age in Clifton?
Median Population Age in Clifton is 40.2 Years.
What is the Average Family Size in Clifton
Average Family Size in Clifton is 3.3 People.
What is the Average Household Size in Clifton
Average Household Size in Clifton is 2.7 People.
How Large is the Labor Force in Clifton?
There are 50,356 People in the Labor Forcein in Clifton.
What is the Percentage of People in the Labor Force in Clifton?
68.6% of People are in the Labor Force in Clifton.
What is the Unemployment Rate in Clifton?
Unemployment Rate in Clifton is 6.4%.