Linden, NJ Map & Demographics
Linden Map
Linden Overview
$36,207
PER CAPITA INCOME
$95,897
AVG FAMILY INCOME
$86,801
AVG HOUSEHOLD INCOME
34.2%
WAGE / INCOME GAP [ % ]
65.8¢/ $1
WAGE / INCOME GAP [ $ ]
$10,628
FAMILY INCOME DEFICIT
0.38
INEQUALITY / GINI INDEX
43,478
TOTAL POPULATION
21,332
MALE POPULATION
22,146
FEMALE POPULATION
96.32
MALES / 100 FEMALES
103.82
FEMALES / 100 MALES
40.0
MEDIAN AGE
3.4
AVG FAMILY SIZE
2.8
AVG HOUSEHOLD SIZE
24,725
LABOR FORCE [ PEOPLE ]
70.1%
PERCENT IN LABOR FORCE
7.9%
UNEMPLOYMENT RATE
Linden Zip Codes
Linden Area Codes
Income in Linden
Income Overview in Linden
Per Capita Income in Linden is $36,207, while median incomes of families and households are $95,897 and $86,801 respectively.
| Characteristic | Number | Measure |
| Per Capita Income | 43,478 | $36,207 |
| Median Family Income | 10,782 | $95,897 |
| Mean Family Income | 10,782 | $110,009 |
| Median Household Income | 15,219 | $86,801 |
| Mean Household Income | 15,219 | $101,356 |
| Income Deficit | 10,782 | $10,628 |
| Wage / Income Gap (%) | 43,478 | 34.18% |
| Wage / Income Gap ($) | 43,478 | 65.82¢ per $1 |
| Gini / Inequality Index | 43,478 | 0.38 |
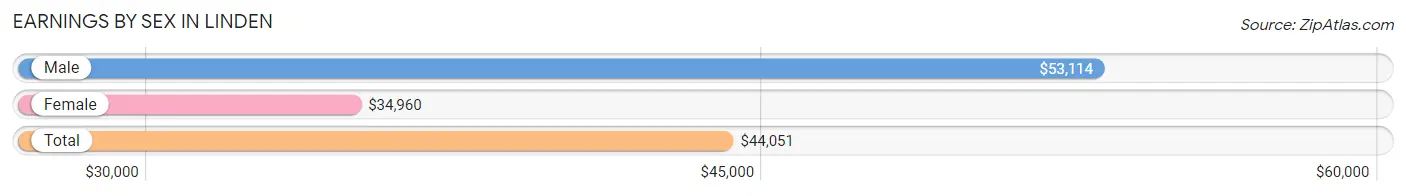
Earnings by Sex in Linden
Average Earnings in Linden are $44,051, $53,114 for men and $34,960 for women, a difference of 34.2%.
| Sex | Number | Average Earnings |
| Male | 12,849 (51.9%) | $53,114 |
| Female | 11,911 (48.1%) | $34,960 |
| Total | 24,760 (100.0%) | $44,051 |
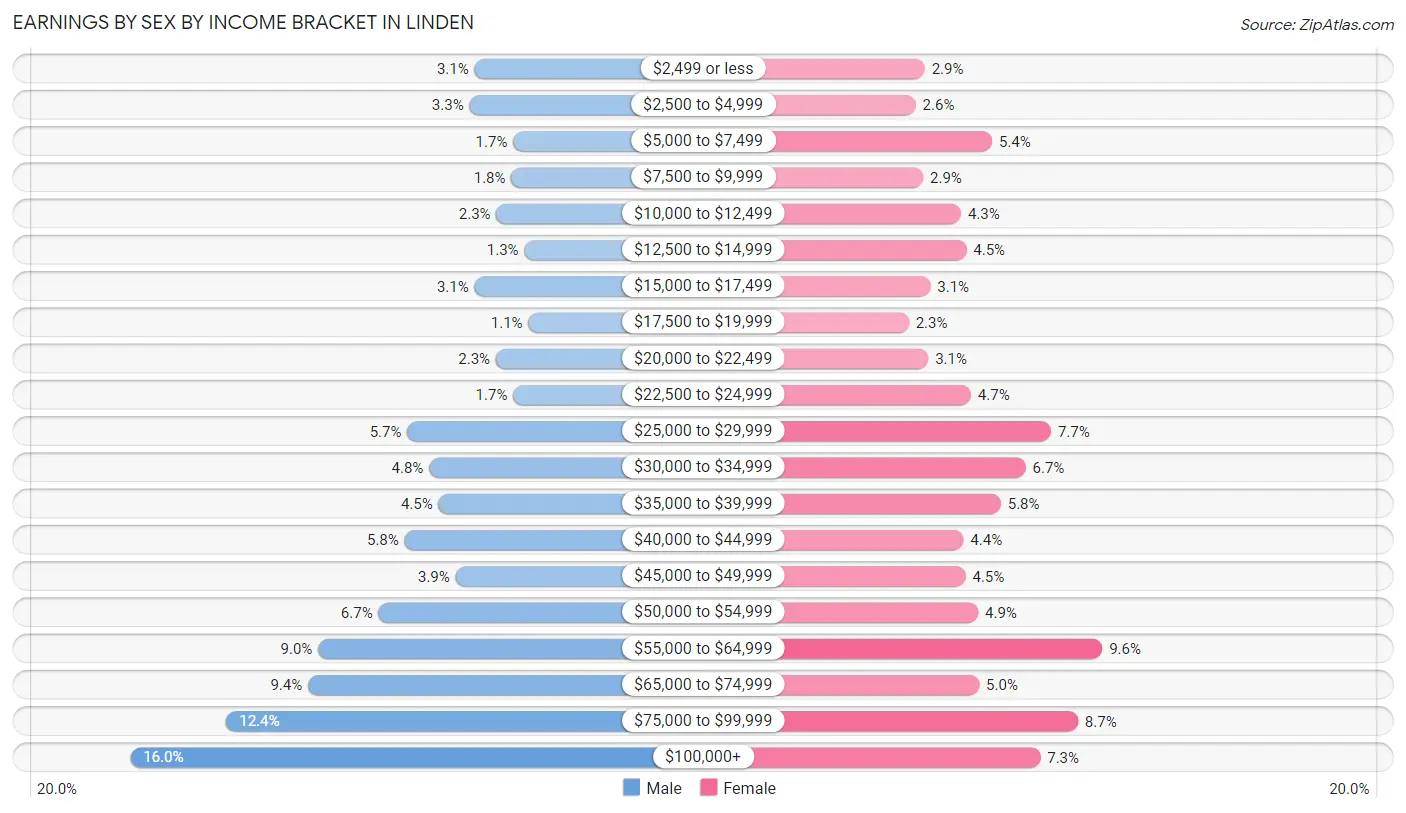
Earnings by Sex by Income Bracket in Linden
The most common earnings brackets in Linden are $100,000+ for men (2,061 | 16.0%) and $55,000 to $64,999 for women (1,140 | 9.6%).
| Income | Male | Female |
| $2,499 or less | 404 (3.1%) | 348 (2.9%) |
| $2,500 to $4,999 | 428 (3.3%) | 307 (2.6%) |
| $5,000 to $7,499 | 217 (1.7%) | 648 (5.4%) |
| $7,500 to $9,999 | 226 (1.8%) | 341 (2.9%) |
| $10,000 to $12,499 | 298 (2.3%) | 510 (4.3%) |
| $12,500 to $14,999 | 163 (1.3%) | 534 (4.5%) |
| $15,000 to $17,499 | 403 (3.1%) | 373 (3.1%) |
| $17,500 to $19,999 | 144 (1.1%) | 276 (2.3%) |
| $20,000 to $22,499 | 301 (2.3%) | 363 (3.0%) |
| $22,500 to $24,999 | 217 (1.7%) | 554 (4.6%) |
| $25,000 to $29,999 | 727 (5.7%) | 911 (7.6%) |
| $30,000 to $34,999 | 622 (4.8%) | 798 (6.7%) |
| $35,000 to $39,999 | 577 (4.5%) | 687 (5.8%) |
| $40,000 to $44,999 | 740 (5.8%) | 520 (4.4%) |
| $45,000 to $49,999 | 495 (3.8%) | 530 (4.4%) |
| $50,000 to $54,999 | 866 (6.7%) | 586 (4.9%) |
| $55,000 to $64,999 | 1,157 (9.0%) | 1,140 (9.6%) |
| $65,000 to $74,999 | 1,205 (9.4%) | 591 (5.0%) |
| $75,000 to $99,999 | 1,598 (12.4%) | 1,031 (8.7%) |
| $100,000+ | 2,061 (16.0%) | 863 (7.2%) |
| Total | 12,849 (100.0%) | 11,911 (100.0%) |
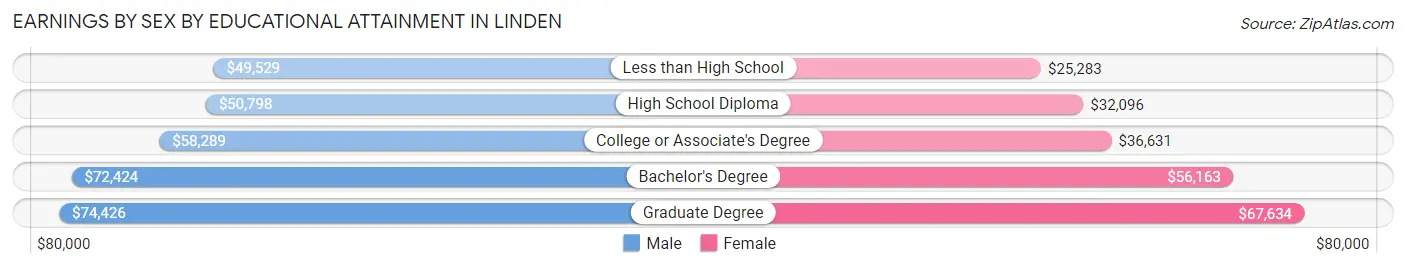
Earnings by Sex by Educational Attainment in Linden
Average earnings in Linden are $56,014 for men and $39,946 for women, a difference of 28.7%. Men with an educational attainment of graduate degree enjoy the highest average annual earnings of $74,426, while those with less than high school education earn the least with $49,529. Women with an educational attainment of graduate degree earn the most with the average annual earnings of $67,634, while those with less than high school education have the smallest earnings of $25,283.
| Educational Attainment | Male Income | Female Income |
| Less than High School | $49,529 | $25,283 |
| High School Diploma | $50,798 | $32,096 |
| College or Associate's Degree | $58,289 | $36,631 |
| Bachelor's Degree | $72,424 | $56,163 |
| Graduate Degree | $74,426 | $67,634 |
| Total | $56,014 | $39,946 |
Family Income in Linden
Family Income Brackets in Linden
According to the Linden family income data, there are 2,480 families falling into the $100,000 to $149,999 income range, which is the most common income bracket and makes up 23.0% of all families. Conversely, the $10,000 to $14,999 income bracket is the least frequent group with only 129 families (1.2%) belonging to this category.
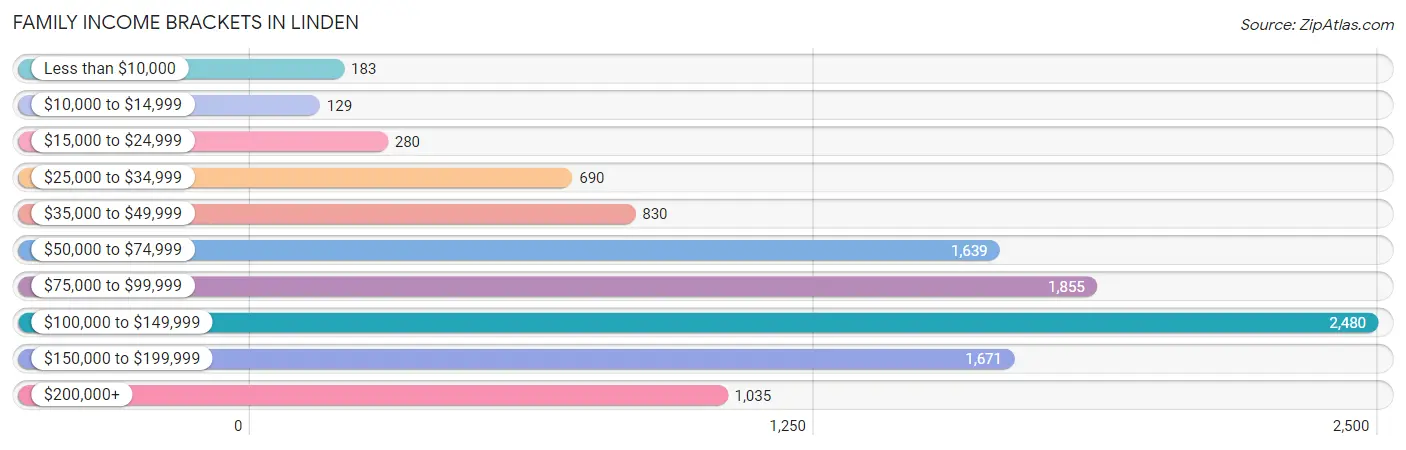
| Income Bracket | # Families | % Families |
| Less than $10,000 | 183 | 1.7% |
| $10,000 to $14,999 | 129 | 1.2% |
| $15,000 to $24,999 | 280 | 2.6% |
| $25,000 to $34,999 | 690 | 6.4% |
| $35,000 to $49,999 | 830 | 7.7% |
| $50,000 to $74,999 | 1,639 | 15.2% |
| $75,000 to $99,999 | 1,855 | 17.2% |
| $100,000 to $149,999 | 2,480 | 23.0% |
| $150,000 to $199,999 | 1,671 | 15.5% |
| $200,000+ | 1,035 | 9.6% |
Family Income by Famaliy Size in Linden
7+ person families (212 | 2.0%) account for the highest median family income in Linden with $179,444 per family, while 2-person families (3,570 | 33.1%) have the highest median income of $39,552 per family member.
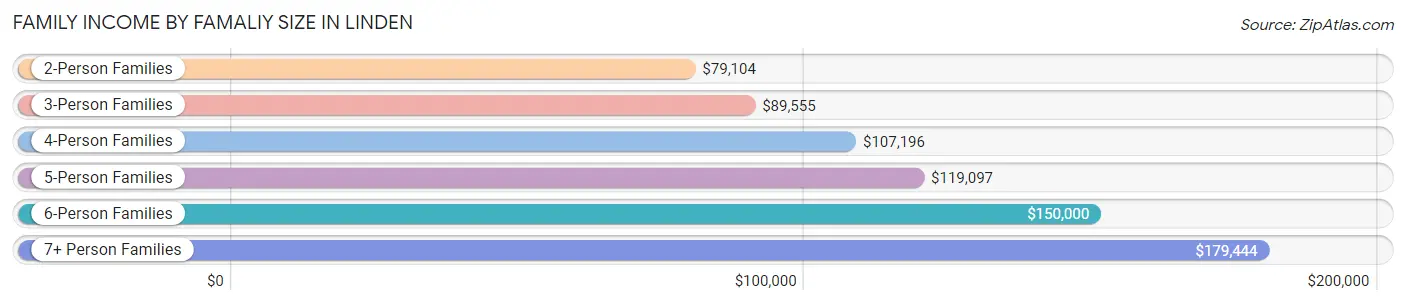
| Income Bracket | # Families | Median Income |
| 2-Person Families | 3,570 (33.1%) | $79,104 |
| 3-Person Families | 2,909 (27.0%) | $89,555 |
| 4-Person Families | 2,560 (23.7%) | $107,196 |
| 5-Person Families | 1,179 (10.9%) | $119,097 |
| 6-Person Families | 352 (3.3%) | $150,000 |
| 7+ Person Families | 212 (2.0%) | $179,444 |
| Total | 10,782 (100.0%) | $95,897 |
Family Income by Number of Earners in Linden
The median family income in Linden is $95,897, with families comprising 3+ earners (2,048) having the highest median family income of $145,069, while families with no earners (916) have the lowest median family income of $48,714, accounting for 19.0% and 8.5% of families, respectively.
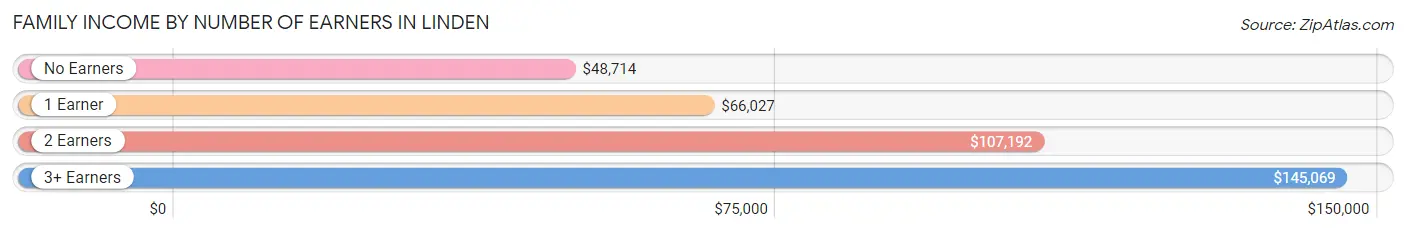
| Number of Earners | # Families | Median Income |
| No Earners | 916 (8.5%) | $48,714 |
| 1 Earner | 3,017 (28.0%) | $66,027 |
| 2 Earners | 4,801 (44.5%) | $107,192 |
| 3+ Earners | 2,048 (19.0%) | $145,069 |
| Total | 10,782 (100.0%) | $95,897 |
Household Income in Linden
Household Income Brackets in Linden
With 2,937 households falling in the category, the $100,000 to $149,999 income range is the most frequent in Linden, accounting for 19.3% of all households. In contrast, only 350 households (2.3%) fall into the $10,000 to $14,999 income bracket, making it the least populous group.
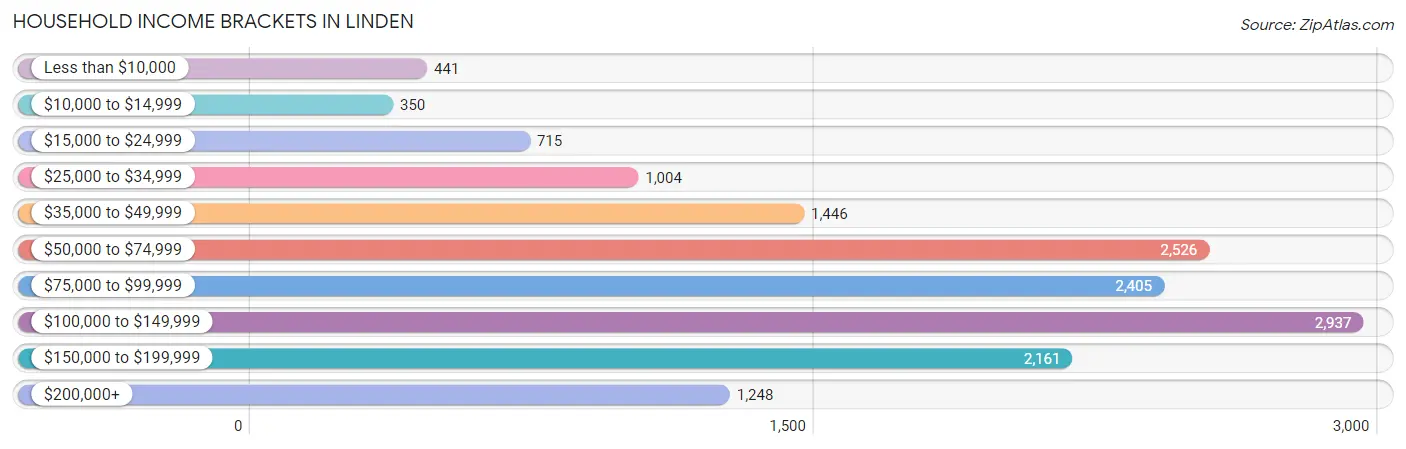
| Income Bracket | # Households | % Households |
| Less than $10,000 | 441 | 2.9% |
| $10,000 to $14,999 | 350 | 2.3% |
| $15,000 to $24,999 | 715 | 4.7% |
| $25,000 to $34,999 | 1,004 | 6.6% |
| $35,000 to $49,999 | 1,446 | 9.5% |
| $50,000 to $74,999 | 2,526 | 16.6% |
| $75,000 to $99,999 | 2,405 | 15.8% |
| $100,000 to $149,999 | 2,937 | 19.3% |
| $150,000 to $199,999 | 2,161 | 14.2% |
| $200,000+ | 1,248 | 8.2% |
Household Income by Householder Age in Linden
The median household income in Linden is $86,801, with the highest median household income of $96,313 found in the 45 to 64 years age bracket for the primary householder. A total of 6,655 households (43.7%) fall into this category. Meanwhile, the 65+ years age bracket for the primary householder has the lowest median household income of $60,682, with 3,512 households (23.1%) in this group.
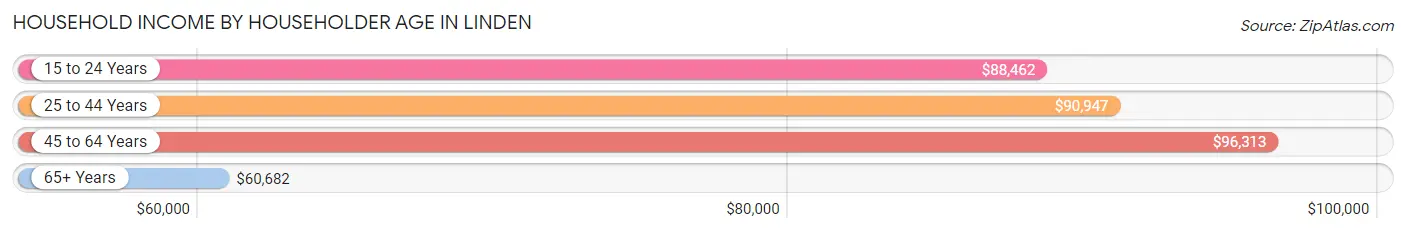
| Income Bracket | # Households | Median Income |
| 15 to 24 Years | 128 (0.8%) | $88,462 |
| 25 to 44 Years | 4,924 (32.4%) | $90,947 |
| 45 to 64 Years | 6,655 (43.7%) | $96,313 |
| 65+ Years | 3,512 (23.1%) | $60,682 |
| Total | 15,219 (100.0%) | $86,801 |
Poverty in Linden
Income Below Poverty by Sex and Age in Linden
With 6.4% poverty level for males and 9.6% for females among the residents of Linden, 5 year old males and 5 year old females are the most vulnerable to poverty, with 79 males (36.9%) and 66 females (22.2%) in their respective age groups living below the poverty level.
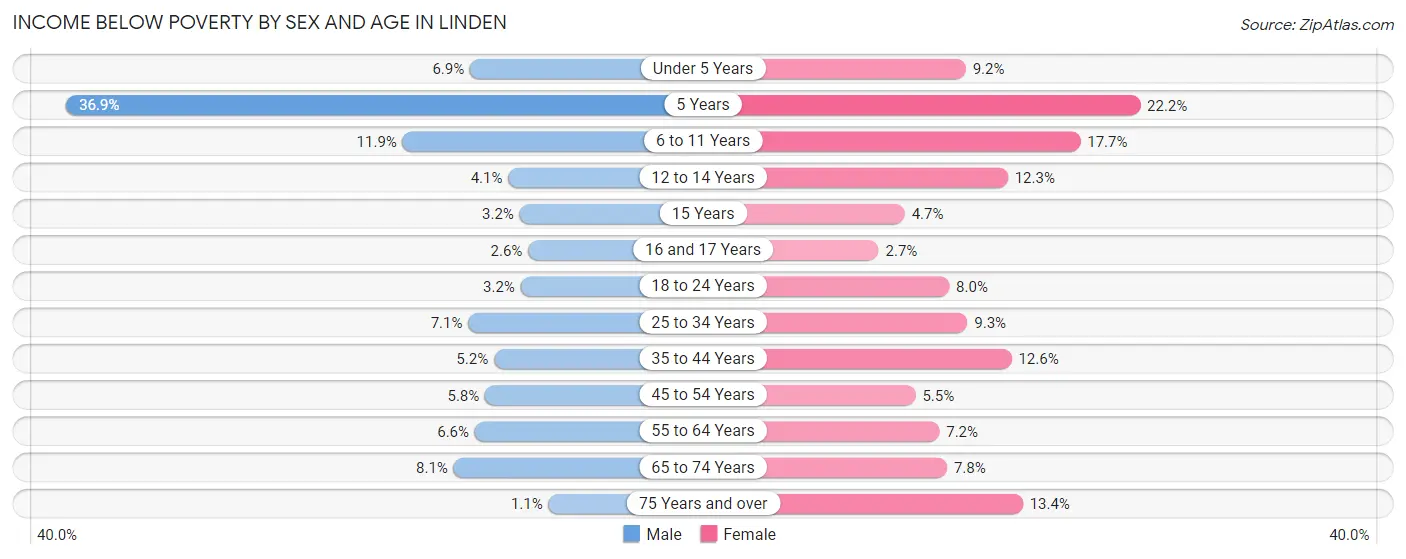
| Age Bracket | Male | Female |
| Under 5 Years | 71 (6.9%) | 126 (9.2%) |
| 5 Years | 79 (36.9%) | 66 (22.2%) |
| 6 to 11 Years | 201 (11.9%) | 254 (17.7%) |
| 12 to 14 Years | 38 (4.1%) | 84 (12.3%) |
| 15 Years | 6 (3.2%) | 15 (4.7%) |
| 16 and 17 Years | 19 (2.6%) | 10 (2.7%) |
| 18 to 24 Years | 52 (3.2%) | 159 (8.0%) |
| 25 to 34 Years | 196 (7.1%) | 291 (9.3%) |
| 35 to 44 Years | 163 (5.1%) | 379 (12.6%) |
| 45 to 54 Years | 192 (5.8%) | 162 (5.5%) |
| 55 to 64 Years | 207 (6.6%) | 218 (7.2%) |
| 65 to 74 Years | 125 (8.1%) | 148 (7.8%) |
| 75 Years and over | 10 (1.1%) | 200 (13.4%) |
| Total | 1,359 (6.4%) | 2,112 (9.6%) |
Income Above Poverty by Sex and Age in Linden
According to the poverty statistics in Linden, males aged 75 years and over and females aged 16 and 17 years are the age groups that are most secure financially, with 98.9% of males and 97.3% of females in these age groups living above the poverty line.
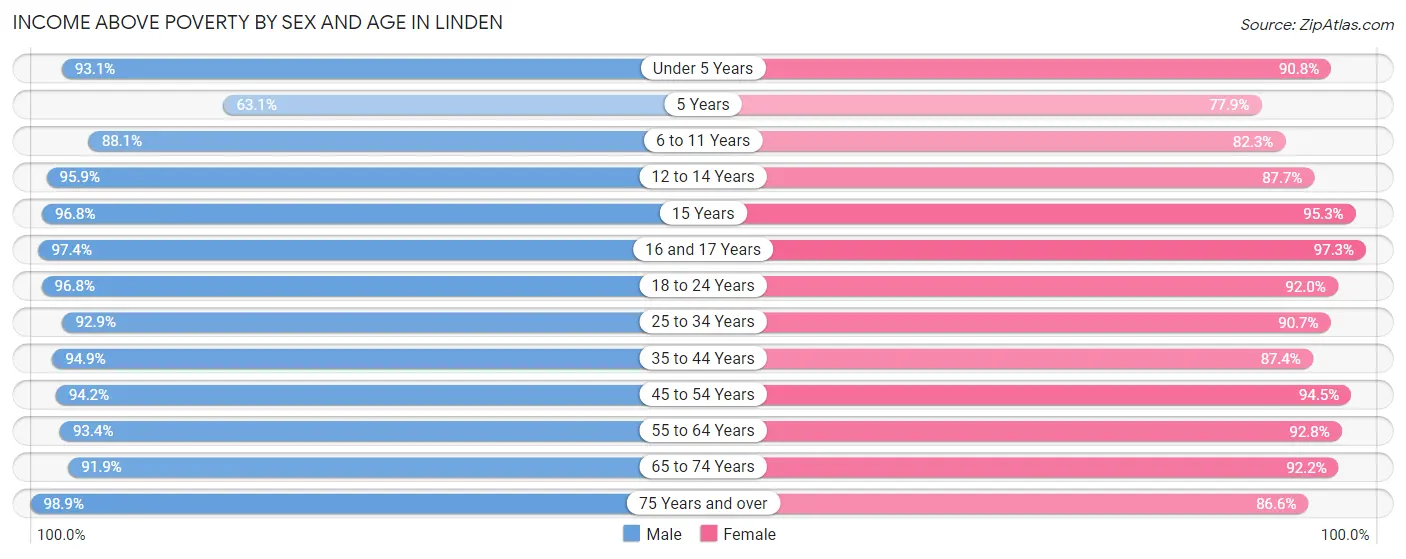
| Age Bracket | Male | Female |
| Under 5 Years | 954 (93.1%) | 1,243 (90.8%) |
| 5 Years | 135 (63.1%) | 232 (77.8%) |
| 6 to 11 Years | 1,484 (88.1%) | 1,180 (82.3%) |
| 12 to 14 Years | 892 (95.9%) | 598 (87.7%) |
| 15 Years | 179 (96.8%) | 306 (95.3%) |
| 16 and 17 Years | 709 (97.4%) | 356 (97.3%) |
| 18 to 24 Years | 1,587 (96.8%) | 1,836 (92.0%) |
| 25 to 34 Years | 2,582 (92.9%) | 2,830 (90.7%) |
| 35 to 44 Years | 2,999 (94.9%) | 2,628 (87.4%) |
| 45 to 54 Years | 3,114 (94.2%) | 2,798 (94.5%) |
| 55 to 64 Years | 2,945 (93.4%) | 2,793 (92.8%) |
| 65 to 74 Years | 1,410 (91.9%) | 1,747 (92.2%) |
| 75 Years and over | 897 (98.9%) | 1,289 (86.6%) |
| Total | 19,887 (93.6%) | 19,836 (90.4%) |
Income Below Poverty Among Married-Couple Families in Linden
The poverty statistics for married-couple families in Linden show that 4.3% or 297 of the total 6,871 families live below the poverty line. Families with 3 or 4 children have the highest poverty rate of 12.0%, comprising of 60 families. On the other hand, families with 5 or more children have the lowest poverty rate of 0.0%, which includes 0 families.
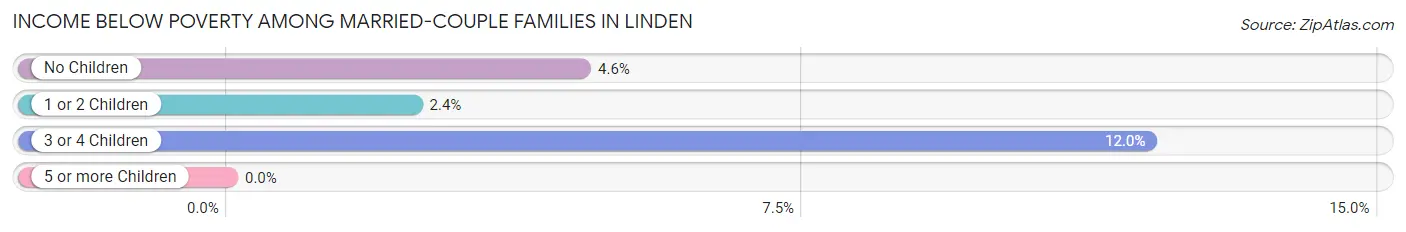
| Children | Above Poverty | Below Poverty |
| No Children | 3,621 (95.4%) | 175 (4.6%) |
| 1 or 2 Children | 2,507 (97.6%) | 62 (2.4%) |
| 3 or 4 Children | 440 (88.0%) | 60 (12.0%) |
| 5 or more Children | 6 (100.0%) | 0 (0.0%) |
| Total | 6,574 (95.7%) | 297 (4.3%) |
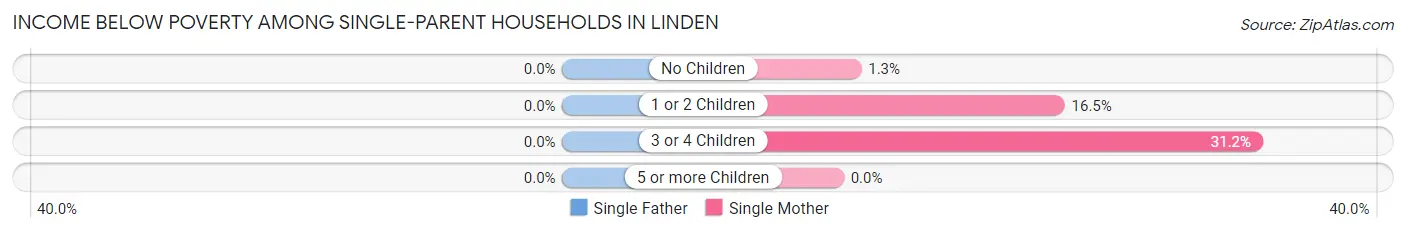
Income Below Poverty Among Single-Parent Households in Linden
| Children | Single Father | Single Mother |
| No Children | 0 (0.0%) | 16 (1.3%) |
| 1 or 2 Children | 0 (0.0%) | 204 (16.5%) |
| 3 or 4 Children | 0 (0.0%) | 94 (31.2%) |
| 5 or more Children | 0 (0.0%) | 0 (0.0%) |
| Total | 0 (0.0%) | 314 (11.3%) |
Income Below Poverty Among Married-Couple vs Single-Parent Households in Linden
The poverty data for Linden shows that 297 of the married-couple family households (4.3%) and 314 of the single-parent households (8.0%) are living below the poverty level. Within the married-couple family households, those with 3 or 4 children have the highest poverty rate, with 60 households (12.0%) falling below the poverty line. Among the single-parent households, those with 3 or 4 children have the highest poverty rate, with 94 household (21.2%) living below poverty.
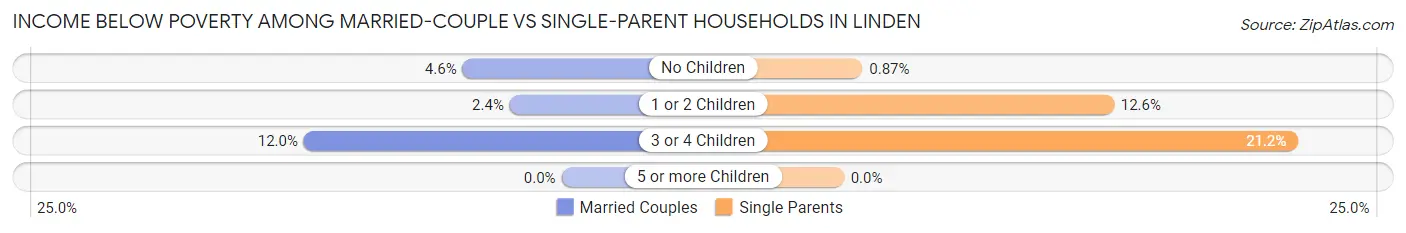
| Children | Married-Couple Families | Single-Parent Households |
| No Children | 175 (4.6%) | 16 (0.9%) |
| 1 or 2 Children | 62 (2.4%) | 204 (12.6%) |
| 3 or 4 Children | 60 (12.0%) | 94 (21.2%) |
| 5 or more Children | 0 (0.0%) | 0 (0.0%) |
| Total | 297 (4.3%) | 314 (8.0%) |
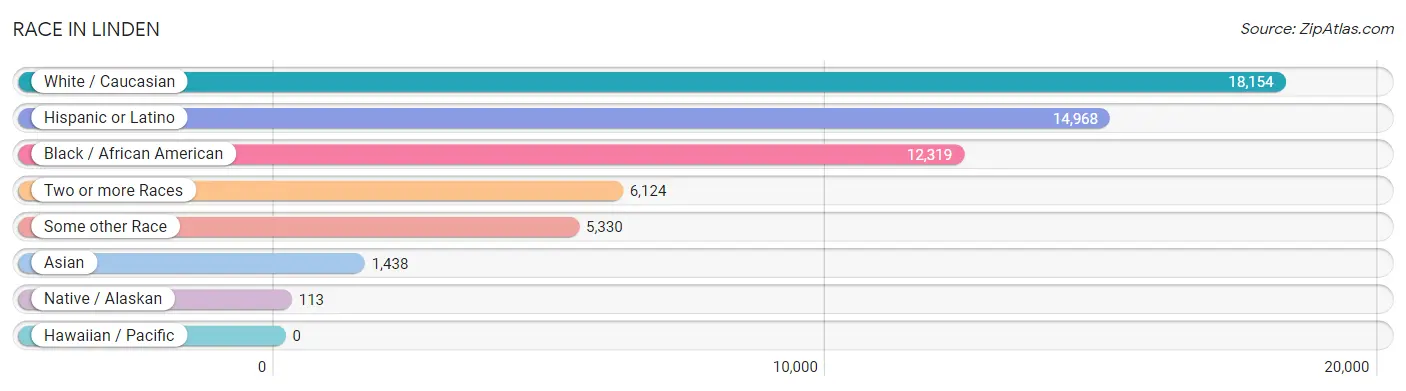
Race in Linden
The most populous races in Linden are White / Caucasian (18,154 | 41.7%), Hispanic or Latino (14,968 | 34.4%), and Black / African American (12,319 | 28.3%).
| Race | # Population | % Population |
| Asian | 1,438 | 3.3% |
| Black / African American | 12,319 | 28.3% |
| Hawaiian / Pacific | 0 | 0.0% |
| Hispanic or Latino | 14,968 | 34.4% |
| Native / Alaskan | 113 | 0.3% |
| White / Caucasian | 18,154 | 41.7% |
| Two or more Races | 6,124 | 14.1% |
| Some other Race | 5,330 | 12.3% |
| Total | 43,478 | 100.0% |
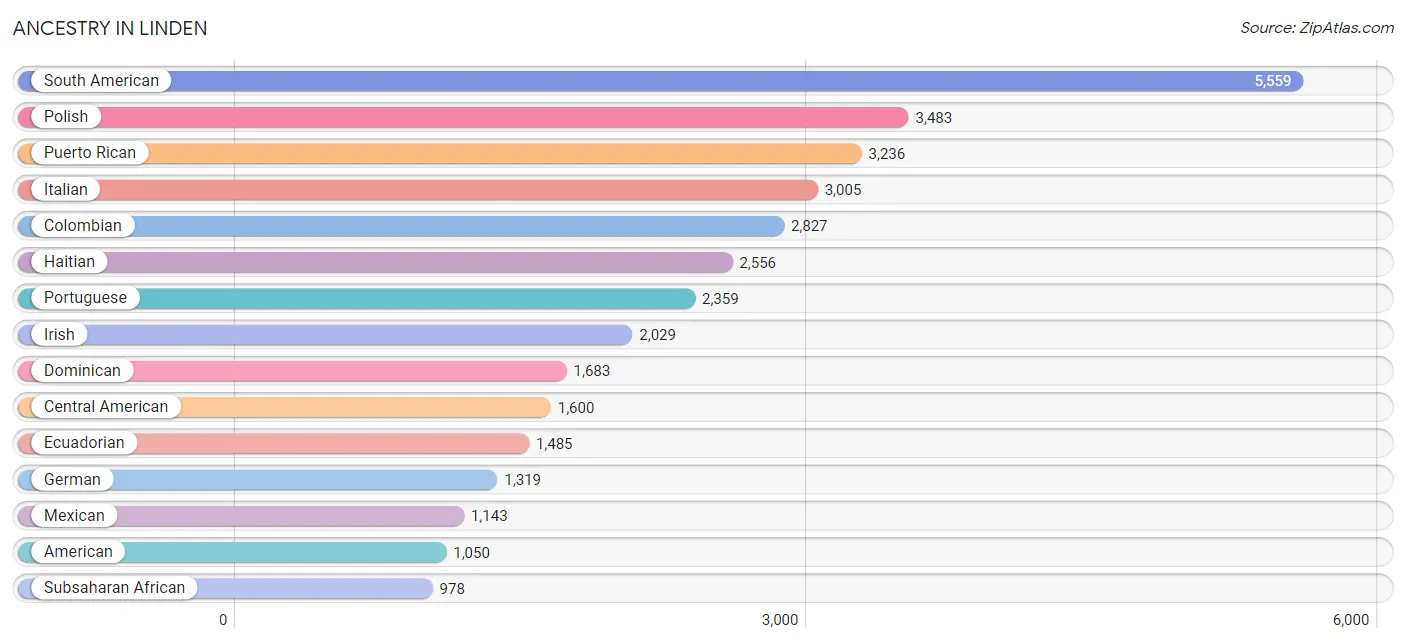
Ancestry in Linden
The most populous ancestries reported in Linden are South American (5,559 | 12.8%), Polish (3,483 | 8.0%), Puerto Rican (3,236 | 7.4%), Italian (3,005 | 6.9%), and Colombian (2,827 | 6.5%), together accounting for 41.6% of all Linden residents.
| Ancestry | # Population | % Population |
| African | 575 | 1.3% |
| Albanian | 19 | 0.0% |
| American | 1,050 | 2.4% |
| Arab | 189 | 0.4% |
| Argentinean | 253 | 0.6% |
| Assyrian / Chaldean / Syriac | 7 | 0.0% |
| Australian | 114 | 0.3% |
| Austrian | 128 | 0.3% |
| Bolivian | 7 | 0.0% |
| Brazilian | 501 | 1.1% |
| British | 30 | 0.1% |
| Bulgarian | 5 | 0.0% |
| Burmese | 4 | 0.0% |
| Central American | 1,600 | 3.7% |
| Central American Indian | 231 | 0.5% |
| Cherokee | 45 | 0.1% |
| Chilean | 64 | 0.2% |
| Colombian | 2,827 | 6.5% |
| Costa Rican | 266 | 0.6% |
| Croatian | 29 | 0.1% |
| Cuban | 677 | 1.6% |
| Czech | 105 | 0.2% |
| Czechoslovakian | 16 | 0.0% |
| Danish | 17 | 0.0% |
| Delaware | 22 | 0.1% |
| Dominican | 1,683 | 3.9% |
| Dutch | 36 | 0.1% |
| Eastern European | 18 | 0.0% |
| Ecuadorian | 1,485 | 3.4% |
| Egyptian | 153 | 0.4% |
| English | 341 | 0.8% |
| European | 310 | 0.7% |
| French | 138 | 0.3% |
| German | 1,319 | 3.0% |
| Ghanaian | 17 | 0.0% |
| Greek | 219 | 0.5% |
| Guatemalan | 146 | 0.3% |
| Guyanese | 367 | 0.8% |
| Haitian | 2,556 | 5.9% |
| Honduran | 195 | 0.4% |
| Hungarian | 160 | 0.4% |
| Indian (Asian) | 507 | 1.2% |
| Irish | 2,029 | 4.7% |
| Israeli | 27 | 0.1% |
| Italian | 3,005 | 6.9% |
| Jamaican | 148 | 0.3% |
| Jordanian | 36 | 0.1% |
| Korean | 568 | 1.3% |
| Liberian | 9 | 0.0% |
| Lithuanian | 134 | 0.3% |
| Mexican | 1,143 | 2.6% |
| Mexican American Indian | 22 | 0.1% |
| Nicaraguan | 38 | 0.1% |
| Nigerian | 353 | 0.8% |
| Norwegian | 31 | 0.1% |
| Pakistani | 13 | 0.0% |
| Paraguayan | 7 | 0.0% |
| Peruvian | 720 | 1.7% |
| Polish | 3,483 | 8.0% |
| Portuguese | 2,359 | 5.4% |
| Puerto Rican | 3,236 | 7.4% |
| Romanian | 21 | 0.1% |
| Russian | 138 | 0.3% |
| Salvadoran | 955 | 2.2% |
| Scotch-Irish | 36 | 0.1% |
| Scottish | 57 | 0.1% |
| Serbian | 15 | 0.0% |
| Slavic | 92 | 0.2% |
| Slovak | 470 | 1.1% |
| Slovene | 8 | 0.0% |
| South American | 5,559 | 12.8% |
| South American Indian | 75 | 0.2% |
| Spaniard | 538 | 1.2% |
| Spanish | 28 | 0.1% |
| Sri Lankan | 57 | 0.1% |
| Subsaharan African | 978 | 2.2% |
| Swedish | 27 | 0.1% |
| Thai | 362 | 0.8% |
| Trinidadian and Tobagonian | 75 | 0.2% |
| Ukrainian | 396 | 0.9% |
| Uruguayan | 74 | 0.2% |
| Venezuelan | 97 | 0.2% |
| Vietnamese | 69 | 0.2% |
| Welsh | 51 | 0.1% |
| West Indian | 37 | 0.1% |
| Yugoslavian | 12 | 0.0% | View All 86 Rows |
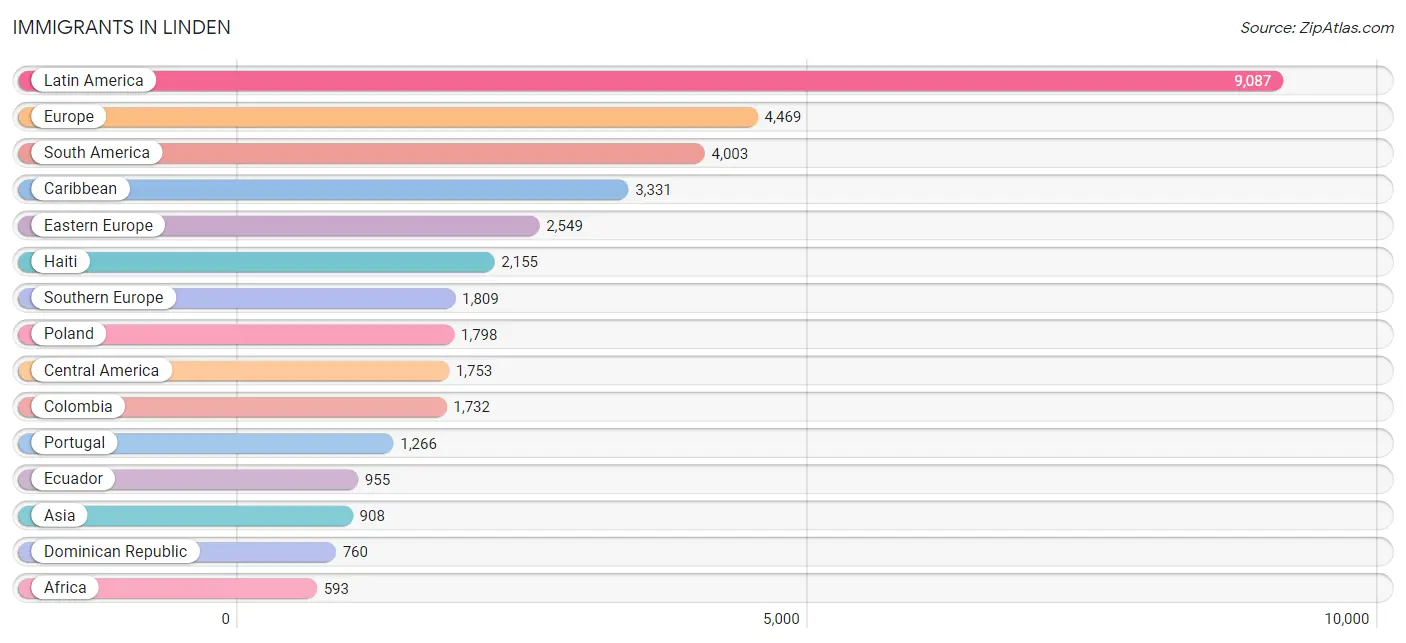
Immigrants in Linden
The most numerous immigrant groups reported in Linden came from Latin America (9,087 | 20.9%), Europe (4,469 | 10.3%), South America (4,003 | 9.2%), Caribbean (3,331 | 7.7%), and Eastern Europe (2,549 | 5.9%), together accounting for 53.9% of all Linden residents.
| Immigration Origin | # Population | % Population |
| Africa | 593 | 1.4% |
| Albania | 10 | 0.0% |
| Argentina | 77 | 0.2% |
| Asia | 908 | 2.1% |
| Austria | 6 | 0.0% |
| Bangladesh | 106 | 0.2% |
| Brazil | 159 | 0.4% |
| Bulgaria | 10 | 0.0% |
| Caribbean | 3,331 | 7.7% |
| Central America | 1,753 | 4.0% |
| Chile | 22 | 0.1% |
| China | 145 | 0.3% |
| Colombia | 1,732 | 4.0% |
| Costa Rica | 254 | 0.6% |
| Croatia | 19 | 0.0% |
| Cuba | 217 | 0.5% |
| Czechoslovakia | 391 | 0.9% |
| Dominican Republic | 760 | 1.8% |
| Eastern Africa | 12 | 0.0% |
| Eastern Asia | 168 | 0.4% |
| Eastern Europe | 2,549 | 5.9% |
| Ecuador | 955 | 2.2% |
| Egypt | 153 | 0.4% |
| El Salvador | 578 | 1.3% |
| England | 24 | 0.1% |
| Europe | 4,469 | 10.3% |
| France | 19 | 0.0% |
| Germany | 27 | 0.1% |
| Ghana | 17 | 0.0% |
| Greece | 124 | 0.3% |
| Guatemala | 68 | 0.2% |
| Guyana | 349 | 0.8% |
| Haiti | 2,155 | 5.0% |
| Honduras | 208 | 0.5% |
| India | 251 | 0.6% |
| Ireland | 7 | 0.0% |
| Italy | 197 | 0.4% |
| Jamaica | 105 | 0.2% |
| Jordan | 36 | 0.1% |
| Kenya | 12 | 0.0% |
| Korea | 23 | 0.1% |
| Latin America | 9,087 | 20.9% |
| Latvia | 20 | 0.1% |
| Liberia | 131 | 0.3% |
| Lithuania | 102 | 0.2% |
| Mexico | 525 | 1.2% |
| Middle Africa | 10 | 0.0% |
| Nicaragua | 120 | 0.3% |
| Nigeria | 221 | 0.5% |
| Northern Africa | 182 | 0.4% |
| Northern Europe | 59 | 0.1% |
| Pakistan | 46 | 0.1% |
| Peru | 534 | 1.2% |
| Philippines | 269 | 0.6% |
| Poland | 1,798 | 4.1% |
| Portugal | 1,266 | 2.9% |
| Romania | 8 | 0.0% |
| Russia | 8 | 0.0% |
| Serbia | 15 | 0.0% |
| South America | 4,003 | 9.2% |
| South Central Asia | 403 | 0.9% |
| South Eastern Asia | 301 | 0.7% |
| Southern Europe | 1,809 | 4.2% |
| Spain | 222 | 0.5% |
| Sudan | 29 | 0.1% |
| Thailand | 13 | 0.0% |
| Trinidad and Tobago | 94 | 0.2% |
| Ukraine | 168 | 0.4% |
| Uruguay | 72 | 0.2% |
| Venezuela | 61 | 0.1% |
| Vietnam | 19 | 0.0% |
| Western Africa | 389 | 0.9% |
| Western Asia | 36 | 0.1% |
| Western Europe | 52 | 0.1% | View All 74 Rows |
Sex and Age in Linden
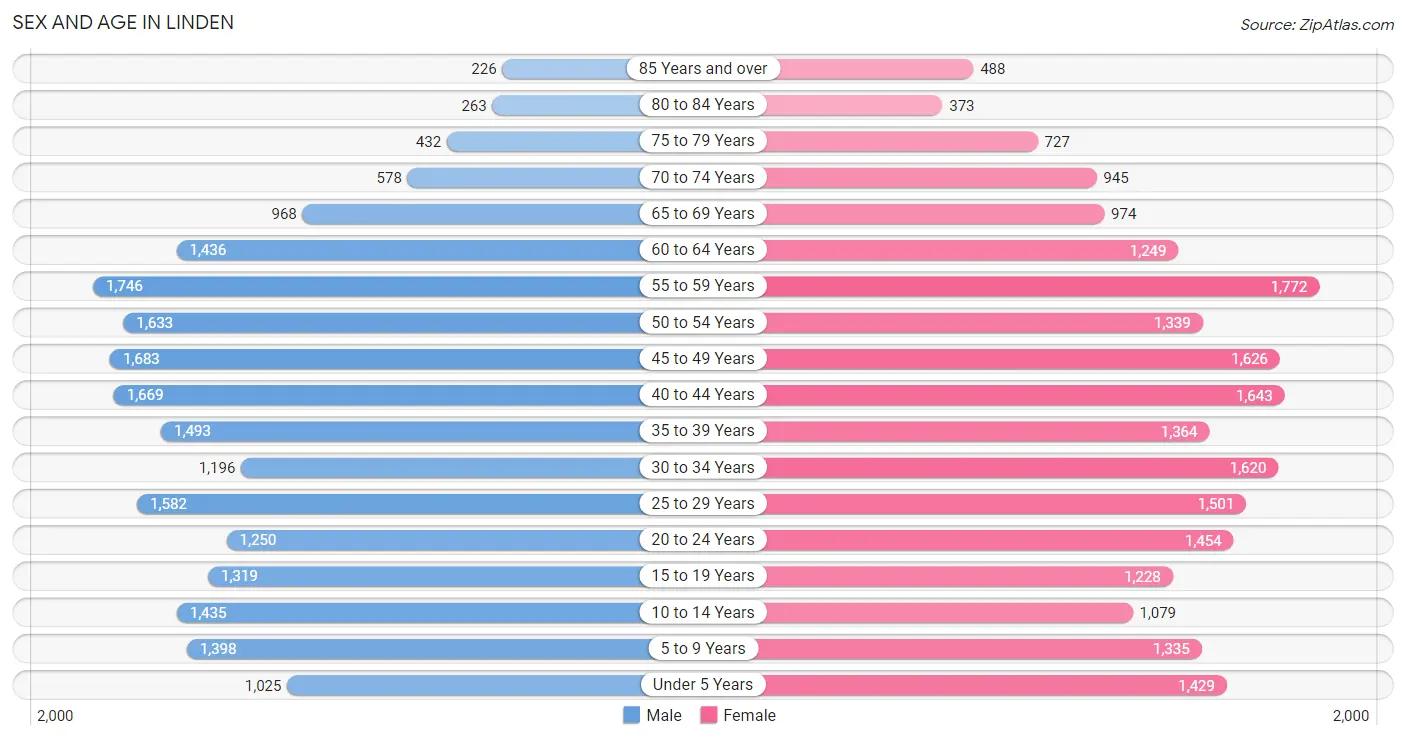
Sex and Age in Linden
The most populous age groups in Linden are 55 to 59 Years (1,746 | 8.2%) for men and 55 to 59 Years (1,772 | 8.0%) for women.
| Age Bracket | Male | Female |
| Under 5 Years | 1,025 (4.8%) | 1,429 (6.5%) |
| 5 to 9 Years | 1,398 (6.6%) | 1,335 (6.0%) |
| 10 to 14 Years | 1,435 (6.7%) | 1,079 (4.9%) |
| 15 to 19 Years | 1,319 (6.2%) | 1,228 (5.6%) |
| 20 to 24 Years | 1,250 (5.9%) | 1,454 (6.6%) |
| 25 to 29 Years | 1,582 (7.4%) | 1,501 (6.8%) |
| 30 to 34 Years | 1,196 (5.6%) | 1,620 (7.3%) |
| 35 to 39 Years | 1,493 (7.0%) | 1,364 (6.2%) |
| 40 to 44 Years | 1,669 (7.8%) | 1,643 (7.4%) |
| 45 to 49 Years | 1,683 (7.9%) | 1,626 (7.3%) |
| 50 to 54 Years | 1,633 (7.7%) | 1,339 (6.0%) |
| 55 to 59 Years | 1,746 (8.2%) | 1,772 (8.0%) |
| 60 to 64 Years | 1,436 (6.7%) | 1,249 (5.6%) |
| 65 to 69 Years | 968 (4.5%) | 974 (4.4%) |
| 70 to 74 Years | 578 (2.7%) | 945 (4.3%) |
| 75 to 79 Years | 432 (2.0%) | 727 (3.3%) |
| 80 to 84 Years | 263 (1.2%) | 373 (1.7%) |
| 85 Years and over | 226 (1.1%) | 488 (2.2%) |
| Total | 21,332 (100.0%) | 22,146 (100.0%) |
Families and Households in Linden
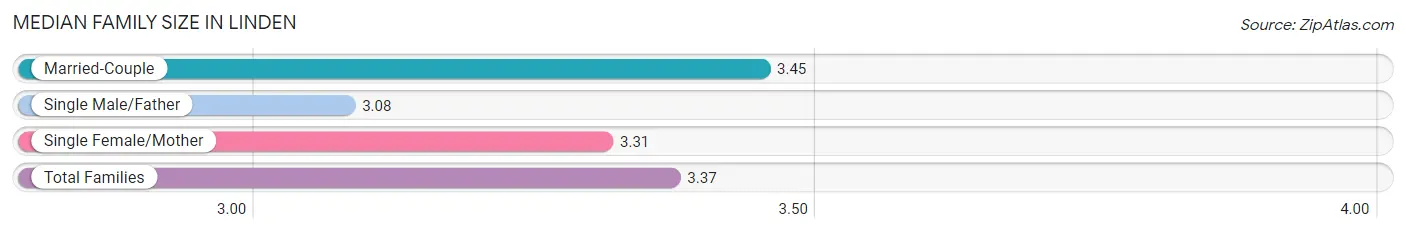
Median Family Size in Linden
The median family size in Linden is 3.37 persons per family, with married-couple families (6,871 | 63.7%) accounting for the largest median family size of 3.45 persons per family. On the other hand, single male/father families (1,143 | 10.6%) represent the smallest median family size with 3.08 persons per family.
| Family Type | # Families | Family Size |
| Married-Couple | 6,871 (63.7%) | 3.45 |
| Single Male/Father | 1,143 (10.6%) | 3.08 |
| Single Female/Mother | 2,768 (25.7%) | 3.31 |
| Total Families | 10,782 (100.0%) | 3.37 |
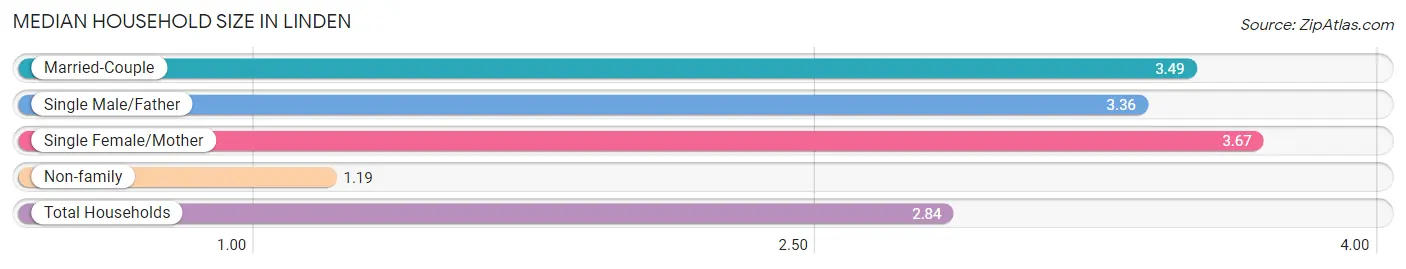
Median Household Size in Linden
The median household size in Linden is 2.84 persons per household, with single female/mother households (2,768 | 18.2%) accounting for the largest median household size of 3.67 persons per household. non-family households (4,437 | 29.1%) represent the smallest median household size with 1.19 persons per household.
| Household Type | # Households | Household Size |
| Married-Couple | 6,871 (45.2%) | 3.49 |
| Single Male/Father | 1,143 (7.5%) | 3.36 |
| Single Female/Mother | 2,768 (18.2%) | 3.67 |
| Non-family | 4,437 (29.1%) | 1.19 |
| Total Households | 15,219 (100.0%) | 2.84 |
Household Size by Marriage Status in Linden
Out of a total of 15,219 households in Linden, 10,782 (70.9%) are family households, while 4,437 (29.1%) are nonfamily households. The most numerous type of family households are 2-person households, comprising 3,212, and the most common type of nonfamily households are 1-person households, comprising 3,678.
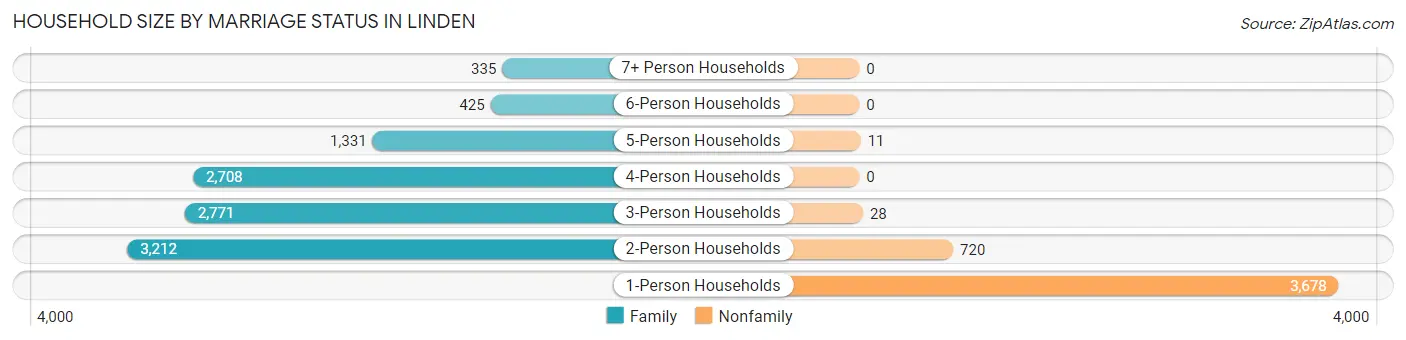
| Household Size | Family Households | Nonfamily Households |
| 1-Person Households | - | 3,678 (24.2%) |
| 2-Person Households | 3,212 (21.1%) | 720 (4.7%) |
| 3-Person Households | 2,771 (18.2%) | 28 (0.2%) |
| 4-Person Households | 2,708 (17.8%) | 0 (0.0%) |
| 5-Person Households | 1,331 (8.7%) | 11 (0.1%) |
| 6-Person Households | 425 (2.8%) | 0 (0.0%) |
| 7+ Person Households | 335 (2.2%) | 0 (0.0%) |
| Total | 10,782 (70.9%) | 4,437 (29.1%) |
Female Fertility in Linden
Fertility by Age in Linden
Average fertility rate in Linden is 60.0 births per 1,000 women. Women in the age bracket of 20 to 34 years have the highest fertility rate with 105.0 births per 1,000 women. Women in the age bracket of 20 to 34 years acount for 74.5% of all women with births.
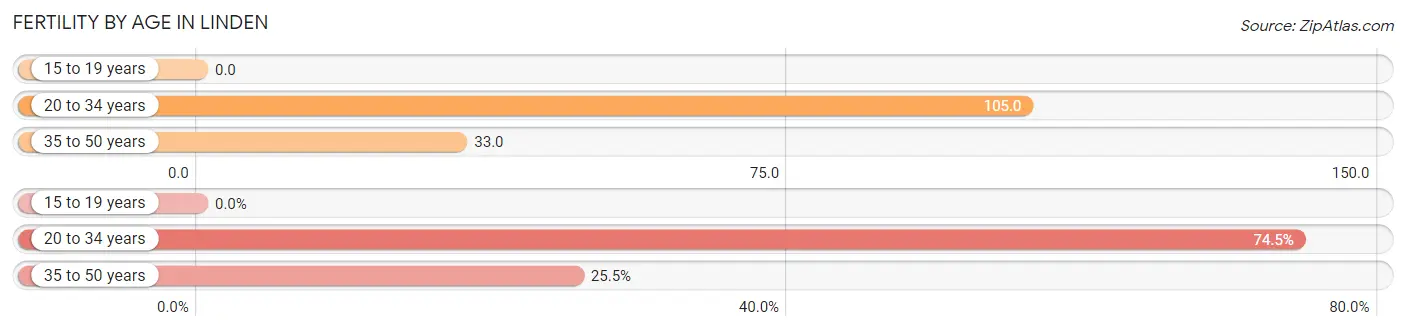
| Age Bracket | Women with Births | Births / 1,000 Women |
| 15 to 19 years | 0 (0.0%) | 0.0 |
| 20 to 34 years | 479 (74.5%) | 105.0 |
| 35 to 50 years | 164 (25.5%) | 33.0 |
| Total | 643 (100.0%) | 60.0 |
Fertility by Age by Marriage Status in Linden
60.7% of women with births (643) in Linden are married. The highest percentage of unmarried women with births falls into 20 to 34 years age bracket with 46.8% of them unmarried at the time of birth, while the lowest percentage of unmarried women with births belong to 35 to 50 years age bracket with 17.7% of them unmarried.
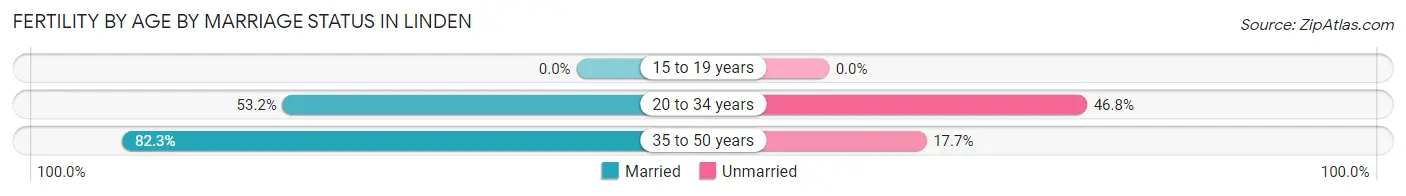
| Age Bracket | Married | Unmarried |
| 15 to 19 years | 0 (0.0%) | 0 (0.0%) |
| 20 to 34 years | 255 (53.2%) | 224 (46.8%) |
| 35 to 50 years | 135 (82.3%) | 29 (17.7%) |
| Total | 390 (60.7%) | 253 (39.4%) |
Fertility by Education in Linden
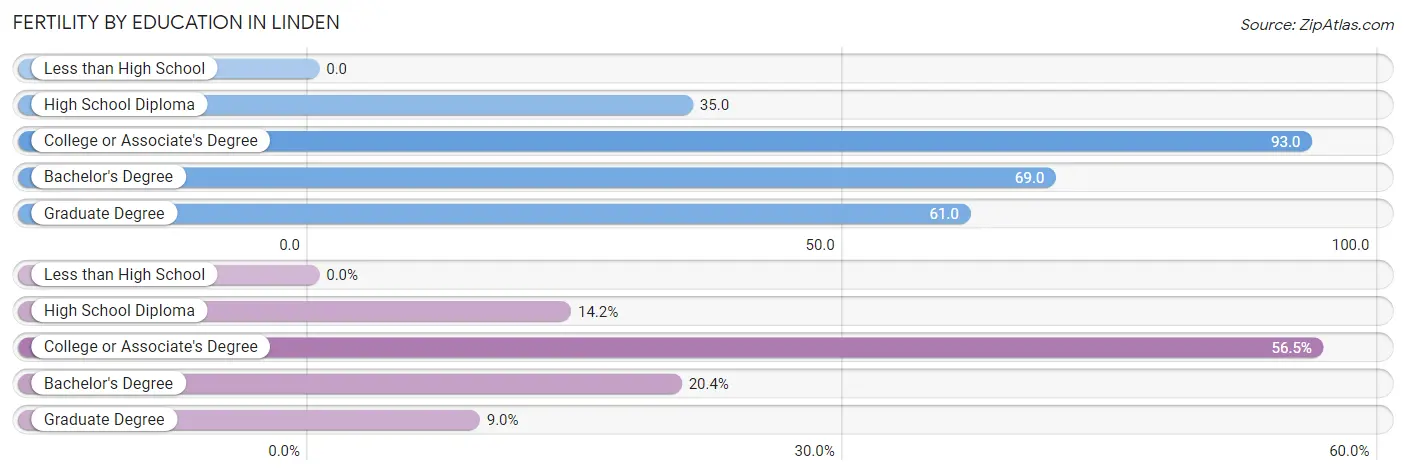
| Educational Attainment | Women with Births | Births / 1,000 Women |
| Less than High School | 0 (0.0%) | 0.0 |
| High School Diploma | 91 (14.1%) | 35.0 |
| College or Associate's Degree | 363 (56.5%) | 93.0 |
| Bachelor's Degree | 131 (20.4%) | 69.0 |
| Graduate Degree | 58 (9.0%) | 61.0 |
| Total | 643 (100.0%) | 60.0 |
Fertility by Education by Marriage Status in Linden
39.4% of women with births in Linden are unmarried. Women with the educational attainment of bachelor's degree are most likely to be married with 83.2% of them married at childbirth, while women with the educational attainment of high school diploma are least likely to be married with 87.9% of them unmarried at childbirth.
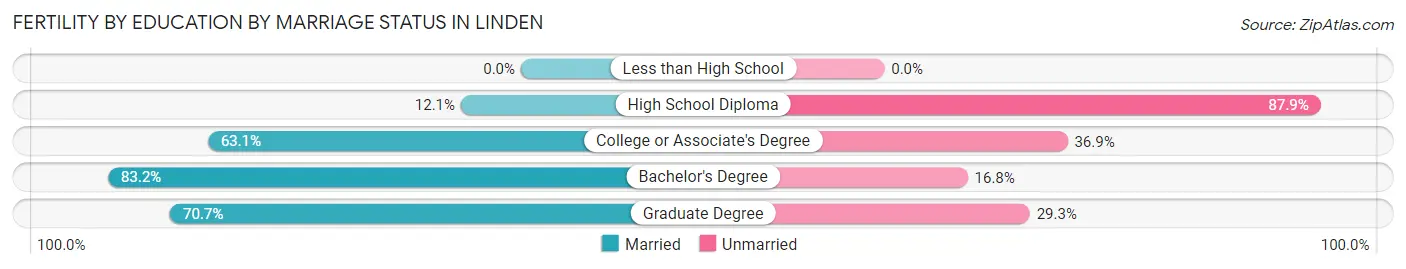
| Educational Attainment | Married | Unmarried |
| Less than High School | 0 (0.0%) | 0 (0.0%) |
| High School Diploma | 11 (12.1%) | 80 (87.9%) |
| College or Associate's Degree | 229 (63.1%) | 134 (36.9%) |
| Bachelor's Degree | 109 (83.2%) | 22 (16.8%) |
| Graduate Degree | 41 (70.7%) | 17 (29.3%) |
| Total | 390 (60.7%) | 253 (39.4%) |
Employment Characteristics in Linden
Employment by Class of Employer in Linden
Among the 21,946 employed individuals in Linden, private company employees (15,347 | 69.9%), local government employees (2,126 | 9.7%), and not-for-profit organizations (1,391 | 6.3%) make up the most common classes of employment.
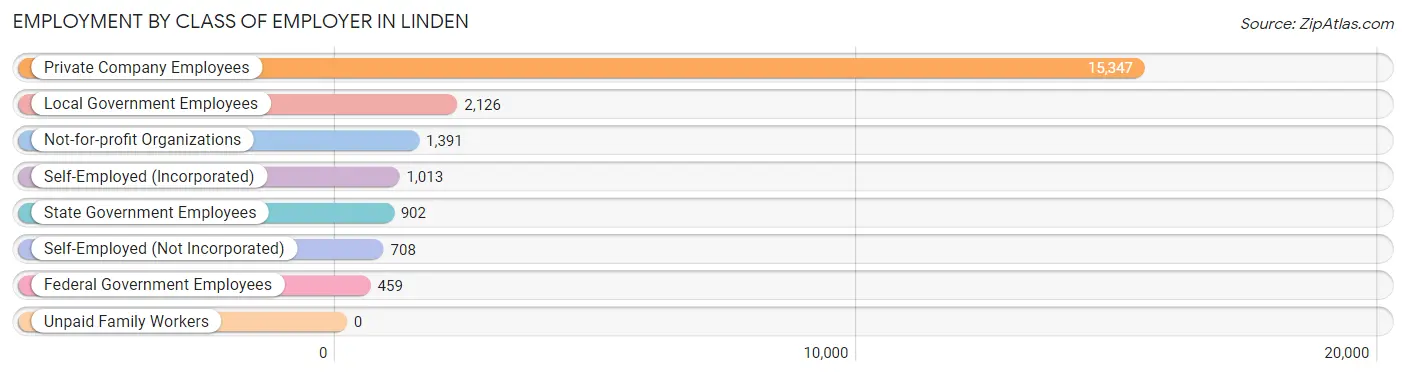
| Employer Class | # Employees | % Employees |
| Private Company Employees | 15,347 | 69.9% |
| Self-Employed (Incorporated) | 1,013 | 4.6% |
| Self-Employed (Not Incorporated) | 708 | 3.2% |
| Not-for-profit Organizations | 1,391 | 6.3% |
| Local Government Employees | 2,126 | 9.7% |
| State Government Employees | 902 | 4.1% |
| Federal Government Employees | 459 | 2.1% |
| Unpaid Family Workers | 0 | 0.0% |
| Total | 21,946 | 100.0% |
Employment Status by Age in Linden
According to the labor force statistics for Linden, out of the total population over 16 years of age (35,271), 70.1% or 24,725 individuals are in the labor force, with 7.9% or 1,953 of them unemployed. The age group with the highest labor force participation rate is 25 to 29 years, with 94.1% or 2,901 individuals in the labor force. Within the labor force, the 20 to 24 years age range has the highest percentage of unemployed individuals, with 24.0% or 505 of them being unemployed.
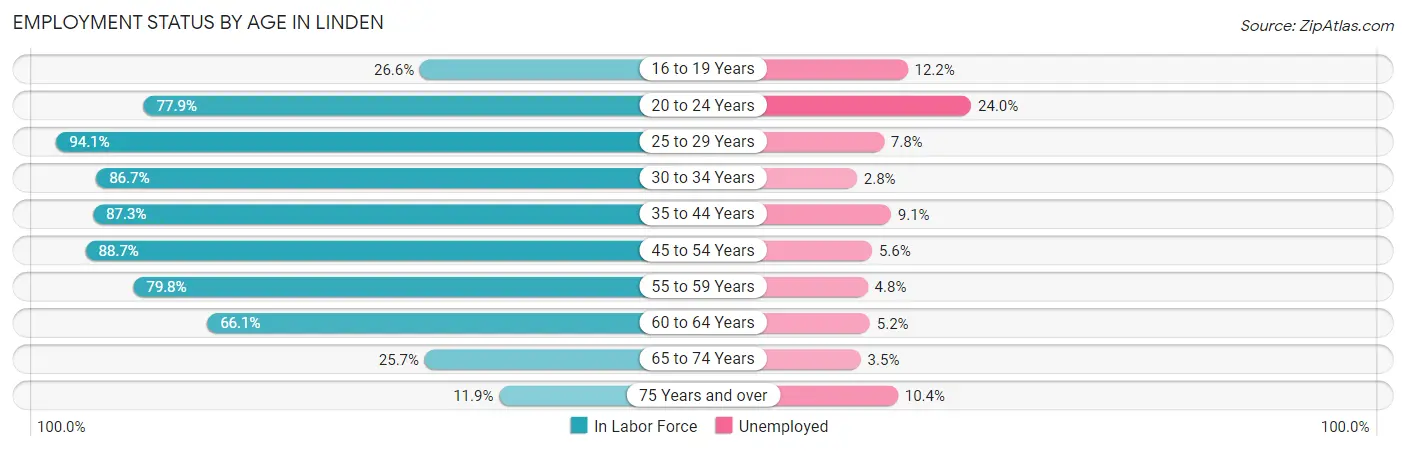
| Age Bracket | In Labor Force | Unemployed |
| 16 to 19 Years | 543 (26.6%) | 66 (12.2%) |
| 20 to 24 Years | 2,106 (77.9%) | 505 (24.0%) |
| 25 to 29 Years | 2,901 (94.1%) | 226 (7.8%) |
| 30 to 34 Years | 2,441 (86.7%) | 68 (2.8%) |
| 35 to 44 Years | 5,386 (87.3%) | 490 (9.1%) |
| 45 to 54 Years | 5,571 (88.7%) | 312 (5.6%) |
| 55 to 59 Years | 2,807 (79.8%) | 135 (4.8%) |
| 60 to 64 Years | 1,775 (66.1%) | 92 (5.2%) |
| 65 to 74 Years | 891 (25.7%) | 31 (3.5%) |
| 75 Years and over | 299 (11.9%) | 31 (10.4%) |
| Total | 24,725 (70.1%) | 1,953 (7.9%) |
Employment Status by Educational Attainment in Linden
According to labor force statistics for Linden, 85.0% of individuals (20,869) out of the total population between 25 and 64 years of age (24,552) are in the labor force, with 6.3% or 1,315 of them being unemployed. The group with the highest labor force participation rate are those with the educational attainment of bachelor's degree or higher, with 91.3% or 5,578 individuals in the labor force. Within the labor force, individuals with less than high school education have the highest percentage of unemployment, with 10.0% or 200 of them being unemployed.
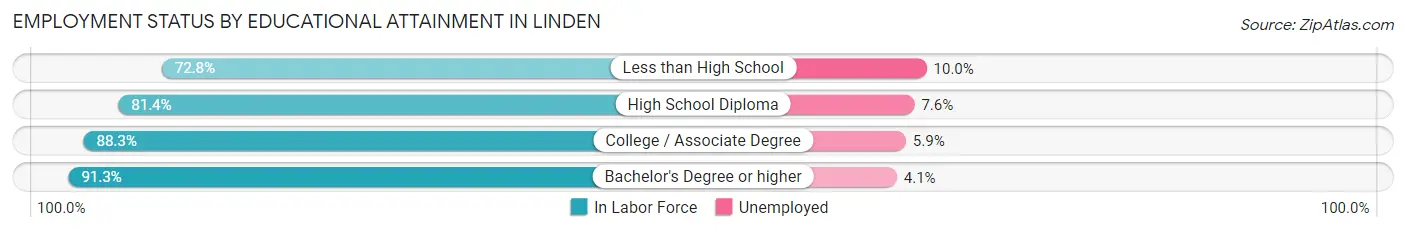
| Educational Attainment | In Labor Force | Unemployed |
| Less than High School | 1,997 (72.8%) | 274 (10.0%) |
| High School Diploma | 6,550 (81.4%) | 612 (7.6%) |
| College / Associate Degree | 6,758 (88.3%) | 452 (5.9%) |
| Bachelor's Degree or higher | 5,578 (91.3%) | 250 (4.1%) |
| Total | 20,869 (85.0%) | 1,547 (6.3%) |
Employment Occupations by Sex in Linden
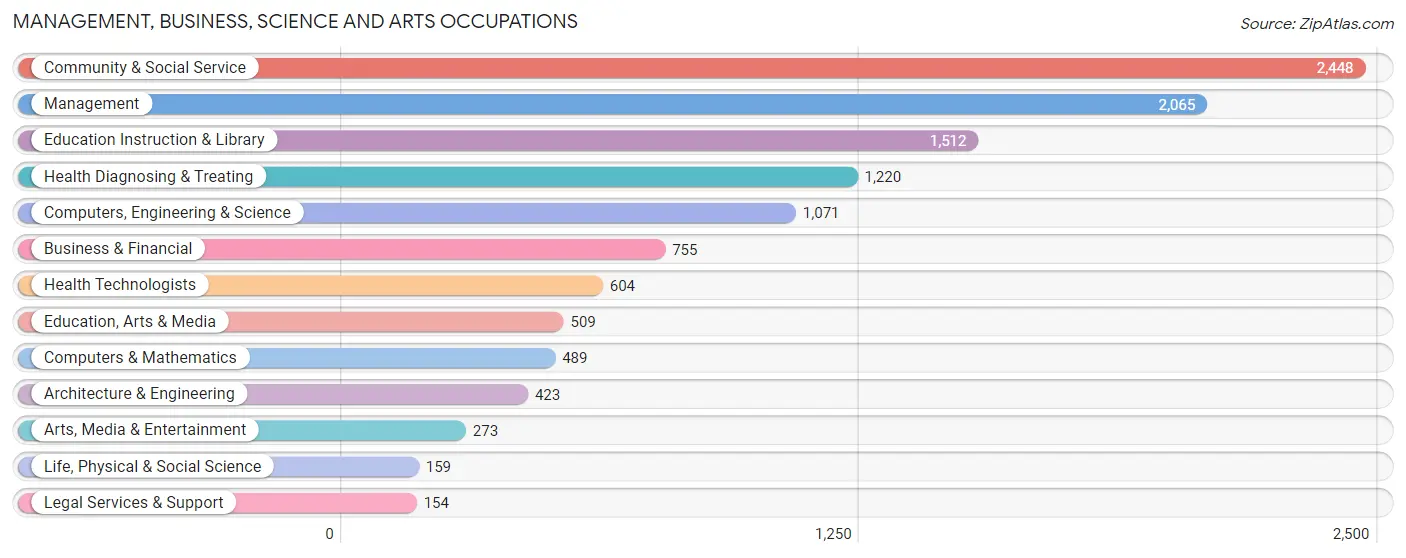
Management, Business, Science and Arts Occupations
The most common Management, Business, Science and Arts occupations in Linden are Community & Social Service (2,448 | 10.8%), Management (2,065 | 9.1%), Education Instruction & Library (1,512 | 6.7%), Health Diagnosing & Treating (1,220 | 5.4%), and Computers, Engineering & Science (1,071 | 4.7%).
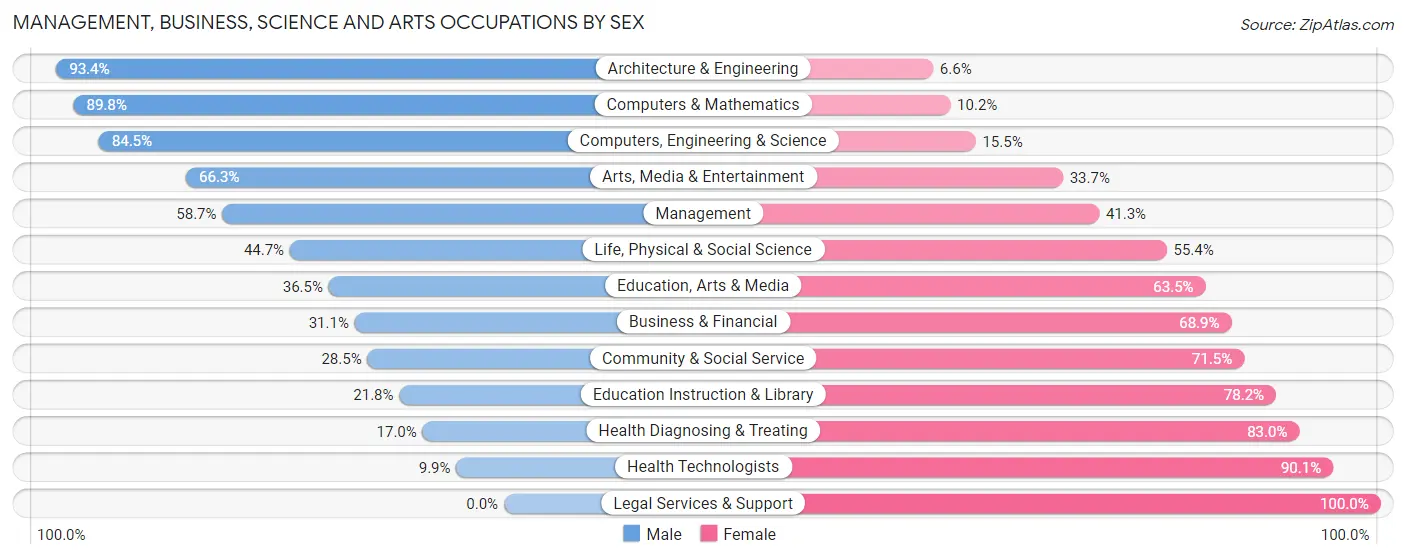
Management, Business, Science and Arts Occupations by Sex
Within the Management, Business, Science and Arts occupations in Linden, the most male-oriented occupations are Architecture & Engineering (93.4%), Computers & Mathematics (89.8%), and Computers, Engineering & Science (84.5%), while the most female-oriented occupations are Legal Services & Support (100.0%), Health Technologists (90.1%), and Health Diagnosing & Treating (83.0%).
| Occupation | Male | Female |
| Management | 1,213 (58.7%) | 852 (41.3%) |
| Business & Financial | 235 (31.1%) | 520 (68.9%) |
| Computers, Engineering & Science | 905 (84.5%) | 166 (15.5%) |
| Computers & Mathematics | 439 (89.8%) | 50 (10.2%) |
| Architecture & Engineering | 395 (93.4%) | 28 (6.6%) |
| Life, Physical & Social Science | 71 (44.7%) | 88 (55.3%) |
| Community & Social Service | 697 (28.5%) | 1,751 (71.5%) |
| Education, Arts & Media | 186 (36.5%) | 323 (63.5%) |
| Legal Services & Support | 0 (0.0%) | 154 (100.0%) |
| Education Instruction & Library | 330 (21.8%) | 1,182 (78.2%) |
| Arts, Media & Entertainment | 181 (66.3%) | 92 (33.7%) |
| Health Diagnosing & Treating | 207 (17.0%) | 1,013 (83.0%) |
| Health Technologists | 60 (9.9%) | 544 (90.1%) |
| Total (Category) | 3,257 (43.1%) | 4,302 (56.9%) |
| Total (Overall) | 11,947 (52.5%) | 10,803 (47.5%) |
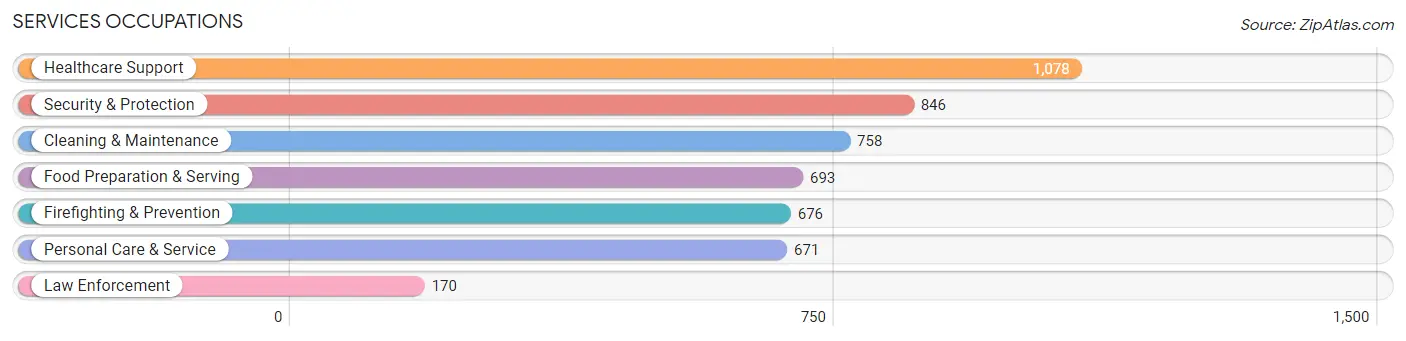
Services Occupations
The most common Services occupations in Linden are Healthcare Support (1,078 | 4.7%), Security & Protection (846 | 3.7%), Cleaning & Maintenance (758 | 3.3%), Food Preparation & Serving (693 | 3.0%), and Firefighting & Prevention (676 | 3.0%).
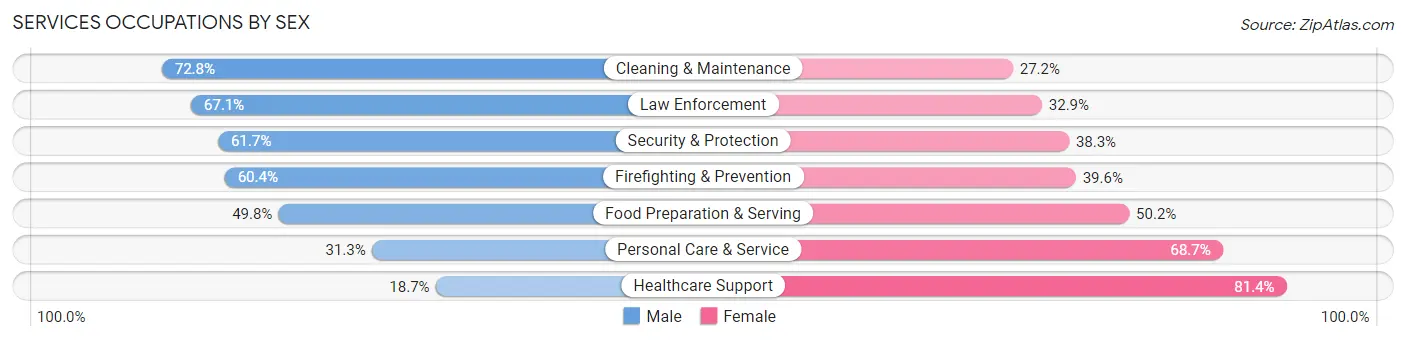
Services Occupations by Sex
Within the Services occupations in Linden, the most male-oriented occupations are Cleaning & Maintenance (72.8%), Law Enforcement (67.1%), and Security & Protection (61.7%), while the most female-oriented occupations are Healthcare Support (81.4%), Personal Care & Service (68.7%), and Food Preparation & Serving (50.2%).
| Occupation | Male | Female |
| Healthcare Support | 201 (18.6%) | 877 (81.4%) |
| Security & Protection | 522 (61.7%) | 324 (38.3%) |
| Firefighting & Prevention | 408 (60.4%) | 268 (39.6%) |
| Law Enforcement | 114 (67.1%) | 56 (32.9%) |
| Food Preparation & Serving | 345 (49.8%) | 348 (50.2%) |
| Cleaning & Maintenance | 552 (72.8%) | 206 (27.2%) |
| Personal Care & Service | 210 (31.3%) | 461 (68.7%) |
| Total (Category) | 1,830 (45.2%) | 2,216 (54.8%) |
| Total (Overall) | 11,947 (52.5%) | 10,803 (47.5%) |
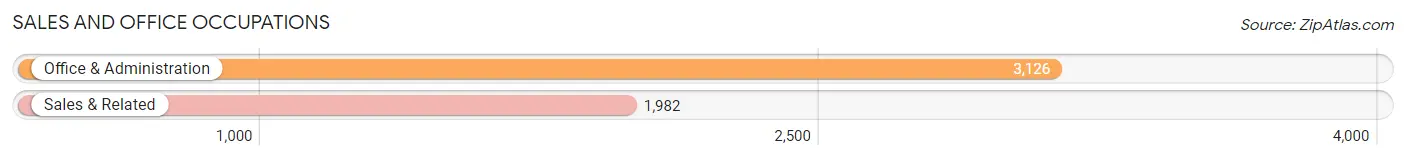
Sales and Office Occupations
The most common Sales and Office occupations in Linden are Office & Administration (3,126 | 13.7%), and Sales & Related (1,982 | 8.7%).
Sales and Office Occupations by Sex
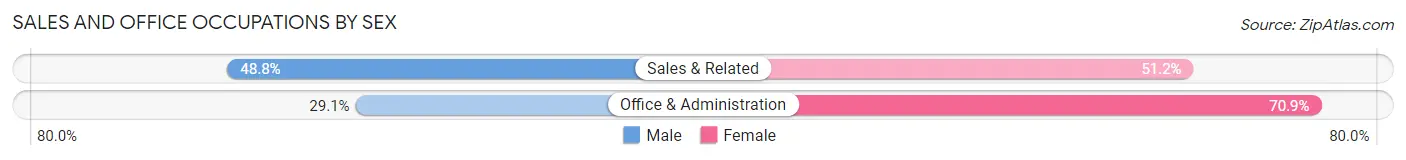
| Occupation | Male | Female |
| Sales & Related | 967 (48.8%) | 1,015 (51.2%) |
| Office & Administration | 910 (29.1%) | 2,216 (70.9%) |
| Total (Category) | 1,877 (36.7%) | 3,231 (63.2%) |
| Total (Overall) | 11,947 (52.5%) | 10,803 (47.5%) |
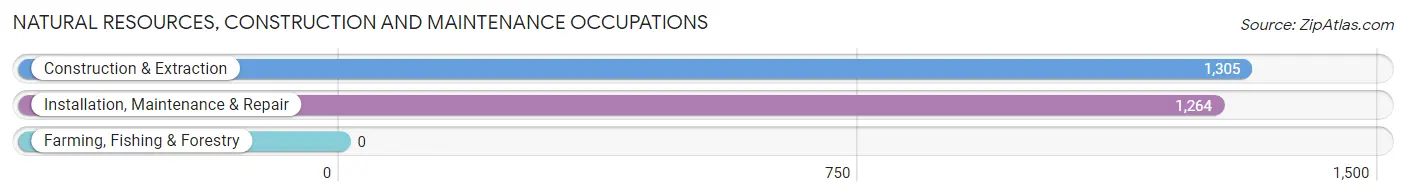
Natural Resources, Construction and Maintenance Occupations
The most common Natural Resources, Construction and Maintenance occupations in Linden are Construction & Extraction (1,305 | 5.7%), and Installation, Maintenance & Repair (1,264 | 5.6%).
Natural Resources, Construction and Maintenance Occupations by Sex
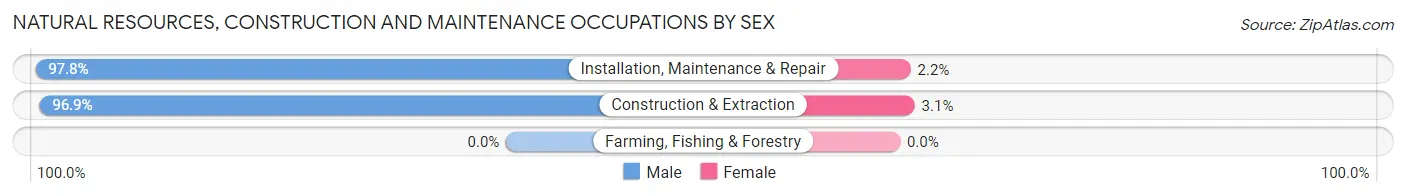
| Occupation | Male | Female |
| Farming, Fishing & Forestry | 0 (0.0%) | 0 (0.0%) |
| Construction & Extraction | 1,265 (96.9%) | 40 (3.1%) |
| Installation, Maintenance & Repair | 1,236 (97.8%) | 28 (2.2%) |
| Total (Category) | 2,501 (97.4%) | 68 (2.6%) |
| Total (Overall) | 11,947 (52.5%) | 10,803 (47.5%) |
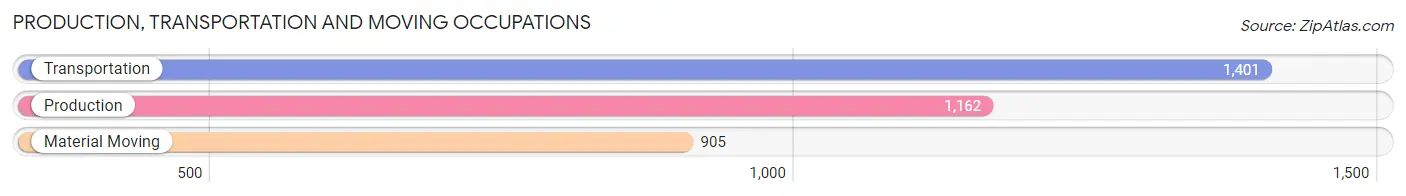
Production, Transportation and Moving Occupations
The most common Production, Transportation and Moving occupations in Linden are Transportation (1,401 | 6.2%), Production (1,162 | 5.1%), and Material Moving (905 | 4.0%).
Production, Transportation and Moving Occupations by Sex
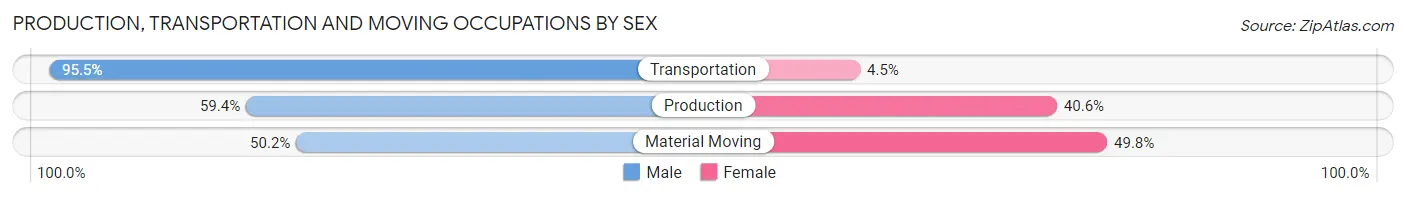
| Occupation | Male | Female |
| Production | 690 (59.4%) | 472 (40.6%) |
| Transportation | 1,338 (95.5%) | 63 (4.5%) |
| Material Moving | 454 (50.2%) | 451 (49.8%) |
| Total (Category) | 2,482 (71.6%) | 986 (28.4%) |
| Total (Overall) | 11,947 (52.5%) | 10,803 (47.5%) |
Employment Industries by Sex in Linden
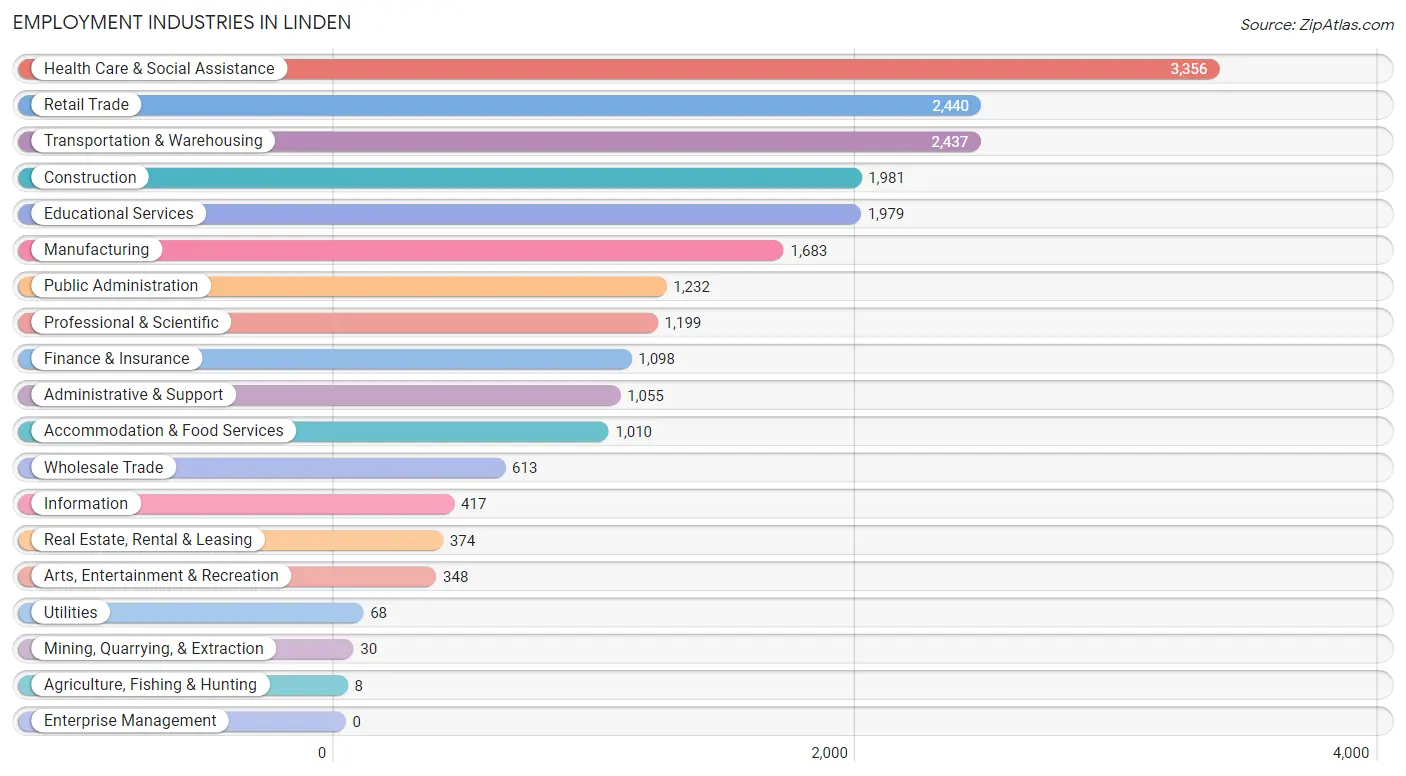
Employment Industries in Linden
The major employment industries in Linden include Health Care & Social Assistance (3,356 | 14.7%), Retail Trade (2,440 | 10.7%), Transportation & Warehousing (2,437 | 10.7%), Construction (1,981 | 8.7%), and Educational Services (1,979 | 8.7%).
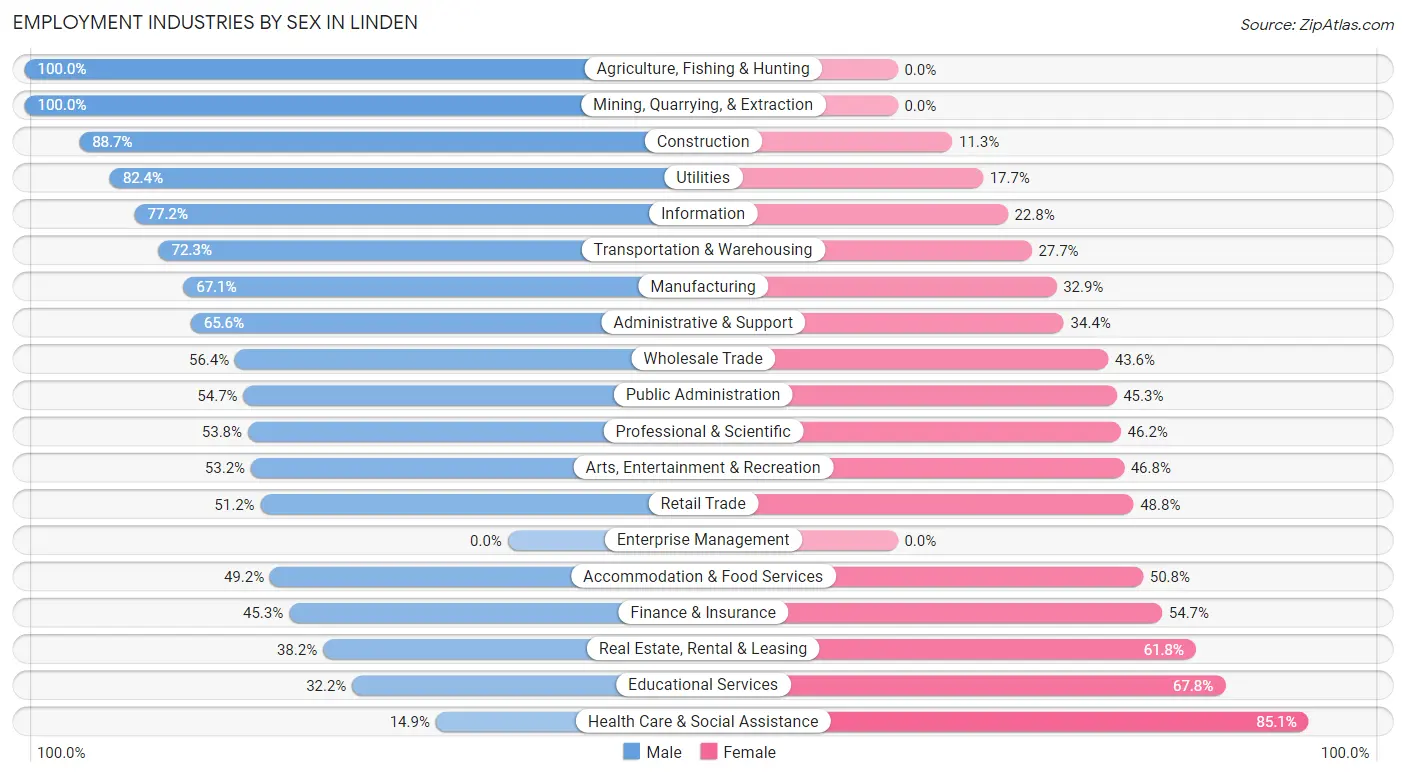
Employment Industries by Sex in Linden
The Linden industries that see more men than women are Agriculture, Fishing & Hunting (100.0%), Mining, Quarrying, & Extraction (100.0%), and Construction (88.7%), whereas the industries that tend to have a higher number of women are Health Care & Social Assistance (85.1%), Educational Services (67.8%), and Real Estate, Rental & Leasing (61.8%).
| Industry | Male | Female |
| Agriculture, Fishing & Hunting | 8 (100.0%) | 0 (0.0%) |
| Mining, Quarrying, & Extraction | 30 (100.0%) | 0 (0.0%) |
| Construction | 1,757 (88.7%) | 224 (11.3%) |
| Manufacturing | 1,130 (67.1%) | 553 (32.9%) |
| Wholesale Trade | 346 (56.4%) | 267 (43.6%) |
| Retail Trade | 1,249 (51.2%) | 1,191 (48.8%) |
| Transportation & Warehousing | 1,761 (72.3%) | 676 (27.7%) |
| Utilities | 56 (82.4%) | 12 (17.6%) |
| Information | 322 (77.2%) | 95 (22.8%) |
| Finance & Insurance | 497 (45.3%) | 601 (54.7%) |
| Real Estate, Rental & Leasing | 143 (38.2%) | 231 (61.8%) |
| Professional & Scientific | 645 (53.8%) | 554 (46.2%) |
| Enterprise Management | 0 (0.0%) | 0 (0.0%) |
| Administrative & Support | 692 (65.6%) | 363 (34.4%) |
| Educational Services | 637 (32.2%) | 1,342 (67.8%) |
| Health Care & Social Assistance | 500 (14.9%) | 2,856 (85.1%) |
| Arts, Entertainment & Recreation | 185 (53.2%) | 163 (46.8%) |
| Accommodation & Food Services | 497 (49.2%) | 513 (50.8%) |
| Public Administration | 674 (54.7%) | 558 (45.3%) |
| Total | 11,947 (52.5%) | 10,803 (47.5%) |
Education in Linden
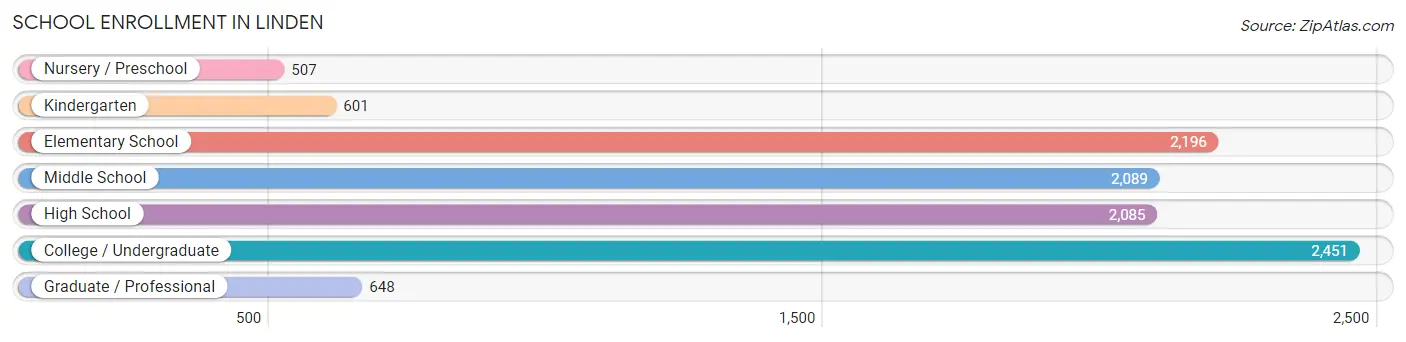
School Enrollment in Linden
The most common levels of schooling among the 10,577 students in Linden are college / undergraduate (2,451 | 23.2%), elementary school (2,196 | 20.8%), and middle school (2,089 | 19.8%).
| School Level | # Students | % Students |
| Nursery / Preschool | 507 | 4.8% |
| Kindergarten | 601 | 5.7% |
| Elementary School | 2,196 | 20.8% |
| Middle School | 2,089 | 19.8% |
| High School | 2,085 | 19.7% |
| College / Undergraduate | 2,451 | 23.2% |
| Graduate / Professional | 648 | 6.1% |
| Total | 10,577 | 100.0% |
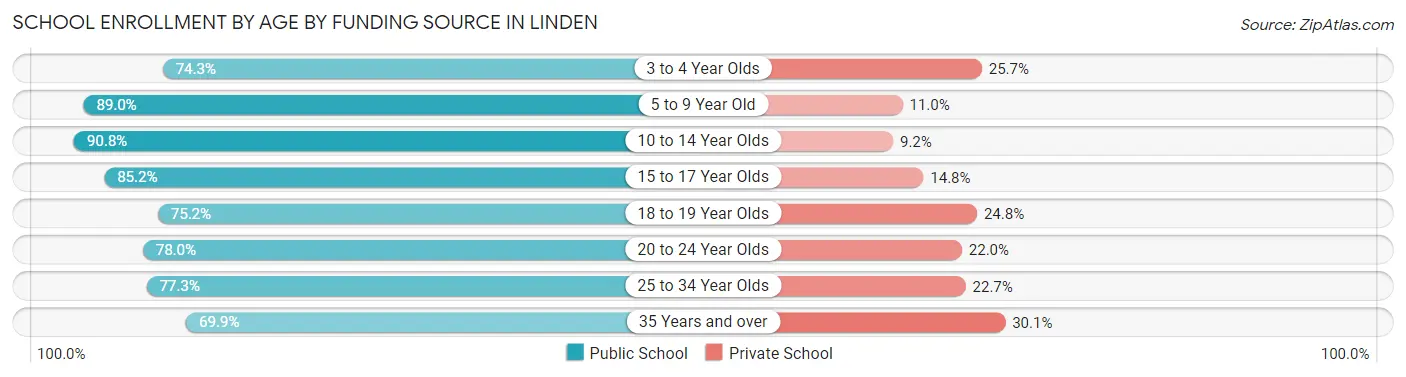
School Enrollment by Age by Funding Source in Linden
Out of a total of 10,577 students who are enrolled in schools in Linden, 1,713 (16.2%) attend a private institution, while the remaining 8,864 (83.8%) are enrolled in public schools. The age group of 35 years and over has the highest likelihood of being enrolled in private schools, with 254 (30.1% in the age bracket) enrolled. Conversely, the age group of 10 to 14 year olds has the lowest likelihood of being enrolled in a private school, with 2,254 (90.8% in the age bracket) attending a public institution.
| Age Bracket | Public School | Private School |
| 3 to 4 Year Olds | 355 (74.3%) | 123 (25.7%) |
| 5 to 9 Year Old | 2,330 (89.0%) | 287 (11.0%) |
| 10 to 14 Year Olds | 2,254 (90.8%) | 228 (9.2%) |
| 15 to 17 Year Olds | 1,366 (85.2%) | 238 (14.8%) |
| 18 to 19 Year Olds | 548 (75.2%) | 181 (24.8%) |
| 20 to 24 Year Olds | 903 (78.0%) | 255 (22.0%) |
| 25 to 34 Year Olds | 514 (77.3%) | 151 (22.7%) |
| 35 Years and over | 590 (69.9%) | 254 (30.1%) |
| Total | 8,864 (83.8%) | 1,713 (16.2%) |
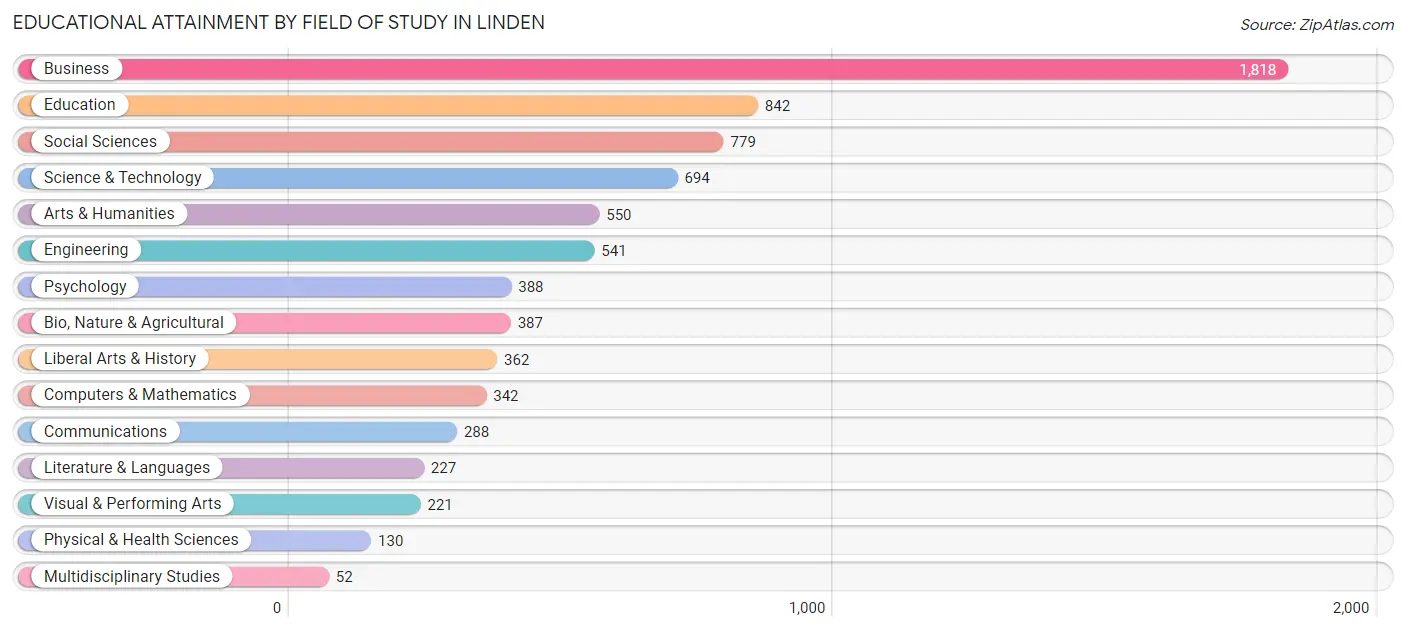
Educational Attainment by Field of Study in Linden
Business (1,818 | 23.9%), education (842 | 11.1%), social sciences (779 | 10.2%), science & technology (694 | 9.1%), and arts & humanities (550 | 7.2%) are the most common fields of study among 7,621 individuals in Linden who have obtained a bachelor's degree or higher.
| Field of Study | # Graduates | % Graduates |
| Computers & Mathematics | 342 | 4.5% |
| Bio, Nature & Agricultural | 387 | 5.1% |
| Physical & Health Sciences | 130 | 1.7% |
| Psychology | 388 | 5.1% |
| Social Sciences | 779 | 10.2% |
| Engineering | 541 | 7.1% |
| Multidisciplinary Studies | 52 | 0.7% |
| Science & Technology | 694 | 9.1% |
| Business | 1,818 | 23.9% |
| Education | 842 | 11.1% |
| Literature & Languages | 227 | 3.0% |
| Liberal Arts & History | 362 | 4.8% |
| Visual & Performing Arts | 221 | 2.9% |
| Communications | 288 | 3.8% |
| Arts & Humanities | 550 | 7.2% |
| Total | 7,621 | 100.0% |
Transportation & Commute in Linden
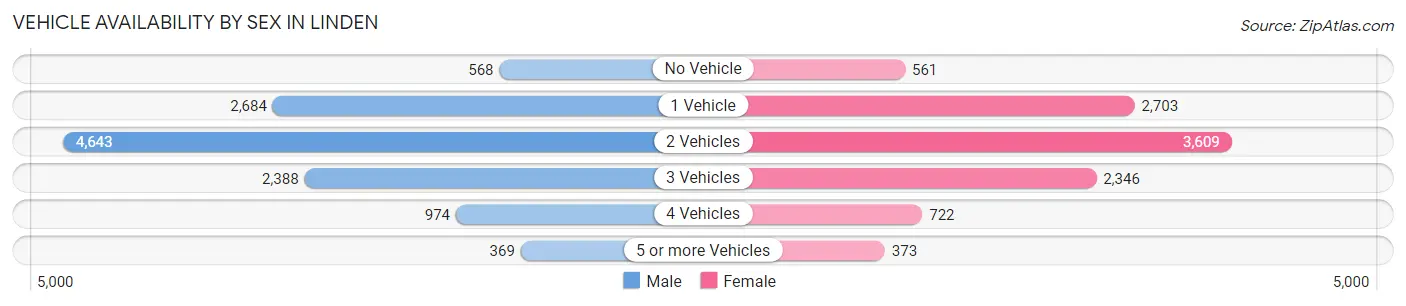
Vehicle Availability by Sex in Linden
The most prevalent vehicle ownership categories in Linden are males with 2 vehicles (4,643, accounting for 39.9%) and females with 2 vehicles (3,609, making up 45.0%).
| Vehicles Available | Male | Female |
| No Vehicle | 568 (4.9%) | 561 (5.4%) |
| 1 Vehicle | 2,684 (23.1%) | 2,703 (26.2%) |
| 2 Vehicles | 4,643 (39.9%) | 3,609 (35.0%) |
| 3 Vehicles | 2,388 (20.5%) | 2,346 (22.8%) |
| 4 Vehicles | 974 (8.4%) | 722 (7.0%) |
| 5 or more Vehicles | 369 (3.2%) | 373 (3.6%) |
| Total | 11,626 (100.0%) | 10,314 (100.0%) |
Commute Time in Linden
The most frequently occuring commute durations in Linden are 30 to 34 minutes (3,198 commuters, 15.3%), 15 to 19 minutes (2,758 commuters, 13.2%), and 10 to 14 minutes (2,331 commuters, 11.2%).
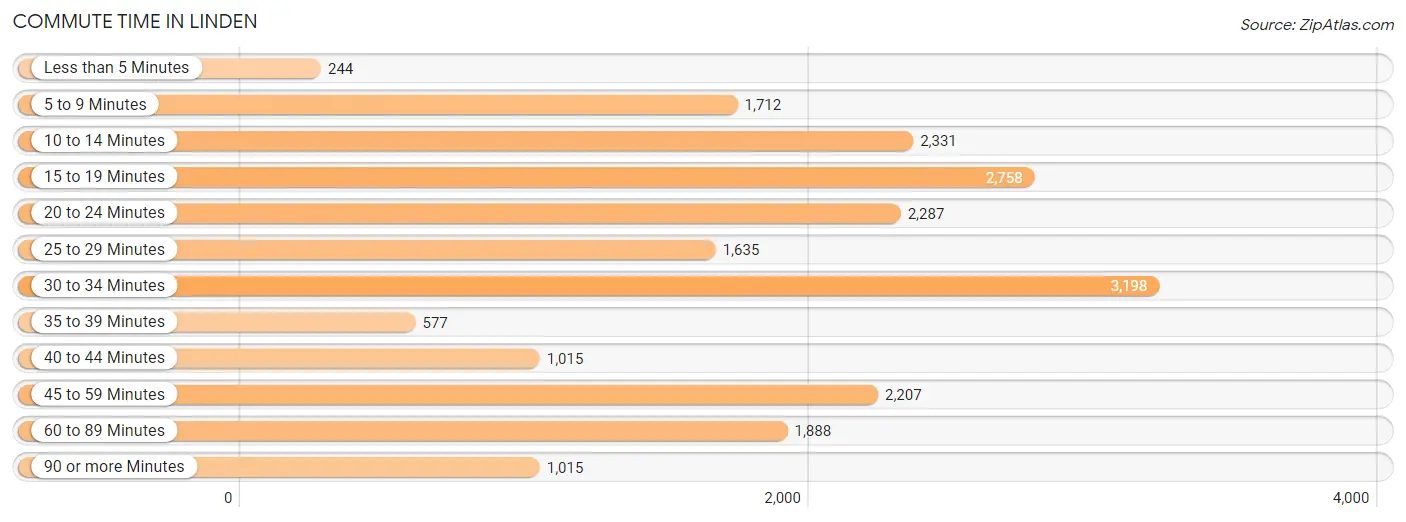
| Commute Time | # Commuters | % Commuters |
| Less than 5 Minutes | 244 | 1.2% |
| 5 to 9 Minutes | 1,712 | 8.2% |
| 10 to 14 Minutes | 2,331 | 11.2% |
| 15 to 19 Minutes | 2,758 | 13.2% |
| 20 to 24 Minutes | 2,287 | 11.0% |
| 25 to 29 Minutes | 1,635 | 7.8% |
| 30 to 34 Minutes | 3,198 | 15.3% |
| 35 to 39 Minutes | 577 | 2.8% |
| 40 to 44 Minutes | 1,015 | 4.9% |
| 45 to 59 Minutes | 2,207 | 10.6% |
| 60 to 89 Minutes | 1,888 | 9.0% |
| 90 or more Minutes | 1,015 | 4.9% |
Commute Time by Sex in Linden
The most common commute times in Linden are 30 to 34 minutes (1,914 commuters, 17.2%) for males and 15 to 19 minutes (1,474 commuters, 15.1%) for females.
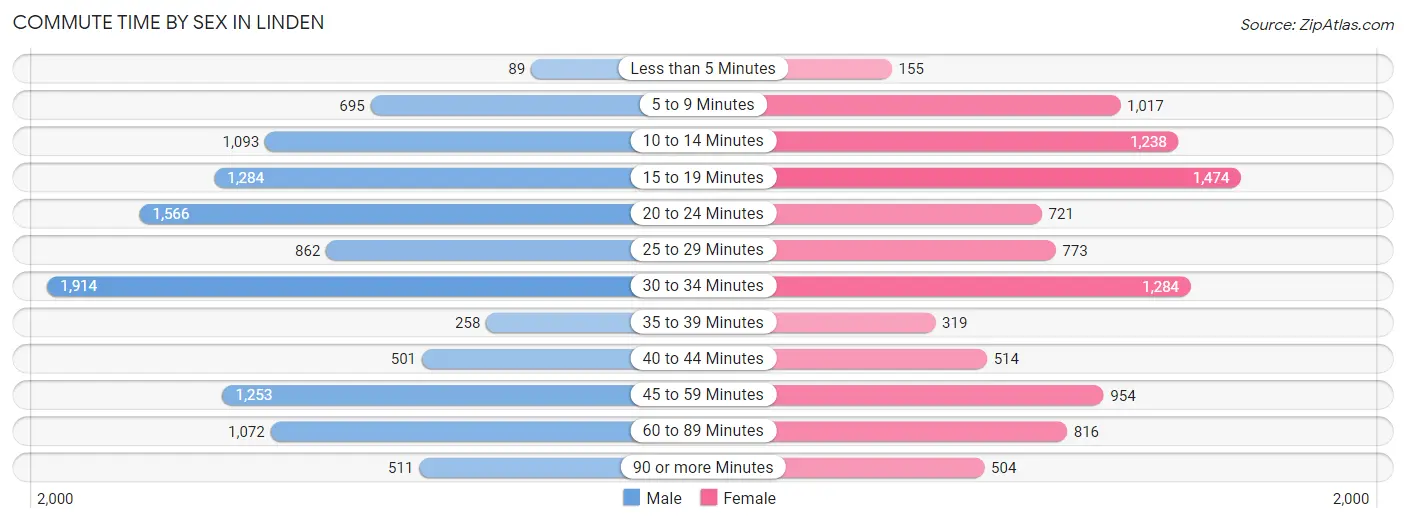
| Commute Time | Male | Female |
| Less than 5 Minutes | 89 (0.8%) | 155 (1.6%) |
| 5 to 9 Minutes | 695 (6.3%) | 1,017 (10.4%) |
| 10 to 14 Minutes | 1,093 (9.9%) | 1,238 (12.7%) |
| 15 to 19 Minutes | 1,284 (11.6%) | 1,474 (15.1%) |
| 20 to 24 Minutes | 1,566 (14.1%) | 721 (7.4%) |
| 25 to 29 Minutes | 862 (7.8%) | 773 (7.9%) |
| 30 to 34 Minutes | 1,914 (17.2%) | 1,284 (13.1%) |
| 35 to 39 Minutes | 258 (2.3%) | 319 (3.3%) |
| 40 to 44 Minutes | 501 (4.5%) | 514 (5.3%) |
| 45 to 59 Minutes | 1,253 (11.3%) | 954 (9.8%) |
| 60 to 89 Minutes | 1,072 (9.7%) | 816 (8.4%) |
| 90 or more Minutes | 511 (4.6%) | 504 (5.2%) |
Time of Departure to Work by Sex in Linden
The most frequent times of departure to work in Linden are 6:00 AM to 6:29 AM (1,342, 12.1%) for males and 8:00 AM to 8:29 AM (1,815, 18.6%) for females.
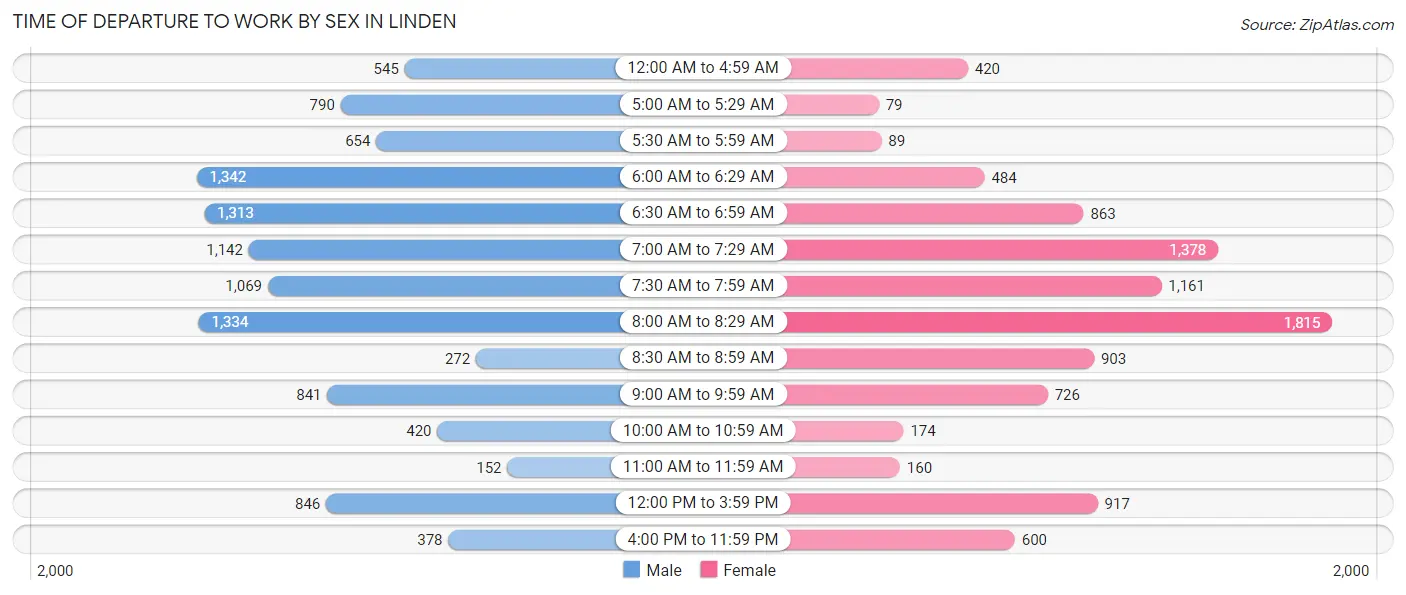
| Time of Departure | Male | Female |
| 12:00 AM to 4:59 AM | 545 (4.9%) | 420 (4.3%) |
| 5:00 AM to 5:29 AM | 790 (7.1%) | 79 (0.8%) |
| 5:30 AM to 5:59 AM | 654 (5.9%) | 89 (0.9%) |
| 6:00 AM to 6:29 AM | 1,342 (12.1%) | 484 (5.0%) |
| 6:30 AM to 6:59 AM | 1,313 (11.8%) | 863 (8.8%) |
| 7:00 AM to 7:29 AM | 1,142 (10.3%) | 1,378 (14.1%) |
| 7:30 AM to 7:59 AM | 1,069 (9.6%) | 1,161 (11.9%) |
| 8:00 AM to 8:29 AM | 1,334 (12.0%) | 1,815 (18.6%) |
| 8:30 AM to 8:59 AM | 272 (2.5%) | 903 (9.2%) |
| 9:00 AM to 9:59 AM | 841 (7.6%) | 726 (7.4%) |
| 10:00 AM to 10:59 AM | 420 (3.8%) | 174 (1.8%) |
| 11:00 AM to 11:59 AM | 152 (1.4%) | 160 (1.6%) |
| 12:00 PM to 3:59 PM | 846 (7.6%) | 917 (9.4%) |
| 4:00 PM to 11:59 PM | 378 (3.4%) | 600 (6.1%) |
| Total | 11,098 (100.0%) | 9,769 (100.0%) |
Housing Occupancy in Linden
Occupancy by Ownership in Linden
Of the total 15,219 dwellings in Linden, owner-occupied units account for 9,136 (60.0%), while renter-occupied units make up 6,083 (40.0%).
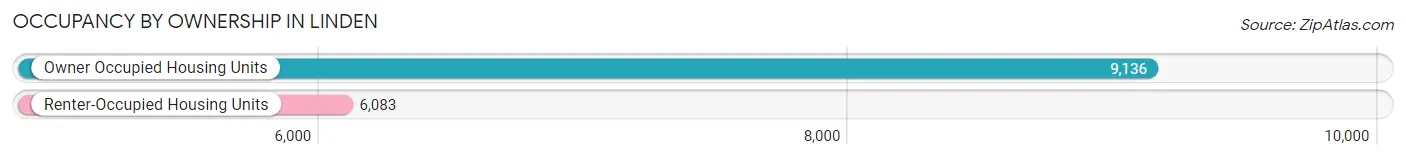
| Occupancy | # Housing Units | % Housing Units |
| Owner Occupied Housing Units | 9,136 | 60.0% |
| Renter-Occupied Housing Units | 6,083 | 40.0% |
| Total Occupied Housing Units | 15,219 | 100.0% |
Occupancy by Household Size in Linden
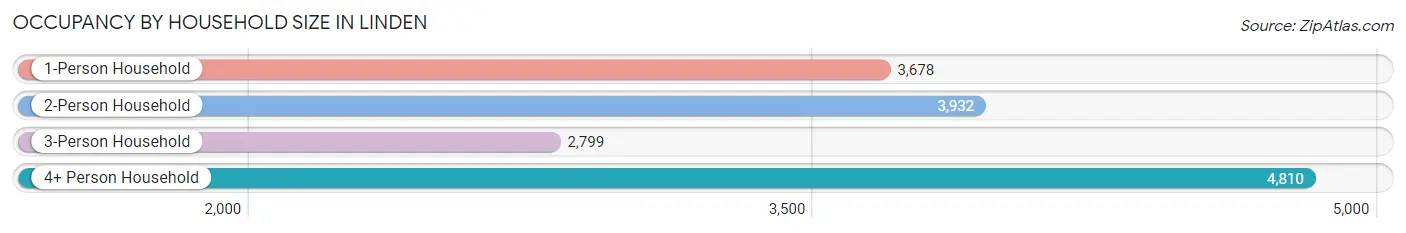
| Household Size | # Housing Units | % Housing Units |
| 1-Person Household | 3,678 | 24.2% |
| 2-Person Household | 3,932 | 25.8% |
| 3-Person Household | 2,799 | 18.4% |
| 4+ Person Household | 4,810 | 31.6% |
| Total Housing Units | 15,219 | 100.0% |
Occupancy by Ownership by Household Size in Linden
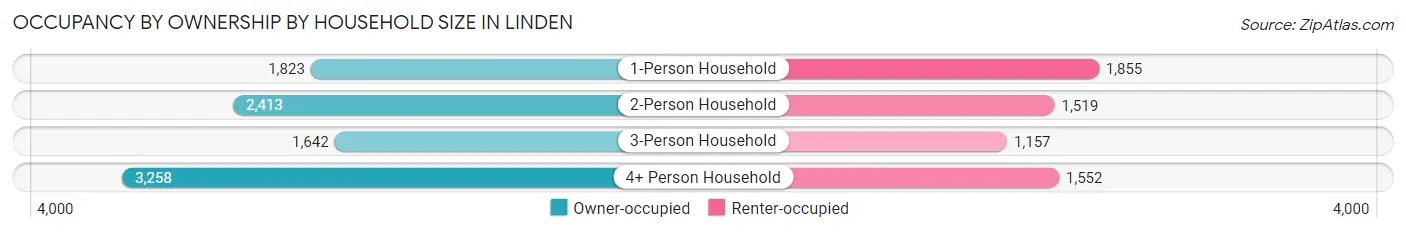
| Household Size | Owner-occupied | Renter-occupied |
| 1-Person Household | 1,823 (49.6%) | 1,855 (50.4%) |
| 2-Person Household | 2,413 (61.4%) | 1,519 (38.6%) |
| 3-Person Household | 1,642 (58.7%) | 1,157 (41.3%) |
| 4+ Person Household | 3,258 (67.7%) | 1,552 (32.3%) |
| Total Housing Units | 9,136 (60.0%) | 6,083 (40.0%) |
Occupancy by Educational Attainment in Linden
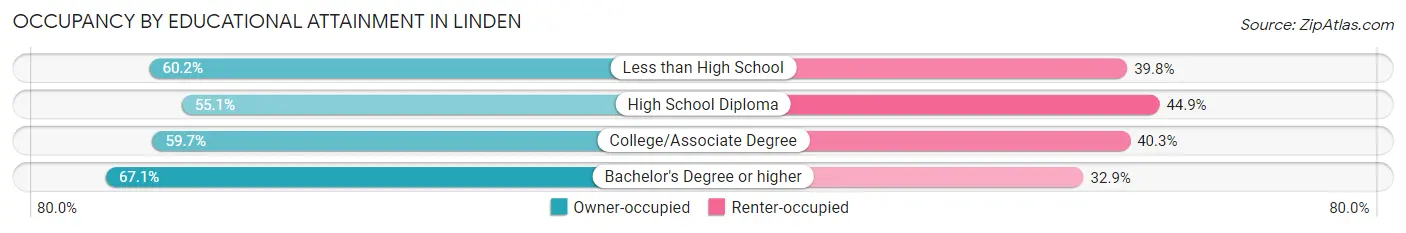
| Household Size | Owner-occupied | Renter-occupied |
| Less than High School | 1,085 (60.2%) | 718 (39.8%) |
| High School Diploma | 2,673 (55.1%) | 2,181 (44.9%) |
| College/Associate Degree | 2,958 (59.7%) | 1,997 (40.3%) |
| Bachelor's Degree or higher | 2,420 (67.1%) | 1,187 (32.9%) |
Occupancy by Age of Householder in Linden
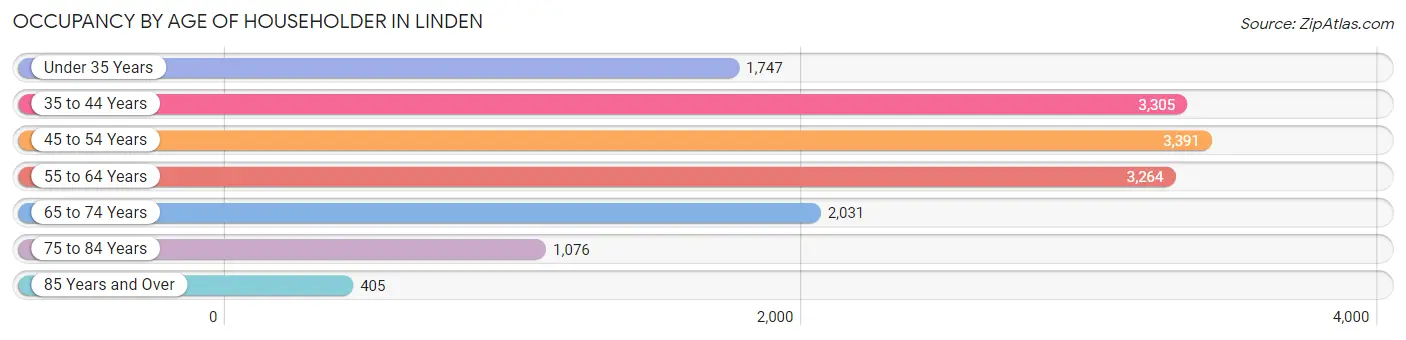
| Age Bracket | # Households | % Households |
| Under 35 Years | 1,747 | 11.5% |
| 35 to 44 Years | 3,305 | 21.7% |
| 45 to 54 Years | 3,391 | 22.3% |
| 55 to 64 Years | 3,264 | 21.4% |
| 65 to 74 Years | 2,031 | 13.4% |
| 75 to 84 Years | 1,076 | 7.1% |
| 85 Years and Over | 405 | 2.7% |
| Total | 15,219 | 100.0% |
Housing Finances in Linden
Median Income by Occupancy in Linden
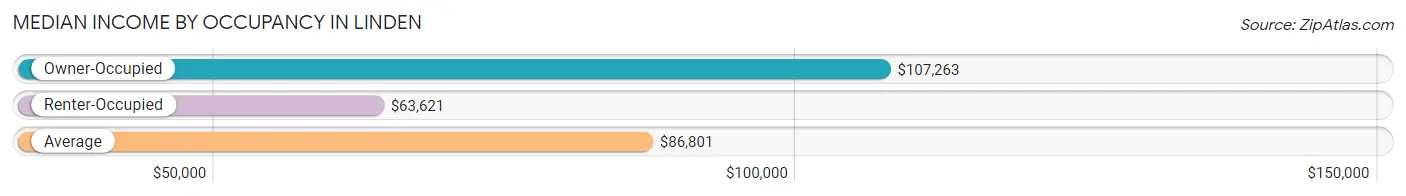
| Occupancy Type | # Households | Median Income |
| Owner-Occupied | 9,136 (60.0%) | $107,263 |
| Renter-Occupied | 6,083 (40.0%) | $63,621 |
| Average | 15,219 (100.0%) | $86,801 |
Occupancy by Householder Income Bracket in Linden
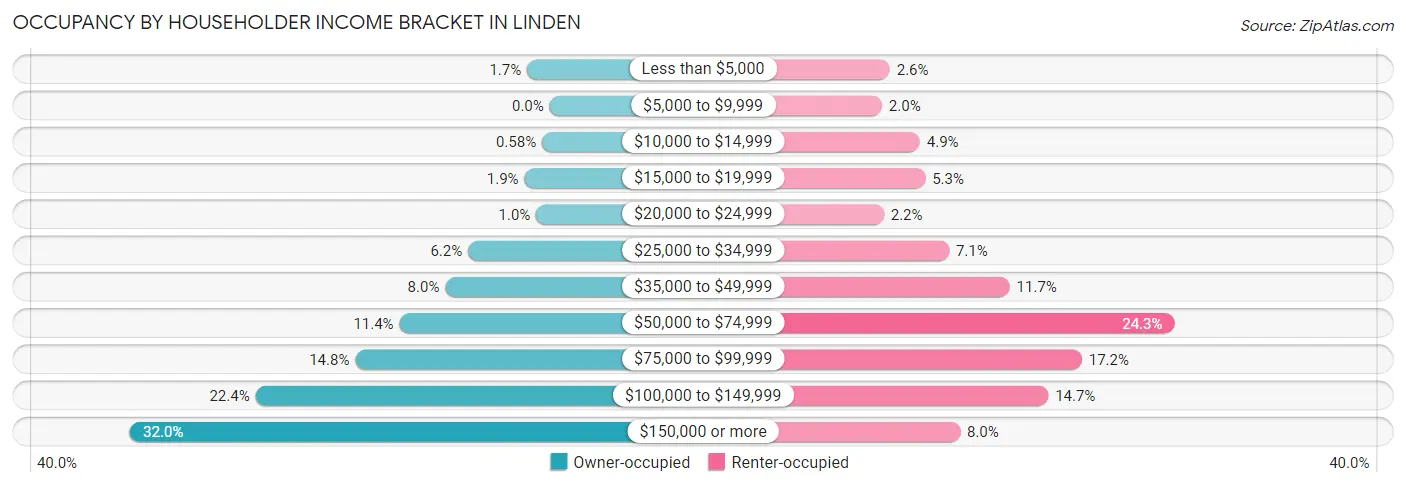
| Income Bracket | Owner-occupied | Renter-occupied |
| Less than $5,000 | 157 (1.7%) | 159 (2.6%) |
| $5,000 to $9,999 | 0 (0.0%) | 122 (2.0%) |
| $10,000 to $14,999 | 53 (0.6%) | 298 (4.9%) |
| $15,000 to $19,999 | 175 (1.9%) | 323 (5.3%) |
| $20,000 to $24,999 | 93 (1.0%) | 131 (2.1%) |
| $25,000 to $34,999 | 567 (6.2%) | 433 (7.1%) |
| $35,000 to $49,999 | 726 (8.0%) | 714 (11.7%) |
| $50,000 to $74,999 | 1,045 (11.4%) | 1,477 (24.3%) |
| $75,000 to $99,999 | 1,353 (14.8%) | 1,049 (17.2%) |
| $100,000 to $149,999 | 2,047 (22.4%) | 893 (14.7%) |
| $150,000 or more | 2,920 (32.0%) | 484 (8.0%) |
| Total | 9,136 (100.0%) | 6,083 (100.0%) |
Monthly Housing Cost Tiers in Linden
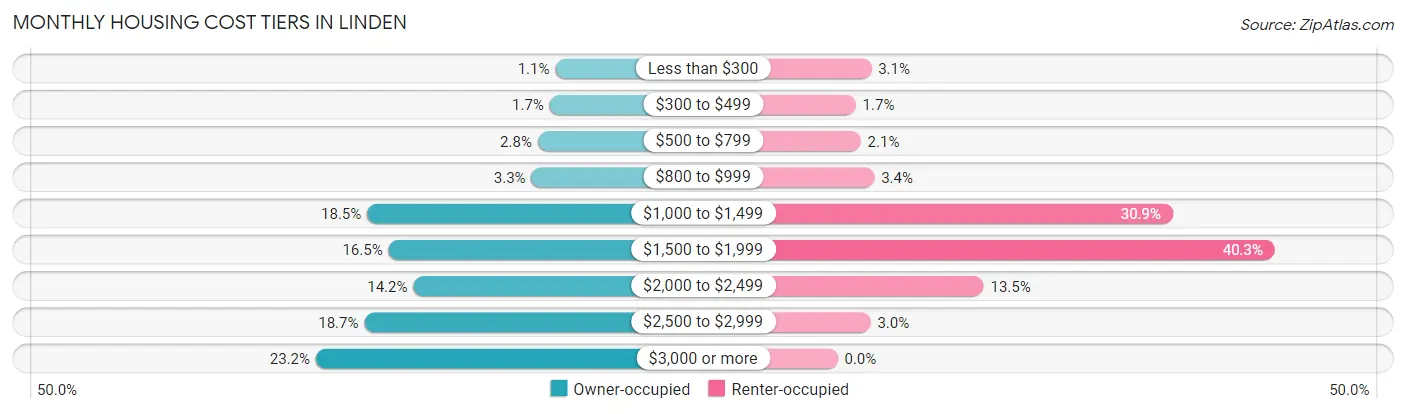
| Monthly Cost | Owner-occupied | Renter-occupied |
| Less than $300 | 104 (1.1%) | 189 (3.1%) |
| $300 to $499 | 152 (1.7%) | 102 (1.7%) |
| $500 to $799 | 252 (2.8%) | 130 (2.1%) |
| $800 to $999 | 305 (3.3%) | 206 (3.4%) |
| $1,000 to $1,499 | 1,687 (18.5%) | 1,878 (30.9%) |
| $1,500 to $1,999 | 1,507 (16.5%) | 2,449 (40.3%) |
| $2,000 to $2,499 | 1,299 (14.2%) | 818 (13.5%) |
| $2,500 to $2,999 | 1,711 (18.7%) | 185 (3.0%) |
| $3,000 or more | 2,119 (23.2%) | 0 (0.0%) |
| Total | 9,136 (100.0%) | 6,083 (100.0%) |
Physical Housing Characteristics in Linden
Housing Structures in Linden
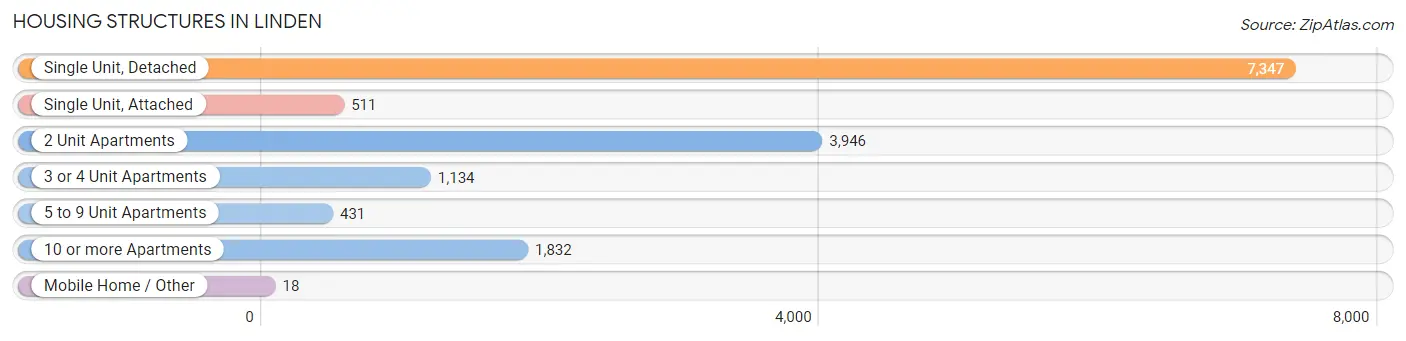
| Structure Type | # Housing Units | % Housing Units |
| Single Unit, Detached | 7,347 | 48.3% |
| Single Unit, Attached | 511 | 3.4% |
| 2 Unit Apartments | 3,946 | 25.9% |
| 3 or 4 Unit Apartments | 1,134 | 7.4% |
| 5 to 9 Unit Apartments | 431 | 2.8% |
| 10 or more Apartments | 1,832 | 12.0% |
| Mobile Home / Other | 18 | 0.1% |
| Total | 15,219 | 100.0% |
Housing Structures by Occupancy in Linden
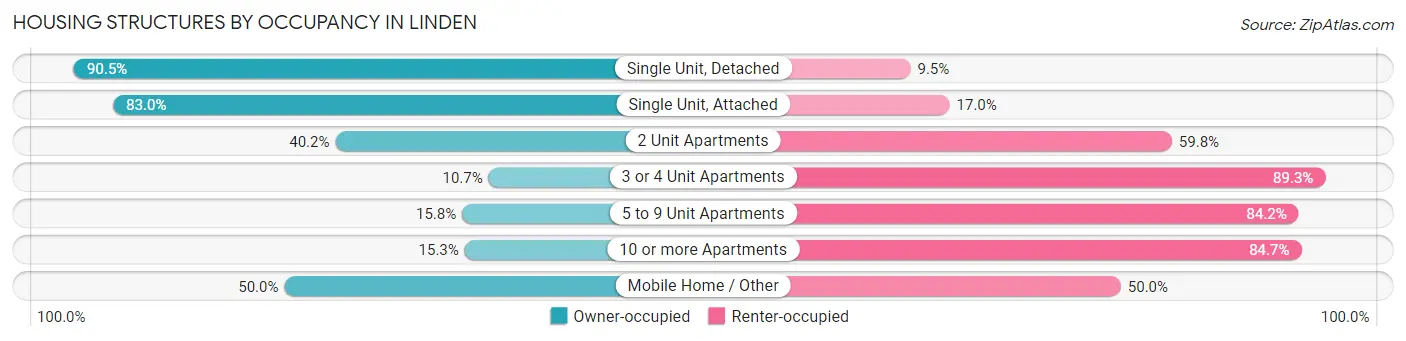
| Structure Type | Owner-occupied | Renter-occupied |
| Single Unit, Detached | 6,649 (90.5%) | 698 (9.5%) |
| Single Unit, Attached | 424 (83.0%) | 87 (17.0%) |
| 2 Unit Apartments | 1,585 (40.2%) | 2,361 (59.8%) |
| 3 or 4 Unit Apartments | 121 (10.7%) | 1,013 (89.3%) |
| 5 to 9 Unit Apartments | 68 (15.8%) | 363 (84.2%) |
| 10 or more Apartments | 280 (15.3%) | 1,552 (84.7%) |
| Mobile Home / Other | 9 (50.0%) | 9 (50.0%) |
| Total | 9,136 (60.0%) | 6,083 (40.0%) |
Housing Structures by Number of Rooms in Linden
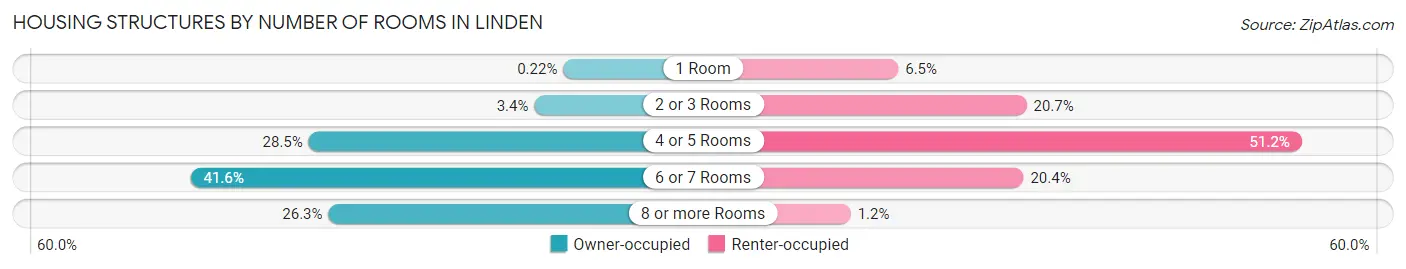
| Number of Rooms | Owner-occupied | Renter-occupied |
| 1 Room | 20 (0.2%) | 394 (6.5%) |
| 2 or 3 Rooms | 313 (3.4%) | 1,260 (20.7%) |
| 4 or 5 Rooms | 2,602 (28.5%) | 3,117 (51.2%) |
| 6 or 7 Rooms | 3,799 (41.6%) | 1,239 (20.4%) |
| 8 or more Rooms | 2,402 (26.3%) | 73 (1.2%) |
| Total | 9,136 (100.0%) | 6,083 (100.0%) |
Housing Structure by Heating Type in Linden
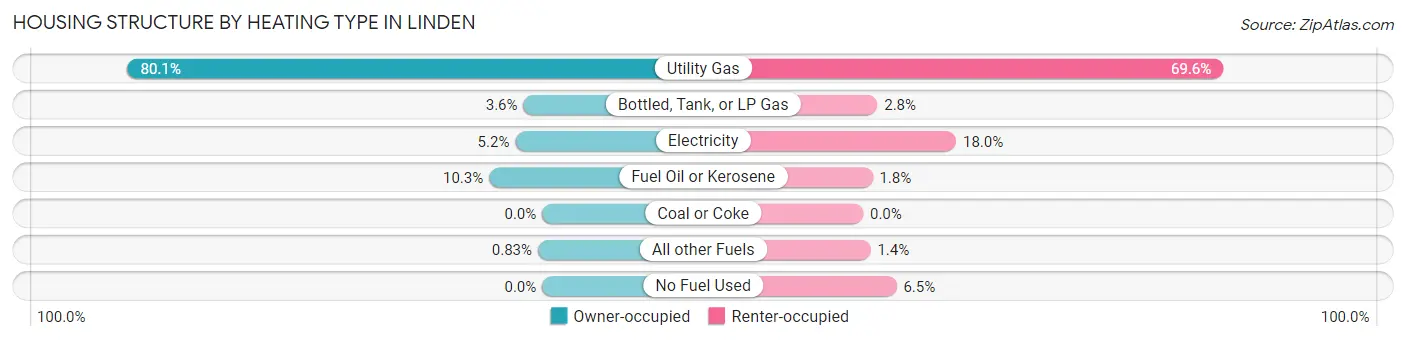
| Heating Type | Owner-occupied | Renter-occupied |
| Utility Gas | 7,319 (80.1%) | 4,232 (69.6%) |
| Bottled, Tank, or LP Gas | 331 (3.6%) | 167 (2.8%) |
| Electricity | 474 (5.2%) | 1,093 (18.0%) |
| Fuel Oil or Kerosene | 936 (10.2%) | 111 (1.8%) |
| Coal or Coke | 0 (0.0%) | 0 (0.0%) |
| All other Fuels | 76 (0.8%) | 87 (1.4%) |
| No Fuel Used | 0 (0.0%) | 393 (6.5%) |
| Total | 9,136 (100.0%) | 6,083 (100.0%) |
Household Vehicle Usage in Linden
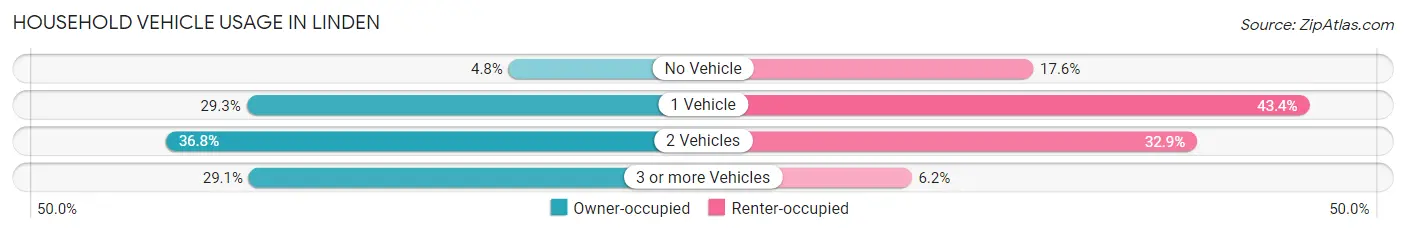
| Vehicles per Household | Owner-occupied | Renter-occupied |
| No Vehicle | 440 (4.8%) | 1,069 (17.6%) |
| 1 Vehicle | 2,676 (29.3%) | 2,637 (43.3%) |
| 2 Vehicles | 3,364 (36.8%) | 1,999 (32.9%) |
| 3 or more Vehicles | 2,656 (29.1%) | 378 (6.2%) |
| Total | 9,136 (100.0%) | 6,083 (100.0%) |
Real Estate & Mortgages in Linden
Real Estate and Mortgage Overview in Linden
| Characteristic | Without Mortgage | With Mortgage |
| Housing Units | 2,689 | 6,447 |
| Median Property Value | $351,400 | $359,400 |
| Median Household Income | $86,193 | $2,353 |
| Monthly Housing Costs | $1,286 | $2,068 |
| Real Estate Taxes | $10,001 | $174 |
Property Value by Mortgage Status in Linden
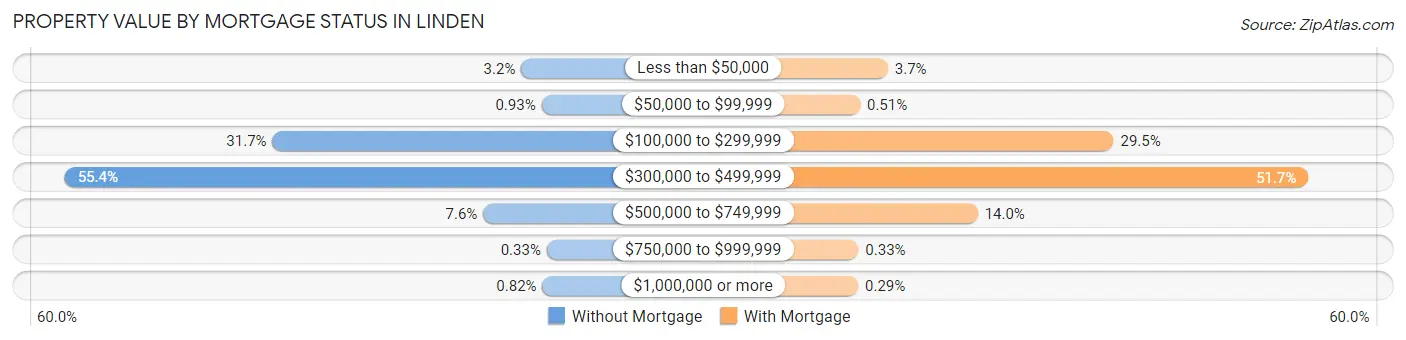
| Property Value | Without Mortgage | With Mortgage |
| Less than $50,000 | 87 (3.2%) | 238 (3.7%) |
| $50,000 to $99,999 | 25 (0.9%) | 33 (0.5%) |
| $100,000 to $299,999 | 852 (31.7%) | 1,901 (29.5%) |
| $300,000 to $499,999 | 1,490 (55.4%) | 3,335 (51.7%) |
| $500,000 to $749,999 | 204 (7.6%) | 900 (14.0%) |
| $750,000 to $999,999 | 9 (0.3%) | 21 (0.3%) |
| $1,000,000 or more | 22 (0.8%) | 19 (0.3%) |
| Total | 2,689 (100.0%) | 6,447 (100.0%) |
Household Income by Mortgage Status in Linden
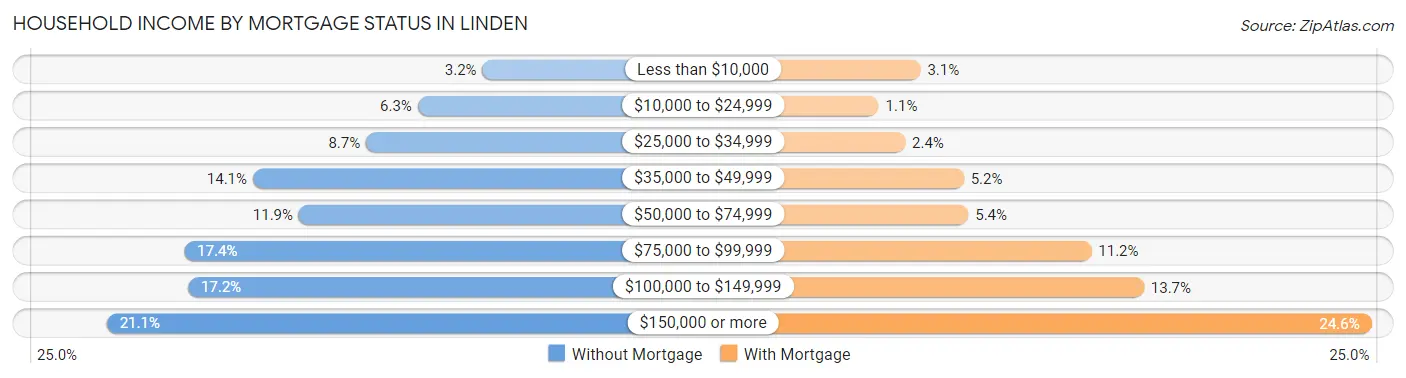
| Household Income | Without Mortgage | With Mortgage |
| Less than $10,000 | 86 (3.2%) | 199 (3.1%) |
| $10,000 to $24,999 | 169 (6.3%) | 71 (1.1%) |
| $25,000 to $34,999 | 235 (8.7%) | 152 (2.4%) |
| $35,000 to $49,999 | 380 (14.1%) | 332 (5.1%) |
| $50,000 to $74,999 | 321 (11.9%) | 346 (5.4%) |
| $75,000 to $99,999 | 468 (17.4%) | 724 (11.2%) |
| $100,000 to $149,999 | 463 (17.2%) | 885 (13.7%) |
| $150,000 or more | 567 (21.1%) | 1,584 (24.6%) |
| Total | 2,689 (100.0%) | 6,447 (100.0%) |
Property Value to Household Income Ratio in Linden
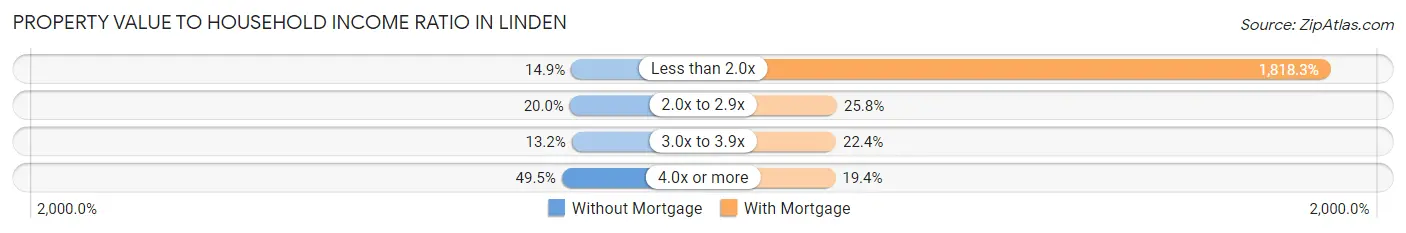
| Value-to-Income Ratio | Without Mortgage | With Mortgage |
| Less than 2.0x | 401 (14.9%) | 117,228 (1,818.3%) |
| 2.0x to 2.9x | 539 (20.0%) | 1,664 (25.8%) |
| 3.0x to 3.9x | 355 (13.2%) | 1,441 (22.4%) |
| 4.0x or more | 1,331 (49.5%) | 1,252 (19.4%) |
| Total | 2,689 (100.0%) | 6,447 (100.0%) |
Real Estate Taxes by Mortgage Status in Linden
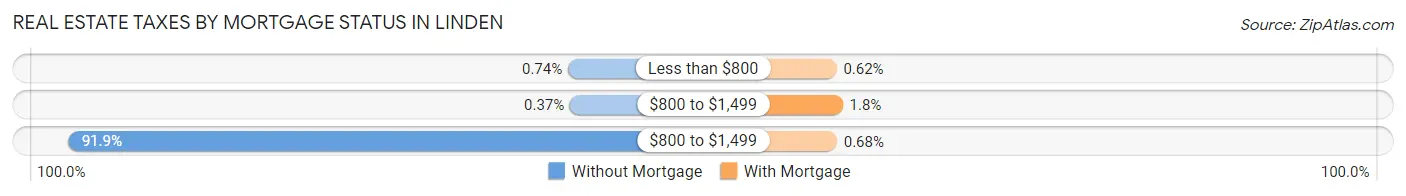
| Property Taxes | Without Mortgage | With Mortgage |
| Less than $800 | 20 (0.7%) | 40 (0.6%) |
| $800 to $1,499 | 10 (0.4%) | 113 (1.8%) |
| $800 to $1,499 | 2,472 (91.9%) | 44 (0.7%) |
| Total | 2,689 (100.0%) | 6,447 (100.0%) |
Health & Disability in Linden
Health Insurance Coverage by Age in Linden
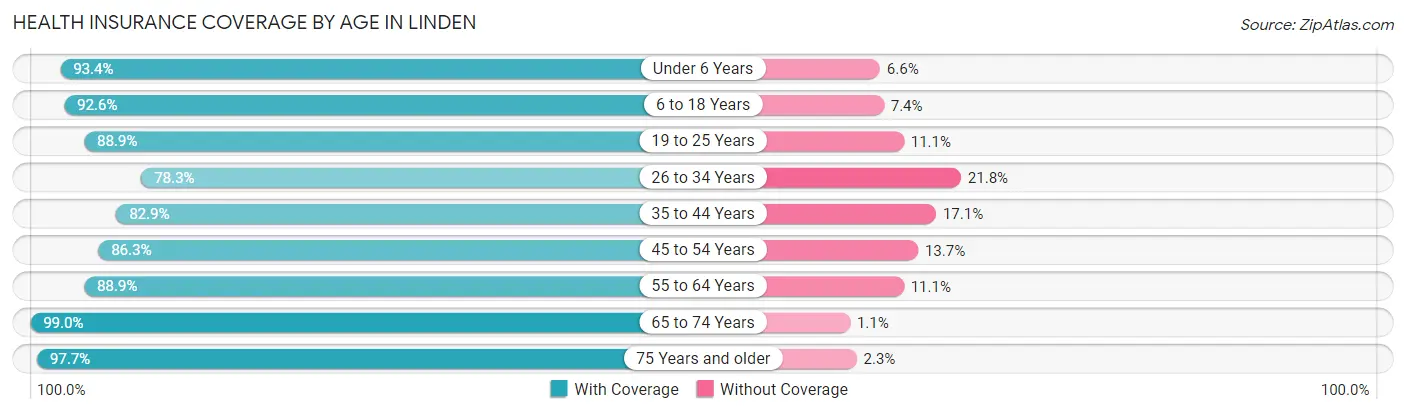
| Age Bracket | With Coverage | Without Coverage |
| Under 6 Years | 2,769 (93.4%) | 197 (6.6%) |
| 6 to 18 Years | 6,295 (92.6%) | 500 (7.4%) |
| 19 to 25 Years | 3,264 (88.9%) | 407 (11.1%) |
| 26 to 34 Years | 4,216 (78.2%) | 1,172 (21.7%) |
| 35 to 44 Years | 5,114 (82.9%) | 1,055 (17.1%) |
| 45 to 54 Years | 5,405 (86.3%) | 861 (13.7%) |
| 55 to 64 Years | 5,480 (88.9%) | 683 (11.1%) |
| 65 to 74 Years | 3,394 (99.0%) | 36 (1.1%) |
| 75 Years and older | 2,341 (97.7%) | 55 (2.3%) |
| Total | 38,278 (88.5%) | 4,966 (11.5%) |
Health Insurance Coverage by Citizenship Status in Linden
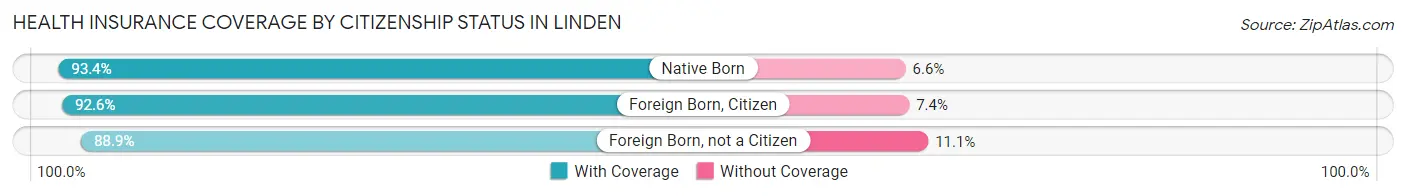
| Citizenship Status | With Coverage | Without Coverage |
| Native Born | 2,769 (93.4%) | 197 (6.6%) |
| Foreign Born, Citizen | 6,295 (92.6%) | 500 (7.4%) |
| Foreign Born, not a Citizen | 3,264 (88.9%) | 407 (11.1%) |
Health Insurance Coverage by Household Income in Linden
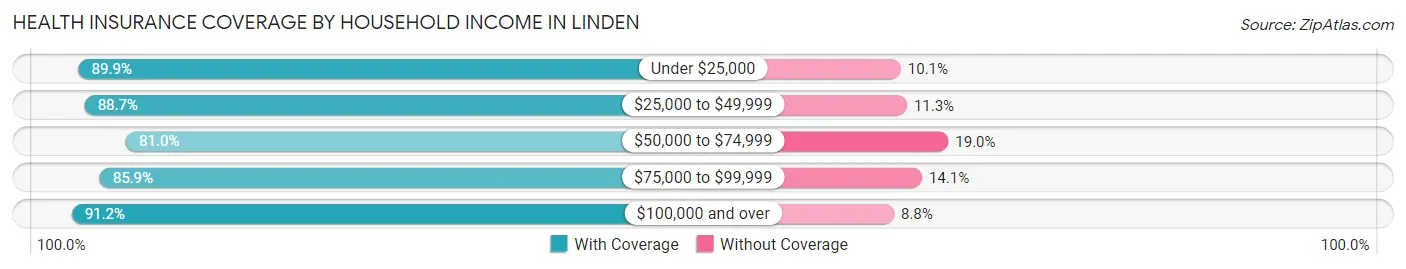
| Household Income | With Coverage | Without Coverage |
| Under $25,000 | 2,254 (89.9%) | 254 (10.1%) |
| $25,000 to $49,999 | 4,630 (88.7%) | 588 (11.3%) |
| $50,000 to $74,999 | 4,987 (81.0%) | 1,172 (19.0%) |
| $75,000 to $99,999 | 5,894 (85.9%) | 967 (14.1%) |
| $100,000 and over | 20,487 (91.2%) | 1,984 (8.8%) |
Public vs Private Health Insurance Coverage by Age in Linden
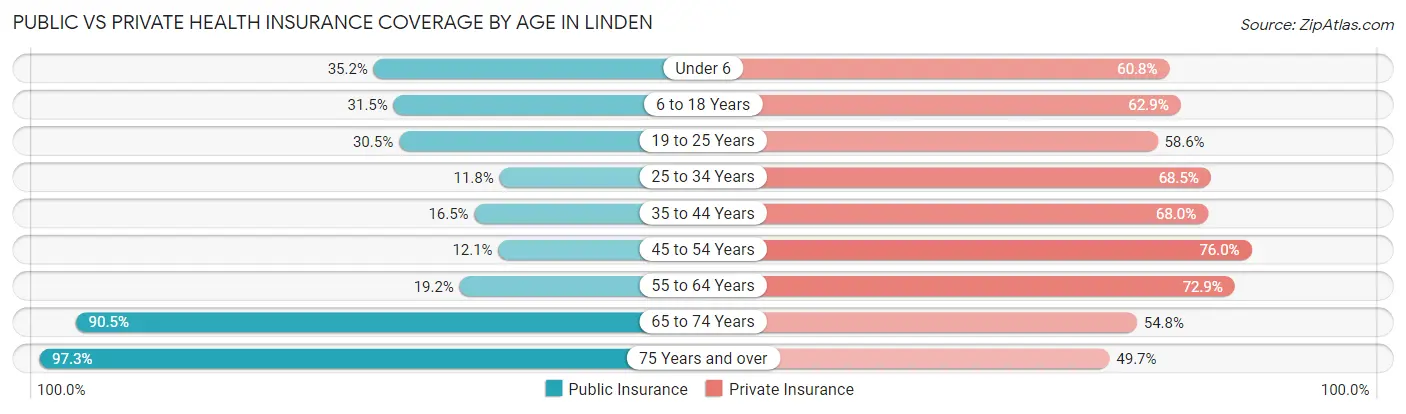
| Age Bracket | Public Insurance | Private Insurance |
| Under 6 | 1,044 (35.2%) | 1,803 (60.8%) |
| 6 to 18 Years | 2,141 (31.5%) | 4,272 (62.9%) |
| 19 to 25 Years | 1,120 (30.5%) | 2,151 (58.6%) |
| 25 to 34 Years | 638 (11.8%) | 3,689 (68.5%) |
| 35 to 44 Years | 1,018 (16.5%) | 4,193 (68.0%) |
| 45 to 54 Years | 755 (12.0%) | 4,764 (76.0%) |
| 55 to 64 Years | 1,186 (19.2%) | 4,494 (72.9%) |
| 65 to 74 Years | 3,105 (90.5%) | 1,878 (54.7%) |
| 75 Years and over | 2,331 (97.3%) | 1,190 (49.7%) |
| Total | 13,338 (30.8%) | 28,434 (65.7%) |
Disability Status by Sex by Age in Linden
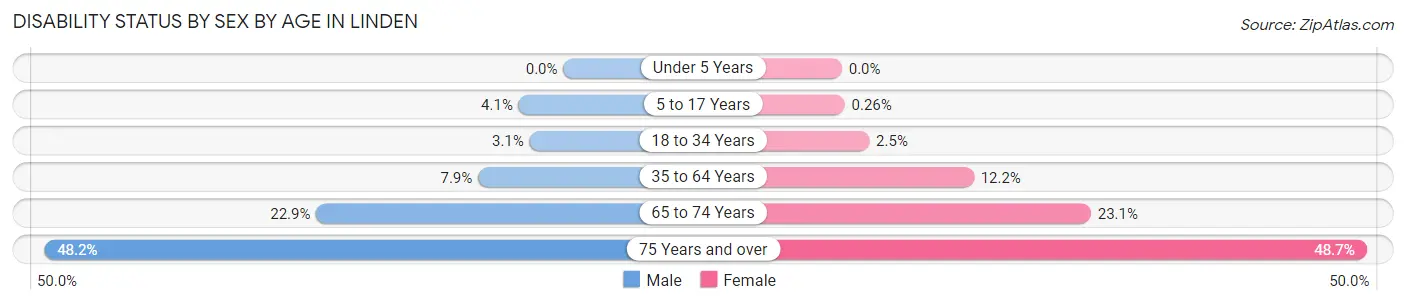
| Age Bracket | Male | Female |
| Under 5 Years | 0 (0.0%) | 0 (0.0%) |
| 5 to 17 Years | 155 (4.1%) | 8 (0.3%) |
| 18 to 34 Years | 138 (3.1%) | 130 (2.5%) |
| 35 to 64 Years | 761 (7.9%) | 1,099 (12.2%) |
| 65 to 74 Years | 352 (22.9%) | 438 (23.1%) |
| 75 Years and over | 437 (48.2%) | 725 (48.7%) |
Disability Class by Sex by Age in Linden
Disability Class: Hearing Difficulty
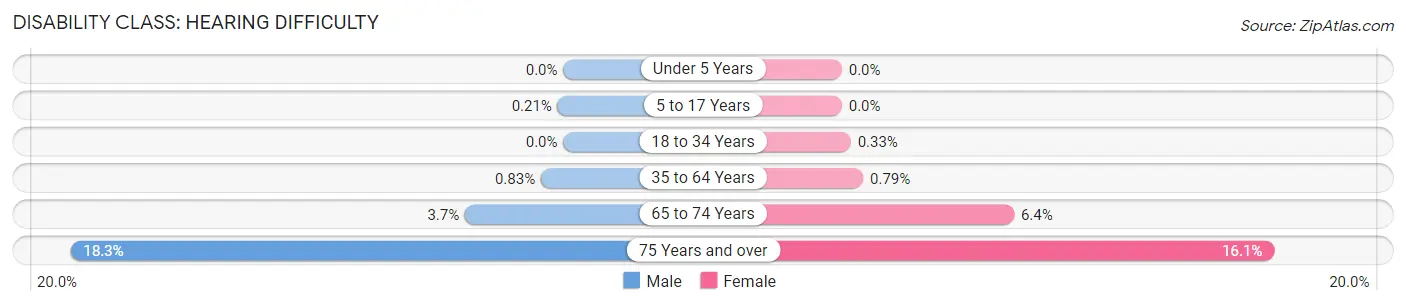
| Age Bracket | Male | Female |
| Under 5 Years | 0 (0.0%) | 0 (0.0%) |
| 5 to 17 Years | 8 (0.2%) | 0 (0.0%) |
| 18 to 34 Years | 0 (0.0%) | 17 (0.3%) |
| 35 to 64 Years | 80 (0.8%) | 71 (0.8%) |
| 65 to 74 Years | 56 (3.6%) | 121 (6.4%) |
| 75 Years and over | 166 (18.3%) | 239 (16.1%) |
Disability Class: Vision Difficulty
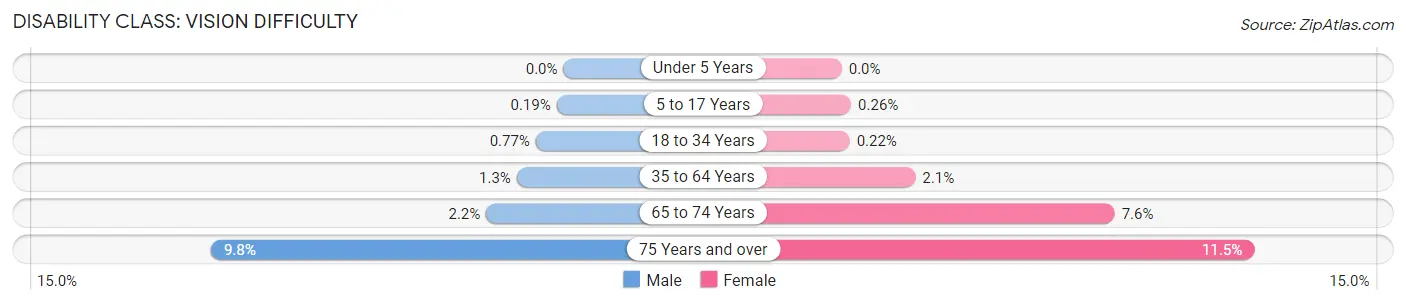
| Age Bracket | Male | Female |
| Under 5 Years | 0 (0.0%) | 0 (0.0%) |
| 5 to 17 Years | 7 (0.2%) | 8 (0.3%) |
| 18 to 34 Years | 34 (0.8%) | 11 (0.2%) |
| 35 to 64 Years | 125 (1.3%) | 184 (2.1%) |
| 65 to 74 Years | 33 (2.1%) | 144 (7.6%) |
| 75 Years and over | 89 (9.8%) | 171 (11.5%) |
Disability Class: Cognitive Difficulty
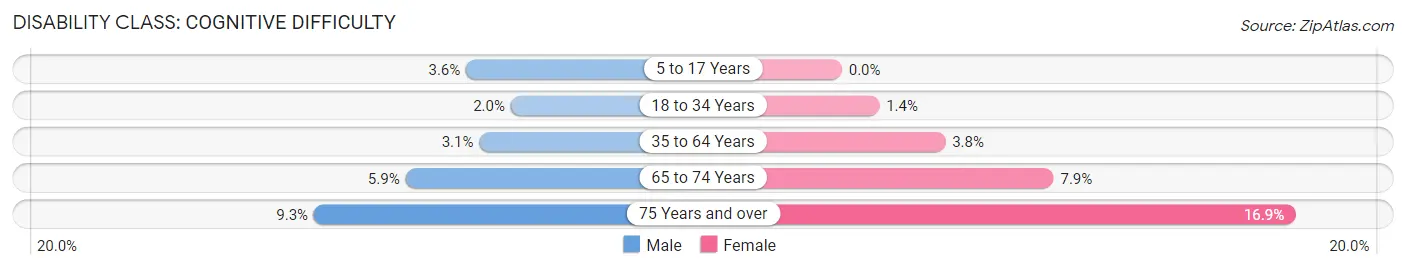
| Age Bracket | Male | Female |
| 5 to 17 Years | 135 (3.6%) | 0 (0.0%) |
| 18 to 34 Years | 86 (1.9%) | 71 (1.4%) |
| 35 to 64 Years | 300 (3.1%) | 345 (3.8%) |
| 65 to 74 Years | 90 (5.9%) | 149 (7.9%) |
| 75 Years and over | 84 (9.3%) | 251 (16.9%) |
Disability Class: Ambulatory Difficulty
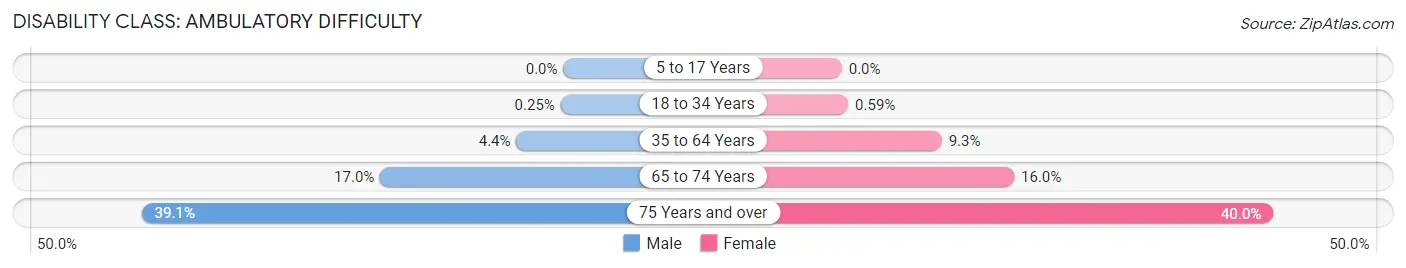
| Age Bracket | Male | Female |
| 5 to 17 Years | 0 (0.0%) | 0 (0.0%) |
| 18 to 34 Years | 11 (0.3%) | 30 (0.6%) |
| 35 to 64 Years | 419 (4.4%) | 832 (9.3%) |
| 65 to 74 Years | 261 (17.0%) | 303 (16.0%) |
| 75 Years and over | 355 (39.1%) | 596 (40.0%) |
Disability Class: Self-Care Difficulty
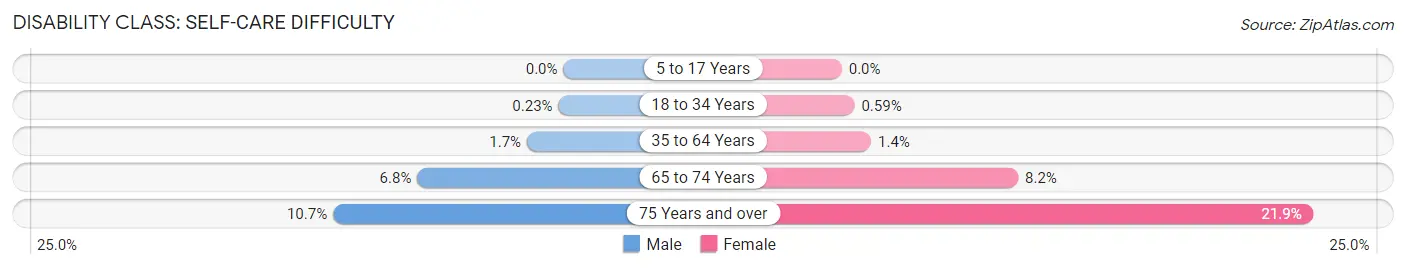
| Age Bracket | Male | Female |
| 5 to 17 Years | 0 (0.0%) | 0 (0.0%) |
| 18 to 34 Years | 10 (0.2%) | 30 (0.6%) |
| 35 to 64 Years | 163 (1.7%) | 122 (1.4%) |
| 65 to 74 Years | 104 (6.8%) | 155 (8.2%) |
| 75 Years and over | 97 (10.7%) | 326 (21.9%) |
Technology Access in Linden
Computing Device Access in Linden
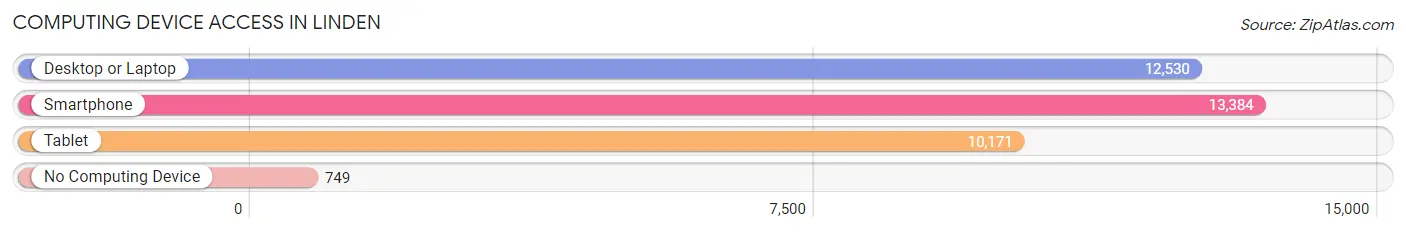
| Device Type | # Households | % Households |
| Desktop or Laptop | 12,530 | 82.3% |
| Smartphone | 13,384 | 87.9% |
| Tablet | 10,171 | 66.8% |
| No Computing Device | 749 | 4.9% |
| Total | 15,219 | 100.0% |
Internet Access in Linden
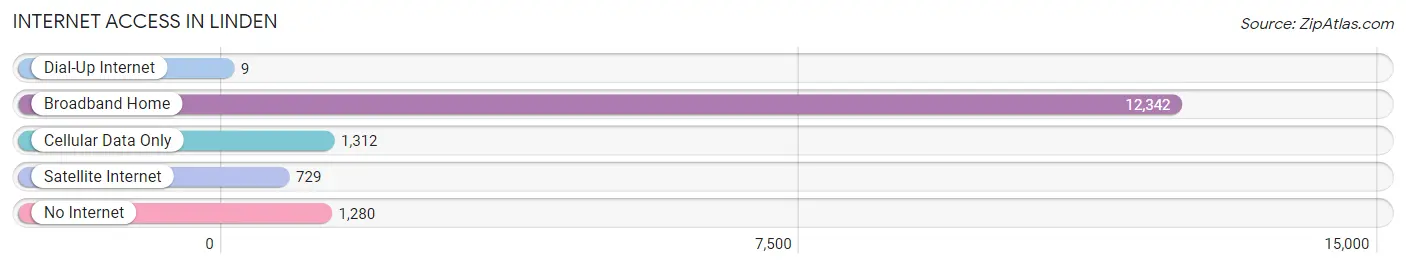
| Internet Type | # Households | % Households |
| Dial-Up Internet | 9 | 0.1% |
| Broadband Home | 12,342 | 81.1% |
| Cellular Data Only | 1,312 | 8.6% |
| Satellite Internet | 729 | 4.8% |
| No Internet | 1,280 | 8.4% |
| Total | 15,219 | 100.0% |
Linden Summary
Linden, New Jersey is a city located in Union County, New Jersey. It is situated on the banks of the Rahway River and is part of the New York metropolitan area. The city has a population of approximately 40,499 people, according to the 2010 United States Census.
Geography
Linden is located at 40°37'N 74°14'W (40.619, -74.233). It is bordered by Elizabeth to the north, Rahway to the east, Clark to the south, and Roselle Park to the west. The city has a total area of 5.8 square miles, all of which is land.
History
The area that is now Linden was originally inhabited by the Lenape Native Americans. The first European settlers arrived in the area in the late 17th century. The area was originally part of Elizabethtown, but was incorporated as a separate town in 1861. The town was named after the linden trees that grew in the area.
In 1925, Linden was incorporated as a city. During World War II, the city was home to a large military base, which was used to train soldiers for the war effort. After the war, the base was closed and the city began to experience a period of growth and development.
Economy
Linden has a diverse economy, with a variety of industries represented. The city is home to several large companies, including Merck & Co., Honeywell International, and PSE&G. The city also has a number of small businesses, including restaurants, retail stores, and professional services.
The city is also home to a number of industrial parks, which provide employment opportunities for many of the city's residents. The city is also home to a number of transportation companies, including UPS, FedEx, and DHL.
Demographics
According to the 2010 United States Census, the population of Linden was 40,499. The racial makeup of the city was 57.2% White, 28.2% African American, 0.3% Native American, 5.2% Asian, 0.1% Pacific Islander, 5.3% from other races, and 3.7% from two or more races. Hispanic or Latino of any race were 15.2% of the population.
The median income for a household in the city was $50,945, and the median income for a family was $60,945. The per capita income for the city was $23,945. About 11.2% of families and 13.7% of the population were below the poverty line, including 19.2% of those under age 18 and 8.2% of those age 65 or over.
Linden is a diverse city, with a variety of cultures and backgrounds represented. The city is home to a large Italian-American population, as well as a large Hispanic population. The city also has a large African-American population, as well as a growing Asian population.
Common Questions
What is Per Capita Income in Linden?
Per Capita income in Linden is $36,207.
What is the Median Family Income in Linden?
Median Family Income in Linden is $95,897.
What is the Median Household income in Linden?
Median Household Income in Linden is $86,801.
What is Income or Wage Gap in Linden?
Income or Wage Gap in Linden is 34.2%.
Women in Linden earn 65.8 cents for every dollar earned by a man.
What is Family Income Deficit in Linden?
Family Income Deficit in Linden is $10,628.
Families that are below poverty line in Linden earn $10,628 less on average than the poverty threshold level.
What is Inequality or Gini Index in Linden?
Inequality or Gini Index in Linden is 0.38.
What is the Total Population of Linden?
Total Population of Linden is 43,478.
What is the Total Male Population of Linden?
Total Male Population of Linden is 21,332.
What is the Total Female Population of Linden?
Total Female Population of Linden is 22,146.
What is the Ratio of Males per 100 Females in Linden?
There are 96.32 Males per 100 Females in Linden.
What is the Ratio of Females per 100 Males in Linden?
There are 103.82 Females per 100 Males in Linden.
What is the Median Population Age in Linden?
Median Population Age in Linden is 40.0 Years.
What is the Average Family Size in Linden
Average Family Size in Linden is 3.4 People.
What is the Average Household Size in Linden
Average Household Size in Linden is 2.8 People.
How Large is the Labor Force in Linden?
There are 24,725 People in the Labor Forcein in Linden.
What is the Percentage of People in the Labor Force in Linden?
70.1% of People are in the Labor Force in Linden.
What is the Unemployment Rate in Linden?
Unemployment Rate in Linden is 7.9%.