Cities with the Highest Percentage of Hispanic or Latino Population in South Dakota
RELATED REPORTS & OPTIONS
Hispanic or Latino
South Dakota
Compare Cities
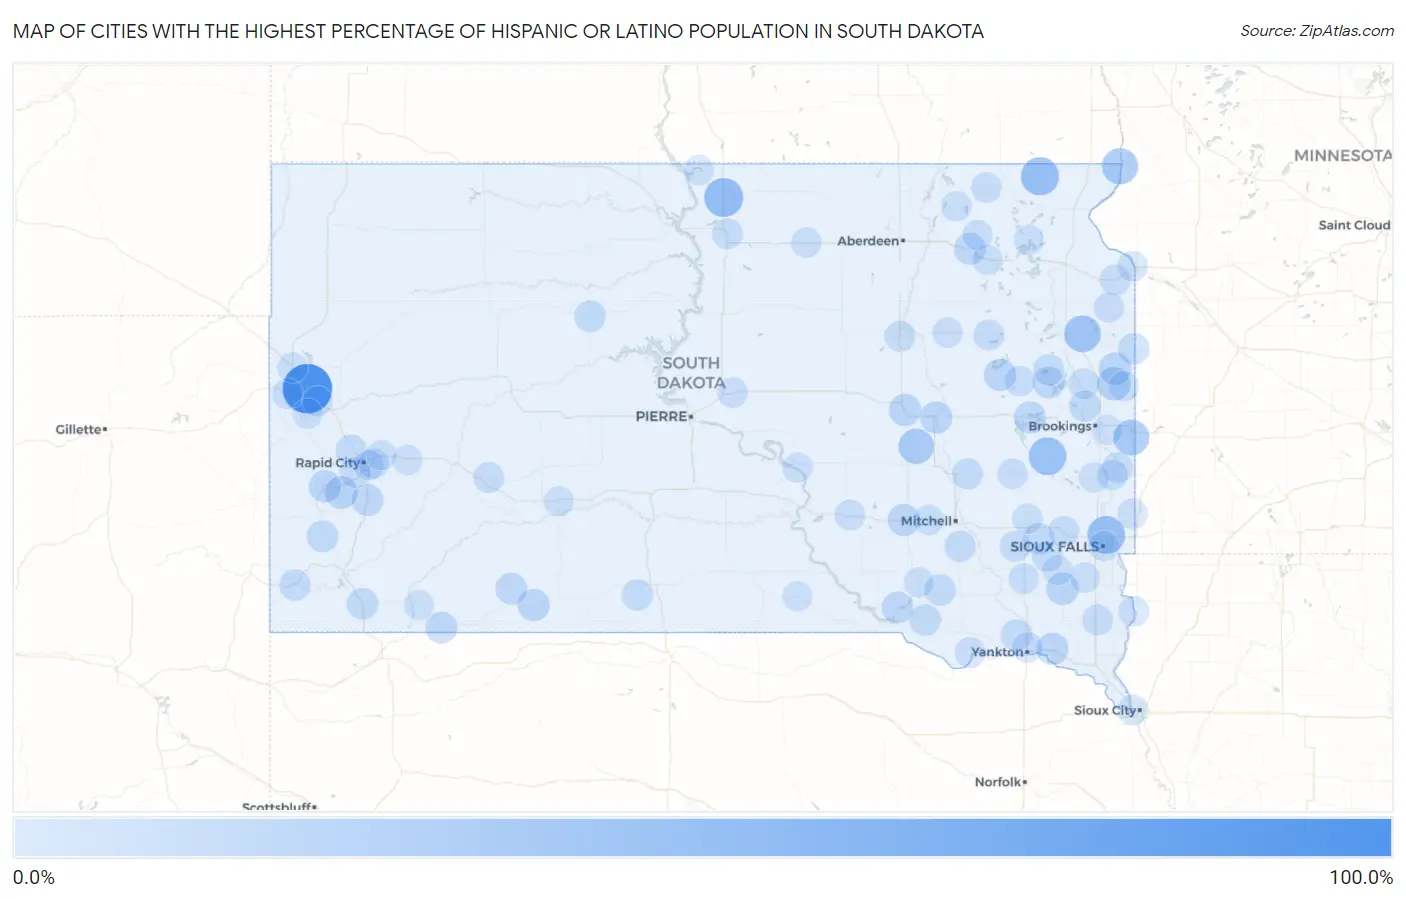
Map of Cities with the Highest Percentage of Hispanic or Latino Population in South Dakota
0.0%
100.0%
Cities with the Highest Percentage of Hispanic or Latino Population in South Dakota
| City | Hispanic or Latino | vs State | vs National | |
| 1. | St Onge | 100.0% | 4.4%(+95.6)#1 | 18.7%(+81.3)#377 |
| 2. | Mound City | 46.7% | 4.4%(+42.3)#2 | 18.7%(+28.0)#2,127 |
| 3. | Veblen | 43.0% | 4.4%(+38.6)#3 | 18.7%(+24.4)#2,327 |
| 4. | Meadow View Addition | 42.3% | 4.4%(+37.9)#4 | 18.7%(+23.6)#2,376 |
| 5. | Ramona | 40.5% | 4.4%(+36.1)#5 | 18.7%(+21.8)#2,475 |
| 6. | Kranzburg | 36.0% | 4.4%(+31.6)#6 | 18.7%(+17.4)#2,804 |
| 7. | White Rock | 33.3% | 4.4%(+28.9)#7 | 18.7%(+14.7)#3,043 |
| 8. | Elkton | 31.4% | 4.4%(+27.0)#8 | 18.7%(+12.8)#3,239 |
| 9. | Alpena | 29.2% | 4.4%(+24.8)#9 | 18.7%(+10.6)#3,478 |
| 10. | Boulder Canyon | 24.4% | 4.4%(+20.0)#10 | 18.7%(+5.77)#4,110 |
| 11. | Toronto | 20.3% | 4.4%(+15.9)#11 | 18.7%(+1.66)#4,893 |
| 12. | Keystone | 17.7% | 4.4%(+13.3)#12 | 18.7%(-0.990)#5,537 |
| 13. | Brandt | 16.8% | 4.4%(+12.4)#13 | 18.7%(-1.85)#5,785 |
| 14. | Hurley | 16.3% | 4.4%(+11.9)#14 | 18.7%(-2.37)#5,949 |
| 15. | Hill City | 15.1% | 4.4%(+10.7)#15 | 18.7%(-3.57)#6,330 |
| 16. | Willow Lake | 15.0% | 4.4%(+10.6)#16 | 18.7%(-3.65)#6,353 |
| 17. | Wolsey | 14.9% | 4.4%(+10.5)#17 | 18.7%(-3.75)#6,394 |
| 18. | Plankinton | 14.9% | 4.4%(+10.4)#18 | 18.7%(-3.80)#6,415 |
| 19. | Huron | 14.7% | 4.4%(+10.3)#19 | 18.7%(-3.92)#6,470 |
| 20. | Martin | 14.4% | 4.4%(+10.0)#20 | 18.7%(-4.22)#6,575 |
| 21. | Gayville | 14.3% | 4.4%(+9.88)#21 | 18.7%(-4.37)#6,619 |
| 22. | Lake Preston | 13.7% | 4.4%(+9.28)#22 | 18.7%(-4.97)#6,836 |
| 23. | Lake Norden | 13.6% | 4.4%(+9.25)#23 | 18.7%(-5.00)#6,846 |
| 24. | Andover | 13.6% | 4.4%(+9.23)#24 | 18.7%(-5.02)#6,852 |
| 25. | Hermosa | 13.1% | 4.4%(+8.65)#25 | 18.7%(-5.60)#7,110 |
| 26. | Pine Ridge | 12.8% | 4.4%(+8.44)#26 | 18.7%(-5.81)#7,212 |
| 27. | Lake Andes | 12.7% | 4.4%(+8.30)#27 | 18.7%(-5.95)#7,277 |
| 28. | Allen | 12.5% | 4.4%(+8.12)#28 | 18.7%(-6.12)#7,345 |
| 29. | Canistota | 12.1% | 4.4%(+7.69)#29 | 18.7%(-6.56)#7,554 |
| 30. | Pringle | 11.8% | 4.4%(+7.36)#30 | 18.7%(-6.89)#7,713 |
| 31. | Oelrichs | 11.7% | 4.4%(+7.33)#31 | 18.7%(-6.91)#7,729 |
| 32. | Delmont | 11.4% | 4.4%(+6.97)#32 | 18.7%(-7.28)#7,924 |
| 33. | Gary | 11.2% | 4.4%(+6.84)#33 | 18.7%(-7.41)#7,996 |
| 34. | Wagner | 11.2% | 4.4%(+6.83)#34 | 18.7%(-7.42)#8,002 |
| 35. | Bruce | 11.0% | 4.4%(+6.62)#35 | 18.7%(-7.63)#8,111 |
| 36. | Eagle Butte | 11.0% | 4.4%(+6.56)#36 | 18.7%(-7.69)#8,140 |
| 37. | Hayti | 10.6% | 4.4%(+6.17)#37 | 18.7%(-8.08)#8,350 |
| 38. | Edgemont | 10.4% | 4.4%(+6.00)#38 | 18.7%(-8.25)#8,474 |
| 39. | Rosebud | 10.3% | 4.4%(+5.95)#39 | 18.7%(-8.30)#8,501 |
| 40. | Blackhawk | 10.0% | 4.4%(+5.63)#40 | 18.7%(-8.62)#8,690 |
| 41. | Artesian | 10.0% | 4.4%(+5.60)#41 | 18.7%(-8.65)#8,717 |
| 42. | Utica | 10.0% | 4.4%(+5.60)#42 | 18.7%(-8.65)#8,725 |
| 43. | Ethan | 9.7% | 4.4%(+5.26)#43 | 18.7%(-8.99)#8,929 |
| 44. | Estelline | 9.0% | 4.4%(+4.63)#44 | 18.7%(-9.62)#9,399 |
| 45. | Beresford | 9.0% | 4.4%(+4.61)#45 | 18.7%(-9.64)#9,416 |
| 46. | Quinn | 8.7% | 4.4%(+4.35)#46 | 18.7%(-9.90)#9,624 |
| 47. | Monroe | 8.5% | 4.4%(+4.13)#47 | 18.7%(-10.1)#9,794 |
| 48. | Redfield | 8.4% | 4.4%(+4.03)#48 | 18.7%(-10.2)#9,863 |
| 49. | Milbank | 8.3% | 4.4%(+3.90)#49 | 18.7%(-10.4)#9,992 |
| 50. | Humboldt | 8.2% | 4.4%(+3.84)#50 | 18.7%(-10.4)#10,066 |
| 51. | Clark | 8.2% | 4.4%(+3.81)#51 | 18.7%(-10.4)#10,080 |
| 52. | Bridgewater | 8.2% | 4.4%(+3.81)#52 | 18.7%(-10.4)#10,081 |
| 53. | Colonial Pine Hills | 8.1% | 4.4%(+3.70)#53 | 18.7%(-10.6)#10,185 |
| 54. | Flandreau | 8.1% | 4.4%(+3.66)#54 | 18.7%(-10.6)#10,231 |
| 55. | Selby | 7.8% | 4.4%(+3.37)#55 | 18.7%(-10.9)#10,496 |
| 56. | North Spearfish | 7.6% | 4.4%(+3.25)#56 | 18.7%(-11.0)#10,621 |
| 57. | Kimball | 7.4% | 4.4%(+3.03)#57 | 18.7%(-11.2)#10,830 |
| 58. | Hudson | 7.4% | 4.4%(+2.97)#58 | 18.7%(-11.3)#10,881 |
| 59. | Springfield | 7.2% | 4.4%(+2.82)#59 | 18.7%(-11.4)#11,027 |
| 60. | Bryant | 7.2% | 4.4%(+2.81)#60 | 18.7%(-11.4)#11,041 |
| 61. | Freeman | 7.1% | 4.4%(+2.69)#61 | 18.7%(-11.6)#11,151 |
| 62. | Yankton | 6.9% | 4.4%(+2.52)#62 | 18.7%(-11.7)#11,328 |
| 63. | Cherry Creek | 6.9% | 4.4%(+2.46)#63 | 18.7%(-11.8)#11,381 |
| 64. | Britton | 6.7% | 4.4%(+2.28)#64 | 18.7%(-12.0)#11,590 |
| 65. | Howard | 6.7% | 4.4%(+2.26)#65 | 18.7%(-12.0)#11,596 |
| 66. | Bristol | 6.7% | 4.4%(+2.26)#66 | 18.7%(-12.0)#11,606 |
| 67. | Rapid Valley | 6.6% | 4.4%(+2.19)#67 | 18.7%(-12.1)#11,679 |
| 68. | Egan | 6.5% | 4.4%(+2.06)#68 | 18.7%(-12.2)#11,824 |
| 69. | Blunt | 6.4% | 4.4%(+2.02)#69 | 18.7%(-12.2)#11,876 |
| 70. | Pierpont | 6.3% | 4.4%(+1.90)#70 | 18.7%(-12.4)#12,011 |
| 71. | Horse Creek | 6.3% | 4.4%(+1.88)#71 | 18.7%(-12.4)#12,038 |
| 72. | Claremont | 6.2% | 4.4%(+1.85)#72 | 18.7%(-12.4)#12,071 |
| 73. | Dakota Dunes | 6.2% | 4.4%(+1.83)#73 | 18.7%(-12.4)#12,091 |
| 74. | Mount Vernon | 6.2% | 4.4%(+1.81)#74 | 18.7%(-12.4)#12,118 |
| 75. | Rapid City | 6.1% | 4.4%(+1.74)#75 | 18.7%(-12.5)#12,198 |
| 76. | Wonderland Homes | 6.1% | 4.4%(+1.74)#76 | 18.7%(-12.5)#12,199 |
| 77. | Big Stone City | 6.1% | 4.4%(+1.71)#77 | 18.7%(-12.5)#12,238 |
| 78. | La Bolt | 6.1% | 4.4%(+1.70)#78 | 18.7%(-12.6)#12,261 |
| 79. | Roscoe | 6.1% | 4.4%(+1.68)#79 | 18.7%(-12.6)#12,286 |
| 80. | Doland | 6.0% | 4.4%(+1.63)#80 | 18.7%(-12.6)#12,348 |
| 81. | Salem | 5.9% | 4.4%(+1.53)#81 | 18.7%(-12.7)#12,458 |
| 82. | Belle Fourche | 5.9% | 4.4%(+1.51)#82 | 18.7%(-12.7)#12,478 |
| 83. | Grenville | 5.9% | 4.4%(+1.48)#83 | 18.7%(-12.8)#12,530 |
| 84. | Sherman | 5.9% | 4.4%(+1.48)#84 | 18.7%(-12.8)#12,533 |
| 85. | Astoria | 5.8% | 4.4%(+1.45)#85 | 18.7%(-12.8)#12,571 |
| 86. | Lennox | 5.8% | 4.4%(+1.44)#86 | 18.7%(-12.8)#12,583 |
| 87. | Aurora | 5.8% | 4.4%(+1.41)#87 | 18.7%(-12.8)#12,625 |
| 88. | Box Elder | 5.8% | 4.4%(+1.37)#88 | 18.7%(-12.9)#12,657 |
| 89. | New Underwood | 5.7% | 4.4%(+1.35)#89 | 18.7%(-12.9)#12,686 |
| 90. | Sioux Falls | 5.7% | 4.4%(+1.31)#90 | 18.7%(-12.9)#12,741 |
| 91. | Parker | 5.7% | 4.4%(+1.27)#91 | 18.7%(-13.0)#12,799 |
| 92. | Oglala | 5.6% | 4.4%(+1.22)#92 | 18.7%(-13.0)#12,854 |
| 93. | Gregory | 5.5% | 4.4%(+1.13)#93 | 18.7%(-13.1)#12,962 |
| 94. | Colman | 5.5% | 4.4%(+1.09)#94 | 18.7%(-13.2)#13,014 |
| 95. | Whitewood | 5.5% | 4.4%(+1.08)#95 | 18.7%(-13.2)#13,018 |
| 96. | Deadwood | 5.4% | 4.4%(+1.01)#96 | 18.7%(-13.2)#13,110 |
| 97. | Armour | 5.3% | 4.4%(+0.893)#97 | 18.7%(-13.4)#13,302 |
| 98. | Kadoka | 5.2% | 4.4%(+0.813)#98 | 18.7%(-13.4)#13,415 |
| 99. | Fort Thompson | 5.2% | 4.4%(+0.783)#99 | 18.7%(-13.5)#13,449 |
| 100. | Pollock | 5.1% | 4.4%(+0.726)#100 | 18.7%(-13.5)#13,519 |
Common Questions
What are the Top 10 Cities with the Highest Percentage of Hispanic or Latino Population in South Dakota?
Top 10 Cities with the Highest Percentage of Hispanic or Latino Population in South Dakota are:
#1
100.0%
#2
46.7%
#3
43.0%
#4
42.3%
#5
40.5%
#6
36.0%
#7
33.3%
#8
31.4%
#9
29.2%
#10
20.3%
What city has the Highest Percentage of Hispanic or Latino Population in South Dakota?
St Onge has the Highest Percentage of Hispanic or Latino Population in South Dakota with 100.0%.
What is the Percentage of Hispanic or Latino Population in the State of South Dakota?
Percentage of Hispanic or Latino Population in South Dakota is 4.4%.
What is the Percentage of Hispanic or Latino Population in the United States?
Percentage of Hispanic or Latino Population in the United States is 18.7%.