Cliffside Park borough, NJ Map & Demographics
Cliffside Park borough Overview
$49,434
PER CAPITA INCOME
$110,746
AVG FAMILY INCOME
$96,734
AVG HOUSEHOLD INCOME
10.6%
WAGE / INCOME GAP [ % ]
89.4¢/ $1
WAGE / INCOME GAP [ $ ]
$13,805
FAMILY INCOME DEFICIT
0.47
INEQUALITY / GINI INDEX
25,546
TOTAL POPULATION
12,426
MALE POPULATION
13,120
FEMALE POPULATION
94.71
MALES / 100 FEMALES
105.59
FEMALES / 100 MALES
39.9
MEDIAN AGE
3.1
AVG FAMILY SIZE
2.4
AVG HOUSEHOLD SIZE
13,751
LABOR FORCE [ PEOPLE ]
64.0%
PERCENT IN LABOR FORCE
3.6%
UNEMPLOYMENT RATE
Income in Cliffside Park borough
Income Overview in Cliffside Park borough
Per Capita Income in Cliffside Park borough is $49,434, while median incomes of families and households are $110,746 and $96,734 respectively.
| Characteristic | Number | Measure |
| Per Capita Income | 25,546 | $49,434 |
| Median Family Income | 6,656 | $110,746 |
| Mean Family Income | 6,656 | $137,629 |
| Median Household Income | 10,526 | $96,734 |
| Mean Household Income | 10,526 | $121,448 |
| Income Deficit | 6,656 | $13,805 |
| Wage / Income Gap (%) | 25,546 | 10.55% |
| Wage / Income Gap ($) | 25,546 | 89.45¢ per $1 |
| Gini / Inequality Index | 25,546 | 0.47 |
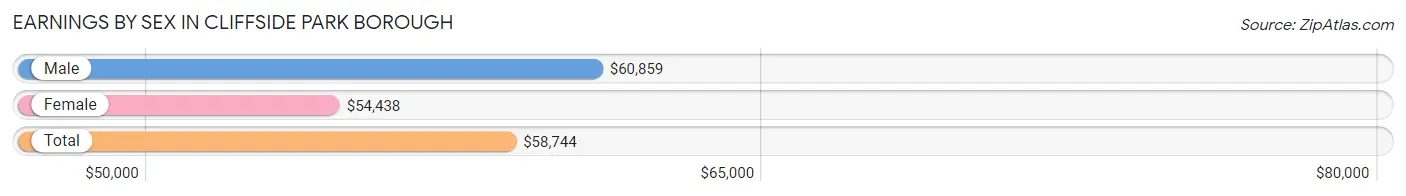
Earnings by Sex in Cliffside Park borough
Average Earnings in Cliffside Park borough are $58,744, $60,859 for men and $54,438 for women, a difference of 10.5%.
| Sex | Number | Average Earnings |
| Male | 7,948 (56.6%) | $60,859 |
| Female | 6,095 (43.4%) | $54,438 |
| Total | 14,043 (100.0%) | $58,744 |
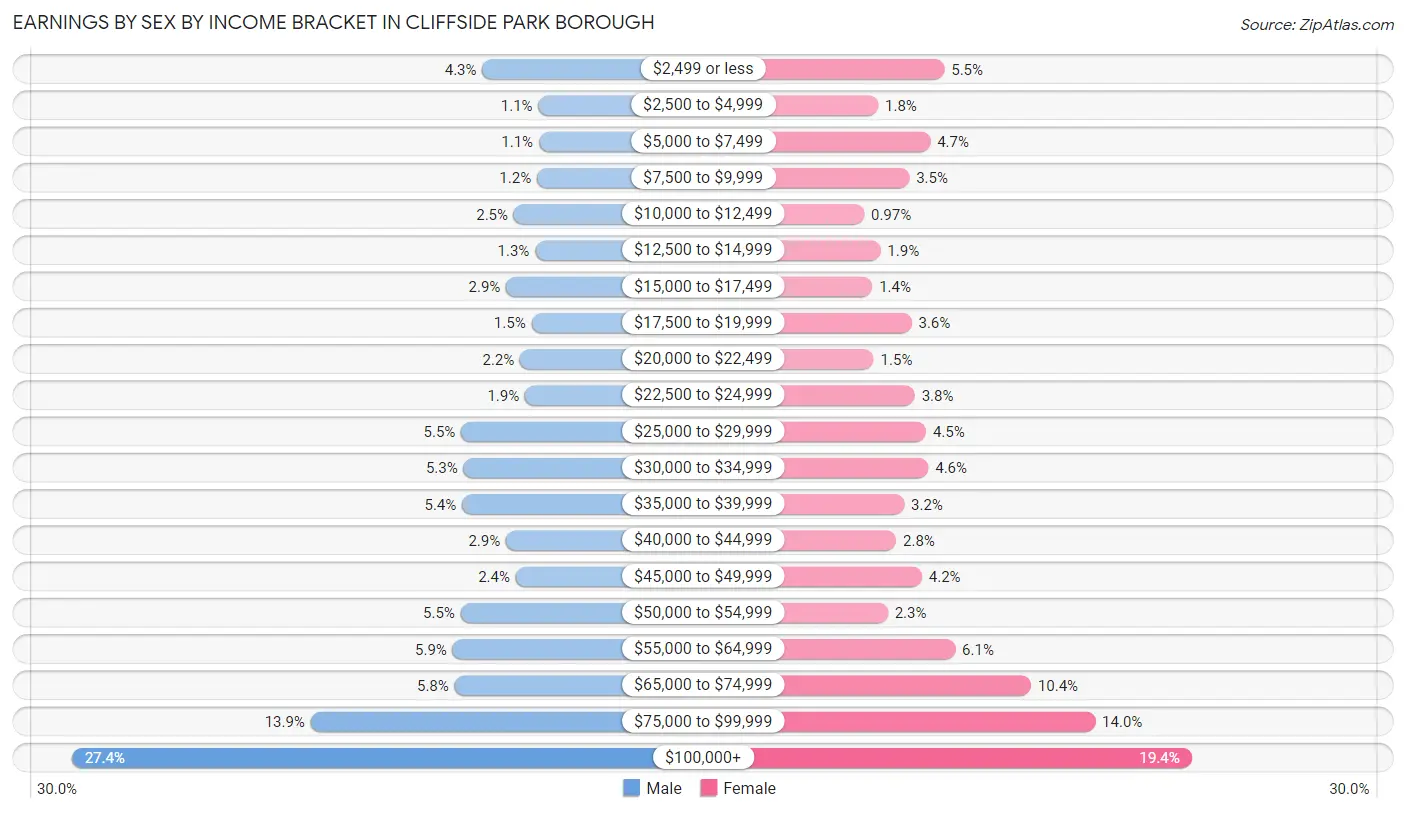
Earnings by Sex by Income Bracket in Cliffside Park borough
The most common earnings brackets in Cliffside Park borough are $100,000+ for men (2,174 | 27.4%) and $100,000+ for women (1,181 | 19.4%).
| Income | Male | Female |
| $2,499 or less | 339 (4.3%) | 334 (5.5%) |
| $2,500 to $4,999 | 89 (1.1%) | 107 (1.8%) |
| $5,000 to $7,499 | 87 (1.1%) | 286 (4.7%) |
| $7,500 to $9,999 | 95 (1.2%) | 214 (3.5%) |
| $10,000 to $12,499 | 199 (2.5%) | 59 (1.0%) |
| $12,500 to $14,999 | 103 (1.3%) | 115 (1.9%) |
| $15,000 to $17,499 | 233 (2.9%) | 87 (1.4%) |
| $17,500 to $19,999 | 120 (1.5%) | 222 (3.6%) |
| $20,000 to $22,499 | 171 (2.1%) | 92 (1.5%) |
| $22,500 to $24,999 | 149 (1.9%) | 233 (3.8%) |
| $25,000 to $29,999 | 434 (5.5%) | 271 (4.4%) |
| $30,000 to $34,999 | 424 (5.3%) | 279 (4.6%) |
| $35,000 to $39,999 | 430 (5.4%) | 196 (3.2%) |
| $40,000 to $44,999 | 234 (2.9%) | 169 (2.8%) |
| $45,000 to $49,999 | 190 (2.4%) | 257 (4.2%) |
| $50,000 to $54,999 | 436 (5.5%) | 140 (2.3%) |
| $55,000 to $64,999 | 472 (5.9%) | 371 (6.1%) |
| $65,000 to $74,999 | 463 (5.8%) | 631 (10.3%) |
| $75,000 to $99,999 | 1,106 (13.9%) | 851 (14.0%) |
| $100,000+ | 2,174 (27.4%) | 1,181 (19.4%) |
| Total | 7,948 (100.0%) | 6,095 (100.0%) |
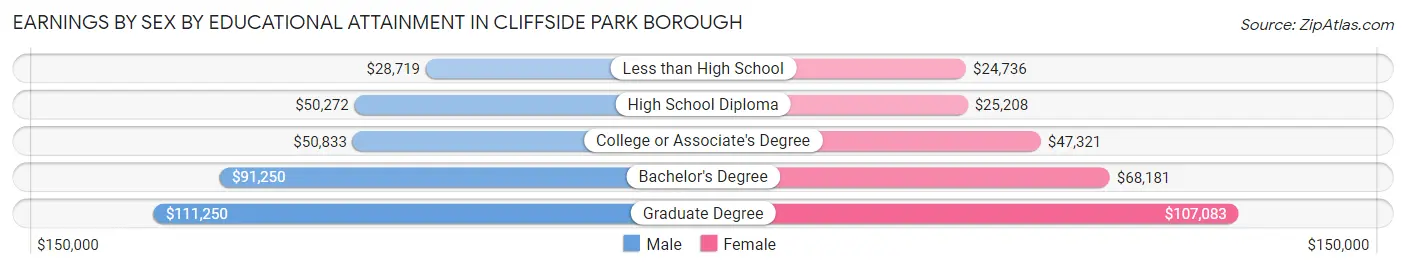
Earnings by Sex by Educational Attainment in Cliffside Park borough
Average earnings in Cliffside Park borough are $66,076 for men and $61,231 for women, a difference of 7.3%. Men with an educational attainment of graduate degree enjoy the highest average annual earnings of $111,250, while those with less than high school education earn the least with $28,719. Women with an educational attainment of graduate degree earn the most with the average annual earnings of $107,083, while those with less than high school education have the smallest earnings of $24,736.
| Educational Attainment | Male Income | Female Income |
| Less than High School | $28,719 | $24,736 |
| High School Diploma | $50,272 | $25,208 |
| College or Associate's Degree | $50,833 | $47,321 |
| Bachelor's Degree | $91,250 | $68,181 |
| Graduate Degree | $111,250 | $107,083 |
| Total | $66,076 | $61,231 |
Family Income in Cliffside Park borough
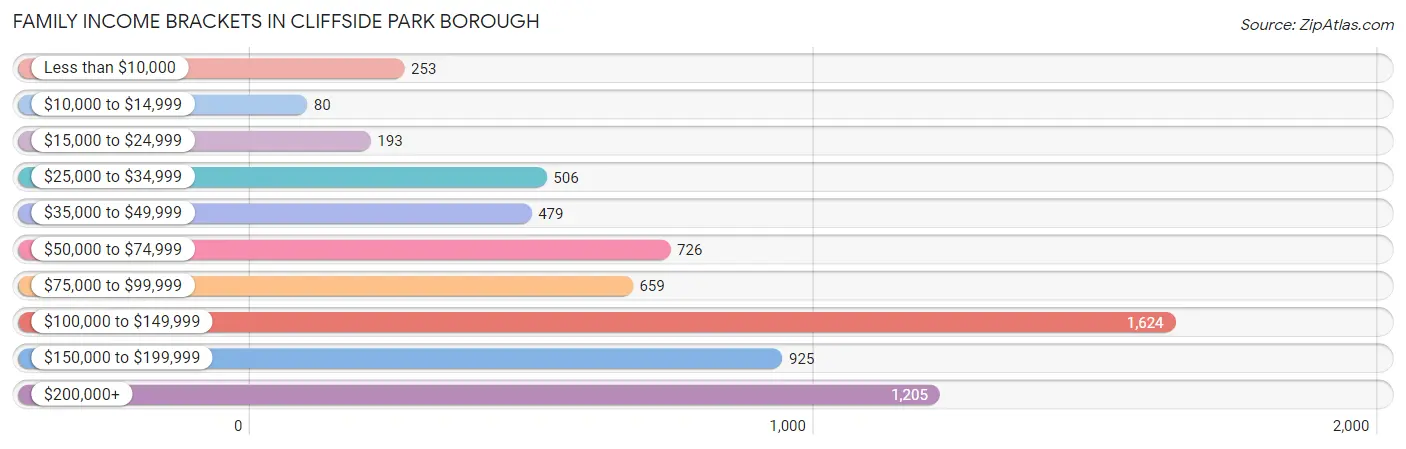
Family Income Brackets in Cliffside Park borough
According to the Cliffside Park borough family income data, there are 1,624 families falling into the $100,000 to $149,999 income range, which is the most common income bracket and makes up 24.4% of all families. Conversely, the $10,000 to $14,999 income bracket is the least frequent group with only 80 families (1.2%) belonging to this category.
| Income Bracket | # Families | % Families |
| Less than $10,000 | 253 | 3.8% |
| $10,000 to $14,999 | 80 | 1.2% |
| $15,000 to $24,999 | 193 | 2.9% |
| $25,000 to $34,999 | 506 | 7.6% |
| $35,000 to $49,999 | 479 | 7.2% |
| $50,000 to $74,999 | 726 | 10.9% |
| $75,000 to $99,999 | 659 | 9.9% |
| $100,000 to $149,999 | 1,624 | 24.4% |
| $150,000 to $199,999 | 925 | 13.9% |
| $200,000+ | 1,205 | 18.1% |
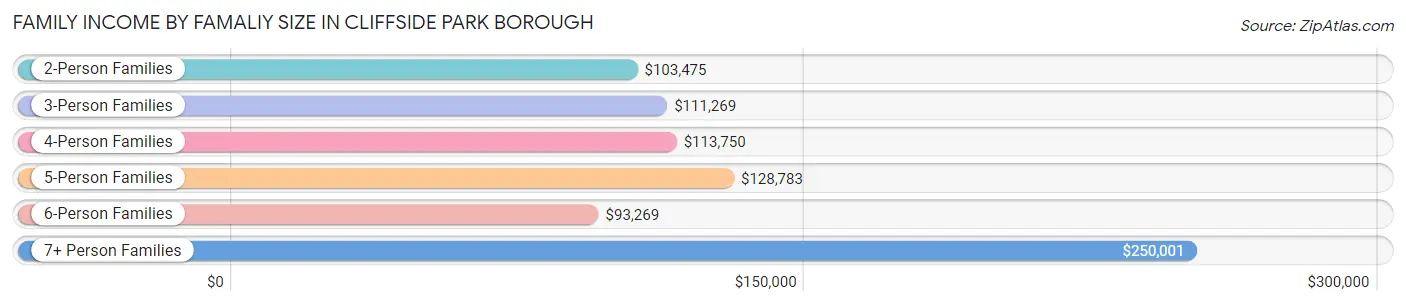
Family Income by Famaliy Size in Cliffside Park borough
7+ person families (50 | 0.7%) account for the highest median family income in Cliffside Park borough with $250,001 per family, while 2-person families (3,243 | 48.7%) have the highest median income of $51,738 per family member.
| Income Bracket | # Families | Median Income |
| 2-Person Families | 3,243 (48.7%) | $103,475 |
| 3-Person Families | 1,376 (20.7%) | $111,269 |
| 4-Person Families | 1,147 (17.2%) | $113,750 |
| 5-Person Families | 656 (9.9%) | $128,783 |
| 6-Person Families | 184 (2.8%) | $93,269 |
| 7+ Person Families | 50 (0.7%) | $250,001 |
| Total | 6,656 (100.0%) | $110,746 |
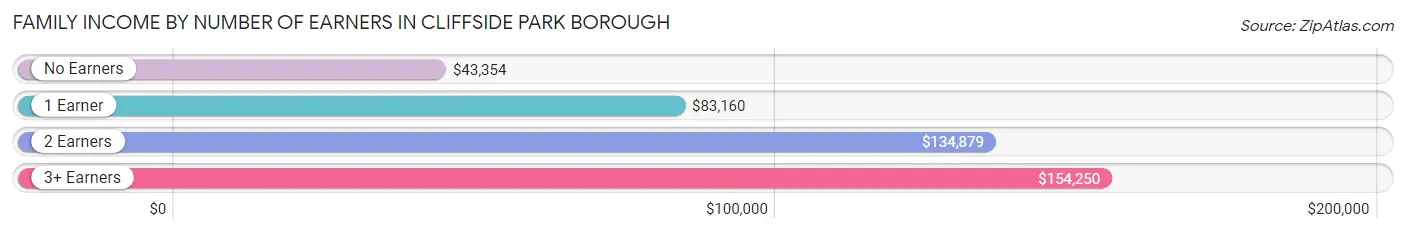
Family Income by Number of Earners in Cliffside Park borough
The median family income in Cliffside Park borough is $110,746, with families comprising 3+ earners (709) having the highest median family income of $154,250, while families with no earners (887) have the lowest median family income of $43,354, accounting for 10.6% and 13.3% of families, respectively.
| Number of Earners | # Families | Median Income |
| No Earners | 887 (13.3%) | $43,354 |
| 1 Earner | 2,403 (36.1%) | $83,160 |
| 2 Earners | 2,657 (39.9%) | $134,879 |
| 3+ Earners | 709 (10.6%) | $154,250 |
| Total | 6,656 (100.0%) | $110,746 |
Household Income in Cliffside Park borough
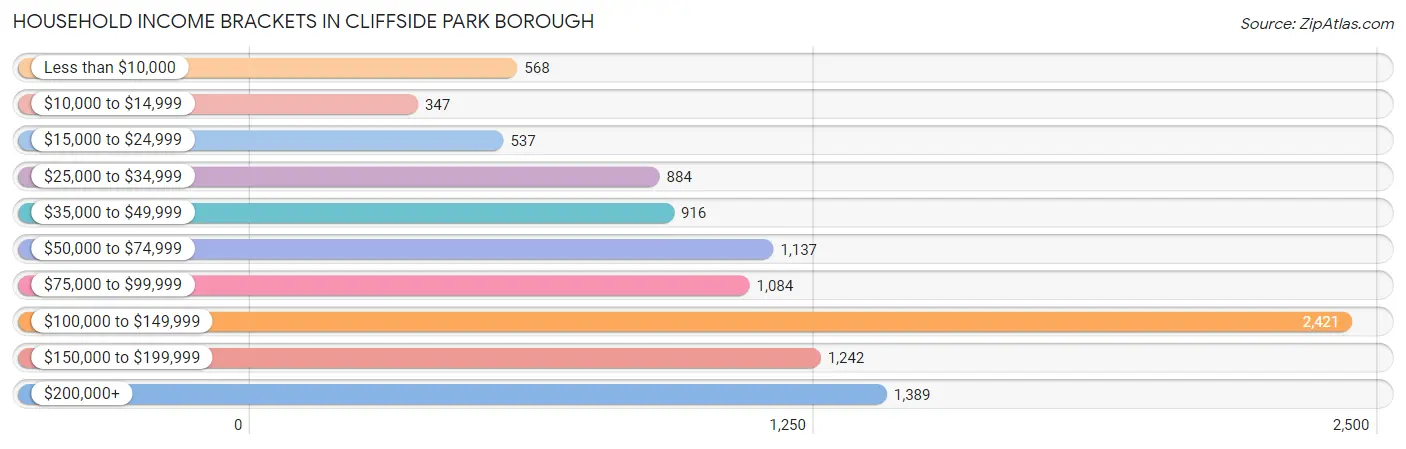
Household Income Brackets in Cliffside Park borough
With 2,421 households falling in the category, the $100,000 to $149,999 income range is the most frequent in Cliffside Park borough, accounting for 23.0% of all households. In contrast, only 347 households (3.3%) fall into the $10,000 to $14,999 income bracket, making it the least populous group.
| Income Bracket | # Households | % Households |
| Less than $10,000 | 568 | 5.4% |
| $10,000 to $14,999 | 347 | 3.3% |
| $15,000 to $24,999 | 537 | 5.1% |
| $25,000 to $34,999 | 884 | 8.4% |
| $35,000 to $49,999 | 916 | 8.7% |
| $50,000 to $74,999 | 1,137 | 10.8% |
| $75,000 to $99,999 | 1,084 | 10.3% |
| $100,000 to $149,999 | 2,421 | 23.0% |
| $150,000 to $199,999 | 1,242 | 11.8% |
| $200,000+ | 1,389 | 13.2% |
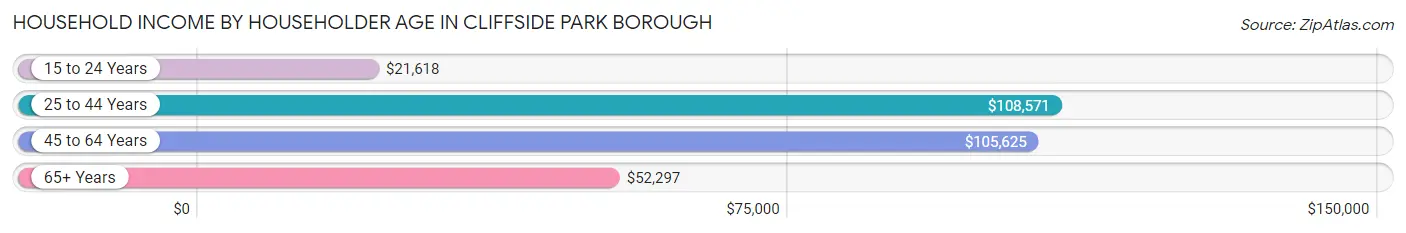
Household Income by Householder Age in Cliffside Park borough
The median household income in Cliffside Park borough is $96,734, with the highest median household income of $108,571 found in the 25 to 44 years age bracket for the primary householder. A total of 3,490 households (33.2%) fall into this category. Meanwhile, the 15 to 24 years age bracket for the primary householder has the lowest median household income of $21,618, with 138 households (1.3%) in this group.
| Income Bracket | # Households | Median Income |
| 15 to 24 Years | 138 (1.3%) | $21,618 |
| 25 to 44 Years | 3,490 (33.2%) | $108,571 |
| 45 to 64 Years | 3,650 (34.7%) | $105,625 |
| 65+ Years | 3,248 (30.9%) | $52,297 |
| Total | 10,526 (100.0%) | $96,734 |
Poverty in Cliffside Park borough
Income Below Poverty by Sex and Age in Cliffside Park borough
With 8.5% poverty level for males and 13.7% for females among the residents of Cliffside Park borough, 5 year old males and 12 to 14 year old females are the most vulnerable to poverty, with 70 males (35.7%) and 256 females (45.2%) in their respective age groups living below the poverty level.
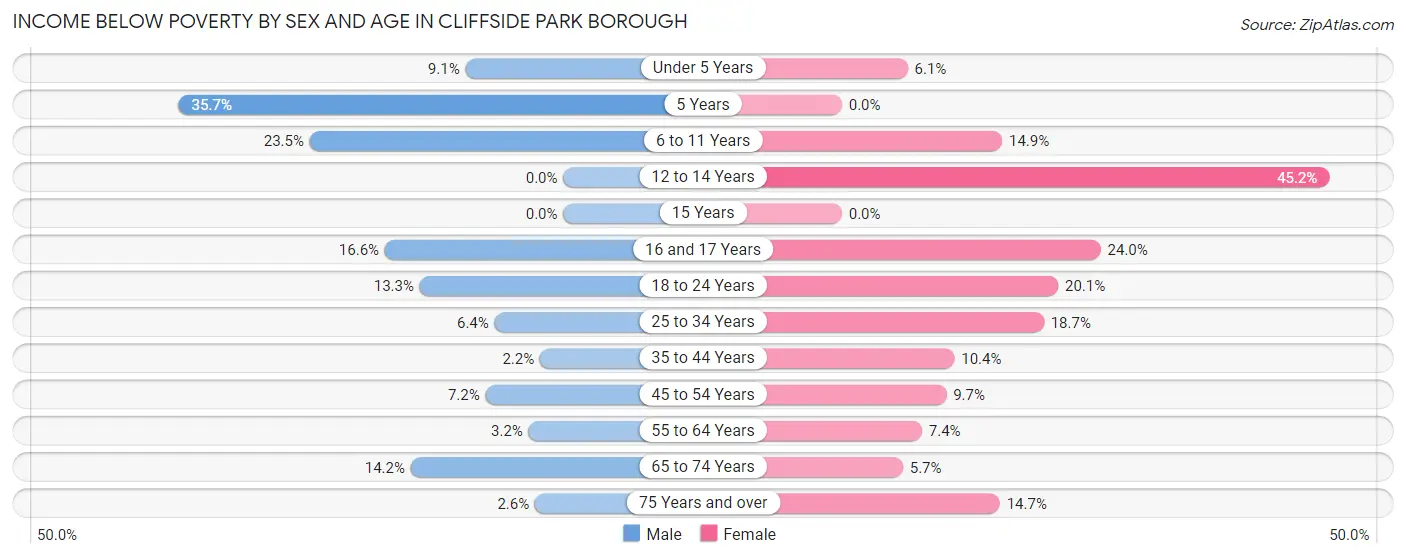
| Age Bracket | Male | Female |
| Under 5 Years | 58 (9.1%) | 33 (6.1%) |
| 5 Years | 70 (35.7%) | 0 (0.0%) |
| 6 to 11 Years | 148 (23.5%) | 141 (14.9%) |
| 12 to 14 Years | 0 (0.0%) | 256 (45.2%) |
| 15 Years | 0 (0.0%) | 0 (0.0%) |
| 16 and 17 Years | 105 (16.6%) | 92 (24.0%) |
| 18 to 24 Years | 128 (13.3%) | 175 (20.1%) |
| 25 to 34 Years | 142 (6.4%) | 386 (18.7%) |
| 35 to 44 Years | 33 (2.2%) | 170 (10.4%) |
| 45 to 54 Years | 98 (7.2%) | 172 (9.7%) |
| 55 to 64 Years | 54 (3.2%) | 112 (7.4%) |
| 65 to 74 Years | 188 (14.2%) | 97 (5.7%) |
| 75 Years and over | 21 (2.6%) | 152 (14.7%) |
| Total | 1,045 (8.5%) | 1,786 (13.7%) |
Income Above Poverty by Sex and Age in Cliffside Park borough
According to the poverty statistics in Cliffside Park borough, males aged 12 to 14 years and females aged 5 years are the age groups that are most secure financially, with 100.0% of males and 100.0% of females in these age groups living above the poverty line.
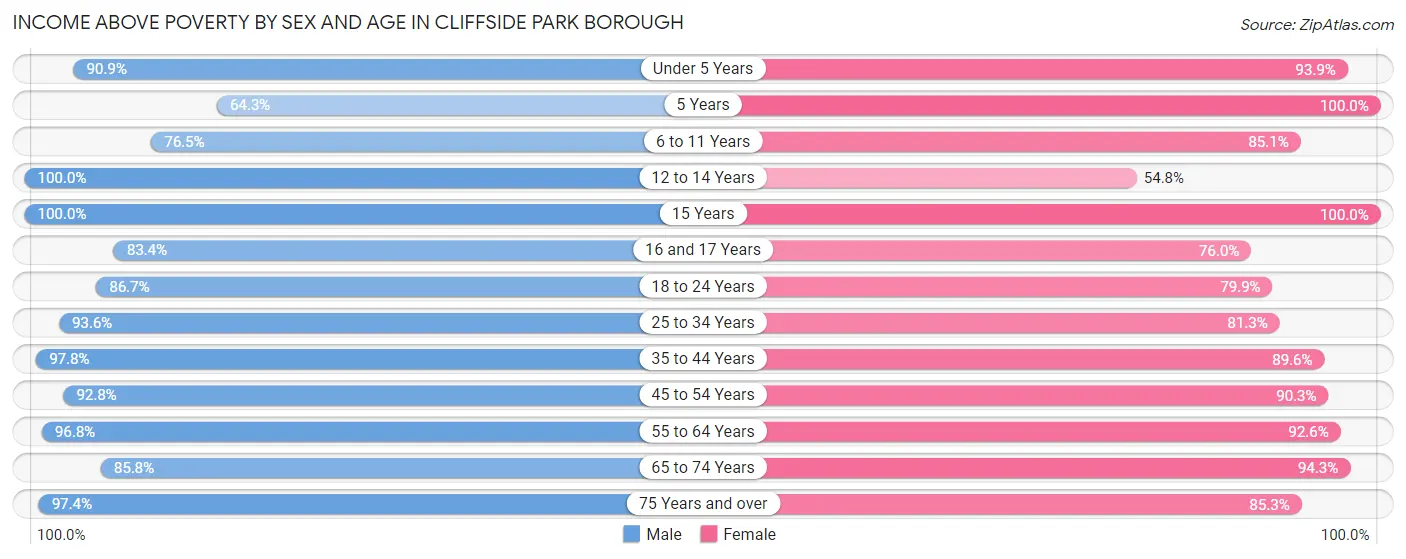
| Age Bracket | Male | Female |
| Under 5 Years | 581 (90.9%) | 507 (93.9%) |
| 5 Years | 126 (64.3%) | 15 (100.0%) |
| 6 to 11 Years | 481 (76.5%) | 807 (85.1%) |
| 12 to 14 Years | 231 (100.0%) | 310 (54.8%) |
| 15 Years | 127 (100.0%) | 35 (100.0%) |
| 16 and 17 Years | 529 (83.4%) | 291 (76.0%) |
| 18 to 24 Years | 833 (86.7%) | 697 (79.9%) |
| 25 to 34 Years | 2,085 (93.6%) | 1,674 (81.3%) |
| 35 to 44 Years | 1,496 (97.8%) | 1,458 (89.6%) |
| 45 to 54 Years | 1,259 (92.8%) | 1,603 (90.3%) |
| 55 to 64 Years | 1,622 (96.8%) | 1,395 (92.6%) |
| 65 to 74 Years | 1,140 (85.8%) | 1,616 (94.3%) |
| 75 Years and over | 778 (97.4%) | 885 (85.3%) |
| Total | 11,288 (91.5%) | 11,293 (86.3%) |
Income Below Poverty Among Married-Couple Families in Cliffside Park borough
The poverty statistics for married-couple families in Cliffside Park borough show that 5.4% or 272 of the total 5,037 families live below the poverty line. Families with 3 or 4 children have the highest poverty rate of 9.4%, comprising of 29 families. On the other hand, families with no children have the lowest poverty rate of 3.9%, which includes 118 families.
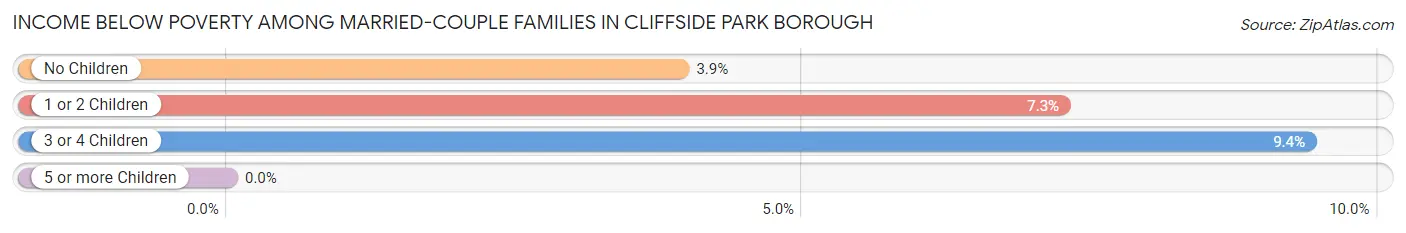
| Children | Above Poverty | Below Poverty |
| No Children | 2,885 (96.1%) | 118 (3.9%) |
| 1 or 2 Children | 1,600 (92.7%) | 125 (7.2%) |
| 3 or 4 Children | 280 (90.6%) | 29 (9.4%) |
| 5 or more Children | 0 (0.0%) | 0 (0.0%) |
| Total | 4,765 (94.6%) | 272 (5.4%) |
Income Below Poverty Among Single-Parent Households in Cliffside Park borough
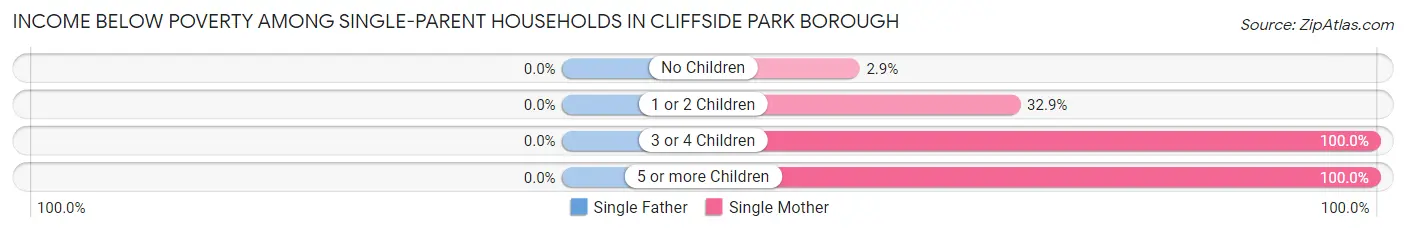
| Children | Single Father | Single Mother |
| No Children | 0 (0.0%) | 19 (2.9%) |
| 1 or 2 Children | 0 (0.0%) | 119 (32.9%) |
| 3 or 4 Children | 0 (0.0%) | 47 (100.0%) |
| 5 or more Children | 0 (0.0%) | 61 (100.0%) |
| Total | 0 (0.0%) | 246 (22.0%) |
Income Below Poverty Among Married-Couple vs Single-Parent Households in Cliffside Park borough
The poverty data for Cliffside Park borough shows that 272 of the married-couple family households (5.4%) and 246 of the single-parent households (15.2%) are living below the poverty level. Within the married-couple family households, those with 3 or 4 children have the highest poverty rate, with 29 households (9.4%) falling below the poverty line. Among the single-parent households, those with 3 or 4 children have the highest poverty rate, with 47 household (100.0%) living below poverty.
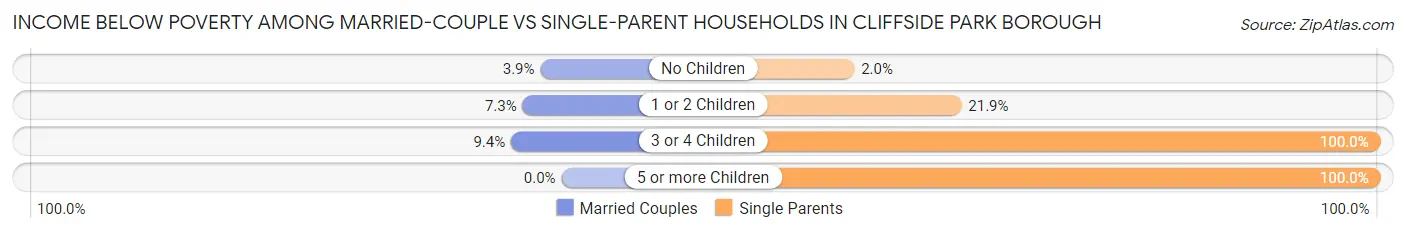
| Children | Married-Couple Families | Single-Parent Households |
| No Children | 118 (3.9%) | 19 (2.0%) |
| 1 or 2 Children | 125 (7.2%) | 119 (21.9%) |
| 3 or 4 Children | 29 (9.4%) | 47 (100.0%) |
| 5 or more Children | 0 (0.0%) | 61 (100.0%) |
| Total | 272 (5.4%) | 246 (15.2%) |
Race in Cliffside Park borough
The most populous races in Cliffside Park borough are White / Caucasian (14,733 | 57.7%), Hispanic or Latino (9,246 | 36.2%), and Two or more Races (3,677 | 14.4%).
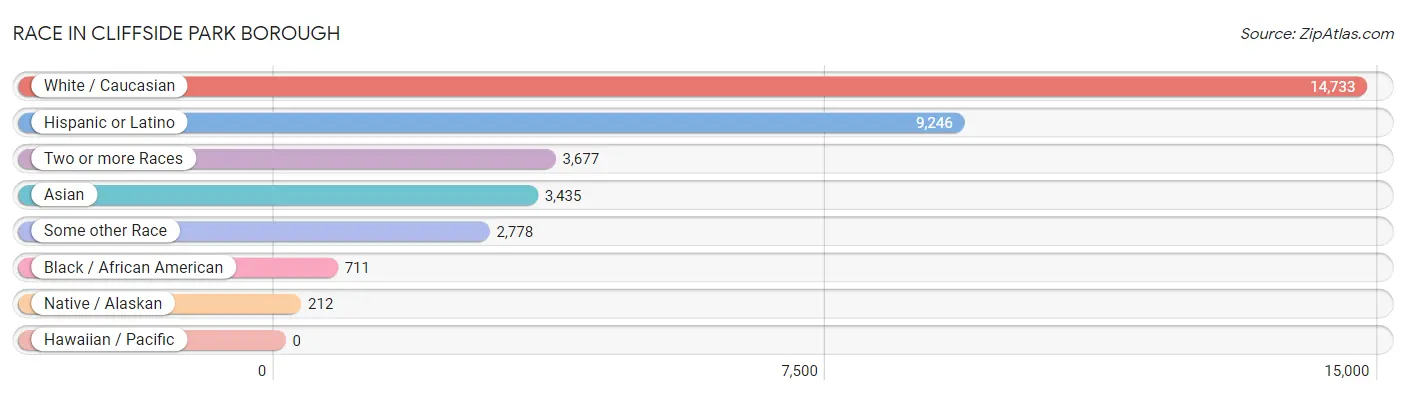
| Race | # Population | % Population |
| Asian | 3,435 | 13.5% |
| Black / African American | 711 | 2.8% |
| Hawaiian / Pacific | 0 | 0.0% |
| Hispanic or Latino | 9,246 | 36.2% |
| Native / Alaskan | 212 | 0.8% |
| White / Caucasian | 14,733 | 57.7% |
| Two or more Races | 3,677 | 14.4% |
| Some other Race | 2,778 | 10.9% |
| Total | 25,546 | 100.0% |
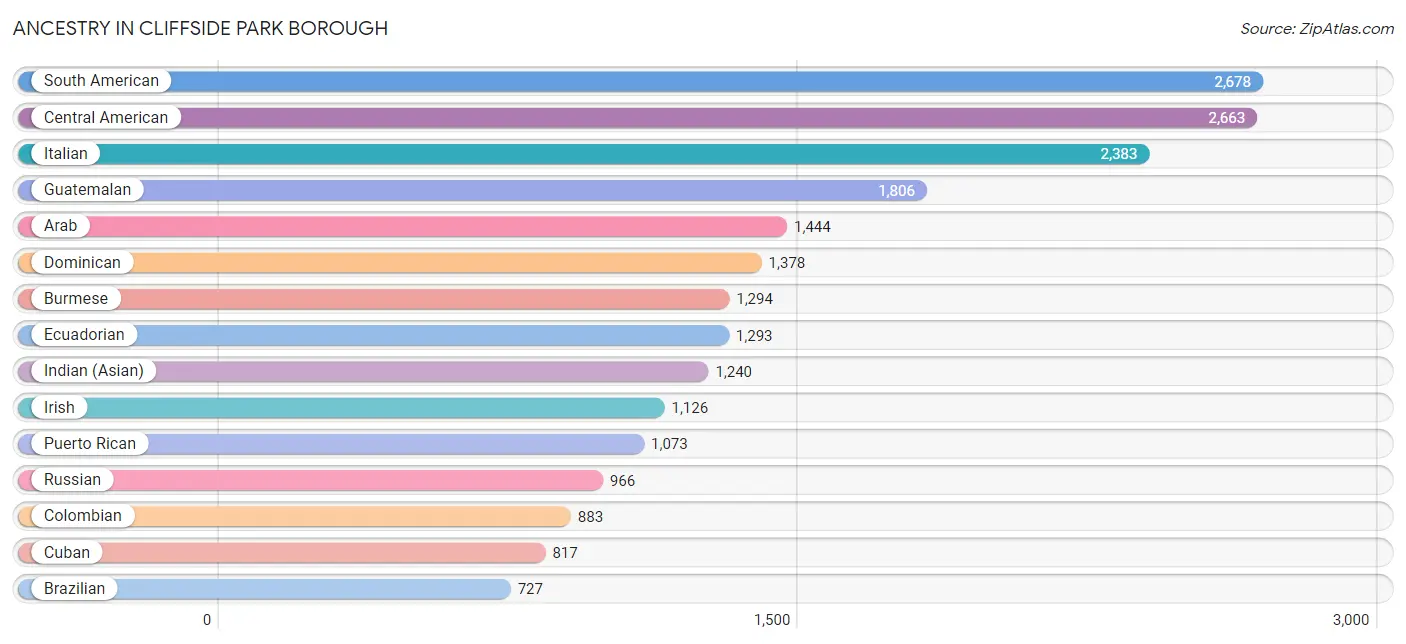
Ancestry in Cliffside Park borough
The most populous ancestries reported in Cliffside Park borough are South American (2,678 | 10.5%), Central American (2,663 | 10.4%), Italian (2,383 | 9.3%), Guatemalan (1,806 | 7.1%), and Arab (1,444 | 5.7%), together accounting for 42.9% of all Cliffside Park borough residents.
| Ancestry | # Population | % Population |
| African | 231 | 0.9% |
| Albanian | 213 | 0.8% |
| American | 386 | 1.5% |
| Arab | 1,444 | 5.7% |
| Armenian | 287 | 1.1% |
| Austrian | 29 | 0.1% |
| Bhutanese | 173 | 0.7% |
| Bolivian | 9 | 0.0% |
| Brazilian | 727 | 2.9% |
| British | 23 | 0.1% |
| Burmese | 1,294 | 5.1% |
| Canadian | 8 | 0.0% |
| Central American | 2,663 | 10.4% |
| Central American Indian | 221 | 0.9% |
| Chilean | 50 | 0.2% |
| Colombian | 883 | 3.5% |
| Croatian | 602 | 2.4% |
| Cuban | 817 | 3.2% |
| Danish | 28 | 0.1% |
| Dominican | 1,378 | 5.4% |
| Dutch | 7 | 0.0% |
| Eastern European | 40 | 0.2% |
| Ecuadorian | 1,293 | 5.1% |
| Egyptian | 76 | 0.3% |
| English | 129 | 0.5% |
| European | 122 | 0.5% |
| Filipino | 39 | 0.2% |
| Finnish | 30 | 0.1% |
| French | 51 | 0.2% |
| German | 646 | 2.5% |
| Greek | 292 | 1.1% |
| Guatemalan | 1,806 | 7.1% |
| Guyanese | 36 | 0.1% |
| Honduran | 41 | 0.2% |
| Hungarian | 98 | 0.4% |
| Icelander | 32 | 0.1% |
| Indian (Asian) | 1,240 | 4.9% |
| Iranian | 23 | 0.1% |
| Irish | 1,126 | 4.4% |
| Israeli | 8 | 0.0% |
| Italian | 2,383 | 9.3% |
| Jamaican | 100 | 0.4% |
| Jordanian | 62 | 0.2% |
| Kenyan | 24 | 0.1% |
| Korean | 205 | 0.8% |
| Latvian | 18 | 0.1% |
| Lebanese | 43 | 0.2% |
| Lithuanian | 8 | 0.0% |
| Mexican | 76 | 0.3% |
| Nicaraguan | 119 | 0.5% |
| Nigerian | 72 | 0.3% |
| Norwegian | 200 | 0.8% |
| Pakistani | 12 | 0.1% |
| Palestinian | 486 | 1.9% |
| Panamanian | 43 | 0.2% |
| Paraguayan | 36 | 0.1% |
| Pennsylvania German | 9 | 0.0% |
| Peruvian | 174 | 0.7% |
| Polish | 685 | 2.7% |
| Portuguese | 140 | 0.5% |
| Puerto Rican | 1,073 | 4.2% |
| Romanian | 219 | 0.9% |
| Russian | 966 | 3.8% |
| Salvadoran | 654 | 2.6% |
| Scandinavian | 36 | 0.1% |
| Scotch-Irish | 10 | 0.0% |
| Scottish | 58 | 0.2% |
| Serbian | 49 | 0.2% |
| Slovak | 39 | 0.2% |
| South American | 2,678 | 10.5% |
| South American Indian | 148 | 0.6% |
| Spaniard | 284 | 1.1% |
| Spanish | 78 | 0.3% |
| Subsaharan African | 326 | 1.3% |
| Swedish | 137 | 0.5% |
| Syrian | 24 | 0.1% |
| Thai | 630 | 2.5% |
| Trinidadian and Tobagonian | 349 | 1.4% |
| Turkish | 455 | 1.8% |
| Ukrainian | 472 | 1.8% |
| Venezuelan | 233 | 0.9% |
| Welsh | 10 | 0.0% |
| West Indian | 24 | 0.1% |
| Zimbabwean | 20 | 0.1% | View All 84 Rows |
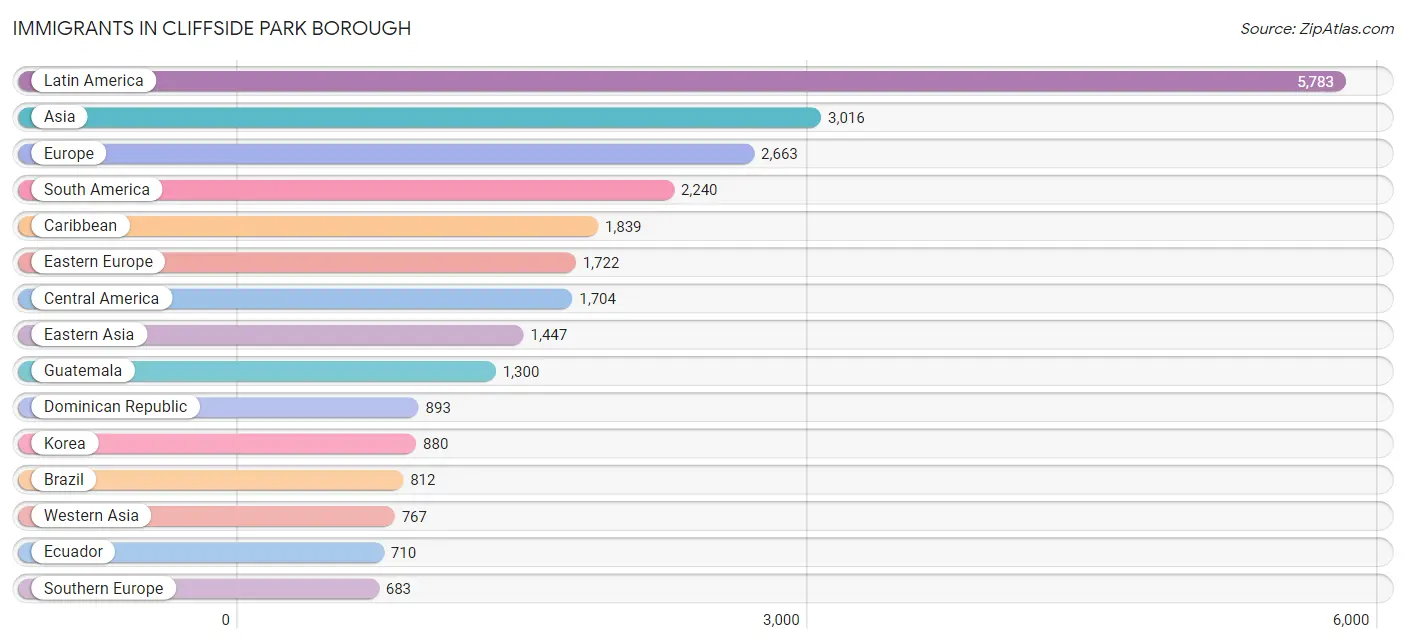
Immigrants in Cliffside Park borough
The most numerous immigrant groups reported in Cliffside Park borough came from Latin America (5,783 | 22.6%), Asia (3,016 | 11.8%), Europe (2,663 | 10.4%), South America (2,240 | 8.8%), and Caribbean (1,839 | 7.2%), together accounting for 60.8% of all Cliffside Park borough residents.
| Immigration Origin | # Population | % Population |
| Africa | 336 | 1.3% |
| Albania | 60 | 0.2% |
| Asia | 3,016 | 11.8% |
| Austria | 8 | 0.0% |
| Belarus | 53 | 0.2% |
| Bolivia | 9 | 0.0% |
| Brazil | 812 | 3.2% |
| Cameroon | 23 | 0.1% |
| Canada | 69 | 0.3% |
| Caribbean | 1,839 | 7.2% |
| Central America | 1,704 | 6.7% |
| Chile | 18 | 0.1% |
| China | 479 | 1.9% |
| Colombia | 229 | 0.9% |
| Croatia | 160 | 0.6% |
| Cuba | 473 | 1.8% |
| Dominican Republic | 893 | 3.5% |
| Eastern Africa | 121 | 0.5% |
| Eastern Asia | 1,447 | 5.7% |
| Eastern Europe | 1,722 | 6.7% |
| Ecuador | 710 | 2.8% |
| Egypt | 103 | 0.4% |
| El Salvador | 285 | 1.1% |
| England | 25 | 0.1% |
| Europe | 2,663 | 10.4% |
| France | 178 | 0.7% |
| Germany | 11 | 0.0% |
| Ghana | 41 | 0.2% |
| Greece | 94 | 0.4% |
| Guatemala | 1,300 | 5.1% |
| Guyana | 36 | 0.1% |
| Hong Kong | 34 | 0.1% |
| Hungary | 35 | 0.1% |
| India | 326 | 1.3% |
| Iran | 9 | 0.0% |
| Ireland | 16 | 0.1% |
| Israel | 21 | 0.1% |
| Italy | 262 | 1.0% |
| Jamaica | 23 | 0.1% |
| Japan | 88 | 0.3% |
| Jordan | 10 | 0.0% |
| Kazakhstan | 24 | 0.1% |
| Kenya | 15 | 0.1% |
| Korea | 880 | 3.4% |
| Latin America | 5,783 | 22.6% |
| Latvia | 17 | 0.1% |
| Lebanon | 92 | 0.4% |
| Lithuania | 13 | 0.1% |
| Mexico | 22 | 0.1% |
| Middle Africa | 23 | 0.1% |
| Moldova | 53 | 0.2% |
| Nicaragua | 54 | 0.2% |
| Nigeria | 48 | 0.2% |
| Northern Africa | 103 | 0.4% |
| Northern Europe | 61 | 0.2% |
| Pakistan | 19 | 0.1% |
| Panama | 43 | 0.2% |
| Peru | 128 | 0.5% |
| Philippines | 210 | 0.8% |
| Poland | 91 | 0.4% |
| Portugal | 107 | 0.4% |
| Romania | 195 | 0.8% |
| Russia | 343 | 1.3% |
| Serbia | 29 | 0.1% |
| South America | 2,240 | 8.8% |
| South Central Asia | 431 | 1.7% |
| South Eastern Asia | 210 | 0.8% |
| Southern Europe | 683 | 2.7% |
| Spain | 220 | 0.9% |
| Sri Lanka | 26 | 0.1% |
| St. Vincent and the Grenadines | 24 | 0.1% |
| Syria | 17 | 0.1% |
| Taiwan | 67 | 0.3% |
| Trinidad and Tobago | 426 | 1.7% |
| Turkey | 504 | 2.0% |
| Uganda | 16 | 0.1% |
| Ukraine | 405 | 1.6% |
| Uzbekistan | 27 | 0.1% |
| Venezuela | 220 | 0.9% |
| Western Africa | 89 | 0.4% |
| Western Asia | 767 | 3.0% |
| Western Europe | 197 | 0.8% |
| Yemen | 96 | 0.4% |
| Zimbabwe | 81 | 0.3% | View All 84 Rows |
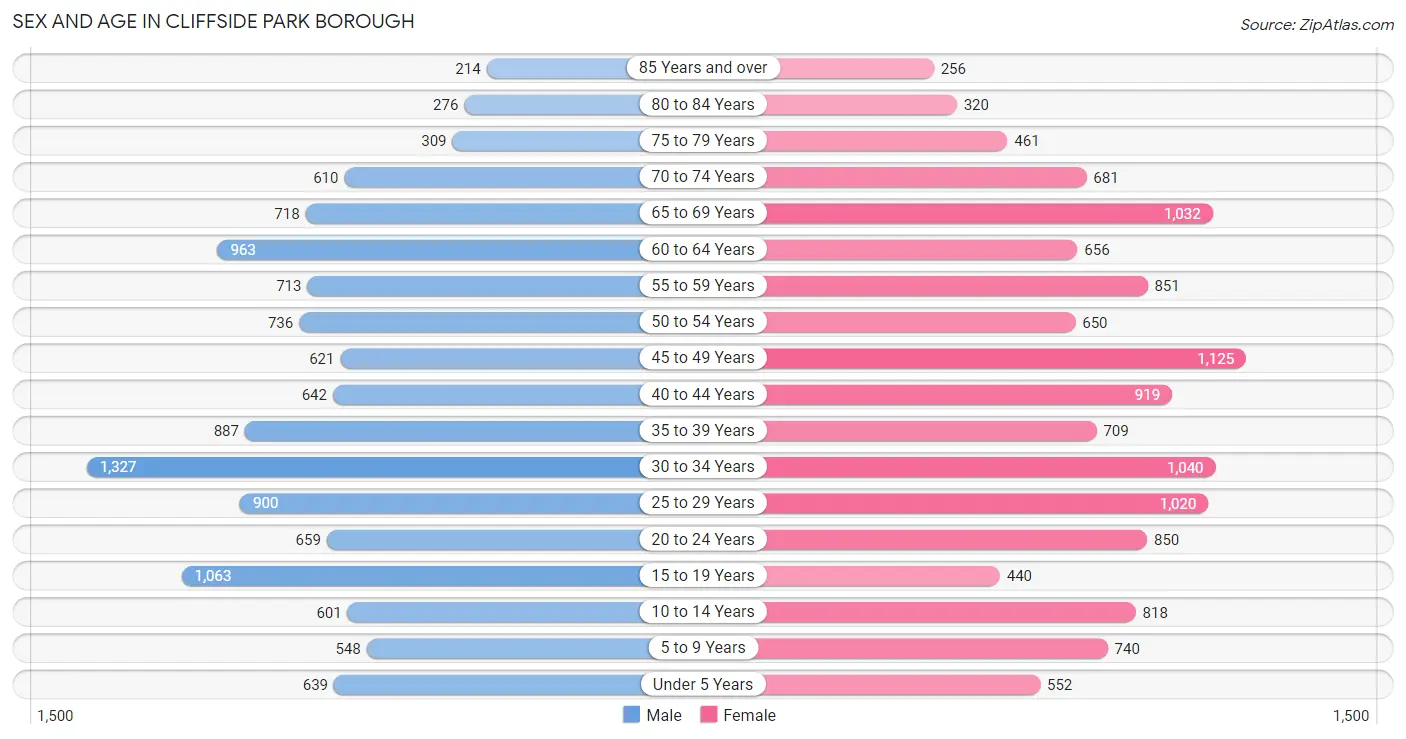
Sex and Age in Cliffside Park borough
Sex and Age in Cliffside Park borough
The most populous age groups in Cliffside Park borough are 30 to 34 Years (1,327 | 10.7%) for men and 45 to 49 Years (1,125 | 8.6%) for women.
| Age Bracket | Male | Female |
| Under 5 Years | 639 (5.1%) | 552 (4.2%) |
| 5 to 9 Years | 548 (4.4%) | 740 (5.6%) |
| 10 to 14 Years | 601 (4.8%) | 818 (6.2%) |
| 15 to 19 Years | 1,063 (8.6%) | 440 (3.4%) |
| 20 to 24 Years | 659 (5.3%) | 850 (6.5%) |
| 25 to 29 Years | 900 (7.2%) | 1,020 (7.8%) |
| 30 to 34 Years | 1,327 (10.7%) | 1,040 (7.9%) |
| 35 to 39 Years | 887 (7.1%) | 709 (5.4%) |
| 40 to 44 Years | 642 (5.2%) | 919 (7.0%) |
| 45 to 49 Years | 621 (5.0%) | 1,125 (8.6%) |
| 50 to 54 Years | 736 (5.9%) | 650 (5.0%) |
| 55 to 59 Years | 713 (5.7%) | 851 (6.5%) |
| 60 to 64 Years | 963 (7.7%) | 656 (5.0%) |
| 65 to 69 Years | 718 (5.8%) | 1,032 (7.9%) |
| 70 to 74 Years | 610 (4.9%) | 681 (5.2%) |
| 75 to 79 Years | 309 (2.5%) | 461 (3.5%) |
| 80 to 84 Years | 276 (2.2%) | 320 (2.4%) |
| 85 Years and over | 214 (1.7%) | 256 (1.9%) |
| Total | 12,426 (100.0%) | 13,120 (100.0%) |
Families and Households in Cliffside Park borough
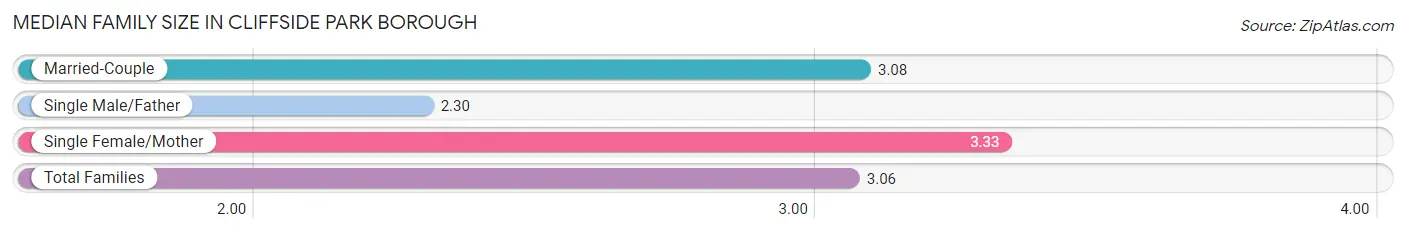
Median Family Size in Cliffside Park borough
The median family size in Cliffside Park borough is 3.06 persons per family, with single female/mother families (1,117 | 16.8%) accounting for the largest median family size of 3.33 persons per family. On the other hand, single male/father families (502 | 7.5%) represent the smallest median family size with 2.30 persons per family.
| Family Type | # Families | Family Size |
| Married-Couple | 5,037 (75.7%) | 3.08 |
| Single Male/Father | 502 (7.5%) | 2.30 |
| Single Female/Mother | 1,117 (16.8%) | 3.33 |
| Total Families | 6,656 (100.0%) | 3.06 |
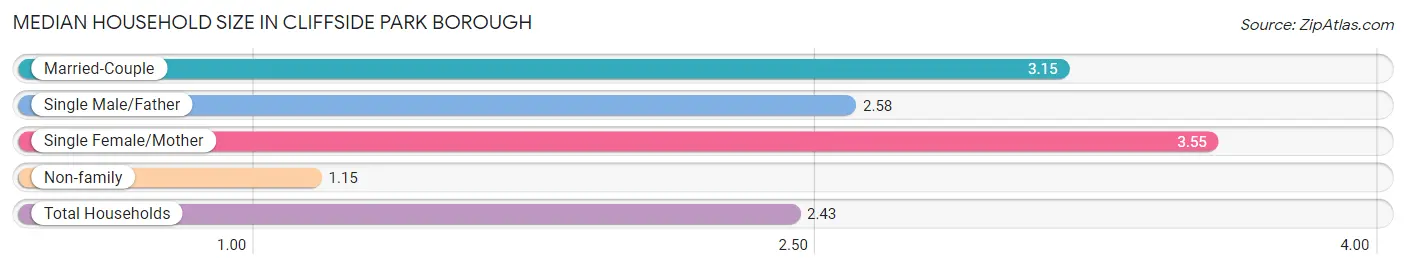
Median Household Size in Cliffside Park borough
The median household size in Cliffside Park borough is 2.43 persons per household, with single female/mother households (1,117 | 10.6%) accounting for the largest median household size of 3.55 persons per household. non-family households (3,870 | 36.8%) represent the smallest median household size with 1.15 persons per household.
| Household Type | # Households | Household Size |
| Married-Couple | 5,037 (47.8%) | 3.15 |
| Single Male/Father | 502 (4.8%) | 2.58 |
| Single Female/Mother | 1,117 (10.6%) | 3.55 |
| Non-family | 3,870 (36.8%) | 1.15 |
| Total Households | 10,526 (100.0%) | 2.43 |
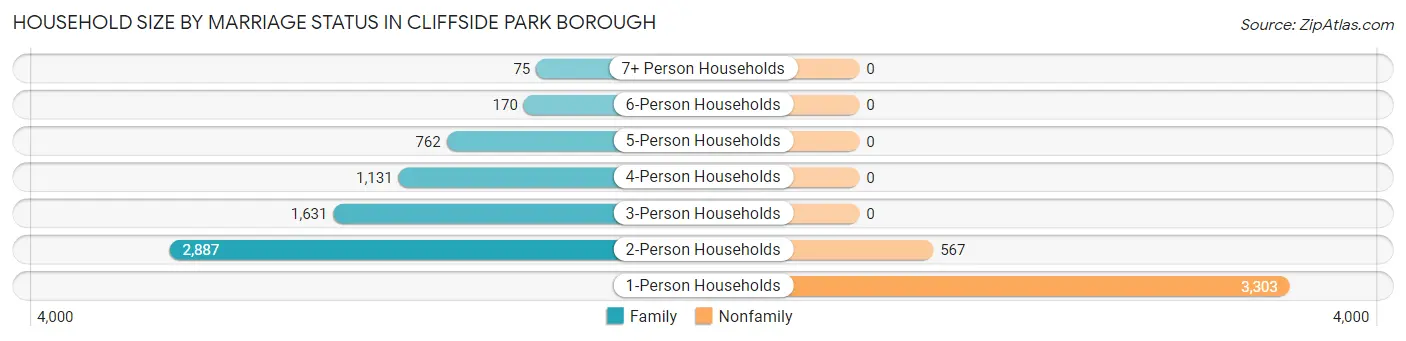
Household Size by Marriage Status in Cliffside Park borough
Out of a total of 10,526 households in Cliffside Park borough, 6,656 (63.2%) are family households, while 3,870 (36.8%) are nonfamily households. The most numerous type of family households are 2-person households, comprising 2,887, and the most common type of nonfamily households are 1-person households, comprising 3,303.
| Household Size | Family Households | Nonfamily Households |
| 1-Person Households | - | 3,303 (31.4%) |
| 2-Person Households | 2,887 (27.4%) | 567 (5.4%) |
| 3-Person Households | 1,631 (15.5%) | 0 (0.0%) |
| 4-Person Households | 1,131 (10.7%) | 0 (0.0%) |
| 5-Person Households | 762 (7.2%) | 0 (0.0%) |
| 6-Person Households | 170 (1.6%) | 0 (0.0%) |
| 7+ Person Households | 75 (0.7%) | 0 (0.0%) |
| Total | 6,656 (63.2%) | 3,870 (36.8%) |
Female Fertility in Cliffside Park borough
Fertility by Age in Cliffside Park borough
Average fertility rate in Cliffside Park borough is 50.0 births per 1,000 women. Women in the age bracket of 35 to 50 years have the highest fertility rate with 56.0 births per 1,000 women. Women in the age bracket of 35 to 50 years acount for 51.8% of all women with births.
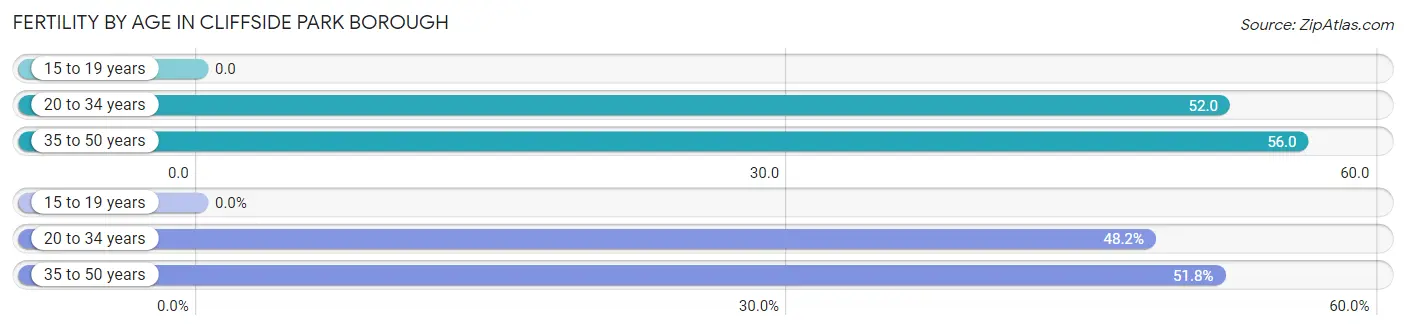
| Age Bracket | Women with Births | Births / 1,000 Women |
| 15 to 19 years | 0 (0.0%) | 0.0 |
| 20 to 34 years | 150 (48.2%) | 52.0 |
| 35 to 50 years | 161 (51.8%) | 56.0 |
| Total | 311 (100.0%) | 50.0 |
Fertility by Age by Marriage Status in Cliffside Park borough
50.8% of women with births (311) in Cliffside Park borough are married. The highest percentage of unmarried women with births falls into 35 to 50 years age bracket with 73.3% of them unmarried at the time of birth, while the lowest percentage of unmarried women with births belong to 20 to 34 years age bracket with 23.3% of them unmarried.
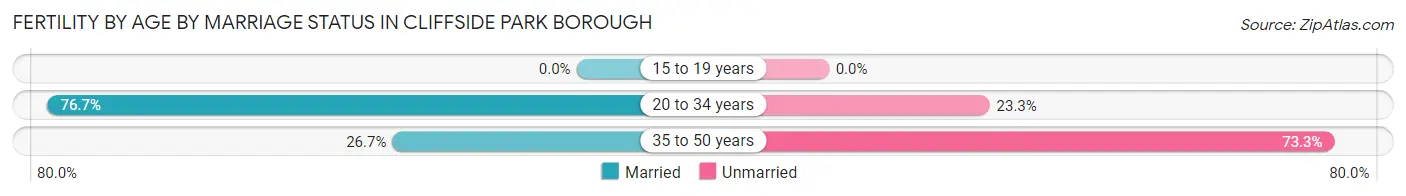
| Age Bracket | Married | Unmarried |
| 15 to 19 years | 0 (0.0%) | 0 (0.0%) |
| 20 to 34 years | 115 (76.7%) | 35 (23.3%) |
| 35 to 50 years | 43 (26.7%) | 118 (73.3%) |
| Total | 158 (50.8%) | 153 (49.2%) |
Fertility by Education in Cliffside Park borough
Average fertility rate in Cliffside Park borough is 50.0 births per 1,000 women. Women with the education attainment of bachelor's degree have the highest fertility rate of 74.0 births per 1,000 women, while women with the education attainment of less than high school have the lowest fertility at 25.0 births per 1,000 women. Women with the education attainment of bachelor's degree represent 41.2% of all women with births.
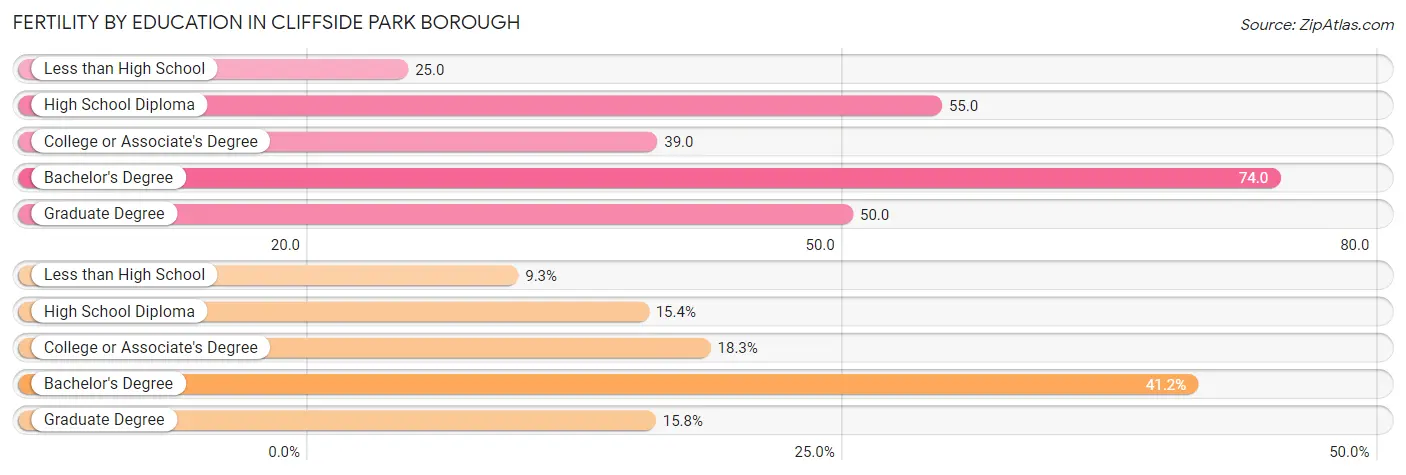
| Educational Attainment | Women with Births | Births / 1,000 Women |
| Less than High School | 29 (9.3%) | 25.0 |
| High School Diploma | 48 (15.4%) | 55.0 |
| College or Associate's Degree | 57 (18.3%) | 39.0 |
| Bachelor's Degree | 128 (41.2%) | 74.0 |
| Graduate Degree | 49 (15.8%) | 50.0 |
| Total | 311 (100.0%) | 50.0 |
Fertility by Education by Marriage Status in Cliffside Park borough
49.2% of women with births in Cliffside Park borough are unmarried. Women with the educational attainment of less than high school are most likely to be married with 100.0% of them married at childbirth, while women with the educational attainment of college or associate's degree are least likely to be married with 75.4% of them unmarried at childbirth.
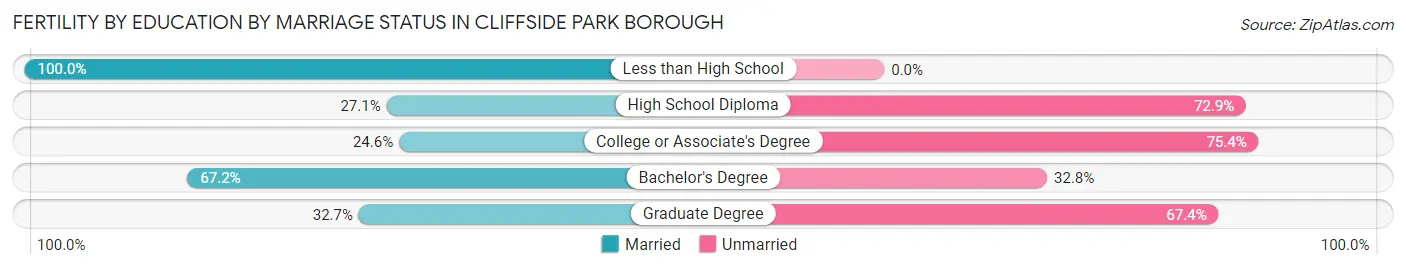
| Educational Attainment | Married | Unmarried |
| Less than High School | 29 (100.0%) | 0 (0.0%) |
| High School Diploma | 13 (27.1%) | 35 (72.9%) |
| College or Associate's Degree | 14 (24.6%) | 43 (75.4%) |
| Bachelor's Degree | 86 (67.2%) | 42 (32.8%) |
| Graduate Degree | 16 (32.7%) | 33 (67.3%) |
| Total | 158 (50.8%) | 153 (49.2%) |
Employment Characteristics in Cliffside Park borough
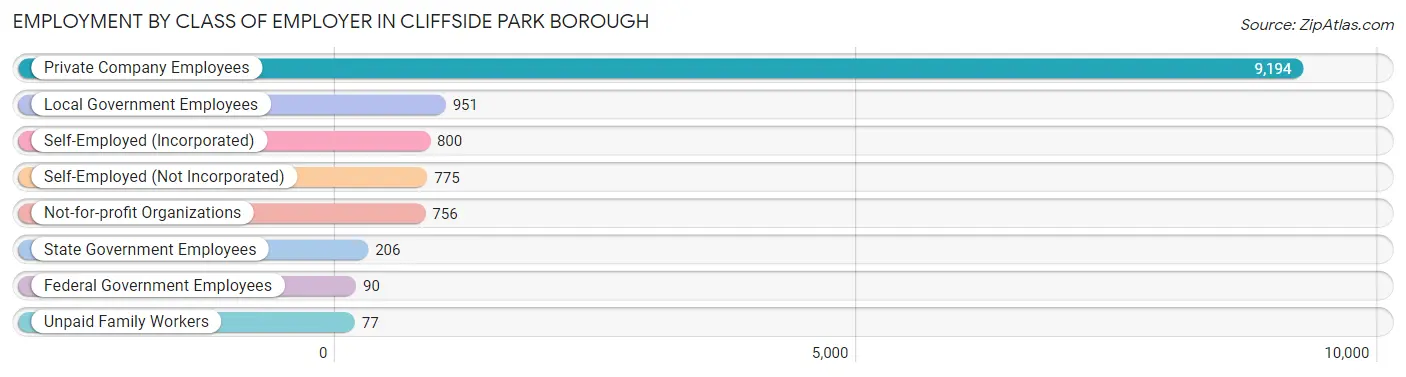
Employment by Class of Employer in Cliffside Park borough
Among the 12,849 employed individuals in Cliffside Park borough, private company employees (9,194 | 71.6%), local government employees (951 | 7.4%), and self-employed (incorporated) (800 | 6.2%) make up the most common classes of employment.
| Employer Class | # Employees | % Employees |
| Private Company Employees | 9,194 | 71.6% |
| Self-Employed (Incorporated) | 800 | 6.2% |
| Self-Employed (Not Incorporated) | 775 | 6.0% |
| Not-for-profit Organizations | 756 | 5.9% |
| Local Government Employees | 951 | 7.4% |
| State Government Employees | 206 | 1.6% |
| Federal Government Employees | 90 | 0.7% |
| Unpaid Family Workers | 77 | 0.6% |
| Total | 12,849 | 100.0% |
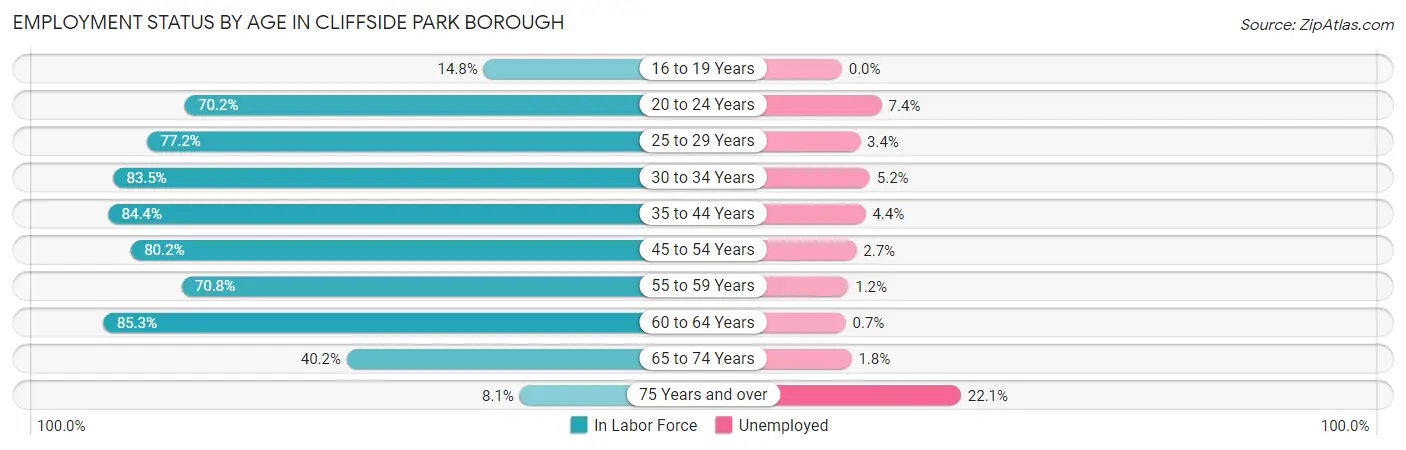
Employment Status by Age in Cliffside Park borough
According to the labor force statistics for Cliffside Park borough, out of the total population over 16 years of age (21,486), 64.0% or 13,751 individuals are in the labor force, with 3.6% or 495 of them unemployed. The age group with the highest labor force participation rate is 60 to 64 years, with 85.3% or 1,381 individuals in the labor force. Within the labor force, the 75 years and over age range has the highest percentage of unemployed individuals, with 22.1% or 33 of them being unemployed.
| Age Bracket | In Labor Force | Unemployed |
| 16 to 19 Years | 198 (14.8%) | 0 (0.0%) |
| 20 to 24 Years | 1,059 (70.2%) | 78 (7.4%) |
| 25 to 29 Years | 1,482 (77.2%) | 50 (3.4%) |
| 30 to 34 Years | 1,976 (83.5%) | 103 (5.2%) |
| 35 to 44 Years | 2,665 (84.4%) | 117 (4.4%) |
| 45 to 54 Years | 2,512 (80.2%) | 68 (2.7%) |
| 55 to 59 Years | 1,107 (70.8%) | 13 (1.2%) |
| 60 to 64 Years | 1,381 (85.3%) | 10 (0.7%) |
| 65 to 74 Years | 1,222 (40.2%) | 22 (1.8%) |
| 75 Years and over | 149 (8.1%) | 33 (22.1%) |
| Total | 13,751 (64.0%) | 495 (3.6%) |
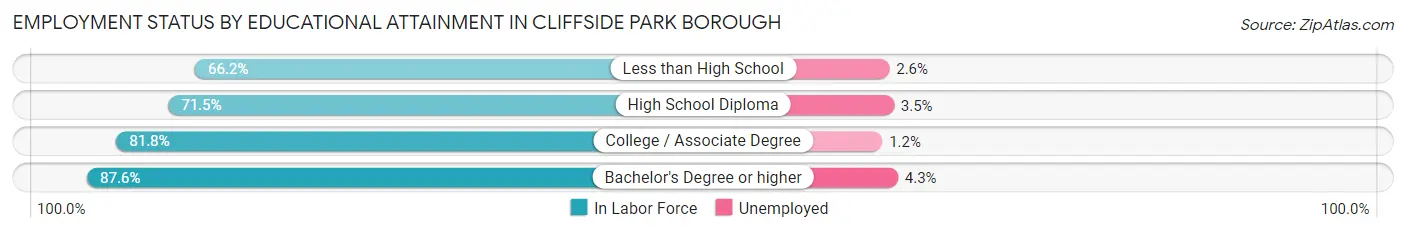
Employment Status by Educational Attainment in Cliffside Park borough
According to labor force statistics for Cliffside Park borough, 80.8% of individuals (11,117) out of the total population between 25 and 64 years of age (13,759) are in the labor force, with 3.3% or 367 of them being unemployed. The group with the highest labor force participation rate are those with the educational attainment of bachelor's degree or higher, with 87.6% or 5,500 individuals in the labor force. Within the labor force, individuals with bachelor's degree or higher education have the highest percentage of unemployment, with 4.3% or 236 of them being unemployed.
| Educational Attainment | In Labor Force | Unemployed |
| Less than High School | 853 (66.2%) | 34 (2.6%) |
| High School Diploma | 2,048 (71.5%) | 100 (3.5%) |
| College / Associate Degree | 2,721 (81.8%) | 40 (1.2%) |
| Bachelor's Degree or higher | 5,500 (87.6%) | 270 (4.3%) |
| Total | 11,117 (80.8%) | 454 (3.3%) |
Employment Occupations by Sex in Cliffside Park borough
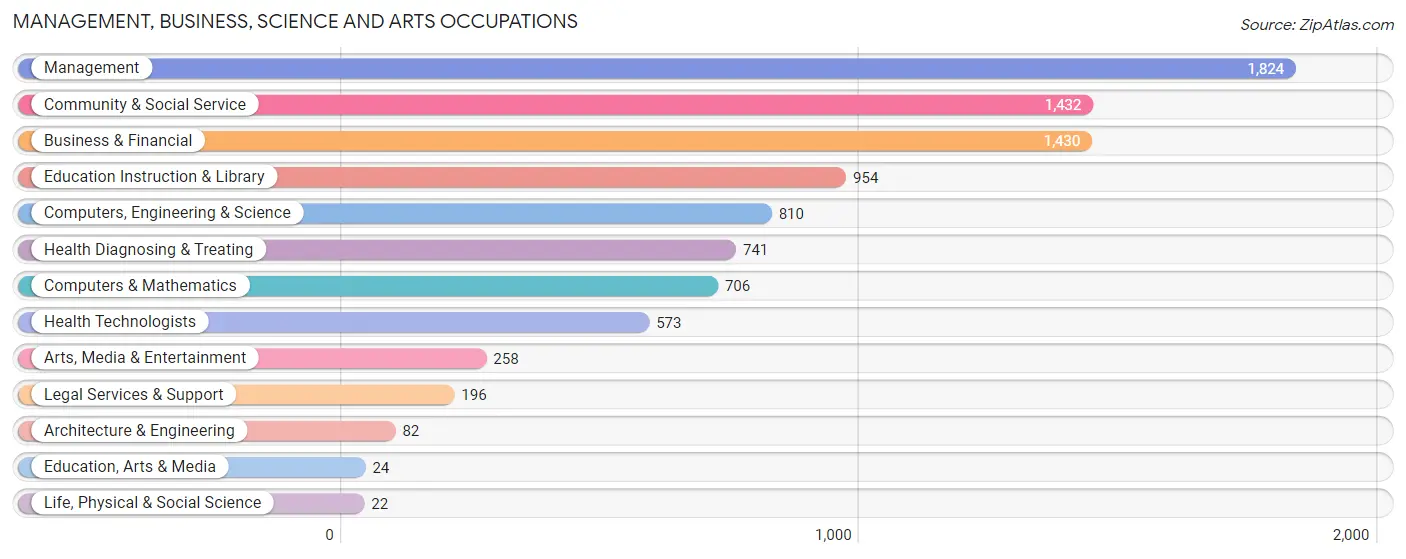
Management, Business, Science and Arts Occupations
The most common Management, Business, Science and Arts occupations in Cliffside Park borough are Management (1,824 | 13.8%), Community & Social Service (1,432 | 10.8%), Business & Financial (1,430 | 10.8%), Education Instruction & Library (954 | 7.2%), and Computers, Engineering & Science (810 | 6.1%).
Management, Business, Science and Arts Occupations by Sex
Within the Management, Business, Science and Arts occupations in Cliffside Park borough, the most male-oriented occupations are Architecture & Engineering (100.0%), Computers & Mathematics (89.5%), and Computers, Engineering & Science (88.1%), while the most female-oriented occupations are Life, Physical & Social Science (100.0%), Education, Arts & Media (100.0%), and Education Instruction & Library (73.9%).
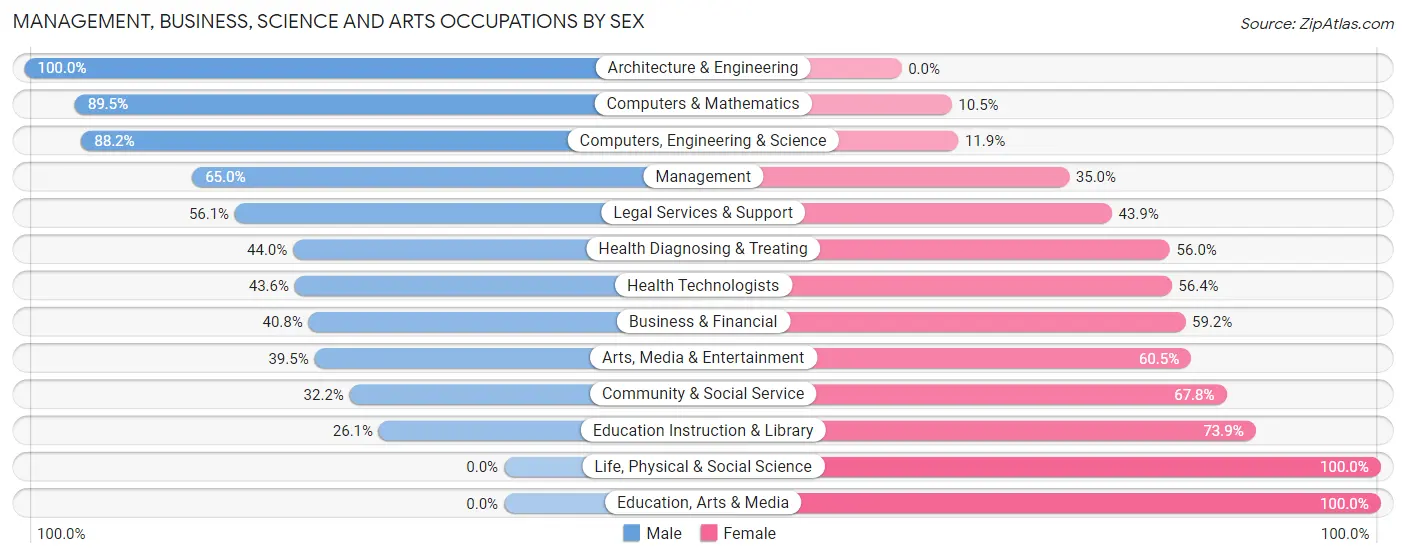
| Occupation | Male | Female |
| Management | 1,186 (65.0%) | 638 (35.0%) |
| Business & Financial | 583 (40.8%) | 847 (59.2%) |
| Computers, Engineering & Science | 714 (88.1%) | 96 (11.8%) |
| Computers & Mathematics | 632 (89.5%) | 74 (10.5%) |
| Architecture & Engineering | 82 (100.0%) | 0 (0.0%) |
| Life, Physical & Social Science | 0 (0.0%) | 22 (100.0%) |
| Community & Social Service | 461 (32.2%) | 971 (67.8%) |
| Education, Arts & Media | 0 (0.0%) | 24 (100.0%) |
| Legal Services & Support | 110 (56.1%) | 86 (43.9%) |
| Education Instruction & Library | 249 (26.1%) | 705 (73.9%) |
| Arts, Media & Entertainment | 102 (39.5%) | 156 (60.5%) |
| Health Diagnosing & Treating | 326 (44.0%) | 415 (56.0%) |
| Health Technologists | 250 (43.6%) | 323 (56.4%) |
| Total (Category) | 3,270 (52.4%) | 2,967 (47.6%) |
| Total (Overall) | 7,574 (57.1%) | 5,684 (42.9%) |
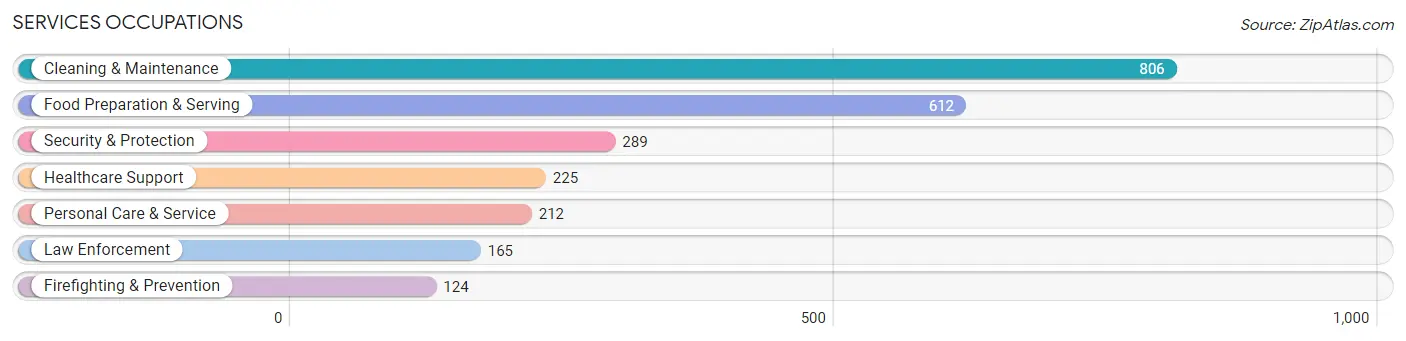
Services Occupations
The most common Services occupations in Cliffside Park borough are Cleaning & Maintenance (806 | 6.1%), Food Preparation & Serving (612 | 4.6%), Security & Protection (289 | 2.2%), Healthcare Support (225 | 1.7%), and Personal Care & Service (212 | 1.6%).
Services Occupations by Sex
Within the Services occupations in Cliffside Park borough, the most male-oriented occupations are Law Enforcement (100.0%), Security & Protection (75.1%), and Cleaning & Maintenance (57.2%), while the most female-oriented occupations are Healthcare Support (81.8%), Firefighting & Prevention (58.1%), and Personal Care & Service (57.6%).
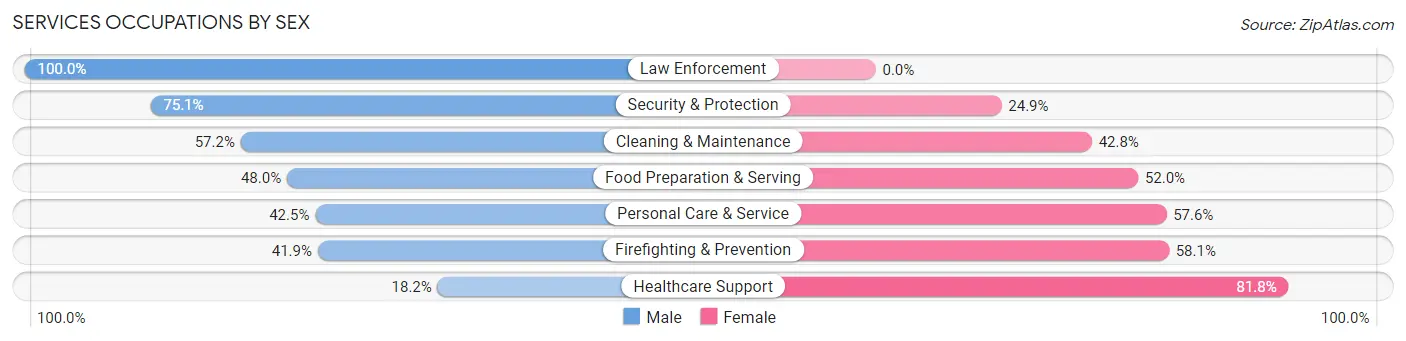
| Occupation | Male | Female |
| Healthcare Support | 41 (18.2%) | 184 (81.8%) |
| Security & Protection | 217 (75.1%) | 72 (24.9%) |
| Firefighting & Prevention | 52 (41.9%) | 72 (58.1%) |
| Law Enforcement | 165 (100.0%) | 0 (0.0%) |
| Food Preparation & Serving | 294 (48.0%) | 318 (52.0%) |
| Cleaning & Maintenance | 461 (57.2%) | 345 (42.8%) |
| Personal Care & Service | 90 (42.4%) | 122 (57.6%) |
| Total (Category) | 1,103 (51.4%) | 1,041 (48.5%) |
| Total (Overall) | 7,574 (57.1%) | 5,684 (42.9%) |
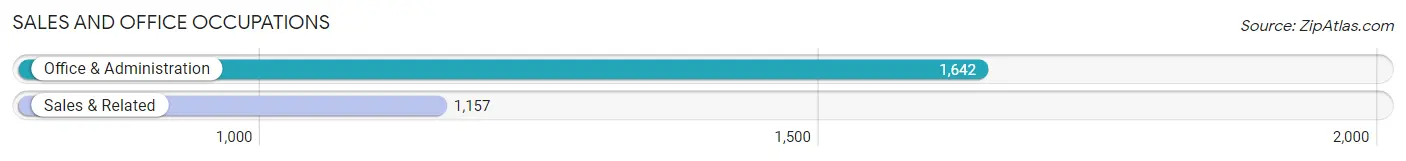
Sales and Office Occupations
The most common Sales and Office occupations in Cliffside Park borough are Office & Administration (1,642 | 12.4%), and Sales & Related (1,157 | 8.7%).
Sales and Office Occupations by Sex
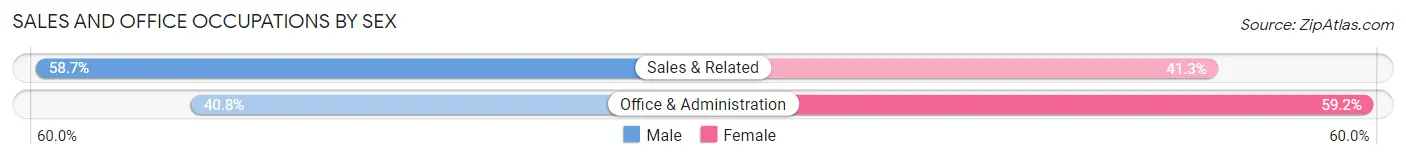
| Occupation | Male | Female |
| Sales & Related | 679 (58.7%) | 478 (41.3%) |
| Office & Administration | 670 (40.8%) | 972 (59.2%) |
| Total (Category) | 1,349 (48.2%) | 1,450 (51.8%) |
| Total (Overall) | 7,574 (57.1%) | 5,684 (42.9%) |
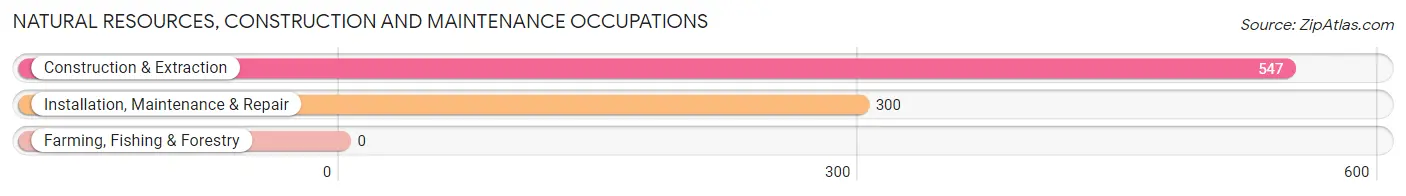
Natural Resources, Construction and Maintenance Occupations
The most common Natural Resources, Construction and Maintenance occupations in Cliffside Park borough are Construction & Extraction (547 | 4.1%), and Installation, Maintenance & Repair (300 | 2.3%).
Natural Resources, Construction and Maintenance Occupations by Sex
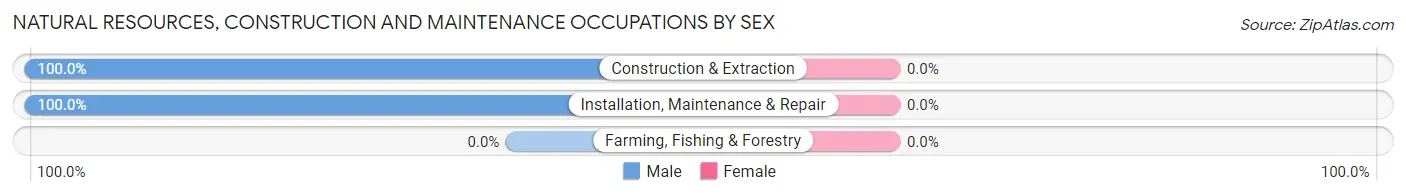
| Occupation | Male | Female |
| Farming, Fishing & Forestry | 0 (0.0%) | 0 (0.0%) |
| Construction & Extraction | 547 (100.0%) | 0 (0.0%) |
| Installation, Maintenance & Repair | 300 (100.0%) | 0 (0.0%) |
| Total (Category) | 847 (100.0%) | 0 (0.0%) |
| Total (Overall) | 7,574 (57.1%) | 5,684 (42.9%) |
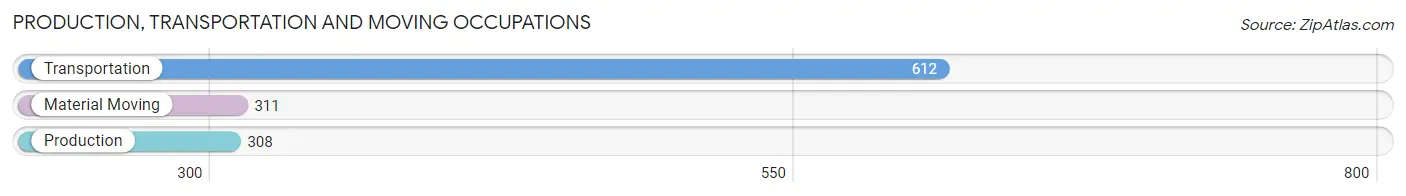
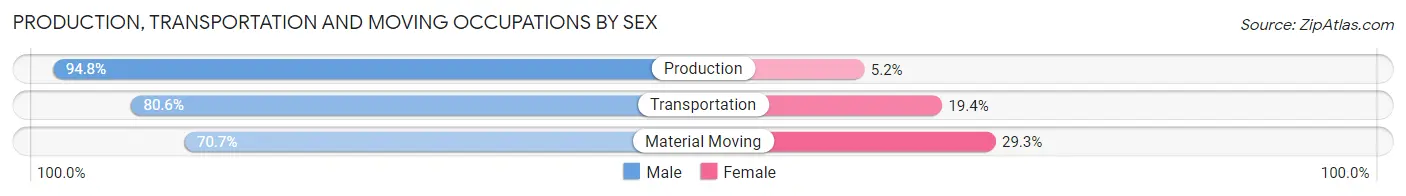
Production, Transportation and Moving Occupations
The most common Production, Transportation and Moving occupations in Cliffside Park borough are Transportation (612 | 4.6%), Material Moving (311 | 2.4%), and Production (308 | 2.3%).
Production, Transportation and Moving Occupations by Sex
| Occupation | Male | Female |
| Production | 292 (94.8%) | 16 (5.2%) |
| Transportation | 493 (80.6%) | 119 (19.4%) |
| Material Moving | 220 (70.7%) | 91 (29.3%) |
| Total (Category) | 1,005 (81.6%) | 226 (18.4%) |
| Total (Overall) | 7,574 (57.1%) | 5,684 (42.9%) |
Employment Industries by Sex in Cliffside Park borough
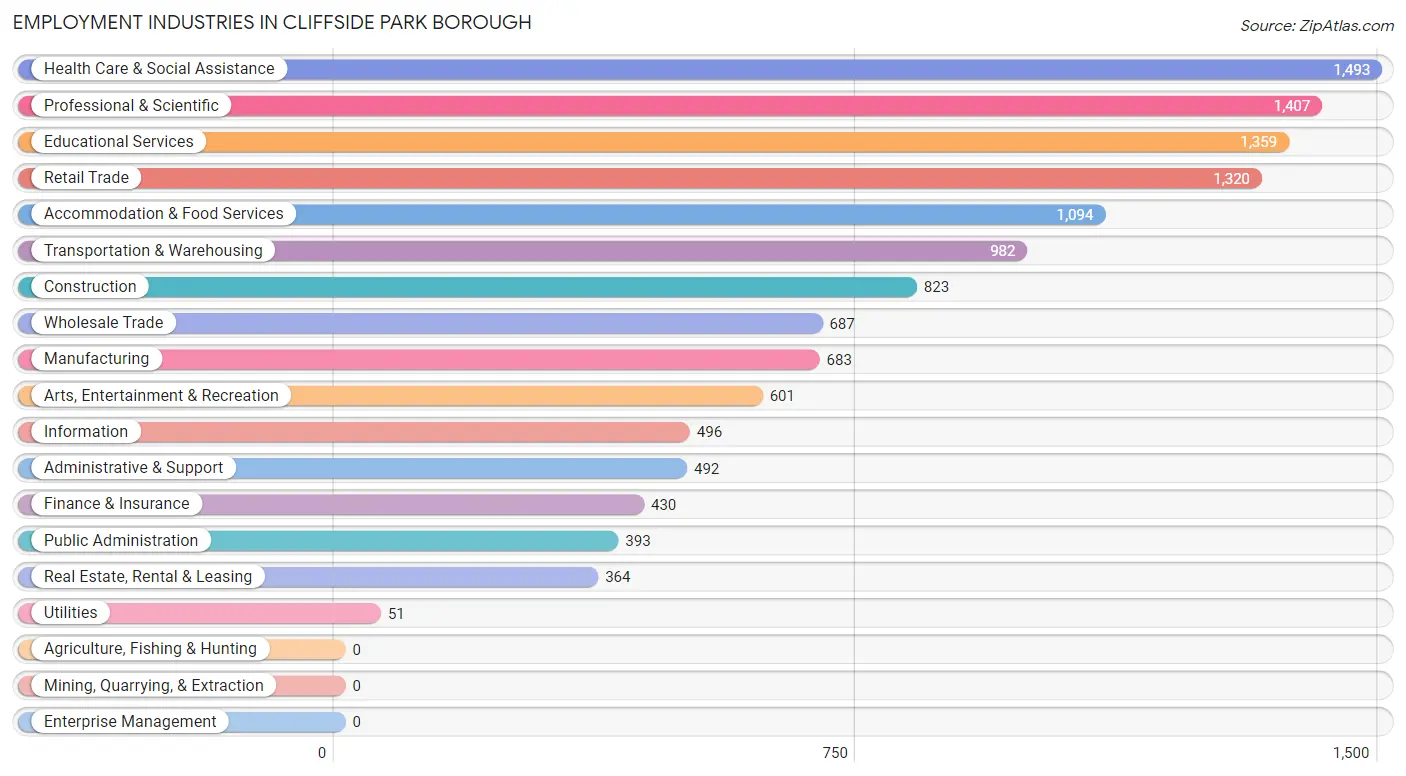
Employment Industries in Cliffside Park borough
The major employment industries in Cliffside Park borough include Health Care & Social Assistance (1,493 | 11.3%), Professional & Scientific (1,407 | 10.6%), Educational Services (1,359 | 10.2%), Retail Trade (1,320 | 10.0%), and Accommodation & Food Services (1,094 | 8.3%).
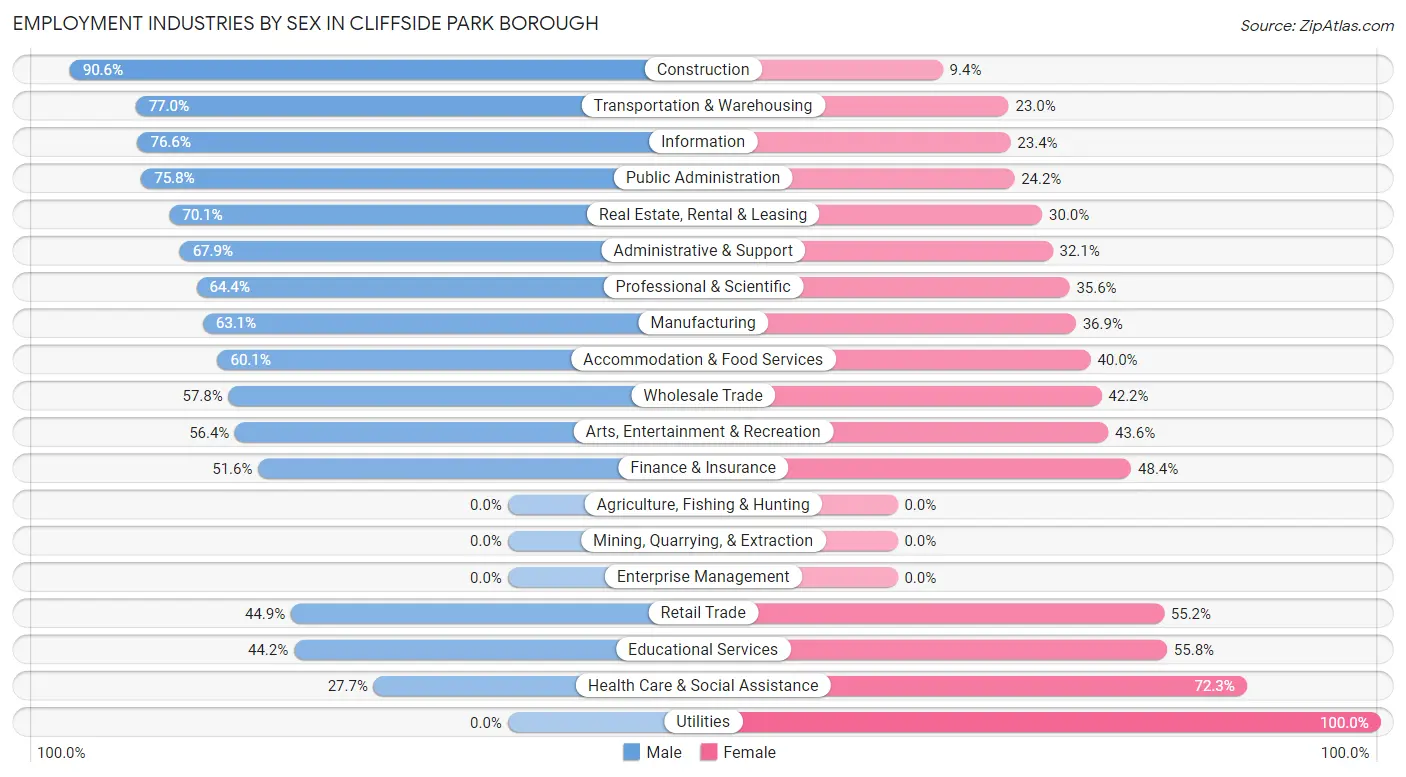
Employment Industries by Sex in Cliffside Park borough
The Cliffside Park borough industries that see more men than women are Construction (90.6%), Transportation & Warehousing (77.0%), and Information (76.6%), whereas the industries that tend to have a higher number of women are Utilities (100.0%), Health Care & Social Assistance (72.3%), and Educational Services (55.8%).
| Industry | Male | Female |
| Agriculture, Fishing & Hunting | 0 (0.0%) | 0 (0.0%) |
| Mining, Quarrying, & Extraction | 0 (0.0%) | 0 (0.0%) |
| Construction | 746 (90.6%) | 77 (9.4%) |
| Manufacturing | 431 (63.1%) | 252 (36.9%) |
| Wholesale Trade | 397 (57.8%) | 290 (42.2%) |
| Retail Trade | 592 (44.9%) | 728 (55.1%) |
| Transportation & Warehousing | 756 (77.0%) | 226 (23.0%) |
| Utilities | 0 (0.0%) | 51 (100.0%) |
| Information | 380 (76.6%) | 116 (23.4%) |
| Finance & Insurance | 222 (51.6%) | 208 (48.4%) |
| Real Estate, Rental & Leasing | 255 (70.1%) | 109 (29.9%) |
| Professional & Scientific | 906 (64.4%) | 501 (35.6%) |
| Enterprise Management | 0 (0.0%) | 0 (0.0%) |
| Administrative & Support | 334 (67.9%) | 158 (32.1%) |
| Educational Services | 601 (44.2%) | 758 (55.8%) |
| Health Care & Social Assistance | 414 (27.7%) | 1,079 (72.3%) |
| Arts, Entertainment & Recreation | 339 (56.4%) | 262 (43.6%) |
| Accommodation & Food Services | 657 (60.1%) | 437 (40.0%) |
| Public Administration | 298 (75.8%) | 95 (24.2%) |
| Total | 7,574 (57.1%) | 5,684 (42.9%) |
Education in Cliffside Park borough
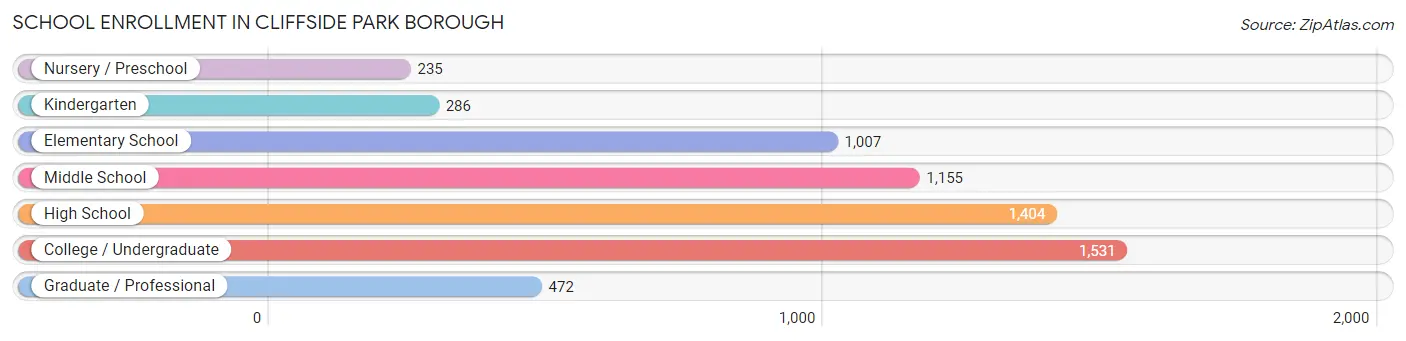
School Enrollment in Cliffside Park borough
The most common levels of schooling among the 6,090 students in Cliffside Park borough are college / undergraduate (1,531 | 25.1%), high school (1,404 | 23.1%), and middle school (1,155 | 19.0%).
| School Level | # Students | % Students |
| Nursery / Preschool | 235 | 3.9% |
| Kindergarten | 286 | 4.7% |
| Elementary School | 1,007 | 16.5% |
| Middle School | 1,155 | 19.0% |
| High School | 1,404 | 23.1% |
| College / Undergraduate | 1,531 | 25.1% |
| Graduate / Professional | 472 | 7.7% |
| Total | 6,090 | 100.0% |
School Enrollment by Age by Funding Source in Cliffside Park borough
Out of a total of 6,090 students who are enrolled in schools in Cliffside Park borough, 1,547 (25.4%) attend a private institution, while the remaining 4,543 (74.6%) are enrolled in public schools. The age group of 35 years and over has the highest likelihood of being enrolled in private schools, with 349 (73.0% in the age bracket) enrolled. Conversely, the age group of 10 to 14 year olds has the lowest likelihood of being enrolled in a private school, with 1,215 (88.6% in the age bracket) attending a public institution.
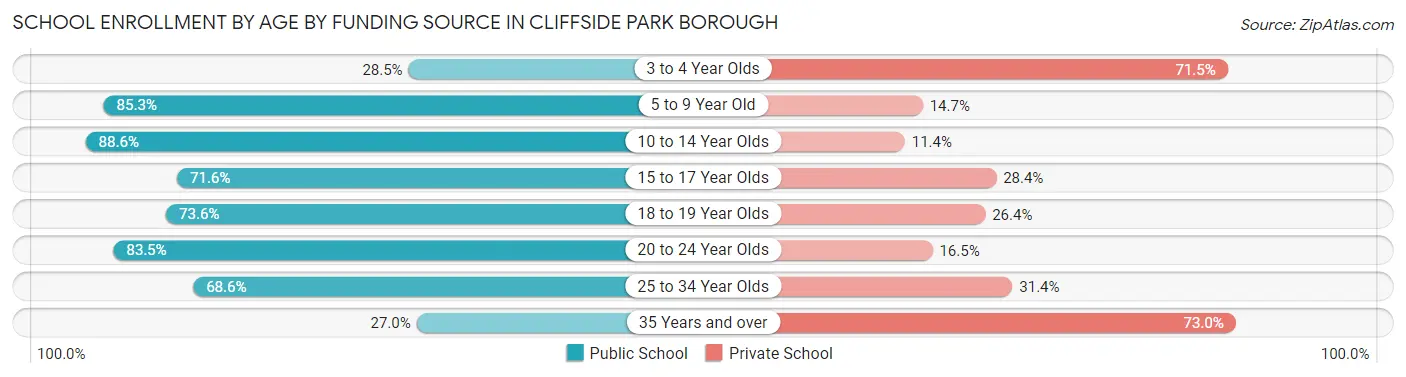
| Age Bracket | Public School | Private School |
| 3 to 4 Year Olds | 61 (28.5%) | 153 (71.5%) |
| 5 to 9 Year Old | 1,077 (85.3%) | 186 (14.7%) |
| 10 to 14 Year Olds | 1,215 (88.6%) | 156 (11.4%) |
| 15 to 17 Year Olds | 844 (71.6%) | 335 (28.4%) |
| 18 to 19 Year Olds | 148 (73.6%) | 53 (26.4%) |
| 20 to 24 Year Olds | 661 (83.5%) | 131 (16.5%) |
| 25 to 34 Year Olds | 406 (68.6%) | 186 (31.4%) |
| 35 Years and over | 129 (27.0%) | 349 (73.0%) |
| Total | 4,543 (74.6%) | 1,547 (25.4%) |
Educational Attainment by Field of Study in Cliffside Park borough
Business (1,976 | 21.6%), social sciences (903 | 9.9%), education (778 | 8.5%), engineering (771 | 8.4%), and psychology (589 | 6.4%) are the most common fields of study among 9,141 individuals in Cliffside Park borough who have obtained a bachelor's degree or higher.
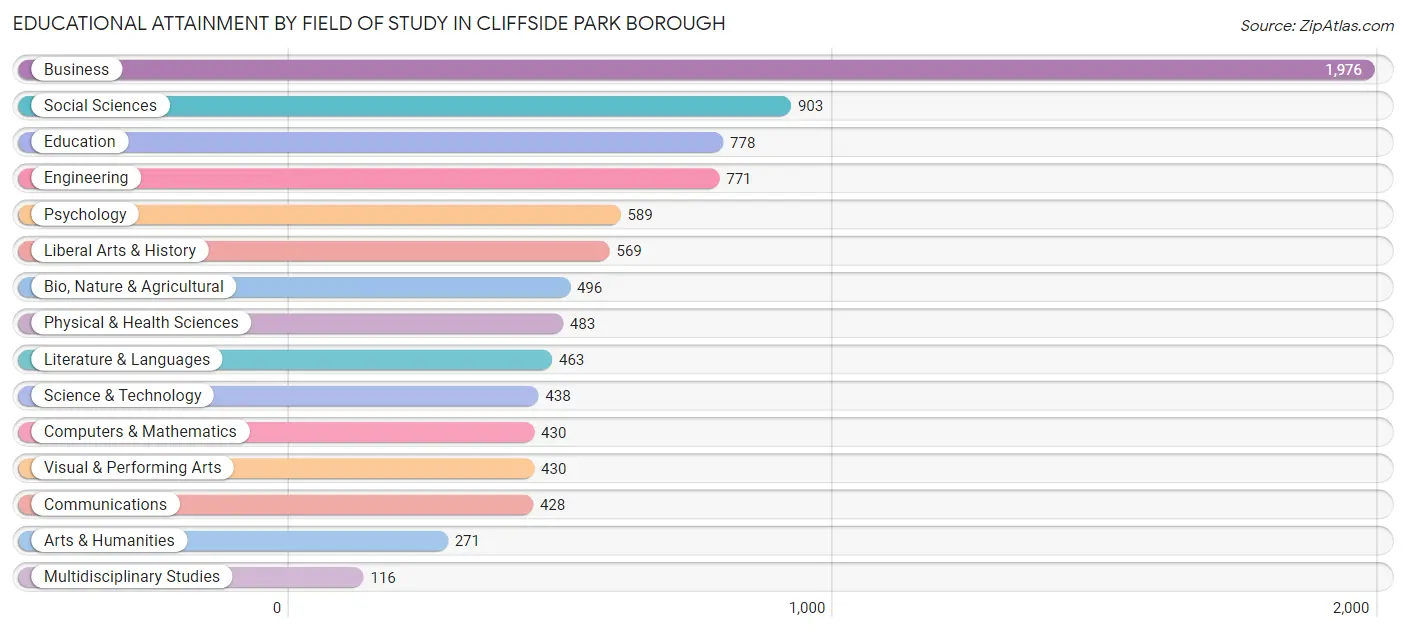
| Field of Study | # Graduates | % Graduates |
| Computers & Mathematics | 430 | 4.7% |
| Bio, Nature & Agricultural | 496 | 5.4% |
| Physical & Health Sciences | 483 | 5.3% |
| Psychology | 589 | 6.4% |
| Social Sciences | 903 | 9.9% |
| Engineering | 771 | 8.4% |
| Multidisciplinary Studies | 116 | 1.3% |
| Science & Technology | 438 | 4.8% |
| Business | 1,976 | 21.6% |
| Education | 778 | 8.5% |
| Literature & Languages | 463 | 5.1% |
| Liberal Arts & History | 569 | 6.2% |
| Visual & Performing Arts | 430 | 4.7% |
| Communications | 428 | 4.7% |
| Arts & Humanities | 271 | 3.0% |
| Total | 9,141 | 100.0% |
Transportation & Commute in Cliffside Park borough
Vehicle Availability by Sex in Cliffside Park borough
The most prevalent vehicle ownership categories in Cliffside Park borough are males with 1 vehicle (3,222, accounting for 43.6%) and females with 1 vehicle (2,374, making up 59.0%).
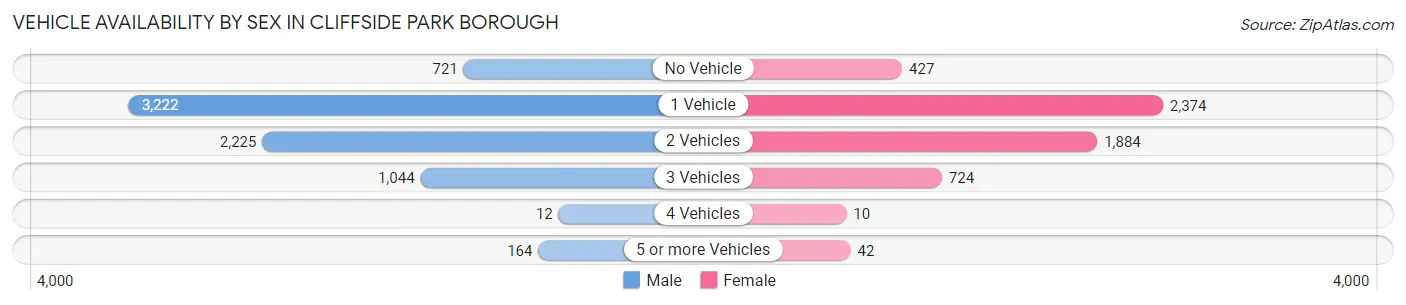
| Vehicles Available | Male | Female |
| No Vehicle | 721 (9.8%) | 427 (7.8%) |
| 1 Vehicle | 3,222 (43.6%) | 2,374 (43.5%) |
| 2 Vehicles | 2,225 (30.1%) | 1,884 (34.5%) |
| 3 Vehicles | 1,044 (14.1%) | 724 (13.3%) |
| 4 Vehicles | 12 (0.2%) | 10 (0.2%) |
| 5 or more Vehicles | 164 (2.2%) | 42 (0.8%) |
| Total | 7,388 (100.0%) | 5,461 (100.0%) |
Commute Time in Cliffside Park borough
The most frequently occuring commute durations in Cliffside Park borough are 60 to 89 minutes (2,013 commuters, 18.4%), 20 to 24 minutes (1,558 commuters, 14.3%), and 30 to 34 minutes (1,556 commuters, 14.2%).
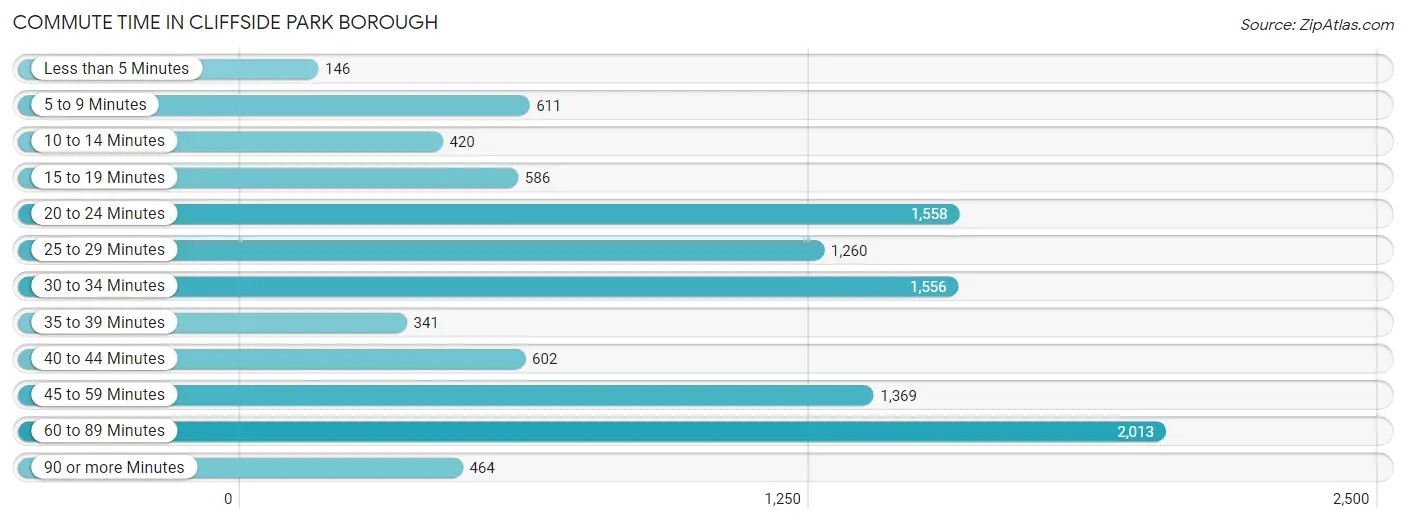
| Commute Time | # Commuters | % Commuters |
| Less than 5 Minutes | 146 | 1.3% |
| 5 to 9 Minutes | 611 | 5.6% |
| 10 to 14 Minutes | 420 | 3.8% |
| 15 to 19 Minutes | 586 | 5.4% |
| 20 to 24 Minutes | 1,558 | 14.3% |
| 25 to 29 Minutes | 1,260 | 11.5% |
| 30 to 34 Minutes | 1,556 | 14.2% |
| 35 to 39 Minutes | 341 | 3.1% |
| 40 to 44 Minutes | 602 | 5.5% |
| 45 to 59 Minutes | 1,369 | 12.5% |
| 60 to 89 Minutes | 2,013 | 18.4% |
| 90 or more Minutes | 464 | 4.3% |
Commute Time by Sex in Cliffside Park borough
The most common commute times in Cliffside Park borough are 60 to 89 minutes (1,140 commuters, 18.1%) for males and 60 to 89 minutes (873 commuters, 18.8%) for females.
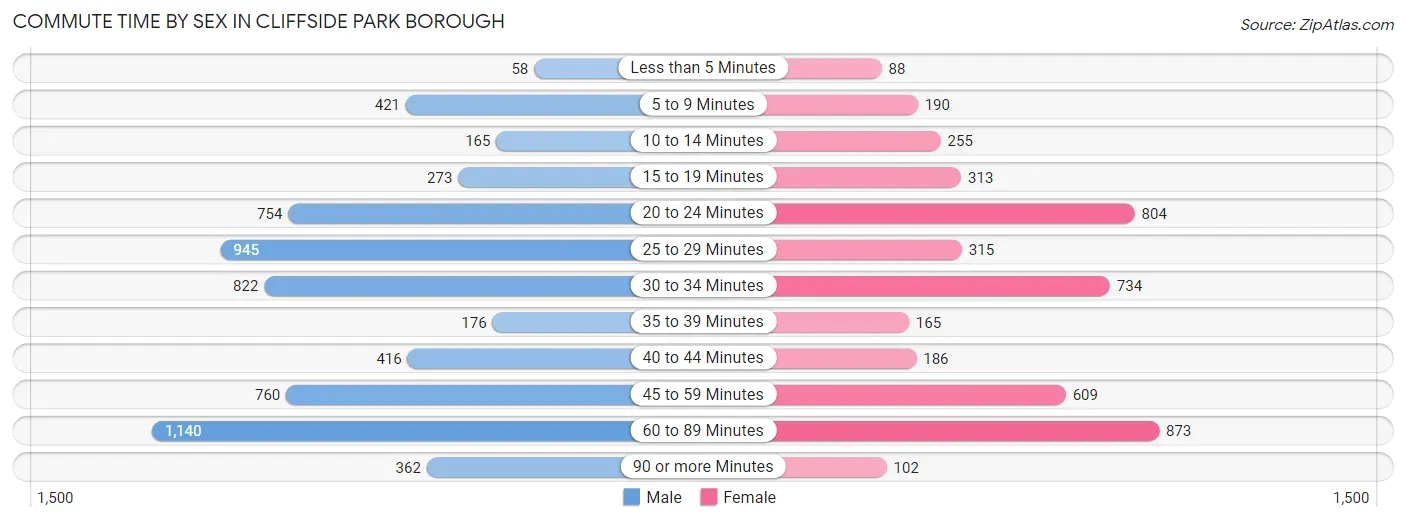
| Commute Time | Male | Female |
| Less than 5 Minutes | 58 (0.9%) | 88 (1.9%) |
| 5 to 9 Minutes | 421 (6.7%) | 190 (4.1%) |
| 10 to 14 Minutes | 165 (2.6%) | 255 (5.5%) |
| 15 to 19 Minutes | 273 (4.3%) | 313 (6.8%) |
| 20 to 24 Minutes | 754 (12.0%) | 804 (17.3%) |
| 25 to 29 Minutes | 945 (15.0%) | 315 (6.8%) |
| 30 to 34 Minutes | 822 (13.1%) | 734 (15.8%) |
| 35 to 39 Minutes | 176 (2.8%) | 165 (3.6%) |
| 40 to 44 Minutes | 416 (6.6%) | 186 (4.0%) |
| 45 to 59 Minutes | 760 (12.1%) | 609 (13.1%) |
| 60 to 89 Minutes | 1,140 (18.1%) | 873 (18.8%) |
| 90 or more Minutes | 362 (5.8%) | 102 (2.2%) |
Time of Departure to Work by Sex in Cliffside Park borough
The most frequent times of departure to work in Cliffside Park borough are 8:00 AM to 8:29 AM (1,110, 17.6%) for males and 8:00 AM to 8:29 AM (978, 21.1%) for females.
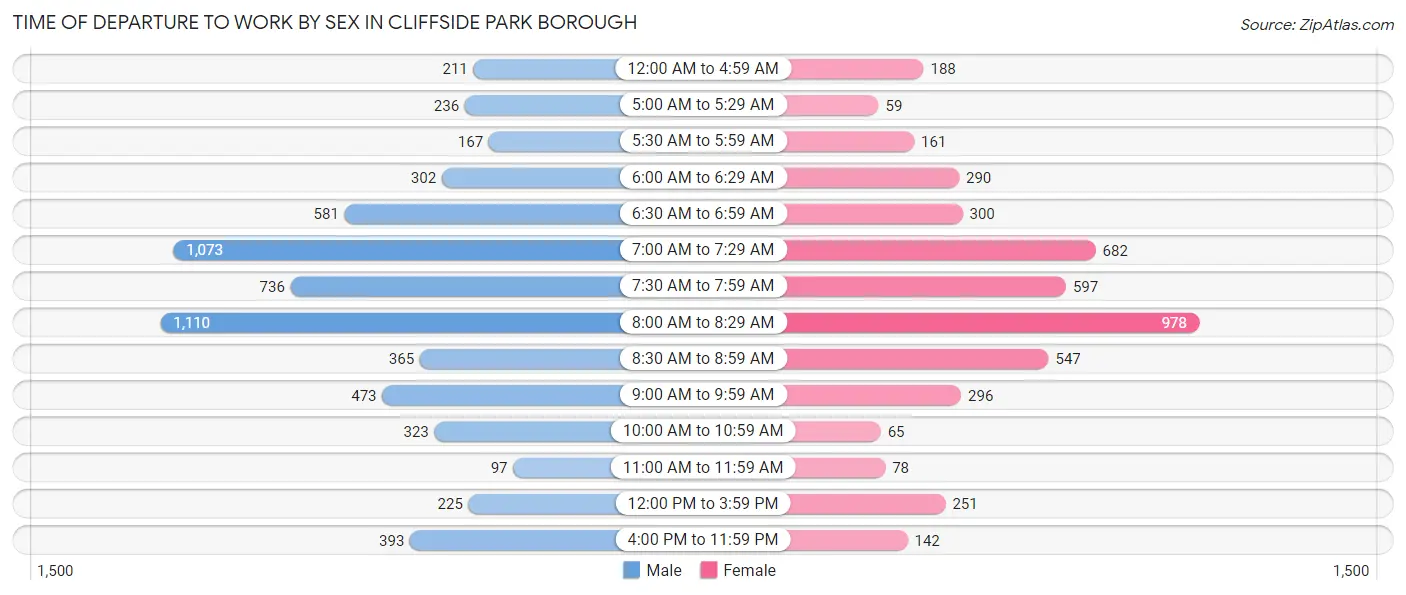
| Time of Departure | Male | Female |
| 12:00 AM to 4:59 AM | 211 (3.4%) | 188 (4.1%) |
| 5:00 AM to 5:29 AM | 236 (3.7%) | 59 (1.3%) |
| 5:30 AM to 5:59 AM | 167 (2.6%) | 161 (3.5%) |
| 6:00 AM to 6:29 AM | 302 (4.8%) | 290 (6.3%) |
| 6:30 AM to 6:59 AM | 581 (9.2%) | 300 (6.5%) |
| 7:00 AM to 7:29 AM | 1,073 (17.1%) | 682 (14.7%) |
| 7:30 AM to 7:59 AM | 736 (11.7%) | 597 (12.9%) |
| 8:00 AM to 8:29 AM | 1,110 (17.6%) | 978 (21.1%) |
| 8:30 AM to 8:59 AM | 365 (5.8%) | 547 (11.8%) |
| 9:00 AM to 9:59 AM | 473 (7.5%) | 296 (6.4%) |
| 10:00 AM to 10:59 AM | 323 (5.1%) | 65 (1.4%) |
| 11:00 AM to 11:59 AM | 97 (1.5%) | 78 (1.7%) |
| 12:00 PM to 3:59 PM | 225 (3.6%) | 251 (5.4%) |
| 4:00 PM to 11:59 PM | 393 (6.2%) | 142 (3.1%) |
| Total | 6,292 (100.0%) | 4,634 (100.0%) |
Housing Occupancy in Cliffside Park borough
Occupancy by Ownership in Cliffside Park borough
Of the total 10,526 dwellings in Cliffside Park borough, owner-occupied units account for 5,084 (48.3%), while renter-occupied units make up 5,442 (51.7%).
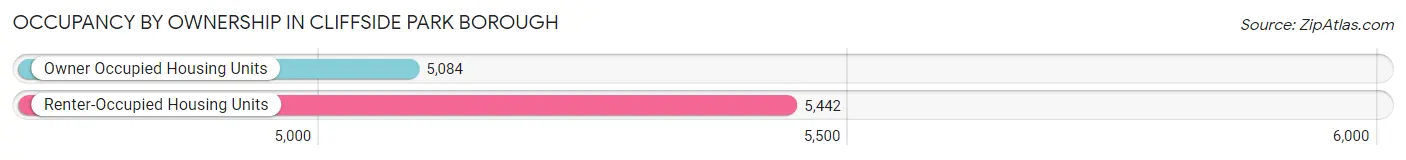
| Occupancy | # Housing Units | % Housing Units |
| Owner Occupied Housing Units | 5,084 | 48.3% |
| Renter-Occupied Housing Units | 5,442 | 51.7% |
| Total Occupied Housing Units | 10,526 | 100.0% |
Occupancy by Household Size in Cliffside Park borough
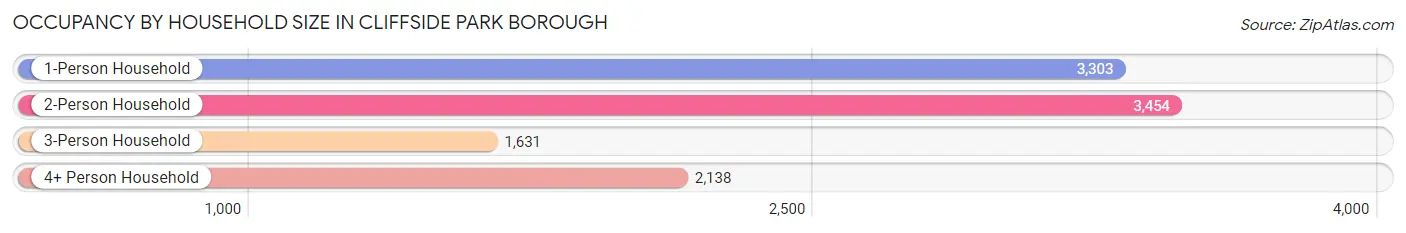
| Household Size | # Housing Units | % Housing Units |
| 1-Person Household | 3,303 | 31.4% |
| 2-Person Household | 3,454 | 32.8% |
| 3-Person Household | 1,631 | 15.5% |
| 4+ Person Household | 2,138 | 20.3% |
| Total Housing Units | 10,526 | 100.0% |
Occupancy by Ownership by Household Size in Cliffside Park borough
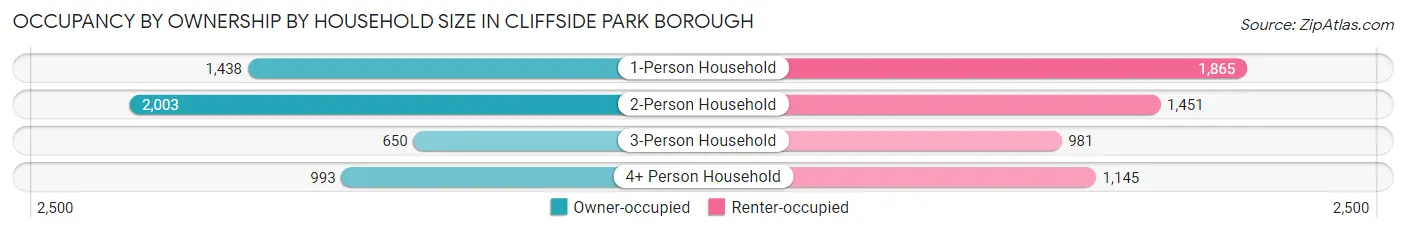
| Household Size | Owner-occupied | Renter-occupied |
| 1-Person Household | 1,438 (43.5%) | 1,865 (56.5%) |
| 2-Person Household | 2,003 (58.0%) | 1,451 (42.0%) |
| 3-Person Household | 650 (39.9%) | 981 (60.2%) |
| 4+ Person Household | 993 (46.5%) | 1,145 (53.5%) |
| Total Housing Units | 5,084 (48.3%) | 5,442 (51.7%) |
Occupancy by Educational Attainment in Cliffside Park borough
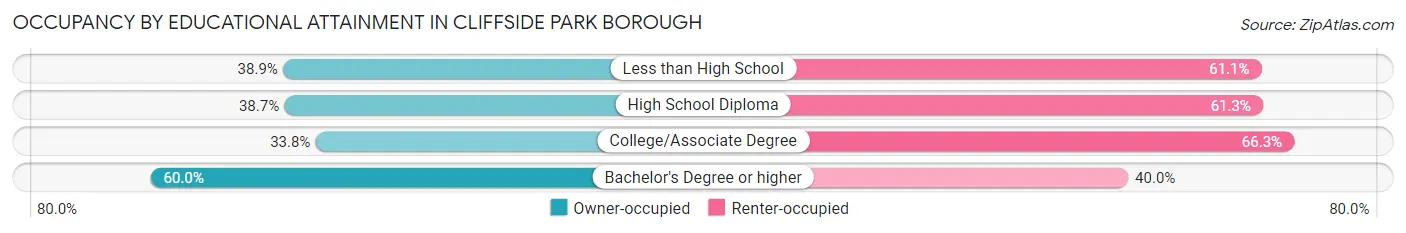
| Household Size | Owner-occupied | Renter-occupied |
| Less than High School | 451 (38.9%) | 708 (61.1%) |
| High School Diploma | 873 (38.7%) | 1,383 (61.3%) |
| College/Associate Degree | 653 (33.8%) | 1,282 (66.2%) |
| Bachelor's Degree or higher | 3,107 (60.0%) | 2,069 (40.0%) |
Occupancy by Age of Householder in Cliffside Park borough
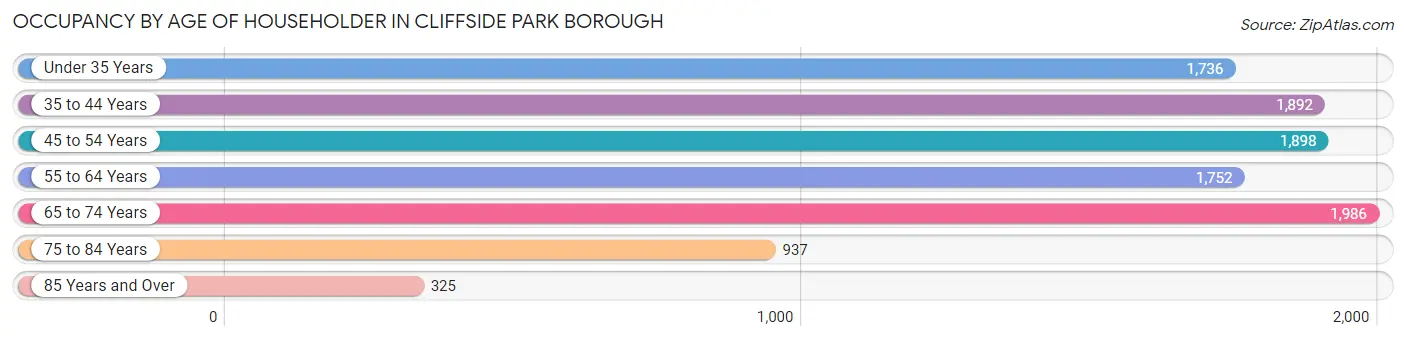
| Age Bracket | # Households | % Households |
| Under 35 Years | 1,736 | 16.5% |
| 35 to 44 Years | 1,892 | 18.0% |
| 45 to 54 Years | 1,898 | 18.0% |
| 55 to 64 Years | 1,752 | 16.6% |
| 65 to 74 Years | 1,986 | 18.9% |
| 75 to 84 Years | 937 | 8.9% |
| 85 Years and Over | 325 | 3.1% |
| Total | 10,526 | 100.0% |
Housing Finances in Cliffside Park borough
Median Income by Occupancy in Cliffside Park borough
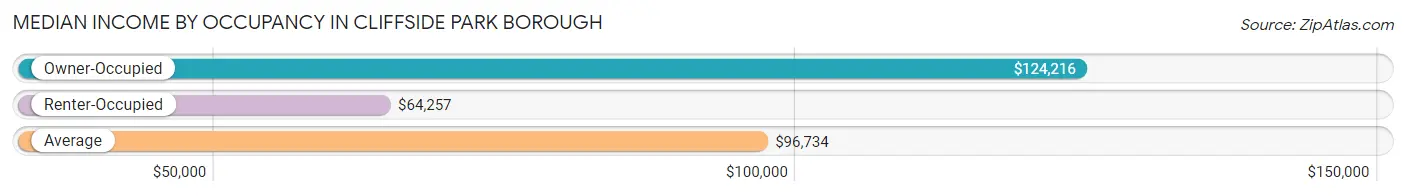
| Occupancy Type | # Households | Median Income |
| Owner-Occupied | 5,084 (48.3%) | $124,216 |
| Renter-Occupied | 5,442 (51.7%) | $64,257 |
| Average | 10,526 (100.0%) | $96,734 |
Occupancy by Householder Income Bracket in Cliffside Park borough
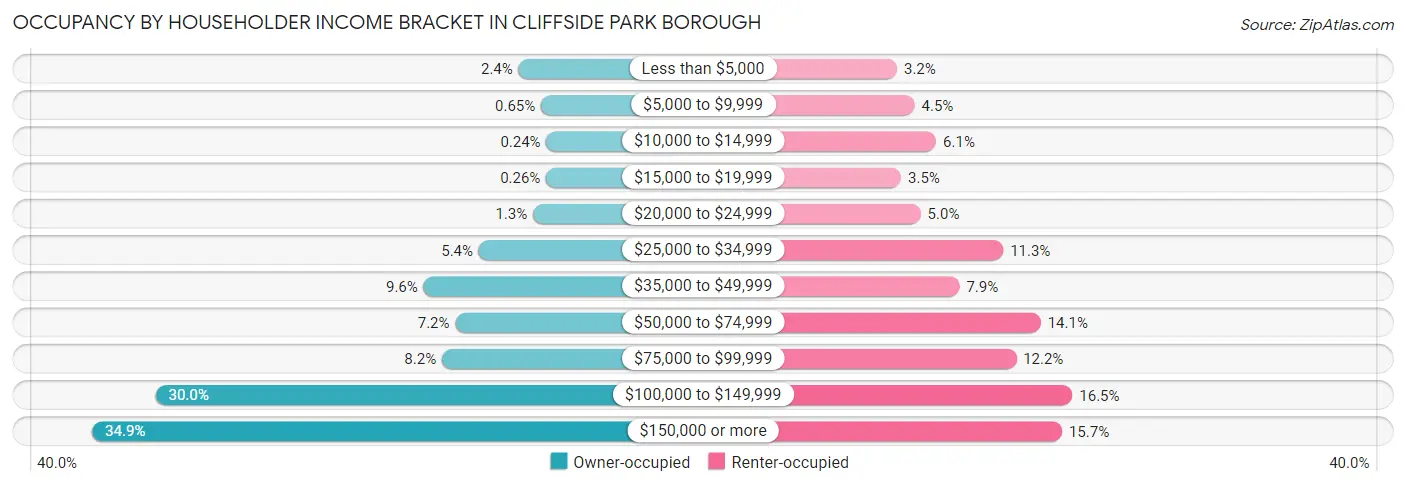
| Income Bracket | Owner-occupied | Renter-occupied |
| Less than $5,000 | 120 (2.4%) | 172 (3.2%) |
| $5,000 to $9,999 | 33 (0.6%) | 245 (4.5%) |
| $10,000 to $14,999 | 12 (0.2%) | 334 (6.1%) |
| $15,000 to $19,999 | 13 (0.3%) | 189 (3.5%) |
| $20,000 to $24,999 | 64 (1.3%) | 270 (5.0%) |
| $25,000 to $34,999 | 274 (5.4%) | 612 (11.3%) |
| $35,000 to $49,999 | 488 (9.6%) | 431 (7.9%) |
| $50,000 to $74,999 | 365 (7.2%) | 768 (14.1%) |
| $75,000 to $99,999 | 417 (8.2%) | 666 (12.2%) |
| $100,000 to $149,999 | 1,526 (30.0%) | 899 (16.5%) |
| $150,000 or more | 1,772 (34.8%) | 856 (15.7%) |
| Total | 5,084 (100.0%) | 5,442 (100.0%) |
Monthly Housing Cost Tiers in Cliffside Park borough
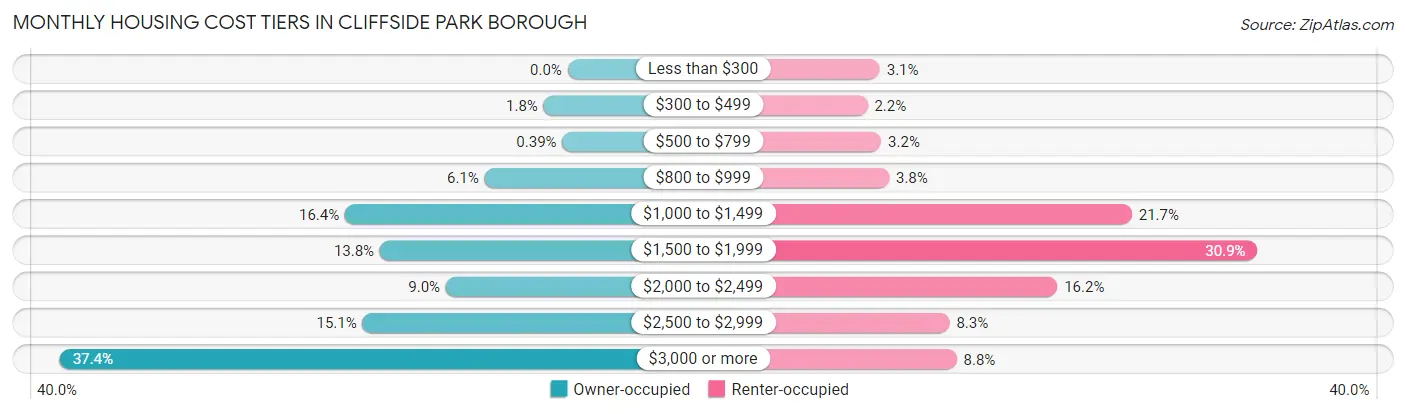
| Monthly Cost | Owner-occupied | Renter-occupied |
| Less than $300 | 0 (0.0%) | 170 (3.1%) |
| $300 to $499 | 90 (1.8%) | 120 (2.2%) |
| $500 to $799 | 20 (0.4%) | 175 (3.2%) |
| $800 to $999 | 311 (6.1%) | 207 (3.8%) |
| $1,000 to $1,499 | 834 (16.4%) | 1,180 (21.7%) |
| $1,500 to $1,999 | 703 (13.8%) | 1,683 (30.9%) |
| $2,000 to $2,499 | 456 (9.0%) | 881 (16.2%) |
| $2,500 to $2,999 | 768 (15.1%) | 449 (8.3%) |
| $3,000 or more | 1,902 (37.4%) | 478 (8.8%) |
| Total | 5,084 (100.0%) | 5,442 (100.0%) |
Physical Housing Characteristics in Cliffside Park borough
Housing Structures in Cliffside Park borough
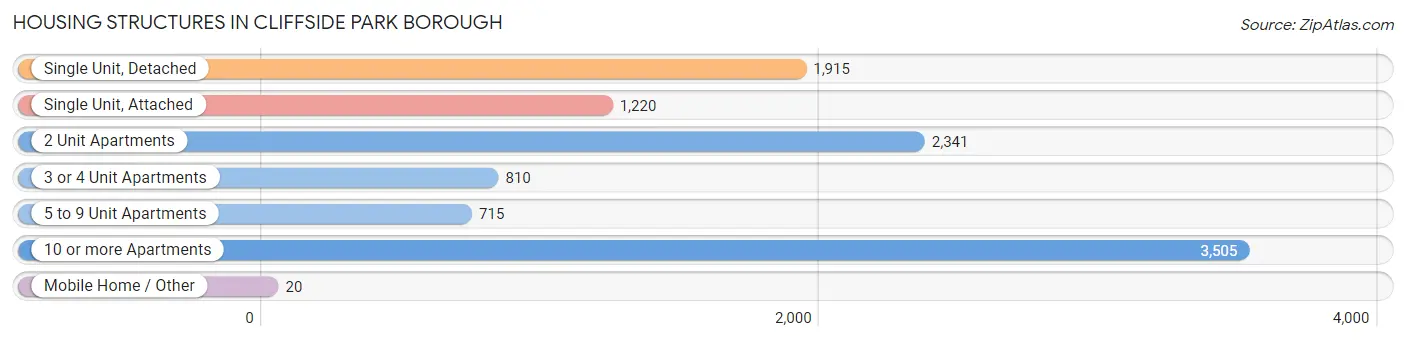
| Structure Type | # Housing Units | % Housing Units |
| Single Unit, Detached | 1,915 | 18.2% |
| Single Unit, Attached | 1,220 | 11.6% |
| 2 Unit Apartments | 2,341 | 22.2% |
| 3 or 4 Unit Apartments | 810 | 7.7% |
| 5 to 9 Unit Apartments | 715 | 6.8% |
| 10 or more Apartments | 3,505 | 33.3% |
| Mobile Home / Other | 20 | 0.2% |
| Total | 10,526 | 100.0% |
Housing Structures by Occupancy in Cliffside Park borough
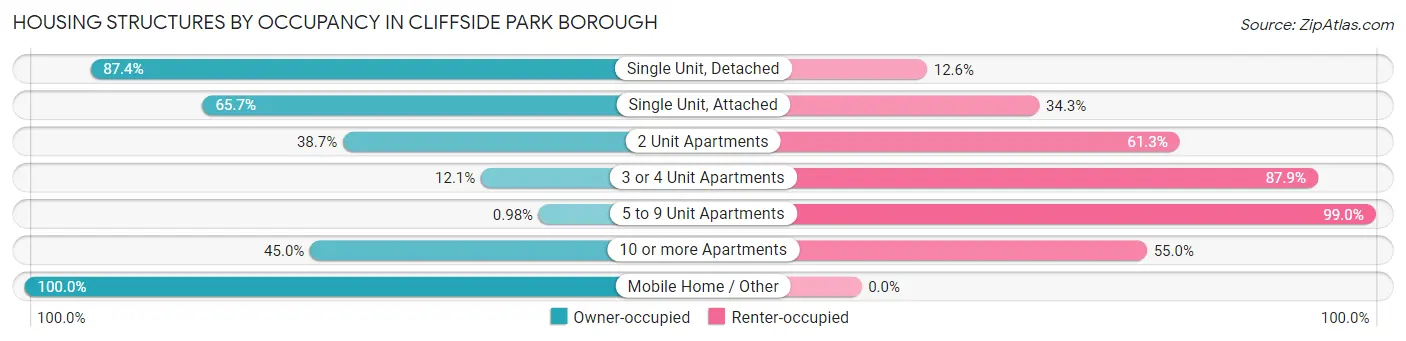
| Structure Type | Owner-occupied | Renter-occupied |
| Single Unit, Detached | 1,673 (87.4%) | 242 (12.6%) |
| Single Unit, Attached | 802 (65.7%) | 418 (34.3%) |
| 2 Unit Apartments | 906 (38.7%) | 1,435 (61.3%) |
| 3 or 4 Unit Apartments | 98 (12.1%) | 712 (87.9%) |
| 5 to 9 Unit Apartments | 7 (1.0%) | 708 (99.0%) |
| 10 or more Apartments | 1,578 (45.0%) | 1,927 (55.0%) |
| Mobile Home / Other | 20 (100.0%) | 0 (0.0%) |
| Total | 5,084 (48.3%) | 5,442 (51.7%) |
Housing Structures by Number of Rooms in Cliffside Park borough
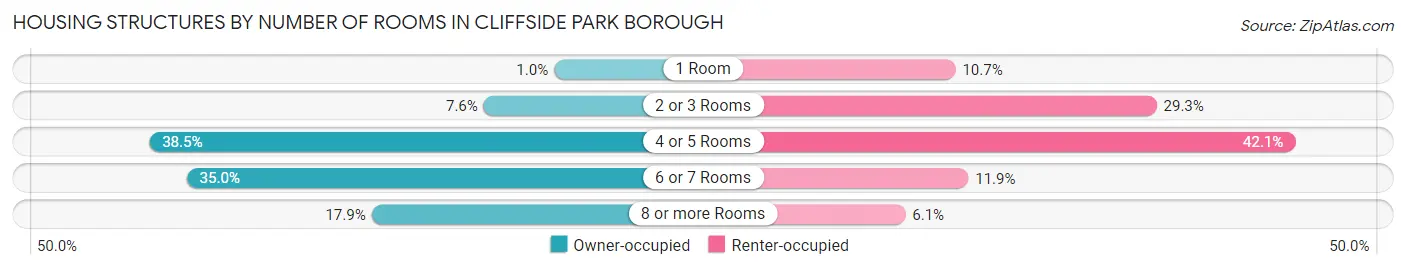
| Number of Rooms | Owner-occupied | Renter-occupied |
| 1 Room | 53 (1.0%) | 582 (10.7%) |
| 2 or 3 Rooms | 384 (7.5%) | 1,594 (29.3%) |
| 4 or 5 Rooms | 1,956 (38.5%) | 2,291 (42.1%) |
| 6 or 7 Rooms | 1,780 (35.0%) | 646 (11.9%) |
| 8 or more Rooms | 911 (17.9%) | 329 (6.0%) |
| Total | 5,084 (100.0%) | 5,442 (100.0%) |
Housing Structure by Heating Type in Cliffside Park borough
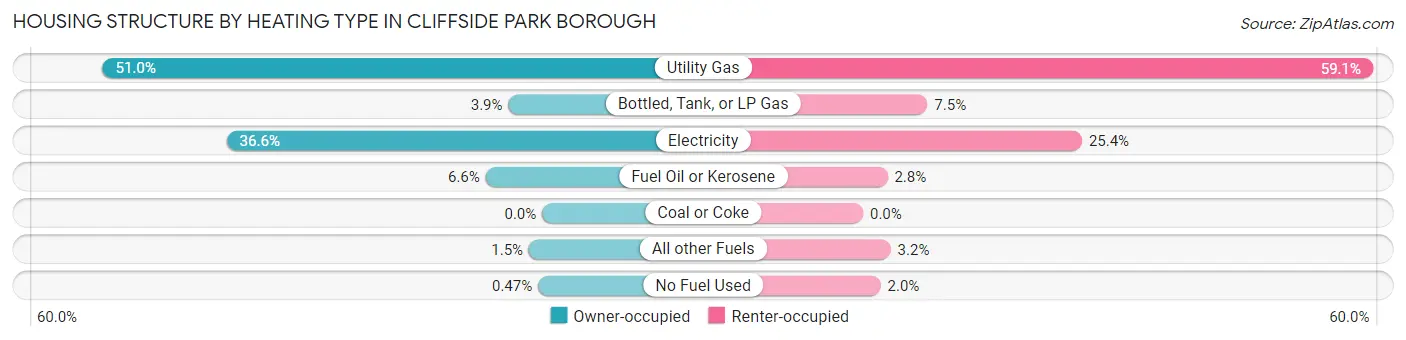
| Heating Type | Owner-occupied | Renter-occupied |
| Utility Gas | 2,591 (51.0%) | 3,216 (59.1%) |
| Bottled, Tank, or LP Gas | 199 (3.9%) | 406 (7.5%) |
| Electricity | 1,859 (36.6%) | 1,381 (25.4%) |
| Fuel Oil or Kerosene | 333 (6.6%) | 154 (2.8%) |
| Coal or Coke | 0 (0.0%) | 0 (0.0%) |
| All other Fuels | 78 (1.5%) | 174 (3.2%) |
| No Fuel Used | 24 (0.5%) | 111 (2.0%) |
| Total | 5,084 (100.0%) | 5,442 (100.0%) |
Household Vehicle Usage in Cliffside Park borough
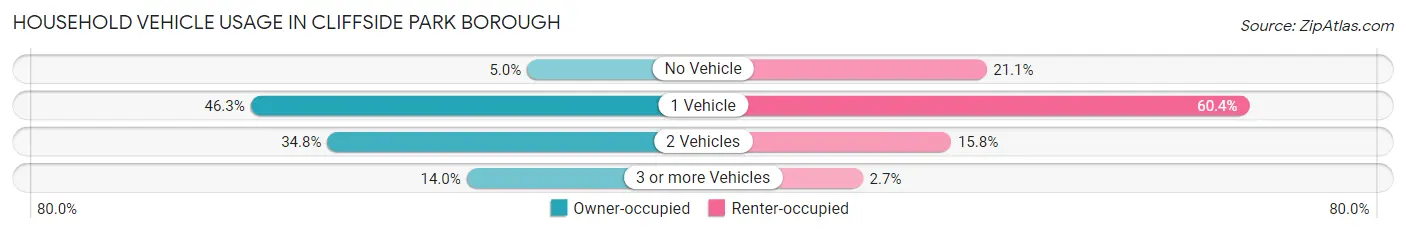
| Vehicles per Household | Owner-occupied | Renter-occupied |
| No Vehicle | 252 (5.0%) | 1,149 (21.1%) |
| 1 Vehicle | 2,352 (46.3%) | 3,287 (60.4%) |
| 2 Vehicles | 1,769 (34.8%) | 862 (15.8%) |
| 3 or more Vehicles | 711 (14.0%) | 144 (2.6%) |
| Total | 5,084 (100.0%) | 5,442 (100.0%) |
Real Estate & Mortgages in Cliffside Park borough
Real Estate and Mortgage Overview in Cliffside Park borough
| Characteristic | Without Mortgage | With Mortgage |
| Housing Units | 2,387 | 2,697 |
| Median Property Value | $482,400 | $551,700 |
| Median Household Income | $104,472 | $1,156 |
| Monthly Housing Costs | $1,501 | $1,682 |
| Real Estate Taxes | $10,001 | $18 |
Property Value by Mortgage Status in Cliffside Park borough
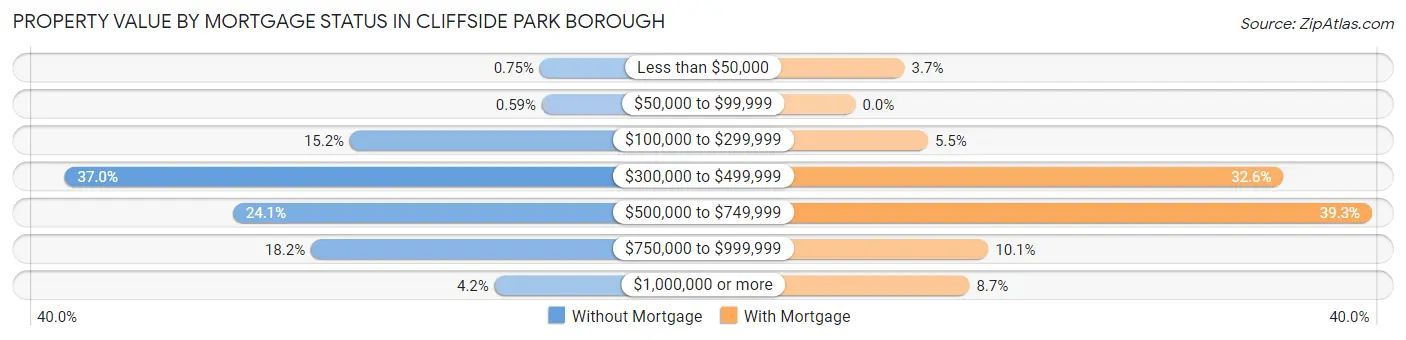
| Property Value | Without Mortgage | With Mortgage |
| Less than $50,000 | 18 (0.7%) | 101 (3.7%) |
| $50,000 to $99,999 | 14 (0.6%) | 0 (0.0%) |
| $100,000 to $299,999 | 363 (15.2%) | 149 (5.5%) |
| $300,000 to $499,999 | 882 (36.9%) | 879 (32.6%) |
| $500,000 to $749,999 | 576 (24.1%) | 1,061 (39.3%) |
| $750,000 to $999,999 | 434 (18.2%) | 273 (10.1%) |
| $1,000,000 or more | 100 (4.2%) | 234 (8.7%) |
| Total | 2,387 (100.0%) | 2,697 (100.0%) |
Household Income by Mortgage Status in Cliffside Park borough
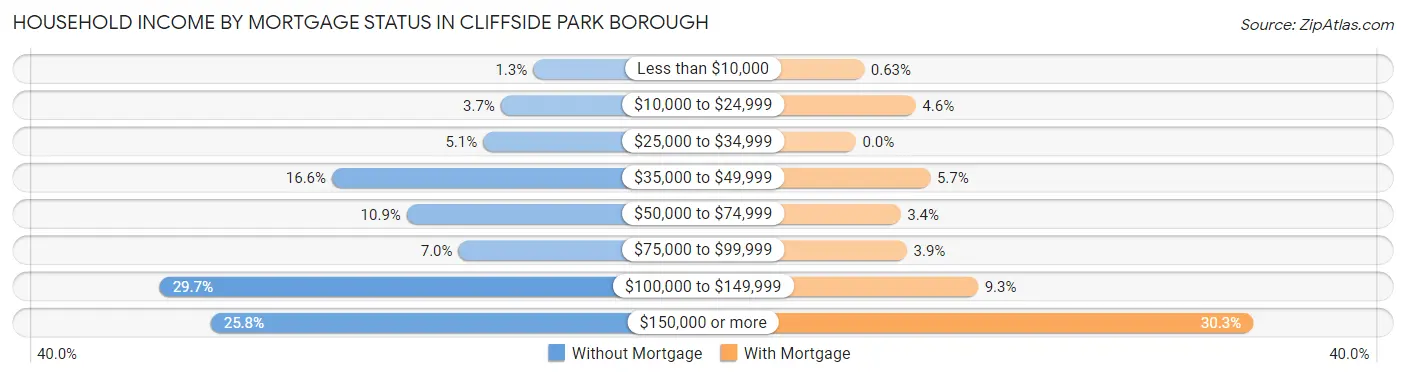
| Household Income | Without Mortgage | With Mortgage |
| Less than $10,000 | 30 (1.3%) | 17 (0.6%) |
| $10,000 to $24,999 | 89 (3.7%) | 123 (4.6%) |
| $25,000 to $34,999 | 121 (5.1%) | 0 (0.0%) |
| $35,000 to $49,999 | 396 (16.6%) | 153 (5.7%) |
| $50,000 to $74,999 | 260 (10.9%) | 92 (3.4%) |
| $75,000 to $99,999 | 166 (7.0%) | 105 (3.9%) |
| $100,000 to $149,999 | 709 (29.7%) | 251 (9.3%) |
| $150,000 or more | 616 (25.8%) | 817 (30.3%) |
| Total | 2,387 (100.0%) | 2,697 (100.0%) |
Property Value to Household Income Ratio in Cliffside Park borough
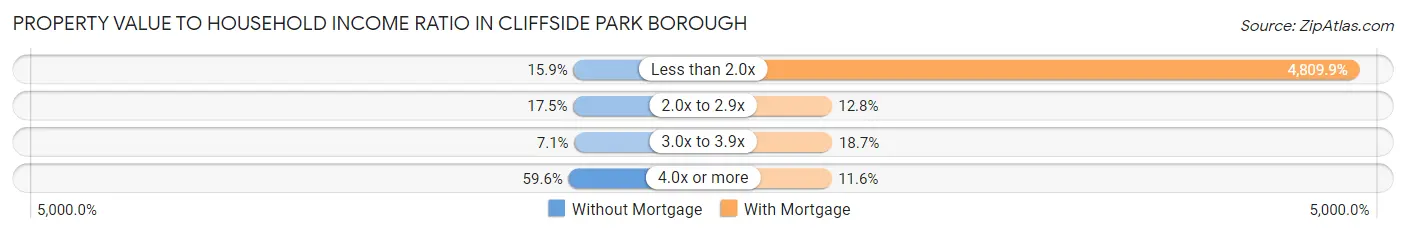
| Value-to-Income Ratio | Without Mortgage | With Mortgage |
| Less than 2.0x | 379 (15.9%) | 129,723 (4,809.9%) |
| 2.0x to 2.9x | 417 (17.5%) | 344 (12.8%) |
| 3.0x to 3.9x | 169 (7.1%) | 504 (18.7%) |
| 4.0x or more | 1,422 (59.6%) | 314 (11.6%) |
| Total | 2,387 (100.0%) | 2,697 (100.0%) |
Real Estate Taxes by Mortgage Status in Cliffside Park borough
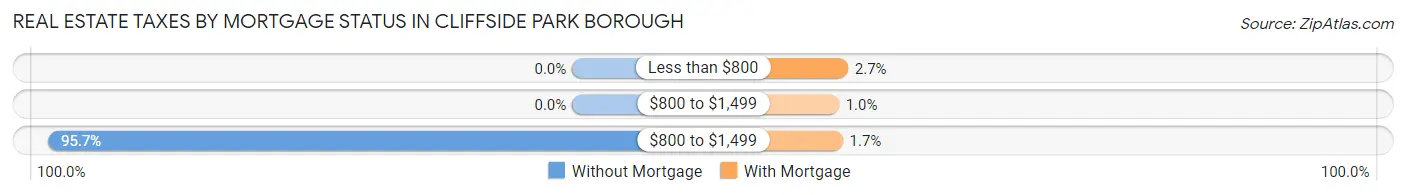
| Property Taxes | Without Mortgage | With Mortgage |
| Less than $800 | 0 (0.0%) | 73 (2.7%) |
| $800 to $1,499 | 0 (0.0%) | 28 (1.0%) |
| $800 to $1,499 | 2,285 (95.7%) | 47 (1.7%) |
| Total | 2,387 (100.0%) | 2,697 (100.0%) |
Health & Disability in Cliffside Park borough
Health Insurance Coverage by Age in Cliffside Park borough
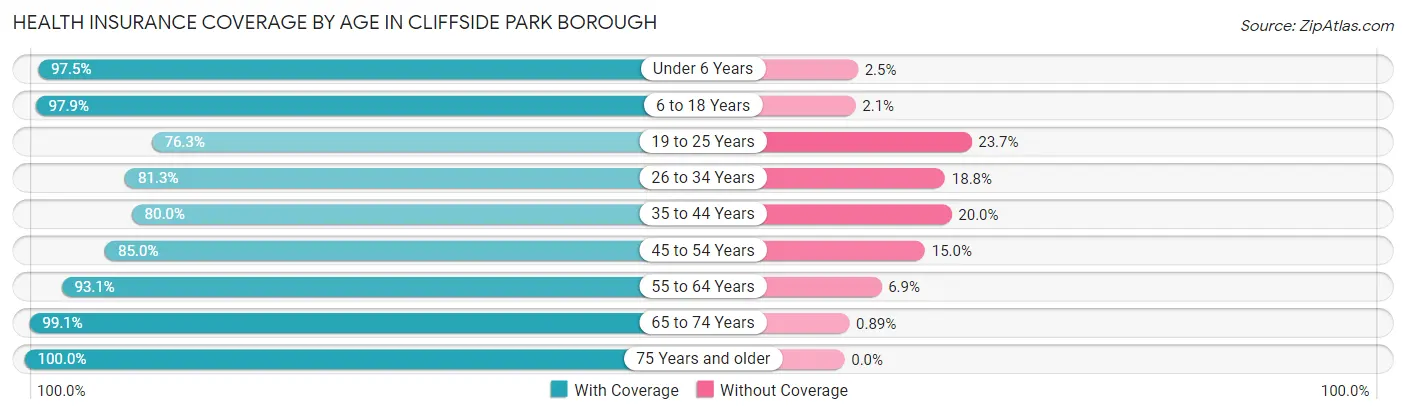
| Age Bracket | With Coverage | Without Coverage |
| Under 6 Years | 1,367 (97.5%) | 35 (2.5%) |
| 6 to 18 Years | 3,844 (97.9%) | 81 (2.1%) |
| 19 to 25 Years | 1,415 (76.3%) | 439 (23.7%) |
| 26 to 34 Years | 3,263 (81.2%) | 753 (18.8%) |
| 35 to 44 Years | 2,527 (80.0%) | 630 (20.0%) |
| 45 to 54 Years | 2,662 (85.0%) | 470 (15.0%) |
| 55 to 64 Years | 2,964 (93.1%) | 219 (6.9%) |
| 65 to 74 Years | 3,014 (99.1%) | 27 (0.9%) |
| 75 Years and older | 1,836 (100.0%) | 0 (0.0%) |
| Total | 22,892 (89.6%) | 2,654 (10.4%) |
Health Insurance Coverage by Citizenship Status in Cliffside Park borough
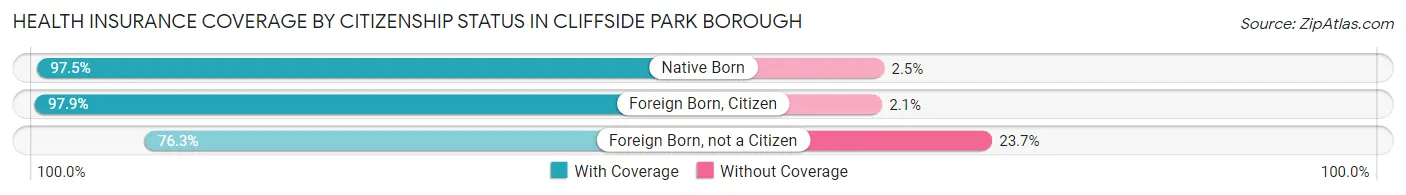
| Citizenship Status | With Coverage | Without Coverage |
| Native Born | 1,367 (97.5%) | 35 (2.5%) |
| Foreign Born, Citizen | 3,844 (97.9%) | 81 (2.1%) |
| Foreign Born, not a Citizen | 1,415 (76.3%) | 439 (23.7%) |
Health Insurance Coverage by Household Income in Cliffside Park borough
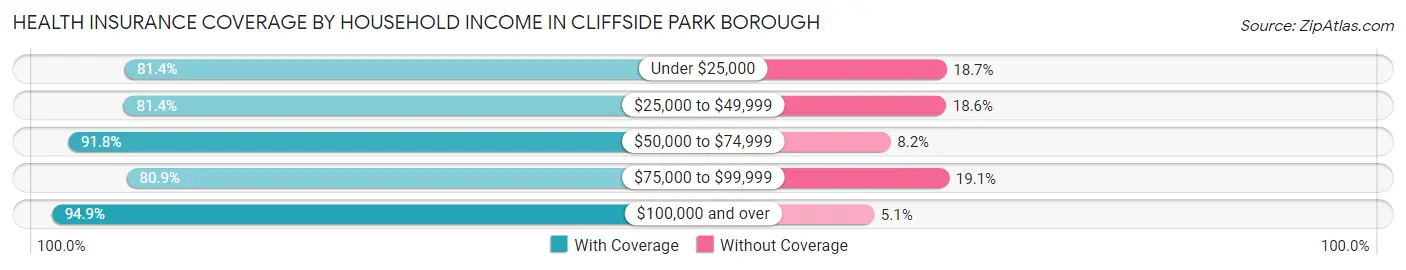
| Household Income | With Coverage | Without Coverage |
| Under $25,000 | 2,059 (81.4%) | 472 (18.6%) |
| $25,000 to $49,999 | 3,081 (81.4%) | 702 (18.6%) |
| $50,000 to $74,999 | 1,981 (91.8%) | 176 (8.2%) |
| $75,000 to $99,999 | 2,515 (80.9%) | 595 (19.1%) |
| $100,000 and over | 13,251 (94.9%) | 709 (5.1%) |
Public vs Private Health Insurance Coverage by Age in Cliffside Park borough
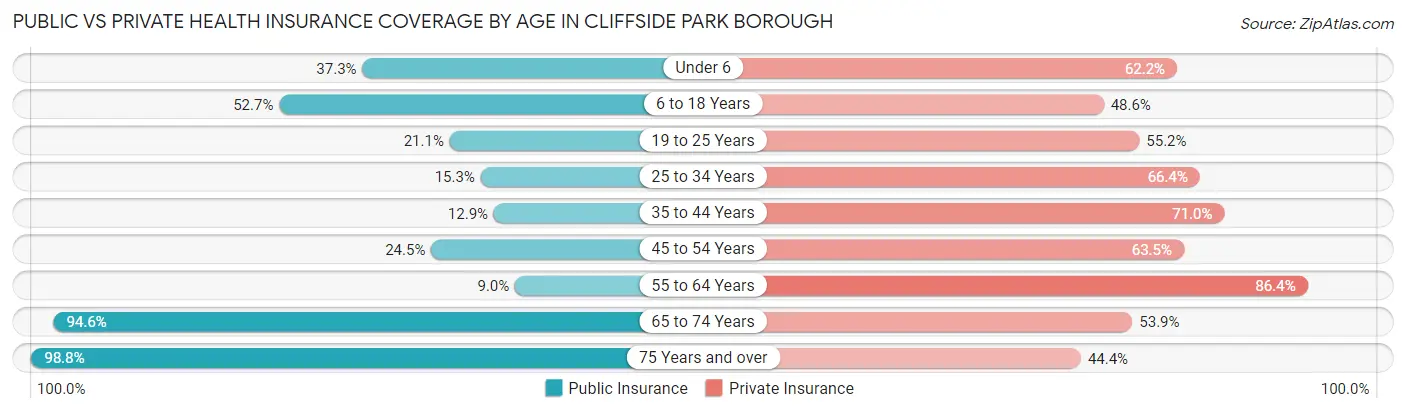
| Age Bracket | Public Insurance | Private Insurance |
| Under 6 | 523 (37.3%) | 872 (62.2%) |
| 6 to 18 Years | 2,070 (52.7%) | 1,908 (48.6%) |
| 19 to 25 Years | 391 (21.1%) | 1,024 (55.2%) |
| 25 to 34 Years | 616 (15.3%) | 2,668 (66.4%) |
| 35 to 44 Years | 407 (12.9%) | 2,241 (71.0%) |
| 45 to 54 Years | 768 (24.5%) | 1,988 (63.5%) |
| 55 to 64 Years | 285 (8.9%) | 2,751 (86.4%) |
| 65 to 74 Years | 2,878 (94.6%) | 1,640 (53.9%) |
| 75 Years and over | 1,813 (98.8%) | 815 (44.4%) |
| Total | 9,751 (38.2%) | 15,907 (62.3%) |
Disability Status by Sex by Age in Cliffside Park borough
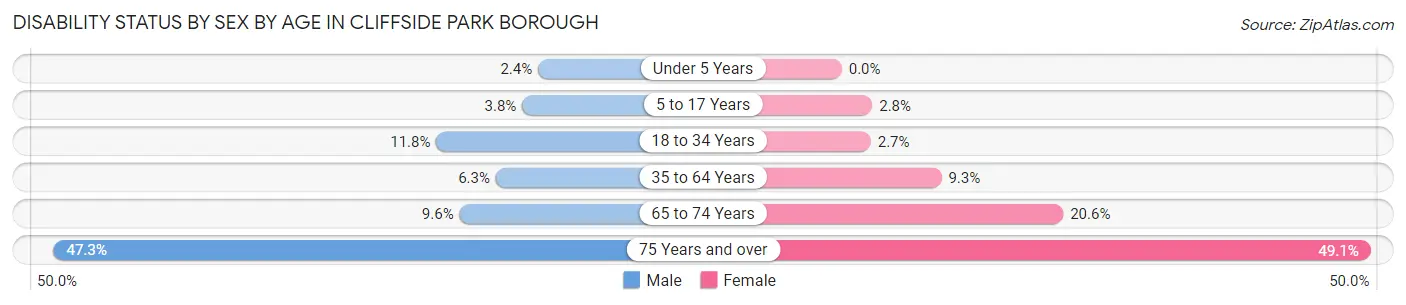
| Age Bracket | Male | Female |
| Under 5 Years | 15 (2.4%) | 0 (0.0%) |
| 5 to 17 Years | 73 (3.8%) | 56 (2.8%) |
| 18 to 34 Years | 376 (11.8%) | 79 (2.7%) |
| 35 to 64 Years | 286 (6.3%) | 454 (9.2%) |
| 65 to 74 Years | 128 (9.6%) | 352 (20.5%) |
| 75 Years and over | 378 (47.3%) | 509 (49.1%) |
Disability Class by Sex by Age in Cliffside Park borough
Disability Class: Hearing Difficulty
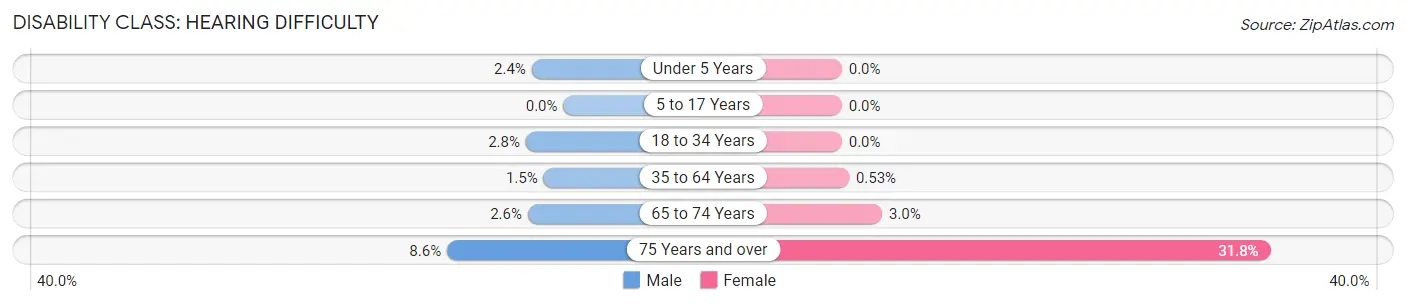
| Age Bracket | Male | Female |
| Under 5 Years | 15 (2.4%) | 0 (0.0%) |
| 5 to 17 Years | 0 (0.0%) | 0 (0.0%) |
| 18 to 34 Years | 89 (2.8%) | 0 (0.0%) |
| 35 to 64 Years | 67 (1.5%) | 26 (0.5%) |
| 65 to 74 Years | 35 (2.6%) | 51 (3.0%) |
| 75 Years and over | 69 (8.6%) | 330 (31.8%) |
Disability Class: Vision Difficulty
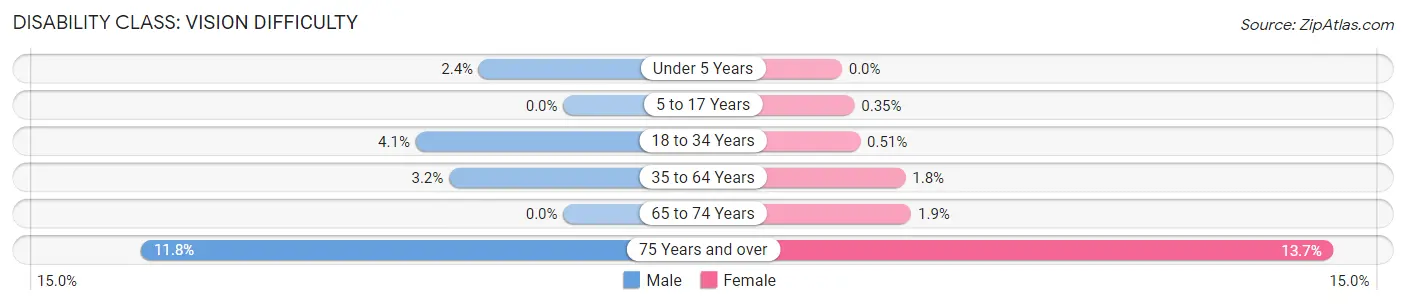
| Age Bracket | Male | Female |
| Under 5 Years | 15 (2.4%) | 0 (0.0%) |
| 5 to 17 Years | 0 (0.0%) | 7 (0.4%) |
| 18 to 34 Years | 131 (4.1%) | 15 (0.5%) |
| 35 to 64 Years | 145 (3.2%) | 87 (1.8%) |
| 65 to 74 Years | 0 (0.0%) | 33 (1.9%) |
| 75 Years and over | 94 (11.8%) | 142 (13.7%) |
Disability Class: Cognitive Difficulty
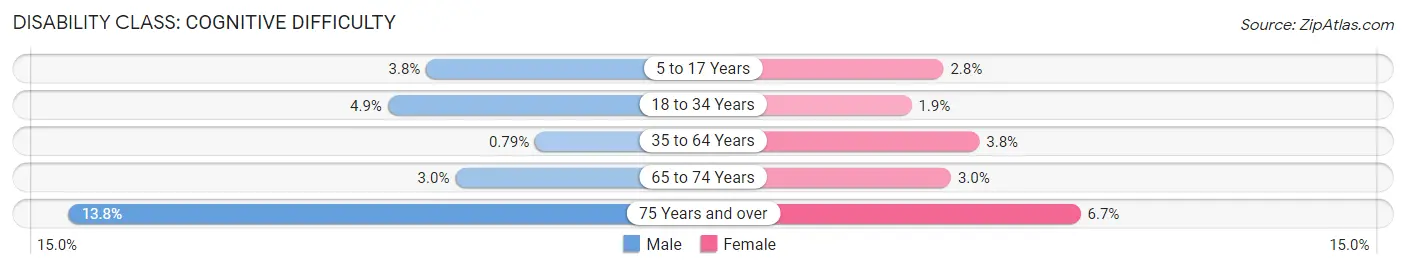
| Age Bracket | Male | Female |
| 5 to 17 Years | 73 (3.8%) | 56 (2.8%) |
| 18 to 34 Years | 156 (4.9%) | 57 (1.9%) |
| 35 to 64 Years | 36 (0.8%) | 188 (3.8%) |
| 65 to 74 Years | 40 (3.0%) | 52 (3.0%) |
| 75 Years and over | 110 (13.8%) | 69 (6.7%) |
Disability Class: Ambulatory Difficulty
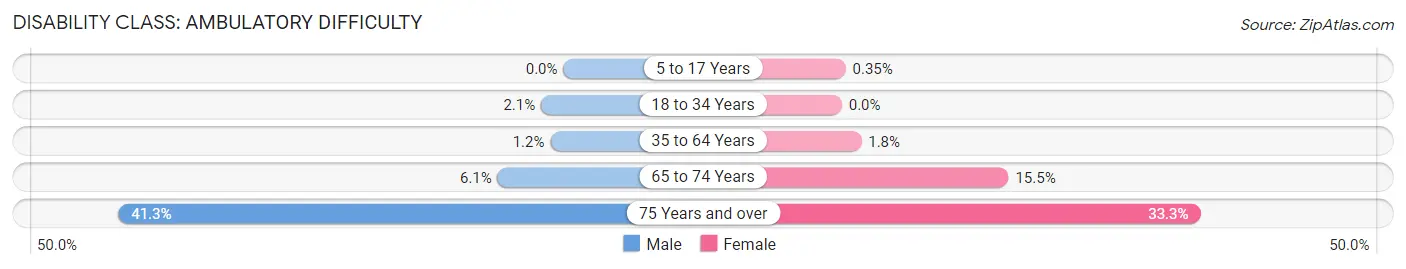
| Age Bracket | Male | Female |
| 5 to 17 Years | 0 (0.0%) | 7 (0.4%) |
| 18 to 34 Years | 66 (2.1%) | 0 (0.0%) |
| 35 to 64 Years | 55 (1.2%) | 89 (1.8%) |
| 65 to 74 Years | 81 (6.1%) | 265 (15.5%) |
| 75 Years and over | 330 (41.3%) | 345 (33.3%) |
Disability Class: Self-Care Difficulty
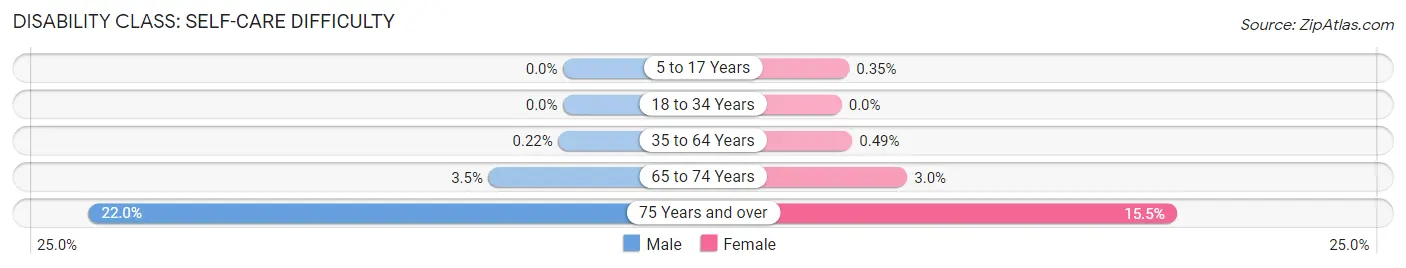
| Age Bracket | Male | Female |
| 5 to 17 Years | 0 (0.0%) | 7 (0.4%) |
| 18 to 34 Years | 0 (0.0%) | 0 (0.0%) |
| 35 to 64 Years | 10 (0.2%) | 24 (0.5%) |
| 65 to 74 Years | 46 (3.5%) | 52 (3.0%) |
| 75 Years and over | 176 (22.0%) | 161 (15.5%) |
Technology Access in Cliffside Park borough
Computing Device Access in Cliffside Park borough
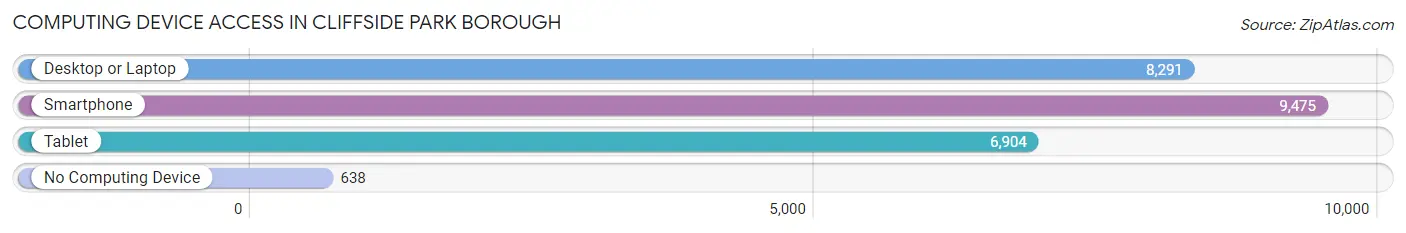
| Device Type | # Households | % Households |
| Desktop or Laptop | 8,291 | 78.8% |
| Smartphone | 9,475 | 90.0% |
| Tablet | 6,904 | 65.6% |
| No Computing Device | 638 | 6.1% |
| Total | 10,526 | 100.0% |
Internet Access in Cliffside Park borough
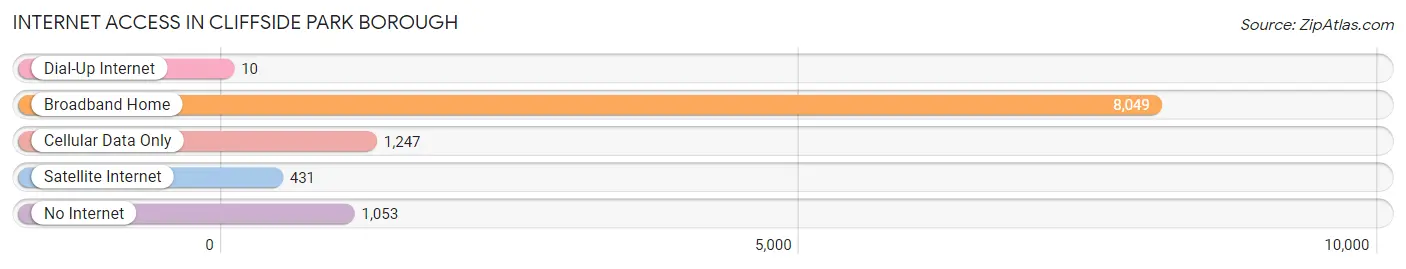
| Internet Type | # Households | % Households |
| Dial-Up Internet | 10 | 0.1% |
| Broadband Home | 8,049 | 76.5% |
| Cellular Data Only | 1,247 | 11.8% |
| Satellite Internet | 431 | 4.1% |
| No Internet | 1,053 | 10.0% |
| Total | 10,526 | 100.0% |
Cliffside Park borough Summary
Cliffside Park Borough is a small borough located in Bergen County, New Jersey. It is situated on the Palisades, a line of steep cliffs overlooking the Hudson River and Manhattan skyline. The borough is bordered by Fort Lee to the south, Edgewater to the north, and the Hudson River to the east. As of the 2010 United States Census, the borough had a population of 23,594, making it the fifth most populous municipality in Bergen County.
History
Cliffside Park was originally part of the borough of Ridgefield, which was incorporated in 1871. In 1895, the area now known as Cliffside Park was separated from Ridgefield and incorporated as the borough of Cliffside Park. The name was chosen to reflect the borough’s location on the Palisades.
The borough was home to a large Italian-American population in the early 20th century. Many of the Italian immigrants who settled in Cliffside Park were from the Abruzzo region of Italy. The borough was also home to a large Jewish population, many of whom were from Eastern Europe.
Geography
Cliffside Park is located at 40°49'17" North, 73°59'45" West (40.8214, -73.9958). According to the United States Census Bureau, the borough has a total area of 1.9 square miles, all of which is land.
The borough is situated on the Palisades, a line of steep cliffs overlooking the Hudson River and Manhattan skyline. The borough is bordered by Fort Lee to the south, Edgewater to the north, and the Hudson River to the east.
Economy
Cliffside Park’s economy is largely based on retail and services. The borough is home to a variety of small businesses, including restaurants, shops, and professional services. The borough is also home to several large employers, including the Palisades Medical Center and the Cliffside Park Board of Education.
Demographics
As of the 2010 United States Census, there were 23,594 people, 9,845 households, and 6,072 families residing in the borough. The population density was 12,521.3 people per square mile. There were 10,541 housing units at an average density of 5,541.7 per square mile. The racial makeup of the borough was 64.2% White, 2.2% African American, 0.2% Native American, 8.3% Asian, 0.0% Pacific Islander, 22.2% from other races, and 2.9% from two or more races. Hispanic or Latino of any race were 44.3% of the population.
There were 9,845 households, out of which 25.3% had children under the age of 18 living with them, 44.2% were married couples living together, 13.2% had a female householder with no husband present, and 36.2% were non-families. 30.2% of all households were made up of individuals, and 11.2% had someone living alone who was 65 years of age or older. The average household size was 2.41 and the average family size was 3.03.
In the borough, the population was spread out, with 19.7% under the age of 18, 8.2% from 18 to 24, 33.2% from 25 to 44, 24.2% from 45 to 64, and 14.7% who were 65 years of age or older. The median age was 37 years. For every 100 females, there were 93.2 males. For every 100 females age 18 and over, there were 90.2 males.
The median income for a household in the borough was $50,945, and the median income for a family was $60,945. Males had a median income of $41,945 versus $35,945 for females. The per capita income for the borough was $25,945. About 6.2% of families and 8.2% of the population were below the poverty line, including 11.2% of those under age 18 and 8.2% of those age 65 or over.
Common Questions
What is Per Capita Income in Cliffside Park borough?
Per Capita income in Cliffside Park borough is $49,434.
What is the Median Family Income in Cliffside Park borough?
Median Family Income in Cliffside Park borough is $110,746.
What is the Median Household income in Cliffside Park borough?
Median Household Income in Cliffside Park borough is $96,734.
What is Income or Wage Gap in Cliffside Park borough?
Income or Wage Gap in Cliffside Park borough is 10.6%.
Women in Cliffside Park borough earn 89.4 cents for every dollar earned by a man.
What is Family Income Deficit in Cliffside Park borough?
Family Income Deficit in Cliffside Park borough is $13,805.
Families that are below poverty line in Cliffside Park borough earn $13,805 less on average than the poverty threshold level.
What is Inequality or Gini Index in Cliffside Park borough?
Inequality or Gini Index in Cliffside Park borough is 0.47.
What is the Total Population of Cliffside Park borough?
Total Population of Cliffside Park borough is 25,546.
What is the Total Male Population of Cliffside Park borough?
Total Male Population of Cliffside Park borough is 12,426.
What is the Total Female Population of Cliffside Park borough?
Total Female Population of Cliffside Park borough is 13,120.
What is the Ratio of Males per 100 Females in Cliffside Park borough?
There are 94.71 Males per 100 Females in Cliffside Park borough.
What is the Ratio of Females per 100 Males in Cliffside Park borough?
There are 105.59 Females per 100 Males in Cliffside Park borough.
What is the Median Population Age in Cliffside Park borough?
Median Population Age in Cliffside Park borough is 39.9 Years.
What is the Average Family Size in Cliffside Park borough
Average Family Size in Cliffside Park borough is 3.1 People.
What is the Average Household Size in Cliffside Park borough
Average Household Size in Cliffside Park borough is 2.4 People.
How Large is the Labor Force in Cliffside Park borough?
There are 13,751 People in the Labor Forcein in Cliffside Park borough.
What is the Percentage of People in the Labor Force in Cliffside Park borough?
64.0% of People are in the Labor Force in Cliffside Park borough.
What is the Unemployment Rate in Cliffside Park borough?
Unemployment Rate in Cliffside Park borough is 3.6%.