Cities with the Highest Percentage of Hispanic or Latino Population in Colorado
RELATED REPORTS & OPTIONS
Hispanic or Latino
Colorado
Compare Cities
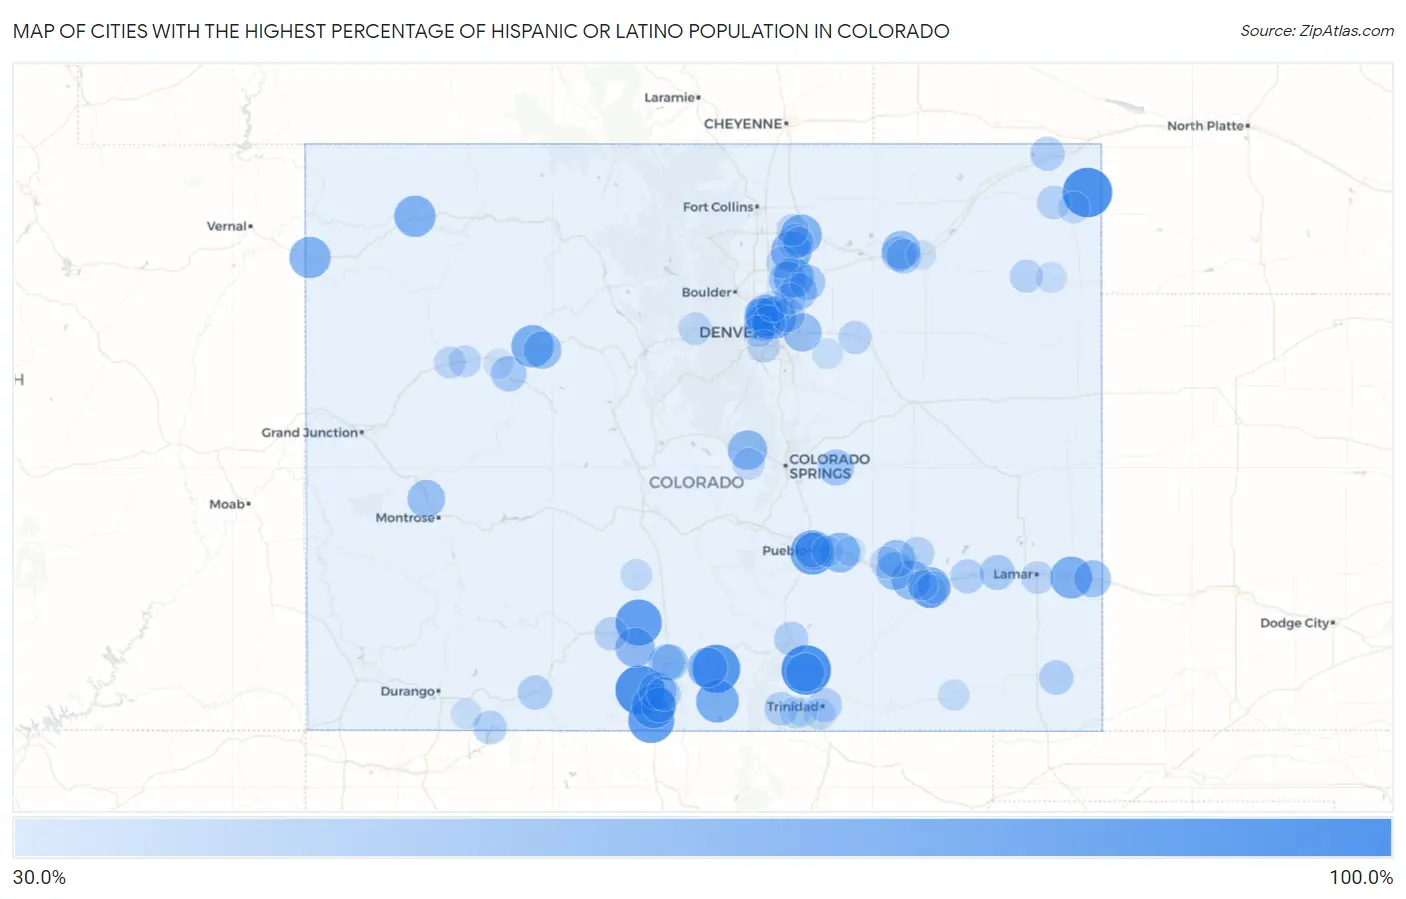
Map of Cities with the Highest Percentage of Hispanic or Latino Population in Colorado
0.0%
100.0%
Cities with the Highest Percentage of Hispanic or Latino Population in Colorado
| City | Hispanic or Latino | vs State | vs National | |
| 1. | Amherst | 100.0% | 22.1%(+77.9)#1 | 18.7%(+81.3)#316 |
| 2. | Lynn | 100.0% | 22.1%(+77.9)#2 | 18.7%(+81.3)#381 |
| 3. | Capulin | 98.7% | 22.1%(+76.6)#3 | 18.7%(+80.0)#494 |
| 4. | Fort Garland | 94.7% | 22.1%(+72.6)#4 | 18.7%(+76.0)#660 |
| 5. | Center | 88.3% | 22.1%(+66.2)#5 | 18.7%(+69.6)#823 |
| 6. | Antonito | 88.2% | 22.1%(+66.1)#6 | 18.7%(+69.5)#827 |
| 7. | Salt Creek | 82.2% | 22.1%(+60.1)#7 | 18.7%(+63.5)#959 |
| 8. | Romeo | 80.3% | 22.1%(+58.2)#8 | 18.7%(+61.6)#1,002 |
| 9. | San Luis | 76.0% | 22.1%(+53.9)#9 | 18.7%(+57.3)#1,100 |
| 10. | Dotsero | 74.5% | 22.1%(+52.4)#10 | 18.7%(+55.9)#1,137 |
| 11. | Derby | 73.4% | 22.1%(+51.4)#11 | 18.7%(+54.8)#1,162 |
| 12. | Granada | 73.0% | 22.1%(+51.0)#12 | 18.7%(+54.4)#1,169 |
| 13. | Maybell | 71.4% | 22.1%(+49.4)#13 | 18.7%(+52.8)#1,217 |
| 14. | Dinosaur | 71.1% | 22.1%(+49.0)#14 | 18.7%(+52.5)#1,228 |
| 15. | La Junta Gardens | 70.5% | 22.1%(+48.4)#15 | 18.7%(+51.8)#1,243 |
| 16. | Garden City | 70.3% | 22.1%(+48.2)#16 | 18.7%(+51.7)#1,248 |
| 17. | Gilcrest | 69.4% | 22.1%(+47.3)#17 | 18.7%(+50.8)#1,271 |
| 18. | Aristocrat Ranchettes | 67.0% | 22.1%(+44.9)#18 | 18.7%(+48.3)#1,343 |
| 19. | Avondale | 66.8% | 22.1%(+44.7)#19 | 18.7%(+48.1)#1,346 |
| 20. | Blanca | 65.7% | 22.1%(+43.7)#20 | 18.7%(+47.1)#1,386 |
| 21. | Divide | 65.0% | 22.1%(+42.9)#21 | 18.7%(+46.3)#1,406 |
| 22. | Monte Vista | 64.5% | 22.1%(+42.4)#22 | 18.7%(+45.8)#1,424 |
| 23. | Rocky Ford | 63.7% | 22.1%(+41.6)#23 | 18.7%(+45.0)#1,443 |
| 24. | Aguilar | 63.2% | 22.1%(+41.1)#24 | 18.7%(+44.5)#1,450 |
| 25. | Sherrelwood | 62.6% | 22.1%(+40.5)#25 | 18.7%(+43.9)#1,470 |
| 26. | Blende | 60.6% | 22.1%(+38.6)#26 | 18.7%(+42.0)#1,535 |
| 27. | Welby | 60.4% | 22.1%(+38.4)#27 | 18.7%(+41.8)#1,539 |
| 28. | Federal Heights | 60.4% | 22.1%(+38.3)#28 | 18.7%(+41.8)#1,541 |
| 29. | Aetna Estates | 60.3% | 22.1%(+38.2)#29 | 18.7%(+41.6)#1,545 |
| 30. | Blue Sky | 60.2% | 22.1%(+38.1)#30 | 18.7%(+41.6)#1,549 |
| 31. | Olathe | 58.9% | 22.1%(+36.8)#31 | 18.7%(+40.3)#1,587 |
| 32. | La Jara | 58.9% | 22.1%(+36.8)#32 | 18.7%(+40.2)#1,590 |
| 33. | Gypsum | 58.8% | 22.1%(+36.7)#33 | 18.7%(+40.1)#1,597 |
| 34. | Manzanola | 58.7% | 22.1%(+36.6)#34 | 18.7%(+40.0)#1,603 |
| 35. | Crowley | 58.5% | 22.1%(+36.4)#35 | 18.7%(+39.8)#1,610 |
| 36. | Fort Lupton | 57.6% | 22.1%(+35.5)#36 | 18.7%(+38.9)#1,637 |
| 37. | Holly | 56.5% | 22.1%(+34.5)#37 | 18.7%(+37.9)#1,671 |
| 38. | Lochbuie | 55.3% | 22.1%(+33.2)#38 | 18.7%(+36.7)#1,716 |
| 39. | Berkley | 54.5% | 22.1%(+32.4)#39 | 18.7%(+35.8)#1,757 |
| 40. | Alamosa | 53.9% | 22.1%(+31.8)#40 | 18.7%(+35.2)#1,792 |
| 41. | Ellicott | 53.5% | 22.1%(+31.4)#41 | 18.7%(+34.8)#1,808 |
| 42. | Alamosa East | 53.4% | 22.1%(+31.4)#42 | 18.7%(+34.8)#1,811 |
| 43. | Twin Lakes Cdp Adams County | 53.3% | 22.1%(+31.2)#43 | 18.7%(+34.6)#1,821 |
| 44. | Cattle Creek | 51.5% | 22.1%(+29.4)#44 | 18.7%(+32.8)#1,888 |
| 45. | Hudson | 50.8% | 22.1%(+28.7)#45 | 18.7%(+32.2)#1,913 |
| 46. | Hasty | 50.0% | 22.1%(+27.9)#46 | 18.7%(+31.3)#1,951 |
| 47. | Pueblo | 50.0% | 22.1%(+27.9)#47 | 18.7%(+31.3)#1,959 |
| 48. | Log Lane Village | 49.9% | 22.1%(+27.8)#48 | 18.7%(+31.2)#1,963 |
| 49. | Fort Morgan | 49.0% | 22.1%(+26.9)#49 | 18.7%(+30.4)#2,004 |
| 50. | Twin Lakes Cdp Lake County | 48.9% | 22.1%(+26.8)#50 | 18.7%(+30.2)#2,018 |
| 51. | Evans | 48.8% | 22.1%(+26.7)#51 | 18.7%(+30.2)#2,019 |
| 52. | Manassa | 48.6% | 22.1%(+26.5)#52 | 18.7%(+30.0)#2,029 |
| 53. | Commerce City | 48.4% | 22.1%(+26.4)#53 | 18.7%(+29.8)#2,040 |
| 54. | Shaw Heights | 48.3% | 22.1%(+26.2)#54 | 18.7%(+29.6)#2,051 |
| 55. | Pagosa Springs | 47.8% | 22.1%(+25.7)#55 | 18.7%(+29.1)#2,072 |
| 56. | Vilas | 47.7% | 22.1%(+25.7)#56 | 18.7%(+29.1)#2,074 |
| 57. | Gardner | 47.4% | 22.1%(+25.3)#57 | 18.7%(+28.7)#2,095 |
| 58. | Walsenburg | 47.0% | 22.1%(+24.9)#58 | 18.7%(+28.3)#2,112 |
| 59. | Sedgwick | 46.9% | 22.1%(+24.8)#59 | 18.7%(+28.2)#2,117 |
| 60. | Sanford | 46.9% | 22.1%(+24.8)#60 | 18.7%(+28.2)#2,118 |
| 61. | Las Animas | 46.7% | 22.1%(+24.6)#61 | 18.7%(+28.1)#2,124 |
| 62. | North Washington | 46.6% | 22.1%(+24.5)#62 | 18.7%(+27.9)#2,133 |
| 63. | Mcclave | 46.2% | 22.1%(+24.2)#63 | 18.7%(+27.6)#2,148 |
| 64. | Trinidad | 46.2% | 22.1%(+24.1)#64 | 18.7%(+27.5)#2,150 |
| 65. | Arboles | 45.2% | 22.1%(+23.1)#65 | 18.7%(+26.5)#2,198 |
| 66. | Weston | 45.2% | 22.1%(+23.1)#66 | 18.7%(+26.5)#2,200 |
| 67. | La Junta | 45.0% | 22.1%(+22.9)#67 | 18.7%(+26.4)#2,205 |
| 68. | Sugar City | 45.0% | 22.1%(+22.9)#68 | 18.7%(+26.3)#2,210 |
| 69. | Paoli | 44.4% | 22.1%(+22.4)#69 | 18.7%(+25.8)#2,243 |
| 70. | Del Norte | 44.2% | 22.1%(+22.2)#70 | 18.7%(+25.6)#2,256 |
| 71. | Byers | 43.2% | 22.1%(+21.1)#71 | 18.7%(+24.5)#2,311 |
| 72. | Yuma | 43.0% | 22.1%(+20.9)#72 | 18.7%(+24.3)#2,328 |
| 73. | North La Junta | 42.5% | 22.1%(+20.4)#73 | 18.7%(+23.9)#2,363 |
| 74. | Lamar | 41.8% | 22.1%(+19.7)#74 | 18.7%(+23.2)#2,396 |
| 75. | Sheridan | 41.7% | 22.1%(+19.6)#75 | 18.7%(+23.1)#2,401 |
| 76. | Downieville Lawson Dumont | 41.6% | 22.1%(+19.5)#76 | 18.7%(+22.9)#2,411 |
| 77. | Platteville | 41.1% | 22.1%(+19.1)#77 | 18.7%(+22.5)#2,436 |
| 78. | Olney Springs | 40.5% | 22.1%(+18.4)#78 | 18.7%(+21.8)#2,478 |
| 79. | Greeley | 39.9% | 22.1%(+17.8)#79 | 18.7%(+21.2)#2,509 |
| 80. | Edgewater | 39.8% | 22.1%(+17.8)#80 | 18.7%(+21.2)#2,513 |
| 81. | Silt | 39.8% | 22.1%(+17.7)#81 | 18.7%(+21.2)#2,514 |
| 82. | Holyoke | 39.5% | 22.1%(+17.4)#82 | 18.7%(+20.9)#2,538 |
| 83. | Rifle | 39.4% | 22.1%(+17.4)#83 | 18.7%(+20.8)#2,545 |
| 84. | Midland | 39.2% | 22.1%(+17.1)#84 | 18.7%(+20.6)#2,559 |
| 85. | Starkville | 39.0% | 22.1%(+16.9)#85 | 18.7%(+20.4)#2,570 |
| 86. | Brighton | 38.6% | 22.1%(+16.6)#86 | 18.7%(+20.0)#2,600 |
| 87. | Saguache | 38.5% | 22.1%(+16.4)#87 | 18.7%(+19.9)#2,611 |
| 88. | Segundo | 38.4% | 22.1%(+16.3)#88 | 18.7%(+19.7)#2,623 |
| 89. | La Salle | 38.0% | 22.1%(+16.0)#89 | 18.7%(+19.4)#2,648 |
| 90. | Vineland | 37.6% | 22.1%(+15.6)#90 | 18.7%(+19.0)#2,677 |
| 91. | Thornton | 37.3% | 22.1%(+15.2)#91 | 18.7%(+18.7)#2,694 |
| 92. | Kim | 37.3% | 22.1%(+15.2)#92 | 18.7%(+18.6)#2,699 |
| 93. | Eckley | 36.7% | 22.1%(+14.6)#93 | 18.7%(+18.0)#2,736 |
| 94. | Ignacio | 35.3% | 22.1%(+13.2)#94 | 18.7%(+16.7)#2,861 |
| 95. | Brick Center | 35.2% | 22.1%(+13.2)#95 | 18.7%(+16.6)#2,872 |
| 96. | Swink | 35.1% | 22.1%(+13.1)#96 | 18.7%(+16.5)#2,881 |
| 97. | Boone | 33.9% | 22.1%(+11.8)#97 | 18.7%(+15.3)#2,991 |
| 98. | Glenwood Springs | 33.6% | 22.1%(+11.6)#98 | 18.7%(+15.0)#3,011 |
| 99. | Brush | 33.4% | 22.1%(+11.4)#99 | 18.7%(+14.8)#3,022 |
| 100. | Valdez | 33.3% | 22.1%(+11.3)#100 | 18.7%(+14.7)#3,039 |
Common Questions
What are the Top 10 Cities with the Highest Percentage of Hispanic or Latino Population in Colorado?
Top 10 Cities with the Highest Percentage of Hispanic or Latino Population in Colorado are:
#1
100.0%
#2
100.0%
#3
98.7%
#4
94.7%
#5
88.3%
#6
88.2%
#7
82.2%
#8
80.3%
#9
76.0%
#10
74.5%
What city has the Highest Percentage of Hispanic or Latino Population in Colorado?
Amherst has the Highest Percentage of Hispanic or Latino Population in Colorado with 100.0%.
What is the Percentage of Hispanic or Latino Population in the State of Colorado?
Percentage of Hispanic or Latino Population in Colorado is 22.1%.
What is the Percentage of Hispanic or Latino Population in the United States?
Percentage of Hispanic or Latino Population in the United States is 18.7%.