Cities with the Highest Percentage of Hispanic or Latino Population in Nebraska
RELATED REPORTS & OPTIONS
Hispanic or Latino
Nebraska
Compare Cities
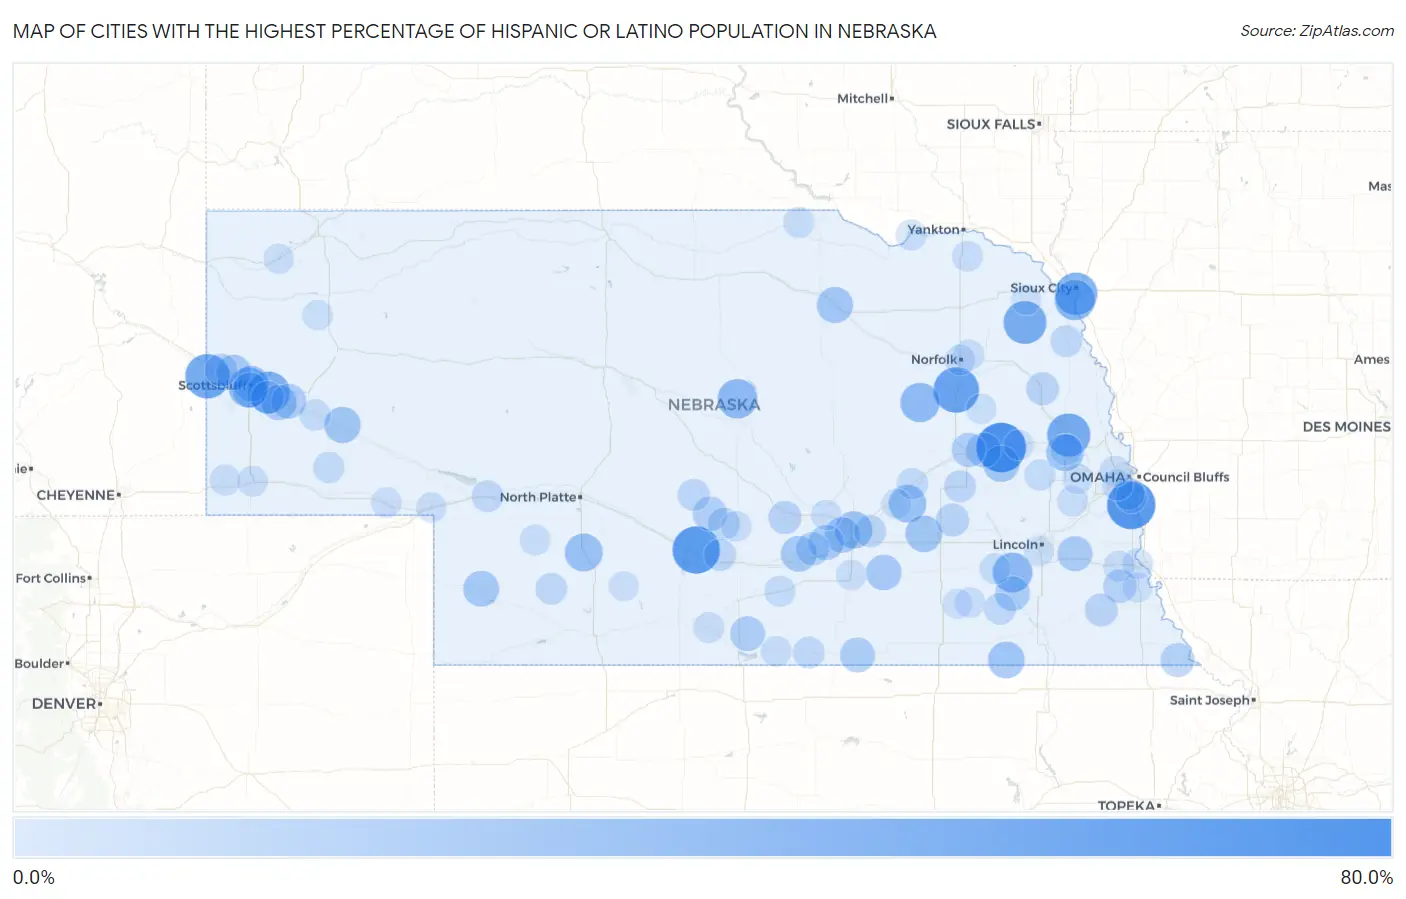
Map of Cities with the Highest Percentage of Hispanic or Latino Population in Nebraska
0.0%
80.0%
Cities with the Highest Percentage of Hispanic or Latino Population in Nebraska
| City | Hispanic or Latino | vs State | vs National | |
| 1. | Schuyler | 71.2% | 11.8%(+59.4)#1 | 18.7%(+52.6)#1,223 |
| 2. | La Platte | 67.5% | 11.8%(+55.8)#2 | 18.7%(+48.9)#1,323 |
| 3. | Lexington | 64.4% | 11.8%(+52.7)#3 | 18.7%(+45.8)#1,426 |
| 4. | Madison | 58.9% | 11.8%(+47.1)#4 | 18.7%(+40.3)#1,589 |
| 5. | Lyman | 55.4% | 11.8%(+43.7)#5 | 18.7%(+36.8)#1,704 |
| 6. | Nickerson | 51.3% | 11.8%(+39.5)#6 | 18.7%(+32.6)#1,894 |
| 7. | Wakefield | 50.9% | 11.8%(+39.1)#7 | 18.7%(+32.2)#1,907 |
| 8. | South Sioux City | 48.6% | 11.8%(+36.8)#8 | 18.7%(+30.0)#2,028 |
| 9. | Minatare | 47.6% | 11.8%(+35.8)#9 | 18.7%(+28.9)#2,081 |
| 10. | Dakota City | 43.1% | 11.8%(+31.3)#10 | 18.7%(+24.4)#2,323 |
| 11. | Terrytown | 42.3% | 11.8%(+30.5)#11 | 18.7%(+23.6)#2,373 |
| 12. | Crete | 41.0% | 11.8%(+29.2)#12 | 18.7%(+22.3)#2,447 |
| 13. | Taylor | 40.4% | 11.8%(+28.6)#13 | 18.7%(+21.8)#2,481 |
| 14. | Newman Grove | 39.6% | 11.8%(+27.9)#14 | 18.7%(+21.0)#2,532 |
| 15. | Wellfleet | 35.4% | 11.8%(+23.7)#15 | 18.7%(+16.8)#2,850 |
| 16. | Hordville | 34.7% | 11.8%(+22.9)#16 | 18.7%(+16.1)#2,907 |
| 17. | Inglewood | 34.0% | 11.8%(+22.2)#17 | 18.7%(+15.4)#2,982 |
| 18. | Grand Island | 34.0% | 11.8%(+22.2)#18 | 18.7%(+15.3)#2,985 |
| 19. | Steele City | 31.6% | 11.8%(+19.8)#19 | 18.7%(+12.9)#3,219 |
| 20. | Bradshaw | 31.5% | 11.8%(+19.7)#20 | 18.7%(+12.8)#3,229 |
| 21. | Octavia | 30.8% | 11.8%(+19.0)#21 | 18.7%(+12.2)#3,302 |
| 22. | Broadwater | 30.7% | 11.8%(+18.9)#22 | 18.7%(+12.0)#3,318 |
| 23. | Inman | 30.2% | 11.8%(+18.5)#23 | 18.7%(+11.6)#3,368 |
| 24. | Scottsbluff | 29.9% | 11.8%(+18.1)#24 | 18.7%(+11.2)#3,412 |
| 25. | Imperial | 29.1% | 11.8%(+17.4)#25 | 18.7%(+10.5)#3,489 |
| 26. | Gibbon | 29.1% | 11.8%(+17.4)#26 | 18.7%(+10.5)#3,491 |
| 27. | Alda | 28.4% | 11.8%(+16.6)#27 | 18.7%(+9.77)#3,577 |
| 28. | Harvard | 28.2% | 11.8%(+16.4)#28 | 18.7%(+9.57)#3,604 |
| 29. | Mitchell | 28.1% | 11.8%(+16.4)#29 | 18.7%(+9.48)#3,612 |
| 30. | Mcgrew | 27.7% | 11.8%(+15.9)#30 | 18.7%(+9.06)#3,666 |
| 31. | Wood River | 27.5% | 11.8%(+15.7)#31 | 18.7%(+8.82)#3,695 |
| 32. | Woodland Hills | 27.0% | 11.8%(+15.2)#32 | 18.7%(+8.35)#3,764 |
| 33. | Gering | 27.0% | 11.8%(+15.2)#33 | 18.7%(+8.33)#3,767 |
| 34. | Bayard | 26.6% | 11.8%(+14.8)#34 | 18.7%(+7.90)#3,826 |
| 35. | Wilber | 26.3% | 11.8%(+14.5)#35 | 18.7%(+7.63)#3,859 |
| 36. | Guide Rock | 26.3% | 11.8%(+14.5)#36 | 18.7%(+7.63)#3,860 |
| 37. | Huntley | 26.1% | 11.8%(+14.3)#37 | 18.7%(+7.44)#3,879 |
| 38. | Richland | 26.0% | 11.8%(+14.2)#38 | 18.7%(+7.35)#3,889 |
| 39. | Columbus | 24.5% | 11.8%(+12.7)#39 | 18.7%(+5.86)#4,092 |
| 40. | Eddyville | 24.5% | 11.8%(+12.7)#40 | 18.7%(+5.84)#4,099 |
| 41. | Preston | 23.7% | 11.8%(+11.9)#41 | 18.7%(+5.03)#4,239 |
| 42. | Shelton | 22.4% | 11.8%(+10.7)#42 | 18.7%(+3.78)#4,459 |
| 43. | Talmage | 22.3% | 11.8%(+10.6)#43 | 18.7%(+3.68)#4,474 |
| 44. | Melbeta | 21.5% | 11.8%(+9.69)#44 | 18.7%(+2.82)#4,643 |
| 45. | Poole | 21.4% | 11.8%(+9.65)#45 | 18.7%(+2.78)#4,656 |
| 46. | Thayer | 21.3% | 11.8%(+9.50)#46 | 18.7%(+2.62)#4,686 |
| 47. | Tecumseh | 20.6% | 11.8%(+8.77)#47 | 18.7%(+1.90)#4,834 |
| 48. | West Point | 20.5% | 11.8%(+8.73)#48 | 18.7%(+1.86)#4,844 |
| 49. | Morrill | 20.2% | 11.8%(+8.40)#49 | 18.7%(+1.53)#4,924 |
| 50. | Sumner | 19.0% | 11.8%(+7.19)#50 | 18.7%(+0.314)#5,198 |
| 51. | Phillips | 18.3% | 11.8%(+6.52)#51 | 18.7%(-0.355)#5,354 |
| 52. | Overton | 18.1% | 11.8%(+6.35)#52 | 18.7%(-0.522)#5,407 |
| 53. | Bellevue | 18.0% | 11.8%(+6.18)#53 | 18.7%(-0.695)#5,454 |
| 54. | Shelby | 17.9% | 11.8%(+6.15)#54 | 18.7%(-0.726)#5,468 |
| 55. | Oconto | 17.9% | 11.8%(+6.12)#55 | 18.7%(-0.751)#5,473 |
| 56. | Riverton | 17.8% | 11.8%(+6.04)#56 | 18.7%(-0.830)#5,491 |
| 57. | Swanton | 17.4% | 11.8%(+5.58)#57 | 18.7%(-1.29)#5,620 |
| 58. | Hayes Center | 17.3% | 11.8%(+5.47)#58 | 18.7%(-1.40)#5,656 |
| 59. | Roscoe | 17.2% | 11.8%(+5.39)#59 | 18.7%(-1.48)#5,686 |
| 60. | Walthill | 17.1% | 11.8%(+5.34)#60 | 18.7%(-1.53)#5,697 |
| 61. | Fremont | 16.2% | 11.8%(+4.46)#61 | 18.7%(-2.41)#5,968 |
| 62. | Gurley | 16.2% | 11.8%(+4.39)#62 | 18.7%(-2.49)#5,991 |
| 63. | Clarks | 16.1% | 11.8%(+4.35)#63 | 18.7%(-2.52)#5,998 |
| 64. | Bridgeport | 15.9% | 11.8%(+4.12)#64 | 18.7%(-2.76)#6,076 |
| 65. | Offutt Afb | 15.8% | 11.8%(+4.04)#65 | 18.7%(-2.84)#6,106 |
| 66. | Minden | 15.6% | 11.8%(+3.81)#66 | 18.7%(-3.07)#6,178 |
| 67. | Ralston | 15.4% | 11.8%(+3.62)#67 | 18.7%(-3.25)#6,225 |
| 68. | Malmo | 15.3% | 11.8%(+3.54)#68 | 18.7%(-3.33)#6,250 |
| 69. | Dorchester | 15.0% | 11.8%(+3.21)#69 | 18.7%(-3.66)#6,360 |
| 70. | Dunbar | 14.9% | 11.8%(+3.15)#70 | 18.7%(-3.73)#6,382 |
| 71. | Woodland Park | 14.9% | 11.8%(+3.14)#71 | 18.7%(-3.73)#6,383 |
| 72. | Bushnell | 14.9% | 11.8%(+3.11)#72 | 18.7%(-3.76)#6,399 |
| 73. | Omaha | 14.8% | 11.8%(+2.97)#73 | 18.7%(-3.90)#6,458 |
| 74. | Oxford | 14.7% | 11.8%(+2.95)#74 | 18.7%(-3.92)#6,469 |
| 75. | Butte | 14.6% | 11.8%(+2.86)#75 | 18.7%(-4.01)#6,503 |
| 76. | Bloomington | 14.5% | 11.8%(+2.77)#76 | 18.7%(-4.11)#6,535 |
| 77. | Santee | 14.5% | 11.8%(+2.72)#77 | 18.7%(-4.15)#6,548 |
| 78. | Nebraska City | 14.5% | 11.8%(+2.69)#78 | 18.7%(-4.18)#6,560 |
| 79. | Fordyce | 14.3% | 11.8%(+2.57)#79 | 18.7%(-4.31)#6,603 |
| 80. | Wallace | 14.3% | 11.8%(+2.51)#80 | 18.7%(-4.37)#6,621 |
| 81. | Norfolk | 14.3% | 11.8%(+2.48)#81 | 18.7%(-4.40)#6,627 |
| 82. | Kimball | 14.2% | 11.8%(+2.41)#82 | 18.7%(-4.46)#6,648 |
| 83. | Memphis | 14.1% | 11.8%(+2.35)#83 | 18.7%(-4.52)#6,678 |
| 84. | Hastings | 13.9% | 11.8%(+2.14)#84 | 18.7%(-4.73)#6,750 |
| 85. | Miller | 13.9% | 11.8%(+2.09)#85 | 18.7%(-4.78)#6,772 |
| 86. | Chappell | 13.7% | 11.8%(+1.94)#86 | 18.7%(-4.93)#6,823 |
| 87. | Tobias | 13.5% | 11.8%(+1.76)#87 | 18.7%(-5.11)#6,903 |
| 88. | Cairo | 13.5% | 11.8%(+1.71)#88 | 18.7%(-5.16)#6,927 |
| 89. | Hemingford | 13.2% | 11.8%(+1.45)#89 | 18.7%(-5.43)#7,039 |
| 90. | Crawford | 13.2% | 11.8%(+1.42)#90 | 18.7%(-5.45)#7,045 |
| 91. | Big Springs | 13.2% | 11.8%(+1.37)#91 | 18.7%(-5.50)#7,069 |
| 92. | Leigh | 13.1% | 11.8%(+1.27)#92 | 18.7%(-5.60)#7,111 |
| 93. | Yutan | 13.0% | 11.8%(+1.25)#93 | 18.7%(-5.63)#7,128 |
| 94. | Overland | 12.9% | 11.8%(+1.11)#94 | 18.7%(-5.77)#7,190 |
| 95. | Rogers | 12.8% | 11.8%(+0.986)#95 | 18.7%(-5.89)#7,253 |
| 96. | Julian | 12.8% | 11.8%(+0.986)#96 | 18.7%(-5.89)#7,254 |
| 97. | Yankee Hill | 12.7% | 11.8%(+0.889)#97 | 18.7%(-5.98)#7,292 |
| 98. | Allen | 12.6% | 11.8%(+0.832)#98 | 18.7%(-6.04)#7,314 |
| 99. | Ohiowa | 12.5% | 11.8%(+0.720)#99 | 18.7%(-6.15)#7,357 |
| 100. | Stockville | 12.5% | 11.8%(+0.720)#100 | 18.7%(-6.15)#7,359 |
Common Questions
What are the Top 10 Cities with the Highest Percentage of Hispanic or Latino Population in Nebraska?
Top 10 Cities with the Highest Percentage of Hispanic or Latino Population in Nebraska are:
#1
71.2%
#2
67.5%
#3
64.4%
#4
58.9%
#5
55.4%
#6
51.3%
#7
50.9%
#8
48.6%
#9
47.6%
#10
43.1%
What city has the Highest Percentage of Hispanic or Latino Population in Nebraska?
Schuyler has the Highest Percentage of Hispanic or Latino Population in Nebraska with 71.2%.
What is the Percentage of Hispanic or Latino Population in the State of Nebraska?
Percentage of Hispanic or Latino Population in Nebraska is 11.8%.
What is the Percentage of Hispanic or Latino Population in the United States?
Percentage of Hispanic or Latino Population in the United States is 18.7%.