Cities with the Highest Percentage of Hispanic or Latino Population in Montana
RELATED REPORTS & OPTIONS
Hispanic or Latino
Montana
Compare Cities
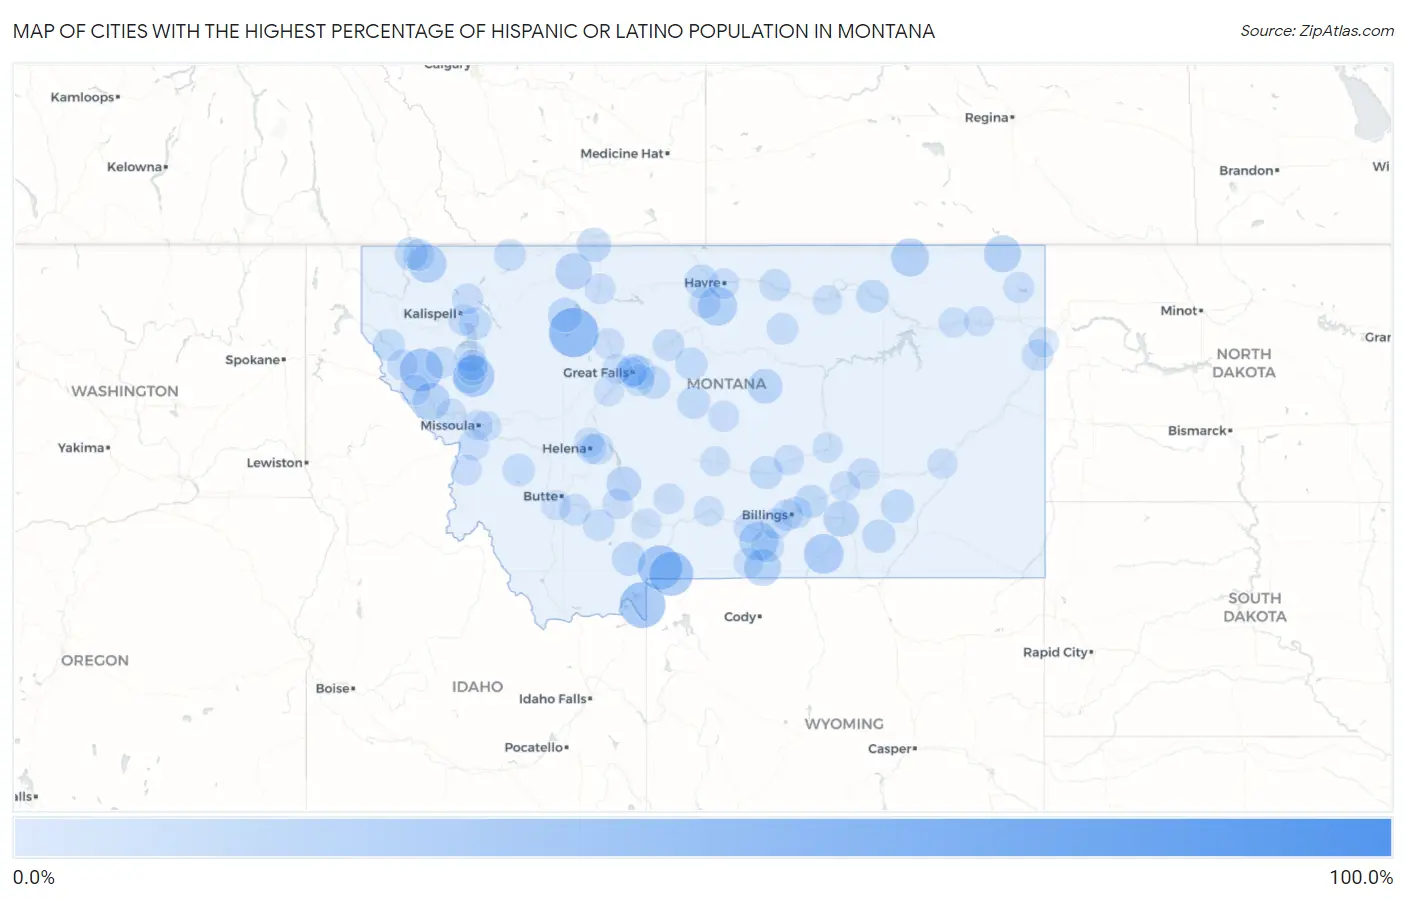
Map of Cities with the Highest Percentage of Hispanic or Latino Population in Montana
0.0%
100.0%
Cities with the Highest Percentage of Hispanic or Latino Population in Montana
| City | Hispanic or Latino | vs State | vs National | |
| 1. | Whitlash | 100.0% | 4.2%(+95.8)#1 | 18.7%(+81.3)#389 |
| 2. | Bynum | 43.8% | 4.2%(+39.5)#2 | 18.7%(+25.1)#2,286 |
| 3. | West Yellowstone | 36.2% | 4.2%(+32.0)#3 | 18.7%(+17.5)#2,789 |
| 4. | Canyon Creek | 35.6% | 4.2%(+31.4)#4 | 18.7%(+16.9)#2,838 |
| 5. | Corwin Springs | 32.9% | 4.2%(+28.7)#5 | 18.7%(+14.3)#3,080 |
| 6. | Jardine | 32.6% | 4.2%(+28.4)#6 | 18.7%(+13.9)#3,110 |
| 7. | Midway Colony | 31.2% | 4.2%(+27.0)#7 | 18.7%(+12.6)#3,257 |
| 8. | Weeksville | 30.2% | 4.2%(+26.0)#8 | 18.7%(+11.6)#3,370 |
| 9. | Kicking Horse | 26.4% | 4.2%(+22.2)#9 | 18.7%(+7.76)#3,839 |
| 10. | Fort Smith | 23.5% | 4.2%(+19.3)#10 | 18.7%(+4.83)#4,273 |
| 11. | Boyd | 22.2% | 4.2%(+18.0)#11 | 18.7%(+3.57)#4,503 |
| 12. | Sangrey | 22.0% | 4.2%(+17.8)#12 | 18.7%(+3.30)#4,546 |
| 13. | Fortine | 20.1% | 4.2%(+15.9)#13 | 18.7%(+1.49)#4,938 |
| 14. | Opheim | 20.0% | 4.2%(+15.8)#14 | 18.7%(+1.35)#4,970 |
| 15. | Riverbend | 18.5% | 4.2%(+14.3)#15 | 18.7%(-0.176)#5,309 |
| 16. | Outlook | 18.3% | 4.2%(+14.1)#16 | 18.7%(-0.342)#5,352 |
| 17. | Belfry | 18.0% | 4.2%(+13.8)#17 | 18.7%(-0.674)#5,447 |
| 18. | Santa Rita | 17.3% | 4.2%(+13.1)#18 | 18.7%(-1.34)#5,643 |
| 19. | Potomac | 16.7% | 4.2%(+12.5)#19 | 18.7%(-1.99)#5,821 |
| 20. | Pine Creek | 16.6% | 4.2%(+12.4)#20 | 18.7%(-2.06)#5,846 |
| 21. | Hardin | 15.9% | 4.2%(+11.7)#21 | 18.7%(-2.77)#6,082 |
| 22. | Rockvale | 14.3% | 4.2%(+10.1)#22 | 18.7%(-4.37)#6,620 |
| 23. | Roy | 13.5% | 4.2%(+9.29)#23 | 18.7%(-5.15)#6,925 |
| 24. | Toston | 13.2% | 4.2%(+8.96)#24 | 18.7%(-5.49)#7,066 |
| 25. | Dupuyer | 12.9% | 4.2%(+8.73)#25 | 18.7%(-5.72)#7,170 |
| 26. | Sweet Grass | 12.9% | 4.2%(+8.65)#26 | 18.7%(-5.79)#7,206 |
| 27. | St. Mary | 12.8% | 4.2%(+8.61)#27 | 18.7%(-5.84)#7,229 |
| 28. | Big Sky | 12.1% | 4.2%(+7.94)#28 | 18.7%(-6.51)#7,526 |
| 29. | Kremlin | 11.4% | 4.2%(+7.16)#29 | 18.7%(-7.29)#7,931 |
| 30. | Colstrip | 10.9% | 4.2%(+6.67)#30 | 18.7%(-7.78)#8,196 |
| 31. | Busby | 10.8% | 4.2%(+6.56)#31 | 18.7%(-7.89)#8,251 |
| 32. | Lavina | 10.6% | 4.2%(+6.37)#32 | 18.7%(-8.08)#8,351 |
| 33. | Rexford | 10.6% | 4.2%(+6.36)#33 | 18.7%(-8.09)#8,357 |
| 34. | Malmstrom Afb | 10.5% | 4.2%(+6.29)#34 | 18.7%(-8.16)#8,410 |
| 35. | Stanford | 10.0% | 4.2%(+5.84)#35 | 18.7%(-8.61)#8,685 |
| 36. | Hinsdale | 10.0% | 4.2%(+5.84)#36 | 18.7%(-8.61)#8,688 |
| 37. | Belt | 10.0% | 4.2%(+5.76)#37 | 18.7%(-8.69)#8,737 |
| 38. | Ballantine | 9.9% | 4.2%(+5.72)#38 | 18.7%(-8.73)#8,765 |
| 39. | Fromberg | 9.5% | 4.2%(+5.33)#39 | 18.7%(-9.12)#9,023 |
| 40. | Geraldine | 9.3% | 4.2%(+5.06)#40 | 18.7%(-9.39)#9,206 |
| 41. | Philipsburg | 9.2% | 4.2%(+4.99)#41 | 18.7%(-9.46)#9,281 |
| 42. | Bigfork | 9.1% | 4.2%(+4.92)#42 | 18.7%(-9.53)#9,328 |
| 43. | Trout Creek | 8.7% | 4.2%(+4.52)#43 | 18.7%(-9.93)#9,647 |
| 44. | Charlo | 8.4% | 4.2%(+4.22)#44 | 18.7%(-10.2)#9,869 |
| 45. | Black Eagle | 8.3% | 4.2%(+4.13)#45 | 18.7%(-10.3)#9,962 |
| 46. | Eureka | 8.3% | 4.2%(+4.07)#46 | 18.7%(-10.4)#10,035 |
| 47. | East Helena | 8.2% | 4.2%(+4.00)#47 | 18.7%(-10.5)#10,091 |
| 48. | Hysham | 8.2% | 4.2%(+3.99)#48 | 18.7%(-10.5)#10,102 |
| 49. | Camas | 8.1% | 4.2%(+3.91)#49 | 18.7%(-10.5)#10,173 |
| 50. | Sand Coulee | 8.1% | 4.2%(+3.87)#50 | 18.7%(-10.6)#10,215 |
| 51. | Pony | 8.0% | 4.2%(+3.83)#51 | 18.7%(-10.6)#10,263 |
| 52. | Lockwood | 8.0% | 4.2%(+3.76)#52 | 18.7%(-10.7)#10,316 |
| 53. | Fort Benton | 7.8% | 4.2%(+3.57)#53 | 18.7%(-10.9)#10,493 |
| 54. | Babb | 7.7% | 4.2%(+3.55)#54 | 18.7%(-10.9)#10,526 |
| 55. | Rader Creek | 7.7% | 4.2%(+3.53)#55 | 18.7%(-10.9)#10,540 |
| 56. | Harlem | 7.7% | 4.2%(+3.46)#56 | 18.7%(-11.0)#10,606 |
| 57. | Acton | 7.6% | 4.2%(+3.39)#57 | 18.7%(-11.1)#10,685 |
| 58. | Hays | 7.5% | 4.2%(+3.29)#58 | 18.7%(-11.2)#10,778 |
| 59. | Box Elder | 7.4% | 4.2%(+3.15)#59 | 18.7%(-11.3)#10,904 |
| 60. | Billings | 7.1% | 4.2%(+2.85)#60 | 18.7%(-11.6)#11,185 |
| 61. | Sidney | 7.0% | 4.2%(+2.85)#61 | 18.7%(-11.6)#11,189 |
| 62. | Polson | 7.0% | 4.2%(+2.79)#62 | 18.7%(-11.7)#11,244 |
| 63. | Ronan | 6.9% | 4.2%(+2.65)#63 | 18.7%(-11.8)#11,398 |
| 64. | Laurel | 6.6% | 4.2%(+2.41)#64 | 18.7%(-12.0)#11,656 |
| 65. | Forest Hill Village | 6.6% | 4.2%(+2.36)#65 | 18.7%(-12.1)#11,720 |
| 66. | Thompson Falls | 6.5% | 4.2%(+2.25)#66 | 18.7%(-12.2)#11,839 |
| 67. | Medicine Lake | 6.3% | 4.2%(+2.11)#67 | 18.7%(-12.3)#11,999 |
| 68. | Columbia Falls | 6.3% | 4.2%(+2.09)#68 | 18.7%(-12.4)#12,021 |
| 69. | Florence | 6.2% | 4.2%(+2.01)#69 | 18.7%(-12.4)#12,113 |
| 70. | Moore | 6.2% | 4.2%(+1.95)#70 | 18.7%(-12.5)#12,190 |
| 71. | Dutton | 6.0% | 4.2%(+1.84)#71 | 18.7%(-12.6)#12,338 |
| 72. | Pinesdale | 6.0% | 4.2%(+1.77)#72 | 18.7%(-12.7)#12,412 |
| 73. | Wilsall | 5.9% | 4.2%(+1.65)#73 | 18.7%(-12.8)#12,565 |
| 74. | St Regis | 5.7% | 4.2%(+1.53)#74 | 18.7%(-12.9)#12,707 |
| 75. | Pablo | 5.7% | 4.2%(+1.47)#75 | 18.7%(-13.0)#12,800 |
| 76. | Great Falls | 5.4% | 4.2%(+1.23)#76 | 18.7%(-13.2)#13,080 |
| 77. | Wheatland | 5.4% | 4.2%(+1.21)#77 | 18.7%(-13.2)#13,117 |
| 78. | Shelby | 5.4% | 4.2%(+1.19)#78 | 18.7%(-13.3)#13,145 |
| 79. | Havre | 5.2% | 4.2%(+1.03)#79 | 18.7%(-13.4)#13,392 |
| 80. | Columbus | 5.2% | 4.2%(+0.974)#80 | 18.7%(-13.5)#13,458 |
| 81. | Roundup | 5.1% | 4.2%(+0.897)#81 | 18.7%(-13.6)#13,571 |
| 82. | Big Timber | 5.0% | 4.2%(+0.792)#82 | 18.7%(-13.7)#13,729 |
| 83. | Cascade | 4.9% | 4.2%(+0.719)#83 | 18.7%(-13.7)#13,836 |
| 84. | Wolf Point | 4.9% | 4.2%(+0.695)#84 | 18.7%(-13.8)#13,873 |
| 85. | Alberton | 4.9% | 4.2%(+0.676)#85 | 18.7%(-13.8)#13,897 |
| 86. | Helena Valley West Central | 4.9% | 4.2%(+0.648)#86 | 18.7%(-13.8)#13,938 |
| 87. | Bozeman | 4.8% | 4.2%(+0.605)#87 | 18.7%(-13.8)#13,990 |
| 88. | Custer | 4.8% | 4.2%(+0.592)#88 | 18.7%(-13.9)#14,004 |
| 89. | Helena | 4.8% | 4.2%(+0.584)#89 | 18.7%(-13.9)#14,016 |
| 90. | Butte Silver Bow Balance | 4.7% | 4.2%(+0.501)#90 | 18.7%(-13.9)#14,142 |
| 91. | Fairview | 4.7% | 4.2%(+0.497)#91 | 18.7%(-14.0)#14,151 |
| 92. | Vaughn | 4.6% | 4.2%(+0.413)#92 | 18.7%(-14.0)#14,281 |
| 93. | Piltzville | 4.6% | 4.2%(+0.413)#93 | 18.7%(-14.0)#14,284 |
| 94. | Miles City | 4.6% | 4.2%(+0.411)#94 | 18.7%(-14.0)#14,292 |
| 95. | Red Lodge | 4.5% | 4.2%(+0.322)#95 | 18.7%(-14.1)#14,444 |
| 96. | Missoula | 4.5% | 4.2%(+0.269)#96 | 18.7%(-14.2)#14,514 |
| 97. | Melstone | 4.4% | 4.2%(+0.210)#97 | 18.7%(-14.2)#14,598 |
| 98. | Harlowton | 4.4% | 4.2%(+0.202)#98 | 18.7%(-14.2)#14,605 |
| 99. | Poplar | 4.4% | 4.2%(+0.151)#99 | 18.7%(-14.3)#14,692 |
| 100. | Malta | 4.3% | 4.2%(+0.088)#100 | 18.7%(-14.4)#14,795 |
Common Questions
What are the Top 10 Cities with the Highest Percentage of Hispanic or Latino Population in Montana?
Top 10 Cities with the Highest Percentage of Hispanic or Latino Population in Montana are:
#1
43.8%
#2
36.2%
#3
32.9%
#4
32.6%
#5
30.2%
#6
26.4%
#7
23.5%
#8
22.2%
#9
22.0%
#10
20.1%
What city has the Highest Percentage of Hispanic or Latino Population in Montana?
Bynum has the Highest Percentage of Hispanic or Latino Population in Montana with 43.8%.
What is the Percentage of Hispanic or Latino Population in the State of Montana?
Percentage of Hispanic or Latino Population in Montana is 4.2%.
What is the Percentage of Hispanic or Latino Population in the United States?
Percentage of Hispanic or Latino Population in the United States is 18.7%.