Cities with the Highest Percentage of Hispanic or Latino Population in Oklahoma
RELATED REPORTS & OPTIONS
Hispanic or Latino
Oklahoma
Compare Cities
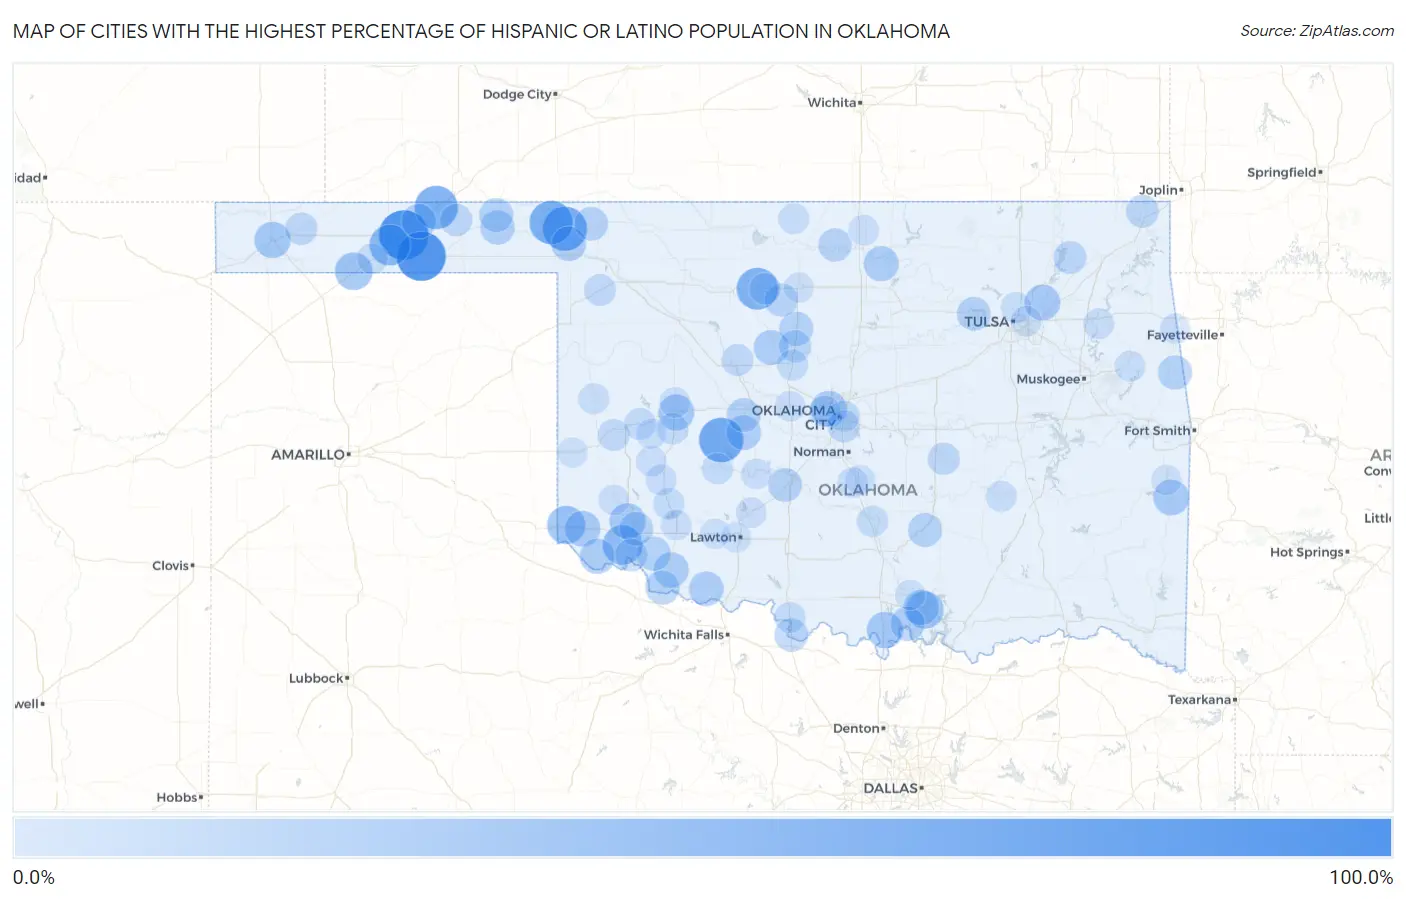
Map of Cities with the Highest Percentage of Hispanic or Latino Population in Oklahoma
0.0%
100.0%
Cities with the Highest Percentage of Hispanic or Latino Population in Oklahoma
| City | Hispanic or Latino | vs State | vs National | |
| 1. | Baker | 91.8% | 11.6%(+80.2)#1 | 18.7%(+73.1)#739 |
| 2. | Mehan | 91.2% | 11.6%(+79.6)#2 | 18.7%(+72.5)#750 |
| 3. | Optima | 88.2% | 11.6%(+76.6)#3 | 18.7%(+69.5)#826 |
| 4. | Hardesty | 86.9% | 11.6%(+75.3)#4 | 18.7%(+68.2)#854 |
| 5. | Eakly | 68.3% | 11.6%(+56.7)#5 | 18.7%(+49.6)#1,298 |
| 6. | Rosston | 67.7% | 11.6%(+56.2)#6 | 18.7%(+49.1)#1,318 |
| 7. | Adams | 65.9% | 11.6%(+54.3)#7 | 18.7%(+47.2)#1,380 |
| 8. | Gate | 64.4% | 11.6%(+52.9)#8 | 18.7%(+45.8)#1,425 |
| 9. | Tyrone | 64.0% | 11.6%(+52.5)#9 | 18.7%(+45.4)#1,433 |
| 10. | Ringwood | 58.5% | 11.6%(+46.9)#10 | 18.7%(+39.8)#1,611 |
| 11. | Guymon | 55.3% | 11.6%(+43.8)#11 | 18.7%(+36.7)#1,713 |
| 12. | Little Ponderosa | 52.8% | 11.6%(+41.2)#12 | 18.7%(+34.1)#1,840 |
| 13. | Bowring | 51.2% | 11.6%(+39.7)#13 | 18.7%(+32.6)#1,898 |
| 14. | Olustee | 50.5% | 11.6%(+39.0)#14 | 18.7%(+31.9)#1,924 |
| 15. | Hollis | 45.0% | 11.6%(+33.4)#15 | 18.7%(+26.3)#2,208 |
| 16. | Texhoma | 42.4% | 11.6%(+30.9)#16 | 18.7%(+23.8)#2,368 |
| 17. | Madill | 42.0% | 11.6%(+30.4)#17 | 18.7%(+23.3)#2,389 |
| 18. | Marietta | 38.5% | 11.6%(+27.0)#18 | 18.7%(+19.9)#2,610 |
| 19. | Boise City | 37.8% | 11.6%(+26.3)#19 | 18.7%(+19.2)#2,662 |
| 20. | Martha | 37.0% | 11.6%(+25.5)#20 | 18.7%(+18.4)#2,710 |
| 21. | Clinton | 36.8% | 11.6%(+25.2)#21 | 18.7%(+18.1)#2,727 |
| 22. | Warr Acres | 36.1% | 11.6%(+24.6)#22 | 18.7%(+17.5)#2,796 |
| 23. | Valley Park | 35.7% | 11.6%(+24.2)#23 | 18.7%(+17.1)#2,828 |
| 24. | Heavener | 35.6% | 11.6%(+24.0)#24 | 18.7%(+16.9)#2,839 |
| 25. | Gould | 35.5% | 11.6%(+23.9)#25 | 18.7%(+16.8)#2,848 |
| 26. | Oakland | 34.2% | 11.6%(+22.7)#26 | 18.7%(+15.6)#2,958 |
| 27. | Eldorado | 34.0% | 11.6%(+22.4)#27 | 18.7%(+15.3)#2,987 |
| 28. | Frederick | 33.7% | 11.6%(+22.2)#28 | 18.7%(+15.1)#3,002 |
| 29. | Marland | 33.2% | 11.6%(+21.7)#29 | 18.7%(+14.6)#3,058 |
| 30. | Loyal | 33.0% | 11.6%(+21.5)#30 | 18.7%(+14.4)#3,072 |
| 31. | Laverne | 32.3% | 11.6%(+20.7)#31 | 18.7%(+13.6)#3,143 |
| 32. | Hooker | 32.1% | 11.6%(+20.5)#32 | 18.7%(+13.4)#3,159 |
| 33. | Grandfield | 32.0% | 11.6%(+20.5)#33 | 18.7%(+13.4)#3,166 |
| 34. | Lookeba | 31.8% | 11.6%(+20.3)#34 | 18.7%(+13.2)#3,192 |
| 35. | Beaver | 30.6% | 11.6%(+19.1)#35 | 18.7%(+12.0)#3,324 |
| 36. | Lebanon | 30.2% | 11.6%(+18.6)#36 | 18.7%(+11.5)#3,372 |
| 37. | Hennessey | 30.1% | 11.6%(+18.6)#37 | 18.7%(+11.5)#3,378 |
| 38. | Davidson | 30.0% | 11.6%(+18.4)#38 | 18.7%(+11.3)#3,400 |
| 39. | Elm Grove | 29.9% | 11.6%(+18.3)#39 | 18.7%(+11.2)#3,409 |
| 40. | Tipton | 29.8% | 11.6%(+18.2)#40 | 18.7%(+11.1)#3,429 |
| 41. | Fitzhugh | 29.1% | 11.6%(+17.6)#41 | 18.7%(+10.5)#3,492 |
| 42. | Forgan | 29.0% | 11.6%(+17.5)#42 | 18.7%(+10.4)#3,506 |
| 43. | Hinton | 28.7% | 11.6%(+17.1)#43 | 18.7%(+10.0)#3,543 |
| 44. | Altus | 28.4% | 11.6%(+16.9)#44 | 18.7%(+9.78)#3,575 |
| 45. | Buffalo | 28.4% | 11.6%(+16.8)#45 | 18.7%(+9.71)#3,583 |
| 46. | Norge | 28.2% | 11.6%(+16.6)#46 | 18.7%(+9.54)#3,608 |
| 47. | Oak Grove | 28.1% | 11.6%(+16.6)#47 | 18.7%(+9.47)#3,614 |
| 48. | Terral | 27.6% | 11.6%(+16.1)#48 | 18.7%(+8.96)#3,673 |
| 49. | Lamont | 27.0% | 11.6%(+15.4)#49 | 18.7%(+8.31)#3,770 |
| 50. | Drummond | 26.9% | 11.6%(+15.4)#50 | 18.7%(+8.29)#3,772 |
| 51. | New Alluwe | 25.0% | 11.6%(+13.4)#51 | 18.7%(+6.35)#4,017 |
| 52. | Elmer | 25.0% | 11.6%(+13.4)#52 | 18.7%(+6.35)#4,018 |
| 53. | Commerce | 24.8% | 11.6%(+13.3)#53 | 18.7%(+6.15)#4,044 |
| 54. | Keyes | 23.7% | 11.6%(+12.1)#54 | 18.7%(+5.00)#4,244 |
| 55. | Dover | 23.6% | 11.6%(+12.1)#55 | 18.7%(+4.96)#4,249 |
| 56. | Valley Brook | 23.6% | 11.6%(+12.0)#56 | 18.7%(+4.92)#4,259 |
| 57. | Turpin | 23.3% | 11.6%(+11.8)#57 | 18.7%(+4.69)#4,304 |
| 58. | Lima | 23.2% | 11.6%(+11.6)#58 | 18.7%(+4.54)#4,334 |
| 59. | Watonga | 21.8% | 11.6%(+10.2)#59 | 18.7%(+3.11)#4,583 |
| 60. | Lakeside | 21.6% | 11.6%(+10.0)#60 | 18.7%(+2.92)#4,621 |
| 61. | Elk City | 21.6% | 11.6%(+10.0)#61 | 18.7%(+2.92)#4,622 |
| 62. | Fargo | 21.5% | 11.6%(+9.95)#62 | 18.7%(+2.85)#4,635 |
| 63. | Canute | 20.9% | 11.6%(+9.33)#63 | 18.7%(+2.23)#4,771 |
| 64. | Meno | 20.4% | 11.6%(+8.80)#64 | 18.7%(+1.70)#4,884 |
| 65. | Bessie | 20.2% | 11.6%(+8.69)#65 | 18.7%(+1.59)#4,909 |
| 66. | Oklahoma City | 20.1% | 11.6%(+8.52)#66 | 18.7%(+1.42)#4,955 |
| 67. | Roosevelt | 19.8% | 11.6%(+8.22)#67 | 18.7%(+1.12)#5,012 |
| 68. | Pauls Valley | 19.6% | 11.6%(+8.06)#68 | 18.7%(+0.963)#5,055 |
| 69. | Bethany | 19.6% | 11.6%(+8.03)#69 | 18.7%(+0.931)#5,064 |
| 70. | Ryan | 19.5% | 11.6%(+7.99)#70 | 18.7%(+0.887)#5,081 |
| 71. | Carnegie | 18.9% | 11.6%(+7.38)#71 | 18.7%(+0.276)#5,204 |
| 72. | Kingfisher | 18.9% | 11.6%(+7.37)#72 | 18.7%(+0.269)#5,205 |
| 73. | Cheyenne | 18.5% | 11.6%(+6.93)#73 | 18.7%(-0.170)#5,306 |
| 74. | Dixon | 18.5% | 11.6%(+6.90)#74 | 18.7%(-0.199)#5,318 |
| 75. | Hobart | 18.2% | 11.6%(+6.64)#75 | 18.7%(-0.459)#5,384 |
| 76. | Stuart | 18.1% | 11.6%(+6.58)#76 | 18.7%(-0.523)#5,410 |
| 77. | Murphy | 18.1% | 11.6%(+6.56)#77 | 18.7%(-0.536)#5,413 |
| 78. | Wakita | 17.9% | 11.6%(+6.39)#78 | 18.7%(-0.711)#5,461 |
| 79. | Park Hill | 17.8% | 11.6%(+6.21)#79 | 18.7%(-0.893)#5,512 |
| 80. | Turley | 17.6% | 11.6%(+6.03)#80 | 18.7%(-1.07)#5,560 |
| 81. | Goodwell | 17.5% | 11.6%(+5.92)#81 | 18.7%(-1.18)#5,586 |
| 82. | Mountain Park | 17.4% | 11.6%(+5.80)#82 | 18.7%(-1.30)#5,624 |
| 83. | Elgin | 17.4% | 11.6%(+5.80)#83 | 18.7%(-1.30)#5,626 |
| 84. | Tulsa | 17.3% | 11.6%(+5.77)#84 | 18.7%(-1.33)#5,637 |
| 85. | El Reno | 17.2% | 11.6%(+5.68)#85 | 18.7%(-1.41)#5,661 |
| 86. | Arapaho | 17.1% | 11.6%(+5.55)#86 | 18.7%(-1.54)#5,703 |
| 87. | Sentinel | 17.1% | 11.6%(+5.51)#87 | 18.7%(-1.59)#5,717 |
| 88. | Blackwell | 17.0% | 11.6%(+5.49)#88 | 18.7%(-1.61)#5,726 |
| 89. | Anadarko | 16.8% | 11.6%(+5.22)#89 | 18.7%(-1.88)#5,794 |
| 90. | Purcell | 16.7% | 11.6%(+5.17)#90 | 18.7%(-1.93)#5,806 |
| 91. | Mangum | 16.7% | 11.6%(+5.17)#91 | 18.7%(-1.93)#5,807 |
| 92. | Watts | 16.3% | 11.6%(+4.79)#92 | 18.7%(-2.31)#5,932 |
| 93. | Burns Flat | 16.3% | 11.6%(+4.76)#93 | 18.7%(-2.34)#5,944 |
| 94. | Lawton | 16.0% | 11.6%(+4.44)#94 | 18.7%(-2.65)#6,040 |
| 95. | Poteau | 15.9% | 11.6%(+4.32)#95 | 18.7%(-2.78)#6,089 |
| 96. | Mannsville | 15.8% | 11.6%(+4.29)#96 | 18.7%(-2.81)#6,097 |
| 97. | Cache | 15.8% | 11.6%(+4.22)#97 | 18.7%(-2.88)#6,124 |
| 98. | Erick | 15.6% | 11.6%(+4.09)#98 | 18.7%(-3.01)#6,160 |
| 99. | Lexington | 15.6% | 11.6%(+4.06)#99 | 18.7%(-3.04)#6,167 |
| 100. | Enid | 15.6% | 11.6%(+4.01)#100 | 18.7%(-3.09)#6,188 |
Common Questions
What are the Top 10 Cities with the Highest Percentage of Hispanic or Latino Population in Oklahoma?
Top 10 Cities with the Highest Percentage of Hispanic or Latino Population in Oklahoma are:
What city has the Highest Percentage of Hispanic or Latino Population in Oklahoma?
Optima has the Highest Percentage of Hispanic or Latino Population in Oklahoma with 88.2%.
What is the Percentage of Hispanic or Latino Population in the State of Oklahoma?
Percentage of Hispanic or Latino Population in Oklahoma is 11.6%.
What is the Percentage of Hispanic or Latino Population in the United States?
Percentage of Hispanic or Latino Population in the United States is 18.7%.