Cities with the Highest Percentage of Hispanic or Latino Population in Idaho
RELATED REPORTS & OPTIONS
Hispanic or Latino
Idaho
Compare Cities
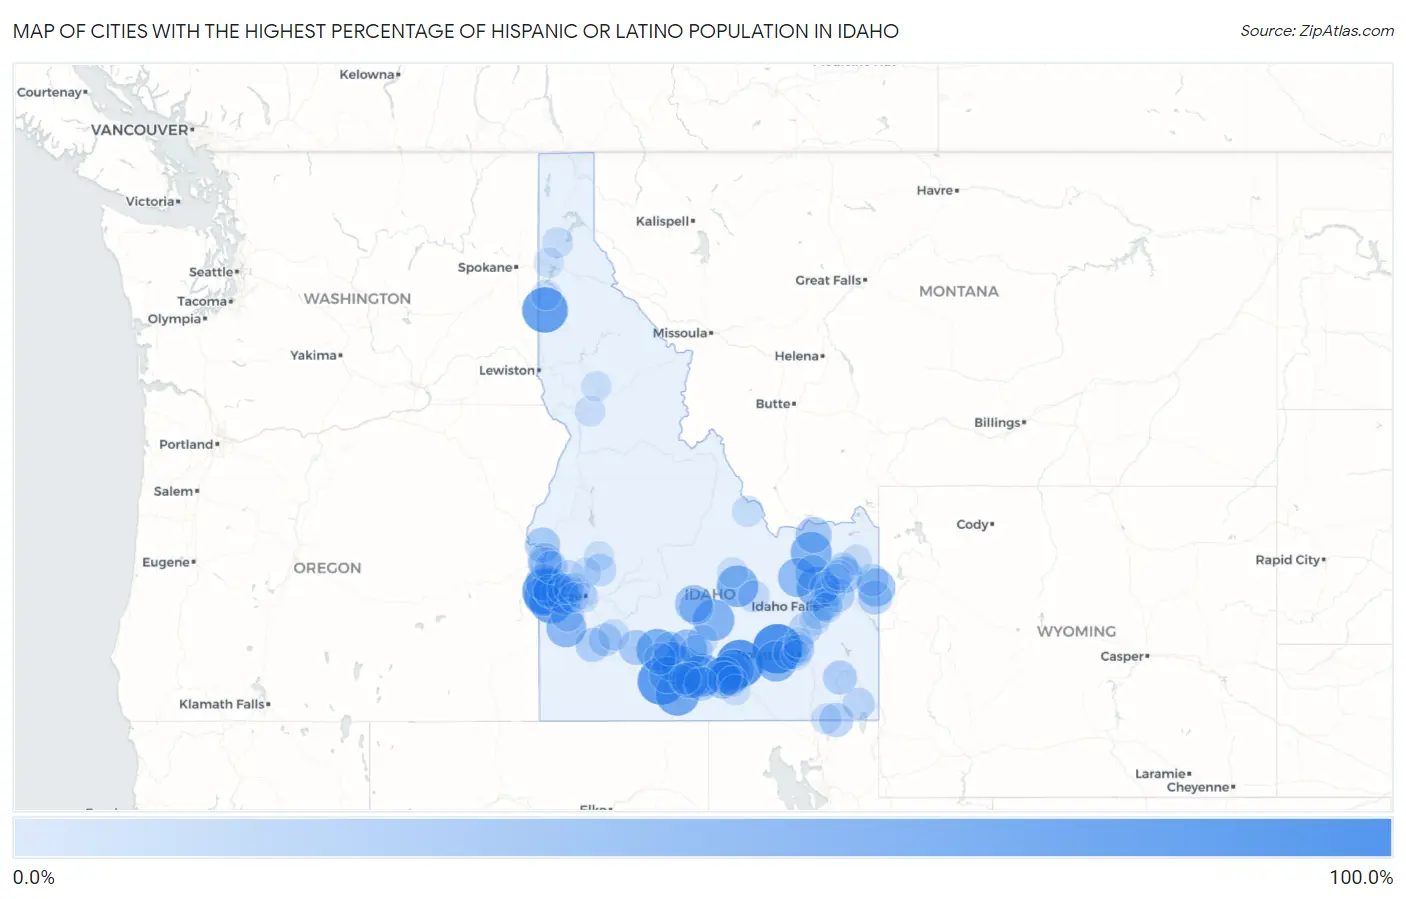
Map of Cities with the Highest Percentage of Hispanic or Latino Population in Idaho
0.0%
100.0%
Cities with the Highest Percentage of Hispanic or Latino Population in Idaho
| City | Hispanic or Latino | vs State | vs National | |
| 1. | Aberdeen | 80.0% | 13.1%(+66.9)#1 | 18.7%(+61.4)#1,008 |
| 2. | Gannett | 77.2% | 13.1%(+64.2)#2 | 18.7%(+58.6)#1,079 |
| 3. | Minidoka | 73.7% | 13.1%(+60.6)#3 | 18.7%(+55.1)#1,157 |
| 4. | Castleford | 71.4% | 13.1%(+58.4)#4 | 18.7%(+52.8)#1,216 |
| 5. | De Smet | 65.6% | 13.1%(+52.5)#5 | 18.7%(+46.9)#1,387 |
| 6. | Wilder | 64.8% | 13.1%(+51.8)#6 | 18.7%(+46.2)#1,412 |
| 7. | Marsing | 60.3% | 13.1%(+47.2)#7 | 18.7%(+41.6)#1,547 |
| 8. | Hollister | 59.0% | 13.1%(+46.0)#8 | 18.7%(+40.4)#1,580 |
| 9. | Hazelton | 54.3% | 13.1%(+41.2)#9 | 18.7%(+35.6)#1,768 |
| 10. | Bliss | 52.3% | 13.1%(+39.2)#10 | 18.7%(+33.7)#1,857 |
| 11. | Lost River | 50.0% | 13.1%(+36.9)#11 | 18.7%(+31.3)#1,957 |
| 12. | Roberts | 49.9% | 13.1%(+36.8)#12 | 18.7%(+31.2)#1,962 |
| 13. | Carey | 49.8% | 13.1%(+36.7)#13 | 18.7%(+31.1)#1,967 |
| 14. | Dubois | 49.1% | 13.1%(+36.0)#14 | 18.7%(+30.4)#2,003 |
| 15. | Rupert | 48.4% | 13.1%(+35.3)#15 | 18.7%(+29.7)#2,043 |
| 16. | Acequia | 48.1% | 13.1%(+35.1)#16 | 18.7%(+29.5)#2,060 |
| 17. | American Falls | 47.2% | 13.1%(+34.2)#17 | 18.7%(+28.6)#2,104 |
| 18. | Jerome | 46.1% | 13.1%(+33.0)#18 | 18.7%(+27.5)#2,158 |
| 19. | Homedale | 43.7% | 13.1%(+30.6)#19 | 18.7%(+25.0)#2,290 |
| 20. | Murphy | 43.0% | 13.1%(+30.0)#20 | 18.7%(+24.4)#2,325 |
| 21. | Mud Lake | 40.6% | 13.1%(+27.5)#21 | 18.7%(+21.9)#2,472 |
| 22. | Shoshone | 39.8% | 13.1%(+26.7)#22 | 18.7%(+21.1)#2,518 |
| 23. | Wendell | 39.7% | 13.1%(+26.6)#23 | 18.7%(+21.0)#2,530 |
| 24. | Notus | 39.5% | 13.1%(+26.4)#24 | 18.7%(+20.8)#2,541 |
| 25. | Eden | 38.4% | 13.1%(+25.3)#25 | 18.7%(+19.7)#2,620 |
| 26. | Caldwell | 37.9% | 13.1%(+24.8)#26 | 18.7%(+19.3)#2,655 |
| 27. | Driggs | 37.6% | 13.1%(+24.6)#27 | 18.7%(+19.0)#2,673 |
| 28. | Burley | 34.8% | 13.1%(+21.7)#28 | 18.7%(+16.1)#2,903 |
| 29. | Hailey | 34.7% | 13.1%(+21.6)#29 | 18.7%(+16.0)#2,912 |
| 30. | Paul | 33.3% | 13.1%(+20.2)#30 | 18.7%(+14.6)#3,048 |
| 31. | Buhl | 32.7% | 13.1%(+19.6)#31 | 18.7%(+14.0)#3,095 |
| 32. | Teton | 32.6% | 13.1%(+19.5)#32 | 18.7%(+13.9)#3,107 |
| 33. | Hansen | 32.5% | 13.1%(+19.4)#33 | 18.7%(+13.8)#3,118 |
| 34. | Kimberly | 32.5% | 13.1%(+19.4)#34 | 18.7%(+13.8)#3,122 |
| 35. | Parma | 30.9% | 13.1%(+17.9)#35 | 18.7%(+12.3)#3,293 |
| 36. | Spencer | 30.4% | 13.1%(+17.4)#36 | 18.7%(+11.8)#3,350 |
| 37. | Weiser | 26.8% | 13.1%(+13.8)#37 | 18.7%(+8.19)#3,787 |
| 38. | Hamer | 26.3% | 13.1%(+13.3)#38 | 18.7%(+7.66)#3,854 |
| 39. | Glenns Ferry | 26.3% | 13.1%(+13.2)#39 | 18.7%(+7.65)#3,855 |
| 40. | Nampa | 25.3% | 13.1%(+12.2)#40 | 18.7%(+6.62)#3,981 |
| 41. | Heyburn | 25.1% | 13.1%(+12.1)#41 | 18.7%(+6.49)#3,998 |
| 42. | Bellevue | 24.9% | 13.1%(+11.8)#42 | 18.7%(+6.25)#4,031 |
| 43. | Ririe | 23.6% | 13.1%(+10.5)#43 | 18.7%(+4.91)#4,260 |
| 44. | Victor | 23.4% | 13.1%(+10.3)#44 | 18.7%(+4.71)#4,301 |
| 45. | Franklin | 23.2% | 13.1%(+10.2)#45 | 18.7%(+4.60)#4,322 |
| 46. | Grand View | 22.9% | 13.1%(+9.82)#46 | 18.7%(+4.23)#4,380 |
| 47. | Gooding | 22.8% | 13.1%(+9.75)#47 | 18.7%(+4.16)#4,396 |
| 48. | Murtaugh | 22.7% | 13.1%(+9.66)#48 | 18.7%(+4.08)#4,408 |
| 49. | Payette | 22.7% | 13.1%(+9.63)#49 | 18.7%(+4.04)#4,413 |
| 50. | Grace | 22.6% | 13.1%(+9.51)#50 | 18.7%(+3.92)#4,436 |
| 51. | Arbon Valley | 21.7% | 13.1%(+8.62)#51 | 18.7%(+3.03)#4,598 |
| 52. | Fruitland | 20.8% | 13.1%(+7.75)#52 | 18.7%(+2.16)#4,781 |
| 53. | Greenleaf | 20.1% | 13.1%(+7.04)#53 | 18.7%(+1.45)#4,947 |
| 54. | Melba | 19.9% | 13.1%(+6.87)#54 | 18.7%(+1.28)#4,977 |
| 55. | New Plymouth | 19.7% | 13.1%(+6.63)#55 | 18.7%(+1.04)#5,037 |
| 56. | Mountain Home Afb | 19.2% | 13.1%(+6.12)#56 | 18.7%(+0.538)#5,151 |
| 57. | Dietrich | 18.7% | 13.1%(+5.64)#57 | 18.7%(+0.056)#5,251 |
| 58. | Blackfoot | 18.1% | 13.1%(+5.04)#58 | 18.7%(-0.545)#5,415 |
| 59. | Tetonia | 17.7% | 13.1%(+4.67)#59 | 18.7%(-0.914)#5,518 |
| 60. | Placerville | 17.1% | 13.1%(+4.01)#60 | 18.7%(-1.58)#5,715 |
| 61. | Idaho Falls | 16.6% | 13.1%(+3.58)#61 | 18.7%(-2.01)#5,826 |
| 62. | St Anthony | 16.4% | 13.1%(+3.32)#62 | 18.7%(-2.27)#5,912 |
| 63. | Paris | 15.8% | 13.1%(+2.75)#63 | 18.7%(-2.83)#6,103 |
| 64. | Lincoln | 15.8% | 13.1%(+2.74)#64 | 18.7%(-2.85)#6,114 |
| 65. | Butte City | 15.3% | 13.1%(+2.21)#65 | 18.7%(-3.37)#6,260 |
| 66. | Emmett | 15.1% | 13.1%(+2.05)#66 | 18.7%(-3.54)#6,316 |
| 67. | Twin Falls | 15.1% | 13.1%(+2.01)#67 | 18.7%(-3.57)#6,329 |
| 68. | Hagerman | 14.9% | 13.1%(+1.88)#68 | 18.7%(-3.71)#6,377 |
| 69. | Mountain Home | 14.3% | 13.1%(+1.19)#69 | 18.7%(-4.40)#6,631 |
| 70. | Rigby | 14.2% | 13.1%(+1.10)#70 | 18.7%(-4.49)#6,657 |
| 71. | Leadore | 12.9% | 13.1%(-0.186)#71 | 18.7%(-5.77)#7,194 |
| 72. | Ashton | 12.4% | 13.1%(-0.629)#72 | 18.7%(-6.22)#7,384 |
| 73. | Firth | 12.4% | 13.1%(-0.662)#73 | 18.7%(-6.25)#7,394 |
| 74. | Shelley | 12.2% | 13.1%(-0.826)#74 | 18.7%(-6.41)#7,474 |
| 75. | Chubbuck | 12.2% | 13.1%(-0.864)#75 | 18.7%(-6.45)#7,494 |
| 76. | Middleton | 11.9% | 13.1%(-1.13)#76 | 18.7%(-6.72)#7,628 |
| 77. | Tyhee | 11.8% | 13.1%(-1.22)#77 | 18.7%(-6.81)#7,673 |
| 78. | Menan | 11.7% | 13.1%(-1.34)#78 | 18.7%(-6.93)#7,732 |
| 79. | Richfield | 11.6% | 13.1%(-1.47)#79 | 18.7%(-7.06)#7,811 |
| 80. | Weston | 11.2% | 13.1%(-1.87)#80 | 18.7%(-7.46)#8,019 |
| 81. | Mackay | 11.1% | 13.1%(-1.99)#81 | 18.7%(-7.58)#8,087 |
| 82. | Albion | 10.9% | 13.1%(-2.13)#82 | 18.7%(-7.72)#8,153 |
| 83. | Declo | 10.8% | 13.1%(-2.22)#83 | 18.7%(-7.81)#8,212 |
| 84. | Athol | 10.8% | 13.1%(-2.31)#84 | 18.7%(-7.89)#8,250 |
| 85. | Ammon | 10.6% | 13.1%(-2.45)#85 | 18.7%(-8.03)#8,326 |
| 86. | Plummer | 10.2% | 13.1%(-2.87)#86 | 18.7%(-8.46)#8,585 |
| 87. | Garden City | 10.2% | 13.1%(-2.89)#87 | 18.7%(-8.47)#8,596 |
| 88. | Grangeville | 9.9% | 13.1%(-3.12)#88 | 18.7%(-8.71)#8,754 |
| 89. | Crouch | 9.9% | 13.1%(-3.16)#89 | 18.7%(-8.75)#8,780 |
| 90. | Horseshoe Bend | 9.8% | 13.1%(-3.24)#90 | 18.7%(-8.83)#8,830 |
| 91. | Kamiah | 9.8% | 13.1%(-3.31)#91 | 18.7%(-8.90)#8,877 |
| 92. | Pocatello | 9.6% | 13.1%(-3.49)#92 | 18.7%(-9.07)#8,994 |
| 93. | Fort Hall | 9.5% | 13.1%(-3.56)#93 | 18.7%(-9.14)#9,043 |
| 94. | Sugar City | 9.5% | 13.1%(-3.58)#94 | 18.7%(-9.16)#9,058 |
| 95. | Rexburg | 9.5% | 13.1%(-3.61)#95 | 18.7%(-9.20)#9,091 |
| 96. | Huetter | 9.3% | 13.1%(-3.75)#96 | 18.7%(-9.34)#9,169 |
| 97. | Star | 9.2% | 13.1%(-3.83)#97 | 18.7%(-9.41)#9,237 |
| 98. | Eagle | 9.1% | 13.1%(-4.00)#98 | 18.7%(-9.59)#9,382 |
| 99. | Boise City | 9.1% | 13.1%(-4.01)#99 | 18.7%(-9.59)#9,385 |
| 100. | Meridian | 9.0% | 13.1%(-4.11)#100 | 18.7%(-9.69)#9,461 |
1
2Common Questions
What are the Top 10 Cities with the Highest Percentage of Hispanic or Latino Population in Idaho?
Top 10 Cities with the Highest Percentage of Hispanic or Latino Population in Idaho are:
#1
80.0%
#2
73.7%
#3
71.4%
#4
65.6%
#5
64.8%
#6
60.3%
#7
59.0%
#8
54.3%
#9
52.3%
#10
50.0%
What city has the Highest Percentage of Hispanic or Latino Population in Idaho?
Aberdeen has the Highest Percentage of Hispanic or Latino Population in Idaho with 80.0%.
What is the Percentage of Hispanic or Latino Population in the State of Idaho?
Percentage of Hispanic or Latino Population in Idaho is 13.1%.
What is the Percentage of Hispanic or Latino Population in the United States?
Percentage of Hispanic or Latino Population in the United States is 18.7%.