North Plainfield borough, NJ Map & Demographics
North Plainfield borough Overview
$35,195
PER CAPITA INCOME
$93,066
AVG FAMILY INCOME
$81,219
AVG HOUSEHOLD INCOME
12.5%
WAGE / INCOME GAP [ % ]
87.5¢/ $1
WAGE / INCOME GAP [ $ ]
0.40
INEQUALITY / GINI INDEX
22,695
TOTAL POPULATION
10,612
MALE POPULATION
12,083
FEMALE POPULATION
87.83
MALES / 100 FEMALES
113.86
FEMALES / 100 MALES
37.2
MEDIAN AGE
3.4
AVG FAMILY SIZE
2.8
AVG HOUSEHOLD SIZE
13,364
LABOR FORCE [ PEOPLE ]
73.0%
PERCENT IN LABOR FORCE
9.6%
UNEMPLOYMENT RATE
Income in North Plainfield borough
Income Overview in North Plainfield borough
Per Capita Income in North Plainfield borough is $35,195, while median incomes of families and households are $93,066 and $81,219 respectively.
| Characteristic | Number | Measure |
| Per Capita Income | 22,695 | $35,195 |
| Median Family Income | 5,632 | $93,066 |
| Mean Family Income | 5,632 | $113,205 |
| Median Household Income | 8,077 | $81,219 |
| Mean Household Income | 8,077 | $98,250 |
| Income Deficit | 5,632 | $0 |
| Wage / Income Gap (%) | 22,695 | 12.48% |
| Wage / Income Gap ($) | 22,695 | 87.52¢ per $1 |
| Gini / Inequality Index | 22,695 | 0.40 |
Earnings by Sex in North Plainfield borough
Average Earnings in North Plainfield borough are $39,154, $41,034 for men and $35,915 for women, a difference of 12.5%.
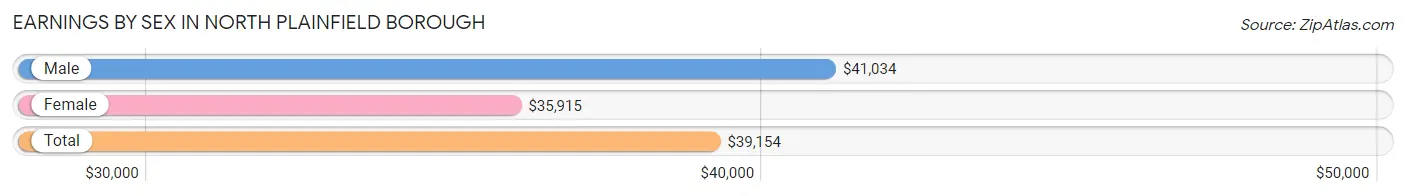
| Sex | Number | Average Earnings |
| Male | 6,822 (50.9%) | $41,034 |
| Female | 6,573 (49.1%) | $35,915 |
| Total | 13,395 (100.0%) | $39,154 |
Earnings by Sex by Income Bracket in North Plainfield borough
The most common earnings brackets in North Plainfield borough are $100,000+ for men (938 | 13.8%) and $100,000+ for women (828 | 12.6%).
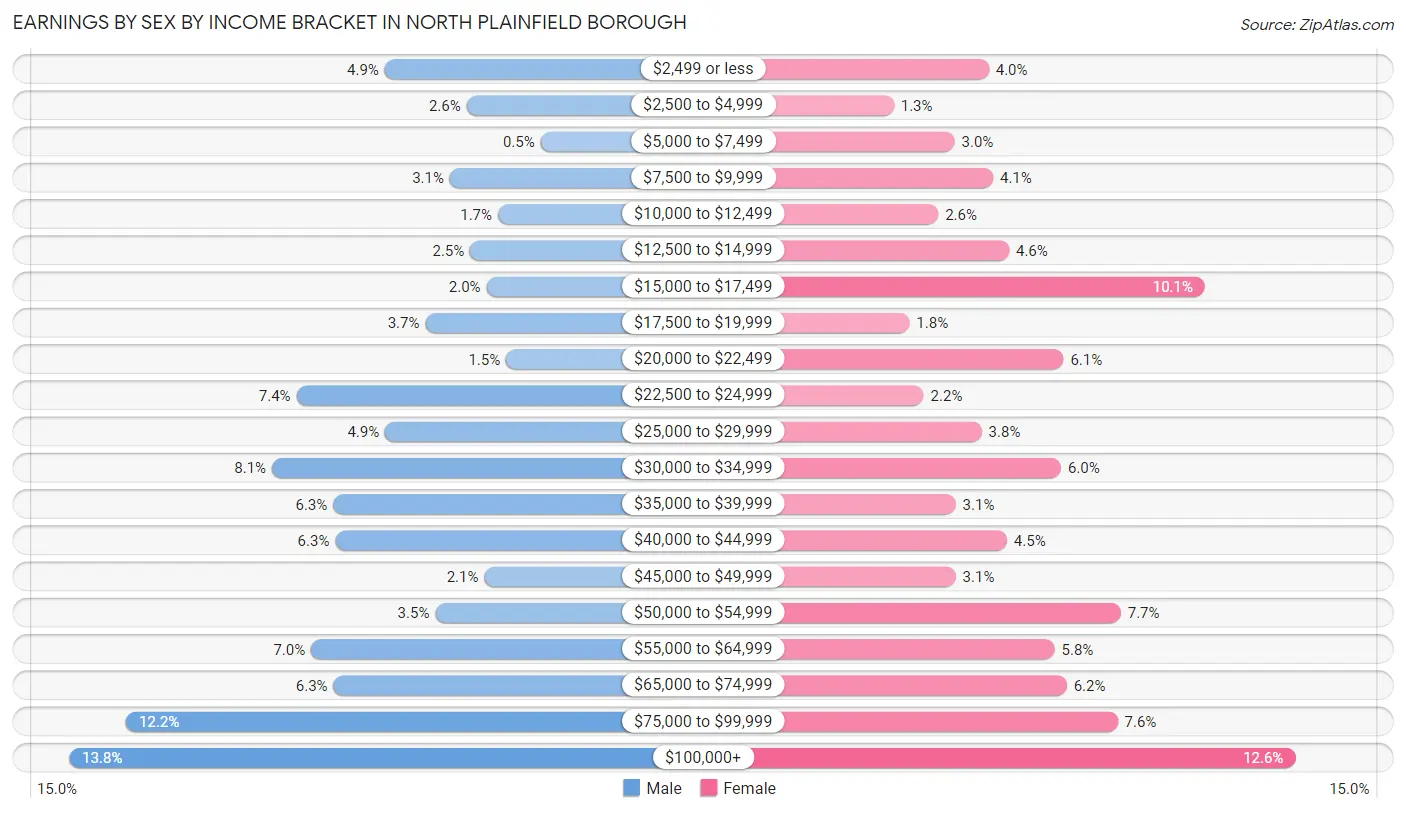
| Income | Male | Female |
| $2,499 or less | 333 (4.9%) | 262 (4.0%) |
| $2,500 to $4,999 | 176 (2.6%) | 87 (1.3%) |
| $5,000 to $7,499 | 34 (0.5%) | 199 (3.0%) |
| $7,500 to $9,999 | 208 (3.0%) | 270 (4.1%) |
| $10,000 to $12,499 | 116 (1.7%) | 169 (2.6%) |
| $12,500 to $14,999 | 169 (2.5%) | 300 (4.6%) |
| $15,000 to $17,499 | 138 (2.0%) | 661 (10.1%) |
| $17,500 to $19,999 | 255 (3.7%) | 116 (1.8%) |
| $20,000 to $22,499 | 100 (1.5%) | 400 (6.1%) |
| $22,500 to $24,999 | 502 (7.4%) | 142 (2.2%) |
| $25,000 to $29,999 | 332 (4.9%) | 249 (3.8%) |
| $30,000 to $34,999 | 549 (8.1%) | 396 (6.0%) |
| $35,000 to $39,999 | 432 (6.3%) | 201 (3.1%) |
| $40,000 to $44,999 | 428 (6.3%) | 296 (4.5%) |
| $45,000 to $49,999 | 142 (2.1%) | 201 (3.1%) |
| $50,000 to $54,999 | 236 (3.5%) | 506 (7.7%) |
| $55,000 to $64,999 | 474 (7.0%) | 384 (5.8%) |
| $65,000 to $74,999 | 431 (6.3%) | 406 (6.2%) |
| $75,000 to $99,999 | 829 (12.1%) | 500 (7.6%) |
| $100,000+ | 938 (13.8%) | 828 (12.6%) |
| Total | 6,822 (100.0%) | 6,573 (100.0%) |
Earnings by Sex by Educational Attainment in North Plainfield borough
Average earnings in North Plainfield borough are $44,850 for men and $44,203 for women, a difference of 1.4%. Men with an educational attainment of bachelor's degree enjoy the highest average annual earnings of $67,854, while those with less than high school education earn the least with $34,432. Women with an educational attainment of graduate degree earn the most with the average annual earnings of $103,300, while those with less than high school education have the smallest earnings of $20,303.
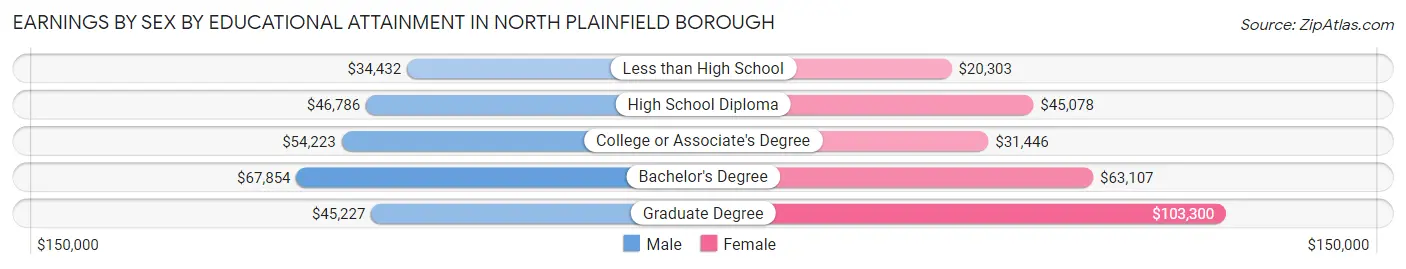
| Educational Attainment | Male Income | Female Income |
| Less than High School | $34,432 | $20,303 |
| High School Diploma | $46,786 | $45,078 |
| College or Associate's Degree | $54,223 | $31,446 |
| Bachelor's Degree | $67,854 | $63,107 |
| Graduate Degree | $45,227 | $103,300 |
| Total | $44,850 | $44,203 |
Family Income in North Plainfield borough
Family Income Brackets in North Plainfield borough
According to the North Plainfield borough family income data, there are 1,064 families falling into the $75,000 to $99,999 income range, which is the most common income bracket and makes up 18.9% of all families. Conversely, the $10,000 to $14,999 income bracket is the least frequent group with only 23 families (0.4%) belonging to this category.
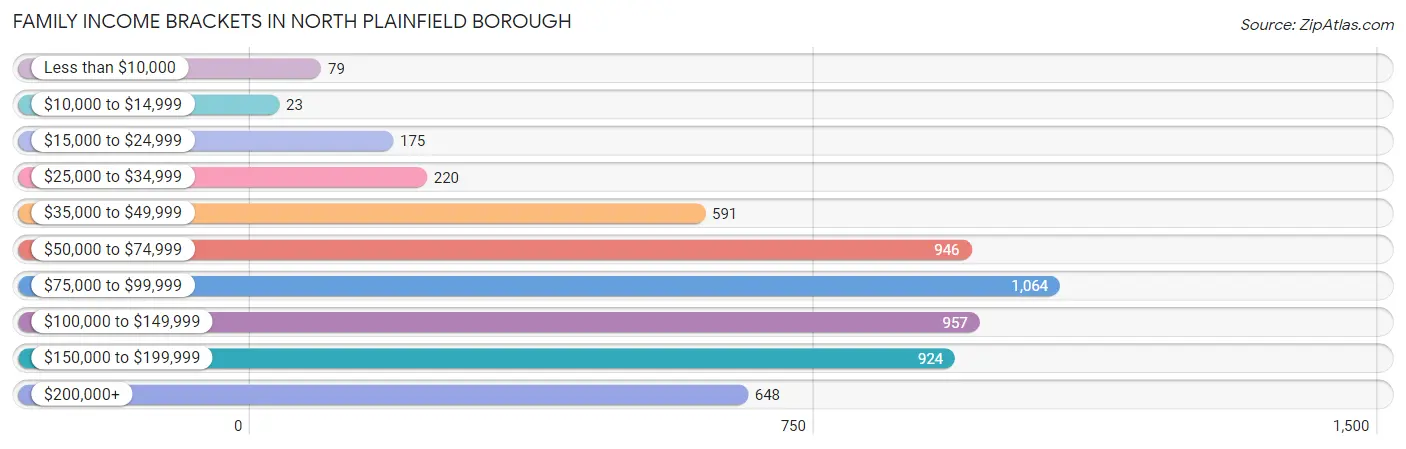
| Income Bracket | # Families | % Families |
| Less than $10,000 | 79 | 1.4% |
| $10,000 to $14,999 | 23 | 0.4% |
| $15,000 to $24,999 | 175 | 3.1% |
| $25,000 to $34,999 | 220 | 3.9% |
| $35,000 to $49,999 | 591 | 10.5% |
| $50,000 to $74,999 | 946 | 16.8% |
| $75,000 to $99,999 | 1,064 | 18.9% |
| $100,000 to $149,999 | 957 | 17.0% |
| $150,000 to $199,999 | 924 | 16.4% |
| $200,000+ | 648 | 11.5% |
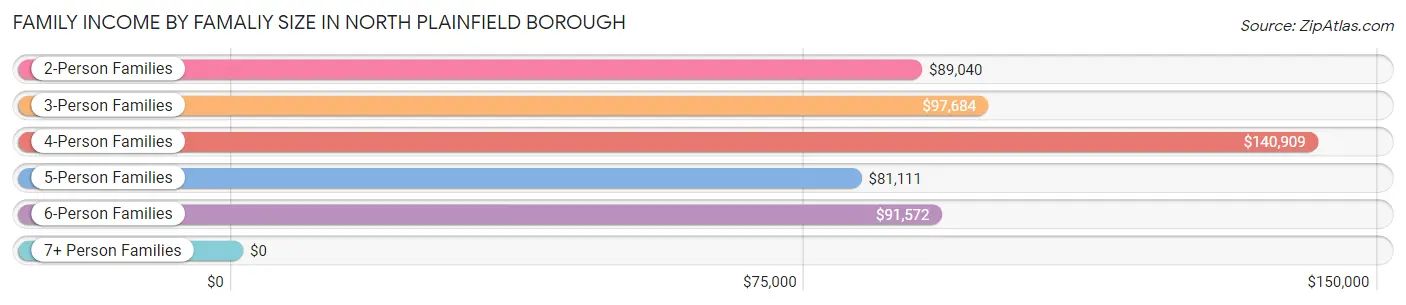
Family Income by Famaliy Size in North Plainfield borough
4-person families (738 | 13.1%) account for the highest median family income in North Plainfield borough with $140,909 per family, while 2-person families (2,216 | 39.4%) have the highest median income of $44,520 per family member.
| Income Bracket | # Families | Median Income |
| 2-Person Families | 2,216 (39.4%) | $89,040 |
| 3-Person Families | 1,532 (27.2%) | $97,684 |
| 4-Person Families | 738 (13.1%) | $140,909 |
| 5-Person Families | 612 (10.9%) | $81,111 |
| 6-Person Families | 303 (5.4%) | $91,572 |
| 7+ Person Families | 231 (4.1%) | $0 |
| Total | 5,632 (100.0%) | $93,066 |
Family Income by Number of Earners in North Plainfield borough
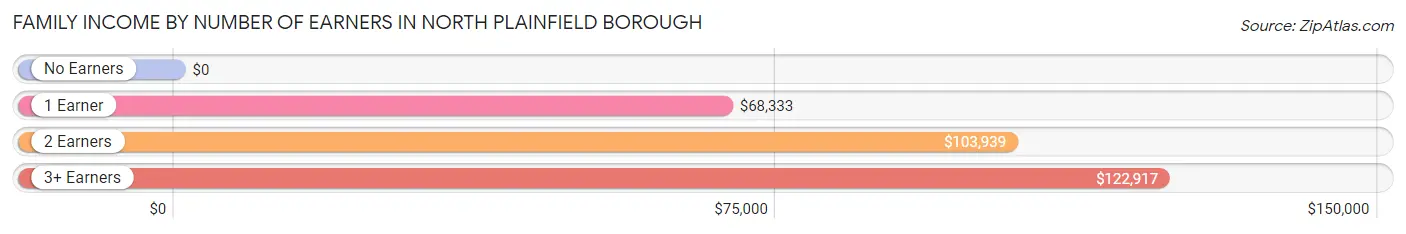
| Number of Earners | # Families | Median Income |
| No Earners | 335 (5.9%) | $0 |
| 1 Earner | 1,628 (28.9%) | $68,333 |
| 2 Earners | 2,359 (41.9%) | $103,939 |
| 3+ Earners | 1,310 (23.3%) | $122,917 |
| Total | 5,632 (100.0%) | $93,066 |
Household Income in North Plainfield borough
Household Income Brackets in North Plainfield borough
With 1,599 households falling in the category, the $50,000 to $74,999 income range is the most frequent in North Plainfield borough, accounting for 19.8% of all households. In contrast, only 162 households (2.0%) fall into the $10,000 to $14,999 income bracket, making it the least populous group.
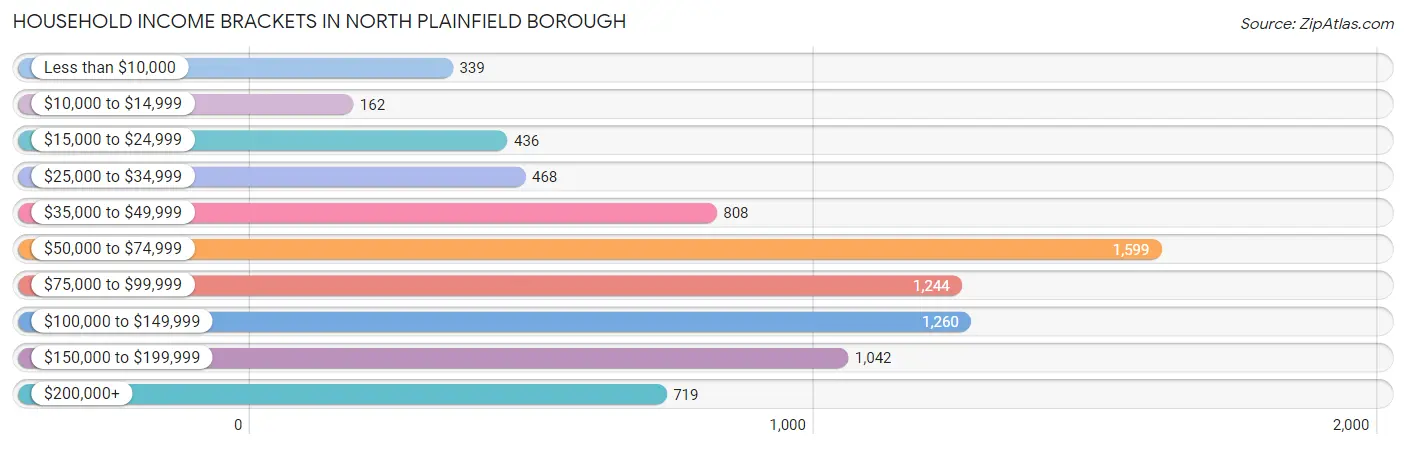
| Income Bracket | # Households | % Households |
| Less than $10,000 | 339 | 4.2% |
| $10,000 to $14,999 | 162 | 2.0% |
| $15,000 to $24,999 | 436 | 5.4% |
| $25,000 to $34,999 | 468 | 5.8% |
| $35,000 to $49,999 | 808 | 10.0% |
| $50,000 to $74,999 | 1,599 | 19.8% |
| $75,000 to $99,999 | 1,244 | 15.4% |
| $100,000 to $149,999 | 1,260 | 15.6% |
| $150,000 to $199,999 | 1,042 | 12.9% |
| $200,000+ | 719 | 8.9% |
Household Income by Householder Age in North Plainfield borough
The median household income in North Plainfield borough is $81,219, with the highest median household income of $93,523 found in the 45 to 64 years age bracket for the primary householder. A total of 3,978 households (49.2%) fall into this category. Meanwhile, the 15 to 24 years age bracket for the primary householder has the lowest median household income of $0, with 131 households (1.6%) in this group.
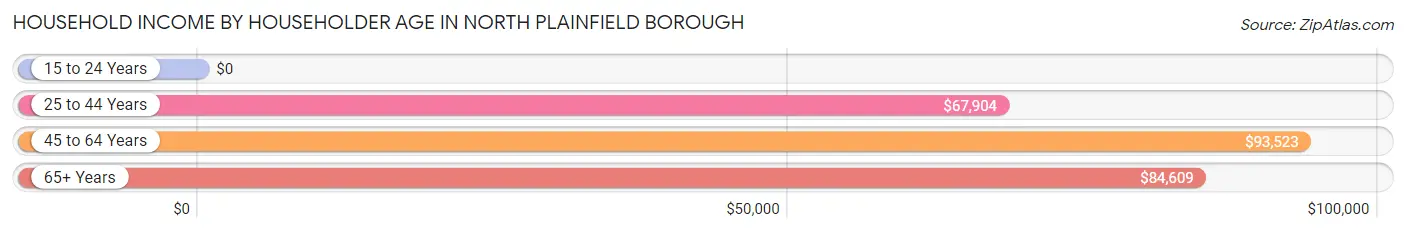
| Income Bracket | # Households | Median Income |
| 15 to 24 Years | 131 (1.6%) | $0 |
| 25 to 44 Years | 2,629 (32.6%) | $67,904 |
| 45 to 64 Years | 3,978 (49.2%) | $93,523 |
| 65+ Years | 1,339 (16.6%) | $84,609 |
| Total | 8,077 (100.0%) | $81,219 |
Poverty in North Plainfield borough
Income Below Poverty by Sex and Age in North Plainfield borough
With 10.6% poverty level for males and 13.7% for females among the residents of North Plainfield borough, 15 year old males and 5 year old females are the most vulnerable to poverty, with 43 males (51.8%) and 27 females (100.0%) in their respective age groups living below the poverty level.
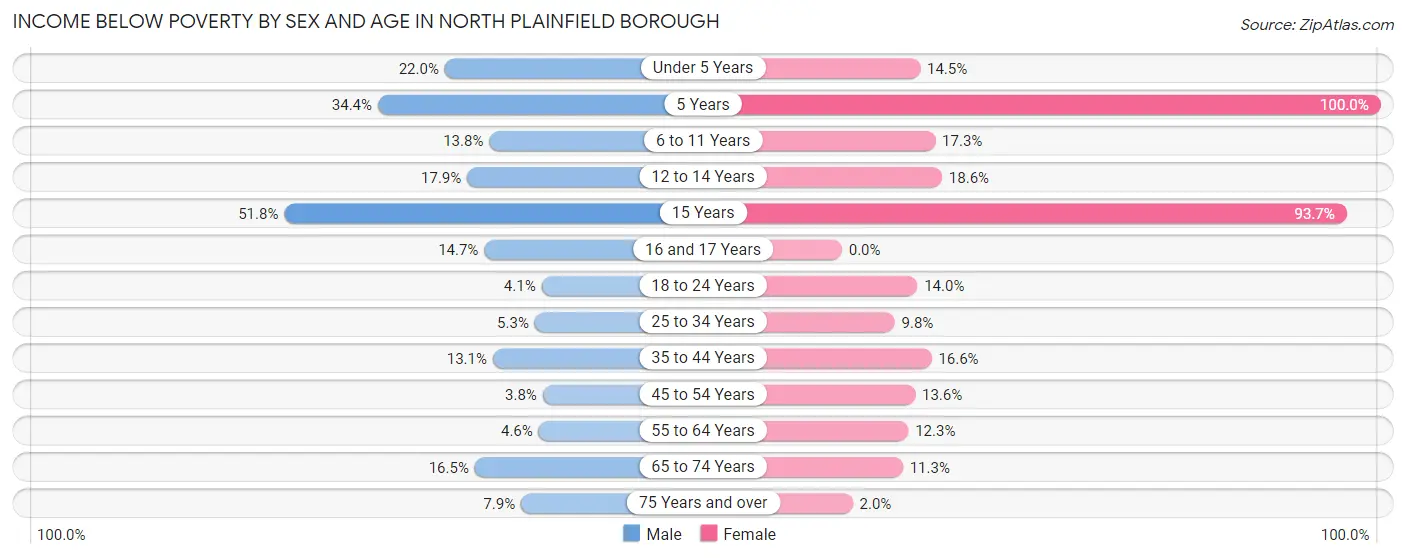
| Age Bracket | Male | Female |
| Under 5 Years | 161 (22.0%) | 127 (14.5%) |
| 5 Years | 42 (34.4%) | 27 (100.0%) |
| 6 to 11 Years | 97 (13.8%) | 153 (17.3%) |
| 12 to 14 Years | 80 (17.9%) | 68 (18.6%) |
| 15 Years | 43 (51.8%) | 104 (93.7%) |
| 16 and 17 Years | 63 (14.7%) | 0 (0.0%) |
| 18 to 24 Years | 42 (4.1%) | 198 (14.0%) |
| 25 to 34 Years | 71 (5.3%) | 175 (9.8%) |
| 35 to 44 Years | 235 (13.1%) | 201 (16.6%) |
| 45 to 54 Years | 49 (3.8%) | 228 (13.6%) |
| 55 to 64 Years | 68 (4.6%) | 255 (12.3%) |
| 65 to 74 Years | 150 (16.5%) | 103 (11.3%) |
| 75 Years and over | 18 (7.9%) | 12 (2.0%) |
| Total | 1,119 (10.6%) | 1,651 (13.7%) |
Income Above Poverty by Sex and Age in North Plainfield borough
According to the poverty statistics in North Plainfield borough, males aged 45 to 54 years and females aged 16 and 17 years are the age groups that are most secure financially, with 96.2% of males and 100.0% of females in these age groups living above the poverty line.
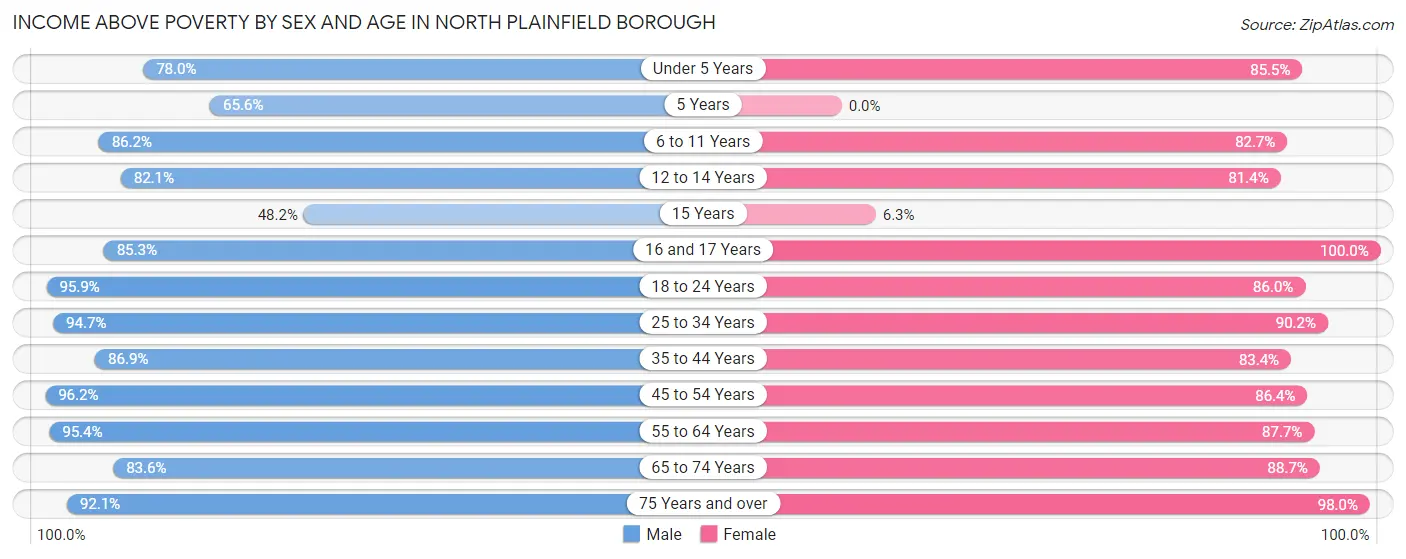
| Age Bracket | Male | Female |
| Under 5 Years | 570 (78.0%) | 747 (85.5%) |
| 5 Years | 80 (65.6%) | 0 (0.0%) |
| 6 to 11 Years | 608 (86.2%) | 730 (82.7%) |
| 12 to 14 Years | 368 (82.1%) | 298 (81.4%) |
| 15 Years | 40 (48.2%) | 7 (6.3%) |
| 16 and 17 Years | 366 (85.3%) | 145 (100.0%) |
| 18 to 24 Years | 993 (95.9%) | 1,216 (86.0%) |
| 25 to 34 Years | 1,267 (94.7%) | 1,611 (90.2%) |
| 35 to 44 Years | 1,559 (86.9%) | 1,007 (83.4%) |
| 45 to 54 Years | 1,230 (96.2%) | 1,448 (86.4%) |
| 55 to 64 Years | 1,415 (95.4%) | 1,813 (87.7%) |
| 65 to 74 Years | 762 (83.6%) | 808 (88.7%) |
| 75 Years and over | 211 (92.1%) | 588 (98.0%) |
| Total | 9,469 (89.4%) | 10,418 (86.3%) |
Income Below Poverty Among Married-Couple Families in North Plainfield borough
The poverty statistics for married-couple families in North Plainfield borough show that 6.1% or 226 of the total 3,682 families live below the poverty line. Families with 5 or more children have the highest poverty rate of 74.3%, comprising of 75 families. On the other hand, families with 1 or 2 children have the lowest poverty rate of 0.0%, which includes 0 families.
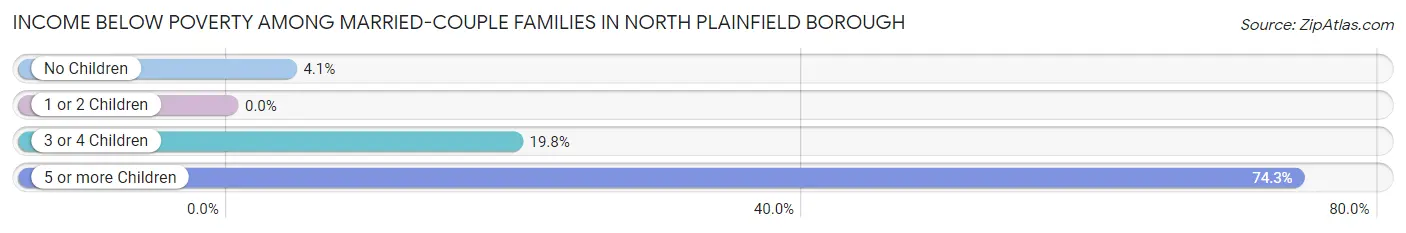
| Children | Above Poverty | Below Poverty |
| No Children | 2,048 (95.9%) | 87 (4.1%) |
| 1 or 2 Children | 1,123 (100.0%) | 0 (0.0%) |
| 3 or 4 Children | 259 (80.2%) | 64 (19.8%) |
| 5 or more Children | 26 (25.7%) | 75 (74.3%) |
| Total | 3,456 (93.9%) | 226 (6.1%) |
Income Below Poverty Among Single-Parent Households in North Plainfield borough
According to the poverty data in North Plainfield borough, 7.2% or 44 single-father households and 10.2% or 137 single-mother households are living below the poverty line. Among single-father households, those with 3 or 4 children have the highest poverty rate, with 13 households (100.0%) experiencing poverty. Likewise, among single-mother households, those with 3 or 4 children have the highest poverty rate, with 30 households (100.0%) falling below the poverty line.
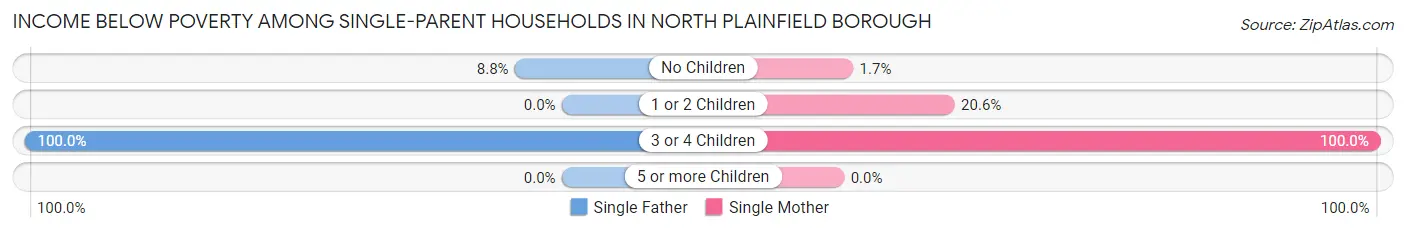
| Children | Single Father | Single Mother |
| No Children | 31 (8.8%) | 14 (1.7%) |
| 1 or 2 Children | 0 (0.0%) | 93 (20.6%) |
| 3 or 4 Children | 13 (100.0%) | 30 (100.0%) |
| 5 or more Children | 0 (0.0%) | 0 (0.0%) |
| Total | 44 (7.2%) | 137 (10.2%) |
Income Below Poverty Among Married-Couple vs Single-Parent Households in North Plainfield borough
The poverty data for North Plainfield borough shows that 226 of the married-couple family households (6.1%) and 181 of the single-parent households (9.3%) are living below the poverty level. Within the married-couple family households, those with 5 or more children have the highest poverty rate, with 75 households (74.3%) falling below the poverty line. Among the single-parent households, those with 3 or 4 children have the highest poverty rate, with 43 household (100.0%) living below poverty.
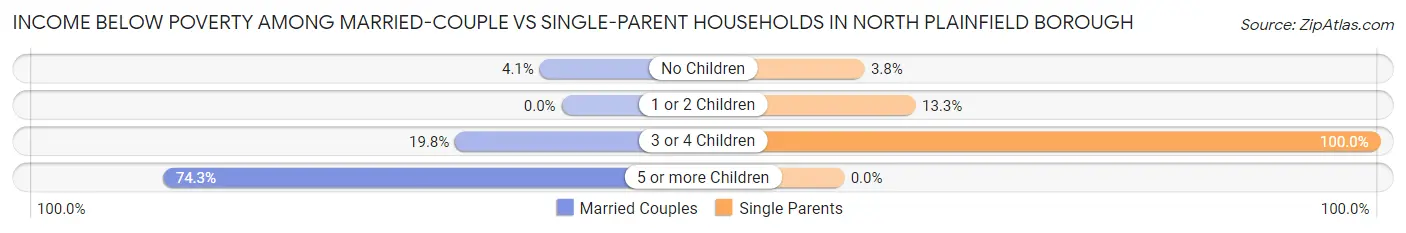
| Children | Married-Couple Families | Single-Parent Households |
| No Children | 87 (4.1%) | 45 (3.8%) |
| 1 or 2 Children | 0 (0.0%) | 93 (13.3%) |
| 3 or 4 Children | 64 (19.8%) | 43 (100.0%) |
| 5 or more Children | 75 (74.3%) | 0 (0.0%) |
| Total | 226 (6.1%) | 181 (9.3%) |
Race in North Plainfield borough
The most populous races in North Plainfield borough are Hispanic or Latino (10,945 | 48.2%), White / Caucasian (7,807 | 34.4%), and Some other Race (5,499 | 24.2%).
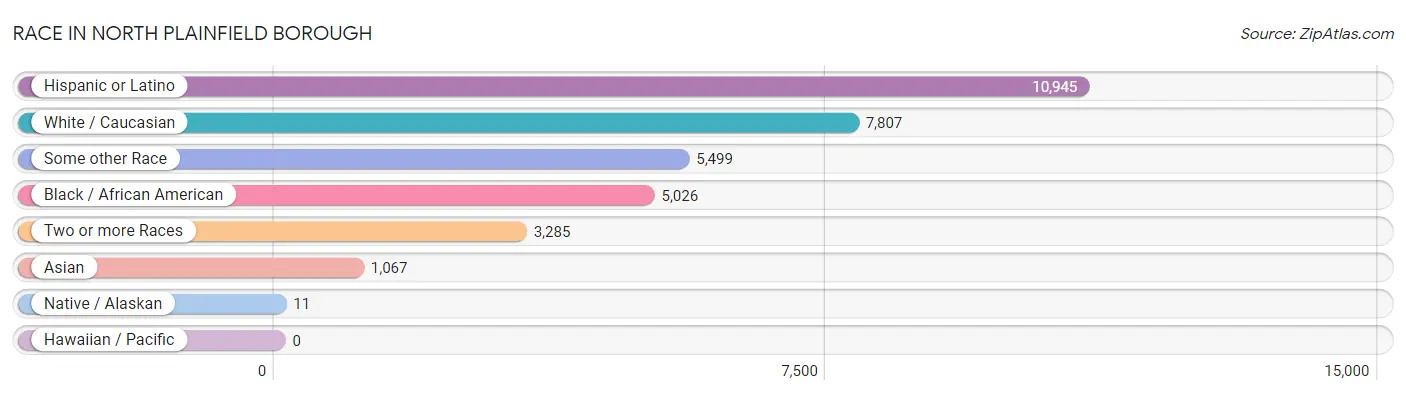
| Race | # Population | % Population |
| Asian | 1,067 | 4.7% |
| Black / African American | 5,026 | 22.2% |
| Hawaiian / Pacific | 0 | 0.0% |
| Hispanic or Latino | 10,945 | 48.2% |
| Native / Alaskan | 11 | 0.1% |
| White / Caucasian | 7,807 | 34.4% |
| Two or more Races | 3,285 | 14.5% |
| Some other Race | 5,499 | 24.2% |
| Total | 22,695 | 100.0% |
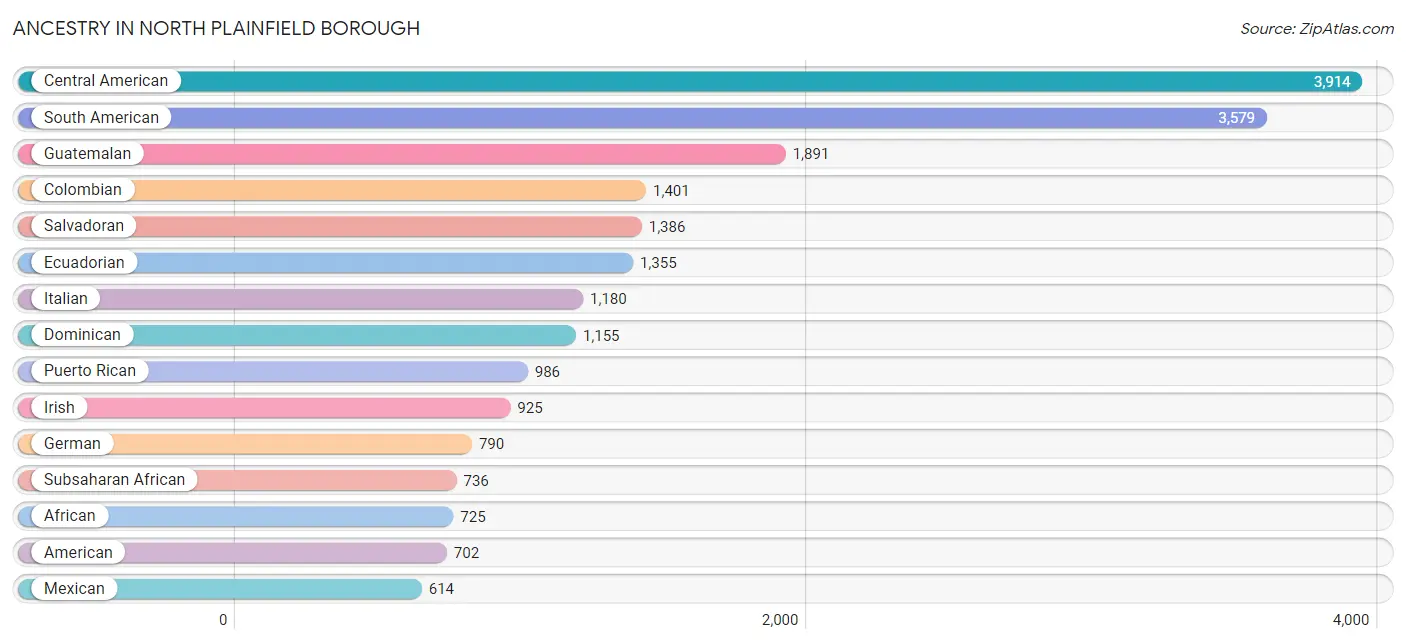
Ancestry in North Plainfield borough
The most populous ancestries reported in North Plainfield borough are Central American (3,914 | 17.2%), South American (3,579 | 15.8%), Guatemalan (1,891 | 8.3%), Colombian (1,401 | 6.2%), and Salvadoran (1,386 | 6.1%), together accounting for 53.6% of all North Plainfield borough residents.
| Ancestry | # Population | % Population |
| African | 725 | 3.2% |
| American | 702 | 3.1% |
| Arab | 257 | 1.1% |
| Argentinean | 47 | 0.2% |
| Armenian | 3 | 0.0% |
| Austrian | 10 | 0.0% |
| Bhutanese | 21 | 0.1% |
| Brazilian | 68 | 0.3% |
| British West Indian | 78 | 0.3% |
| Burmese | 10 | 0.0% |
| Cajun | 10 | 0.0% |
| Canadian | 61 | 0.3% |
| Central American | 3,914 | 17.2% |
| Central American Indian | 284 | 1.3% |
| Chilean | 133 | 0.6% |
| Colombian | 1,401 | 6.2% |
| Costa Rican | 194 | 0.9% |
| Croatian | 7 | 0.0% |
| Cuban | 104 | 0.5% |
| Czech | 94 | 0.4% |
| Czechoslovakian | 21 | 0.1% |
| Danish | 11 | 0.1% |
| Dominican | 1,155 | 5.1% |
| Dutch | 27 | 0.1% |
| Ecuadorian | 1,355 | 6.0% |
| Egyptian | 17 | 0.1% |
| English | 431 | 1.9% |
| French | 118 | 0.5% |
| German | 790 | 3.5% |
| Greek | 10 | 0.0% |
| Guatemalan | 1,891 | 8.3% |
| Guyanese | 137 | 0.6% |
| Haitian | 31 | 0.1% |
| Honduran | 417 | 1.8% |
| Hungarian | 8 | 0.0% |
| Indian (Asian) | 166 | 0.7% |
| Irish | 925 | 4.1% |
| Italian | 1,180 | 5.2% |
| Jamaican | 580 | 2.6% |
| Korean | 164 | 0.7% |
| Laotian | 21 | 0.1% |
| Latvian | 8 | 0.0% |
| Lebanese | 7 | 0.0% |
| Lithuanian | 16 | 0.1% |
| Mexican | 614 | 2.7% |
| Northern European | 9 | 0.0% |
| Norwegian | 39 | 0.2% |
| Palestinian | 233 | 1.0% |
| Panamanian | 26 | 0.1% |
| Peruvian | 512 | 2.3% |
| Polish | 579 | 2.5% |
| Portuguese | 129 | 0.6% |
| Puerto Rican | 986 | 4.3% |
| Russian | 203 | 0.9% |
| Salvadoran | 1,386 | 6.1% |
| Scotch-Irish | 15 | 0.1% |
| Scottish | 195 | 0.9% |
| Slovak | 140 | 0.6% |
| South American | 3,579 | 15.8% |
| South American Indian | 124 | 0.5% |
| Spaniard | 53 | 0.2% |
| Spanish | 219 | 1.0% |
| Spanish American | 2 | 0.0% |
| Sri Lankan | 32 | 0.1% |
| Subsaharan African | 736 | 3.2% |
| Swedish | 52 | 0.2% |
| Swiss | 11 | 0.1% |
| Thai | 217 | 1.0% |
| Trinidadian and Tobagonian | 50 | 0.2% |
| Ukrainian | 48 | 0.2% |
| Uruguayan | 49 | 0.2% |
| Venezuelan | 82 | 0.4% |
| Welsh | 44 | 0.2% |
| West Indian | 45 | 0.2% |
| Yugoslavian | 10 | 0.0% | View All 75 Rows |
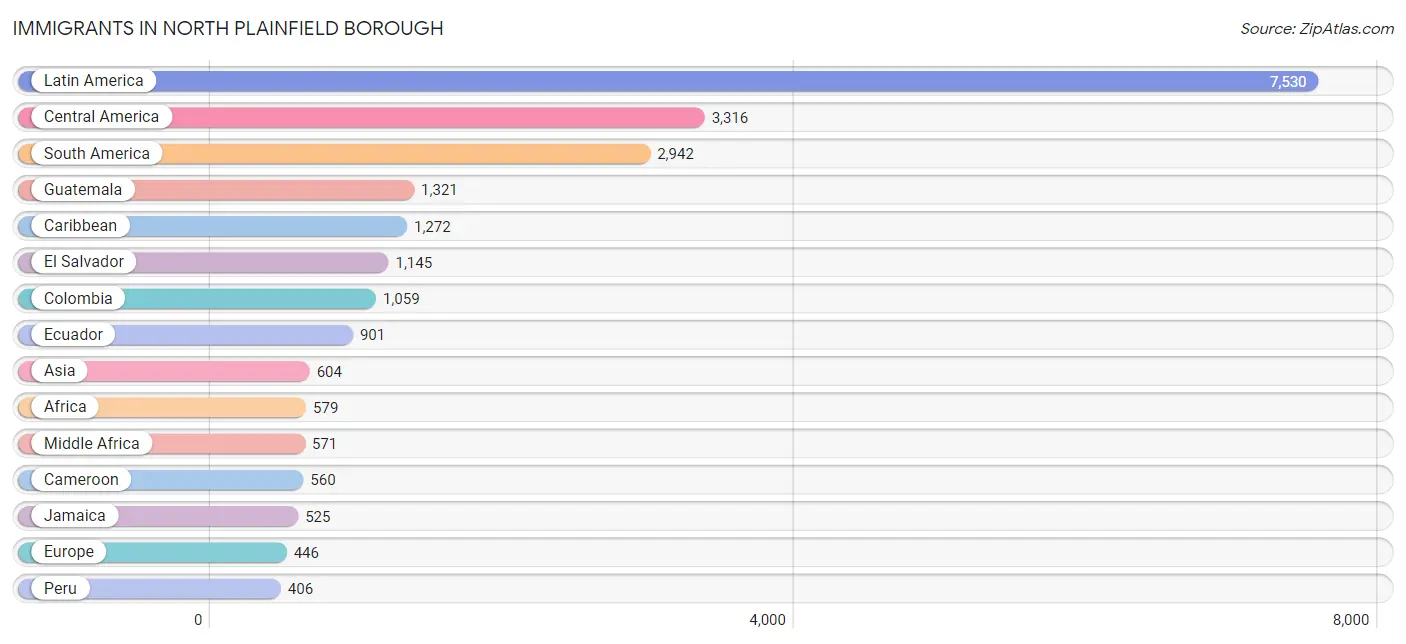
Immigrants in North Plainfield borough
The most numerous immigrant groups reported in North Plainfield borough came from Latin America (7,530 | 33.2%), Central America (3,316 | 14.6%), South America (2,942 | 13.0%), Guatemala (1,321 | 5.8%), and Caribbean (1,272 | 5.6%), together accounting for 72.2% of all North Plainfield borough residents.
| Immigration Origin | # Population | % Population |
| Africa | 579 | 2.5% |
| Argentina | 22 | 0.1% |
| Armenia | 3 | 0.0% |
| Asia | 604 | 2.7% |
| Brazil | 30 | 0.1% |
| Cameroon | 560 | 2.5% |
| Canada | 27 | 0.1% |
| Caribbean | 1,272 | 5.6% |
| Central America | 3,316 | 14.6% |
| Chile | 85 | 0.4% |
| China | 117 | 0.5% |
| Colombia | 1,059 | 4.7% |
| Costa Rica | 224 | 1.0% |
| Cuba | 45 | 0.2% |
| Dominica | 191 | 0.8% |
| Dominican Republic | 373 | 1.6% |
| Eastern Africa | 8 | 0.0% |
| Eastern Asia | 127 | 0.6% |
| Eastern Europe | 70 | 0.3% |
| Ecuador | 901 | 4.0% |
| El Salvador | 1,145 | 5.1% |
| England | 11 | 0.1% |
| Europe | 446 | 2.0% |
| Germany | 11 | 0.1% |
| Guatemala | 1,321 | 5.8% |
| Guyana | 298 | 1.3% |
| Haiti | 26 | 0.1% |
| Honduras | 282 | 1.2% |
| India | 96 | 0.4% |
| Indonesia | 29 | 0.1% |
| Italy | 96 | 0.4% |
| Jamaica | 525 | 2.3% |
| Korea | 10 | 0.0% |
| Kuwait | 22 | 0.1% |
| Latin America | 7,530 | 33.2% |
| Mexico | 318 | 1.4% |
| Middle Africa | 571 | 2.5% |
| Northern Europe | 11 | 0.1% |
| Pakistan | 161 | 0.7% |
| Panama | 26 | 0.1% |
| Peru | 406 | 1.8% |
| Philippines | 126 | 0.6% |
| Poland | 1 | 0.0% |
| Portugal | 39 | 0.2% |
| Russia | 69 | 0.3% |
| South America | 2,942 | 13.0% |
| South Central Asia | 257 | 1.1% |
| South Eastern Asia | 174 | 0.8% |
| Southern Europe | 354 | 1.6% |
| Spain | 219 | 1.0% |
| Taiwan | 16 | 0.1% |
| Trinidad and Tobago | 112 | 0.5% |
| Uruguay | 49 | 0.2% |
| Venezuela | 92 | 0.4% |
| Vietnam | 19 | 0.1% |
| Western Asia | 25 | 0.1% |
| Western Europe | 11 | 0.1% | View All 57 Rows |
Sex and Age in North Plainfield borough
Sex and Age in North Plainfield borough
The most populous age groups in North Plainfield borough are 35 to 39 Years (1,024 | 9.7%) for men and 20 to 24 Years (1,116 | 9.2%) for women.
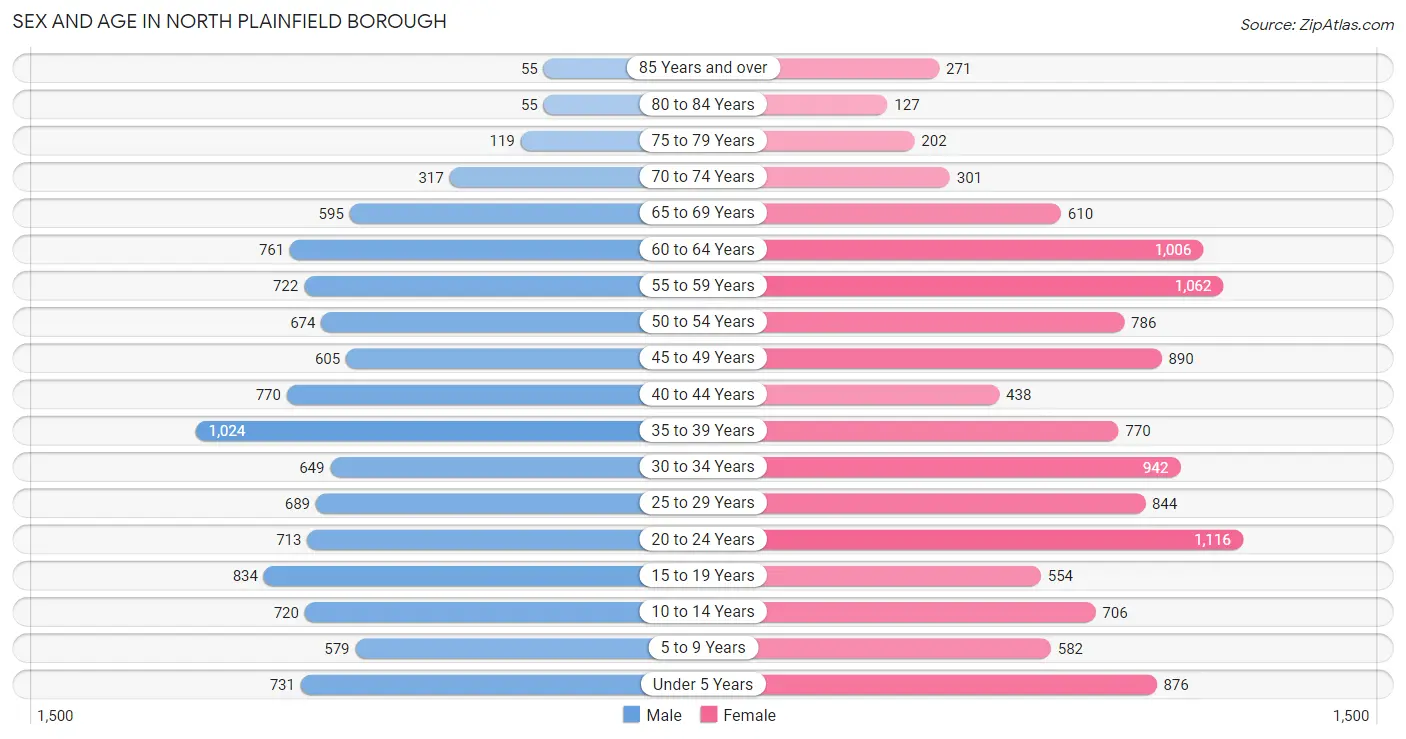
| Age Bracket | Male | Female |
| Under 5 Years | 731 (6.9%) | 876 (7.2%) |
| 5 to 9 Years | 579 (5.5%) | 582 (4.8%) |
| 10 to 14 Years | 720 (6.8%) | 706 (5.8%) |
| 15 to 19 Years | 834 (7.9%) | 554 (4.6%) |
| 20 to 24 Years | 713 (6.7%) | 1,116 (9.2%) |
| 25 to 29 Years | 689 (6.5%) | 844 (7.0%) |
| 30 to 34 Years | 649 (6.1%) | 942 (7.8%) |
| 35 to 39 Years | 1,024 (9.7%) | 770 (6.4%) |
| 40 to 44 Years | 770 (7.3%) | 438 (3.6%) |
| 45 to 49 Years | 605 (5.7%) | 890 (7.4%) |
| 50 to 54 Years | 674 (6.4%) | 786 (6.5%) |
| 55 to 59 Years | 722 (6.8%) | 1,062 (8.8%) |
| 60 to 64 Years | 761 (7.2%) | 1,006 (8.3%) |
| 65 to 69 Years | 595 (5.6%) | 610 (5.1%) |
| 70 to 74 Years | 317 (3.0%) | 301 (2.5%) |
| 75 to 79 Years | 119 (1.1%) | 202 (1.7%) |
| 80 to 84 Years | 55 (0.5%) | 127 (1.1%) |
| 85 Years and over | 55 (0.5%) | 271 (2.2%) |
| Total | 10,612 (100.0%) | 12,083 (100.0%) |
Families and Households in North Plainfield borough
Median Family Size in North Plainfield borough
The median family size in North Plainfield borough is 3.43 persons per family, with married-couple families (3,682 | 65.4%) accounting for the largest median family size of 3.52 persons per family. On the other hand, single female/mother families (1,336 | 23.7%) represent the smallest median family size with 3.24 persons per family.
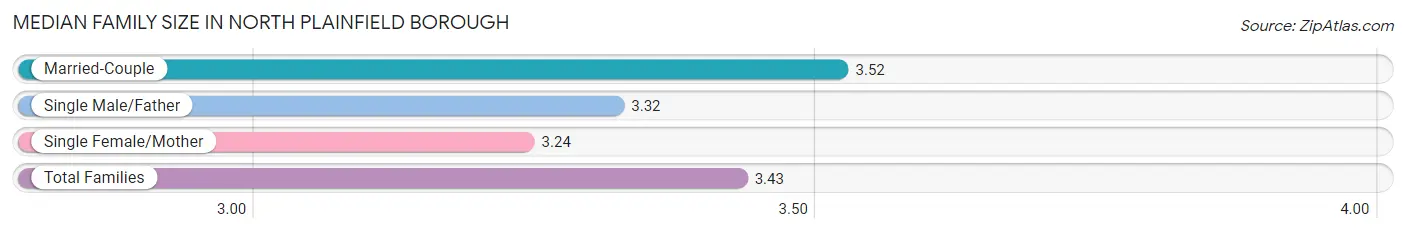
| Family Type | # Families | Family Size |
| Married-Couple | 3,682 (65.4%) | 3.52 |
| Single Male/Father | 614 (10.9%) | 3.32 |
| Single Female/Mother | 1,336 (23.7%) | 3.24 |
| Total Families | 5,632 (100.0%) | 3.43 |
Median Household Size in North Plainfield borough
The median household size in North Plainfield borough is 2.80 persons per household, with single male/father households (614 | 7.6%) accounting for the largest median household size of 3.65 persons per household. non-family households (2,445 | 30.3%) represent the smallest median household size with 1.17 persons per household.
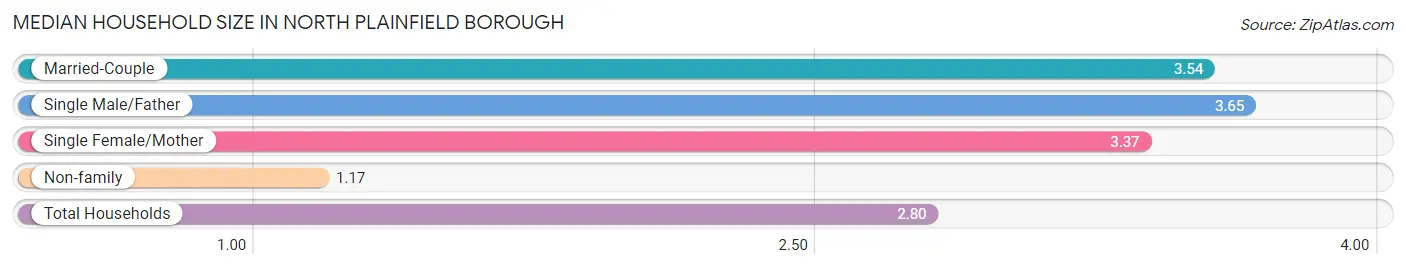
| Household Type | # Households | Household Size |
| Married-Couple | 3,682 (45.6%) | 3.54 |
| Single Male/Father | 614 (7.6%) | 3.65 |
| Single Female/Mother | 1,336 (16.5%) | 3.37 |
| Non-family | 2,445 (30.3%) | 1.17 |
| Total Households | 8,077 (100.0%) | 2.80 |
Household Size by Marriage Status in North Plainfield borough
Out of a total of 8,077 households in North Plainfield borough, 5,632 (69.7%) are family households, while 2,445 (30.3%) are nonfamily households. The most numerous type of family households are 2-person households, comprising 2,071, and the most common type of nonfamily households are 1-person households, comprising 2,118.
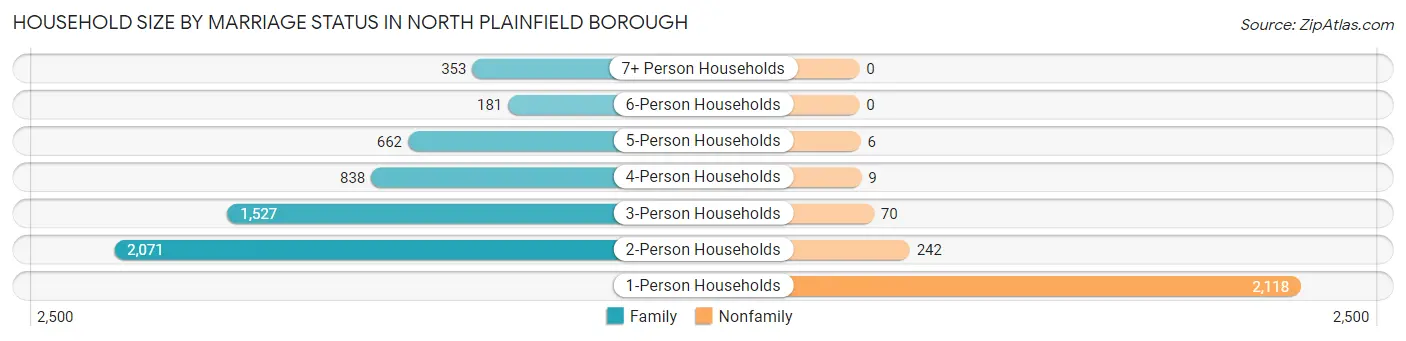
| Household Size | Family Households | Nonfamily Households |
| 1-Person Households | - | 2,118 (26.2%) |
| 2-Person Households | 2,071 (25.6%) | 242 (3.0%) |
| 3-Person Households | 1,527 (18.9%) | 70 (0.9%) |
| 4-Person Households | 838 (10.4%) | 9 (0.1%) |
| 5-Person Households | 662 (8.2%) | 6 (0.1%) |
| 6-Person Households | 181 (2.2%) | 0 (0.0%) |
| 7+ Person Households | 353 (4.4%) | 0 (0.0%) |
| Total | 5,632 (69.7%) | 2,445 (30.3%) |
Female Fertility in North Plainfield borough
Fertility by Age in North Plainfield borough
Average fertility rate in North Plainfield borough is 60.0 births per 1,000 women. Women in the age bracket of 20 to 34 years have the highest fertility rate with 103.0 births per 1,000 women. Women in the age bracket of 20 to 34 years acount for 86.7% of all women with births.
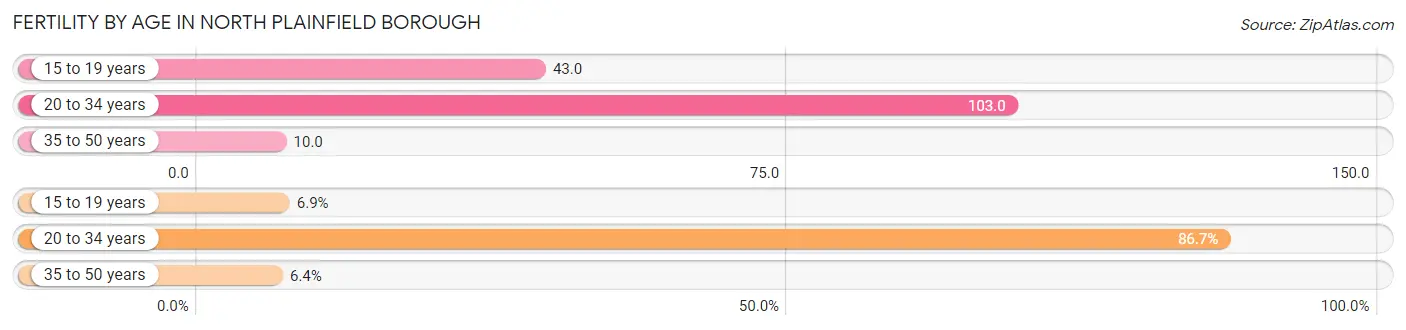
| Age Bracket | Women with Births | Births / 1,000 Women |
| 15 to 19 years | 24 (6.9%) | 43.0 |
| 20 to 34 years | 300 (86.7%) | 103.0 |
| 35 to 50 years | 22 (6.4%) | 10.0 |
| Total | 346 (100.0%) | 60.0 |
Fertility by Age by Marriage Status in North Plainfield borough
69.4% of women with births (346) in North Plainfield borough are married. The highest percentage of unmarried women with births falls into 15 to 19 years age bracket with 100.0% of them unmarried at the time of birth, while the lowest percentage of unmarried women with births belong to 35 to 50 years age bracket with 4.5% of them unmarried.
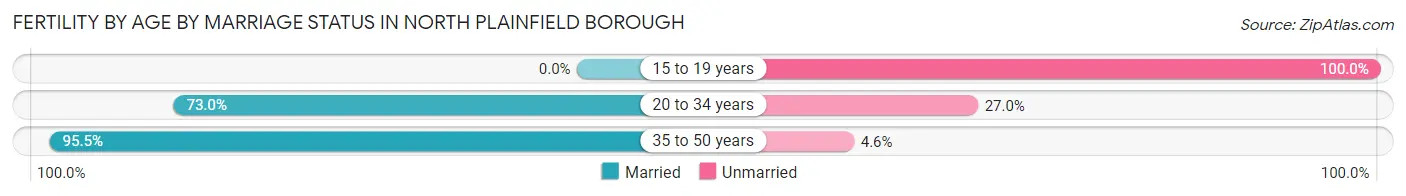
| Age Bracket | Married | Unmarried |
| 15 to 19 years | 0 (0.0%) | 24 (100.0%) |
| 20 to 34 years | 219 (73.0%) | 81 (27.0%) |
| 35 to 50 years | 21 (95.5%) | 1 (4.5%) |
| Total | 240 (69.4%) | 106 (30.6%) |
Fertility by Education in North Plainfield borough
Average fertility rate in North Plainfield borough is 60.0 births per 1,000 women. Women with the education attainment of high school diploma have the highest fertility rate of 133.0 births per 1,000 women, while women with the education attainment of less than high school have the lowest fertility at 24.0 births per 1,000 women. Women with the education attainment of high school diploma represent 46.0% of all women with births.
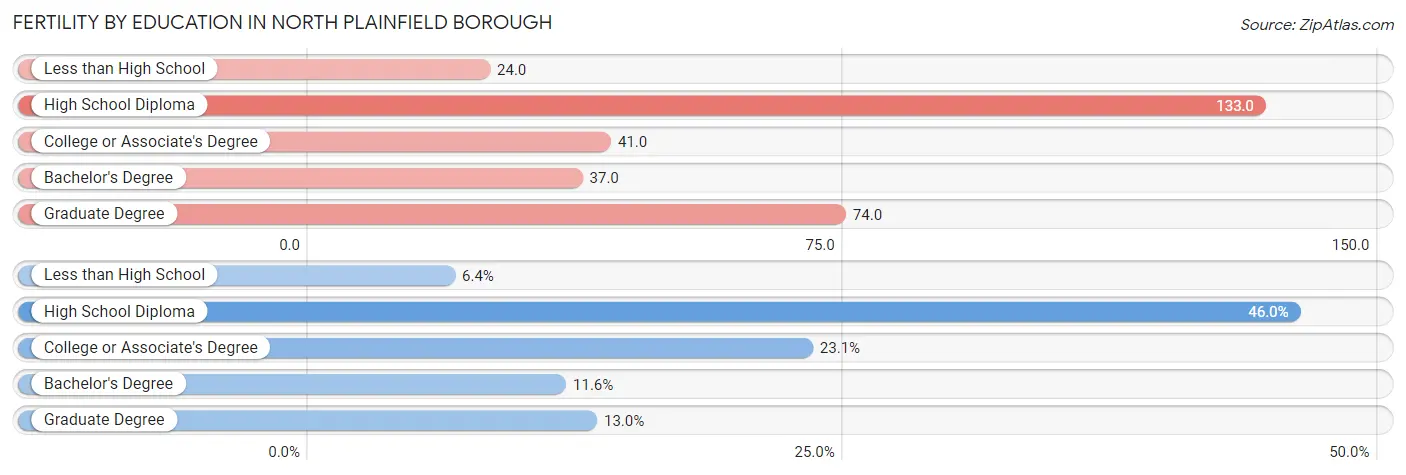
| Educational Attainment | Women with Births | Births / 1,000 Women |
| Less than High School | 22 (6.4%) | 24.0 |
| High School Diploma | 159 (46.0%) | 133.0 |
| College or Associate's Degree | 80 (23.1%) | 41.0 |
| Bachelor's Degree | 40 (11.6%) | 37.0 |
| Graduate Degree | 45 (13.0%) | 74.0 |
| Total | 346 (100.0%) | 60.0 |
Fertility by Education by Marriage Status in North Plainfield borough
30.6% of women with births in North Plainfield borough are unmarried. Women with the educational attainment of less than high school are most likely to be married with 100.0% of them married at childbirth, while women with the educational attainment of high school diploma are least likely to be married with 55.3% of them unmarried at childbirth.
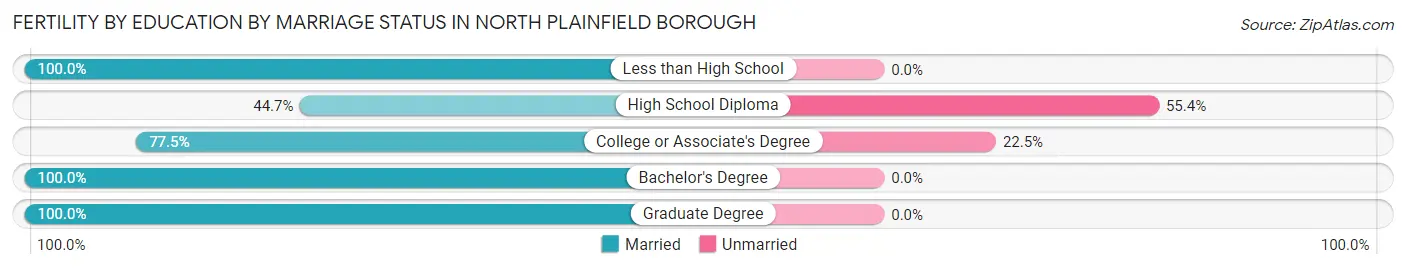
| Educational Attainment | Married | Unmarried |
| Less than High School | 22 (100.0%) | 0 (0.0%) |
| High School Diploma | 71 (44.7%) | 88 (55.3%) |
| College or Associate's Degree | 62 (77.5%) | 18 (22.5%) |
| Bachelor's Degree | 40 (100.0%) | 0 (0.0%) |
| Graduate Degree | 45 (100.0%) | 0 (0.0%) |
| Total | 240 (69.4%) | 106 (30.6%) |
Employment Characteristics in North Plainfield borough
Employment by Class of Employer in North Plainfield borough
Among the 11,901 employed individuals in North Plainfield borough, private company employees (8,764 | 73.6%), not-for-profit organizations (808 | 6.8%), and local government employees (758 | 6.4%) make up the most common classes of employment.
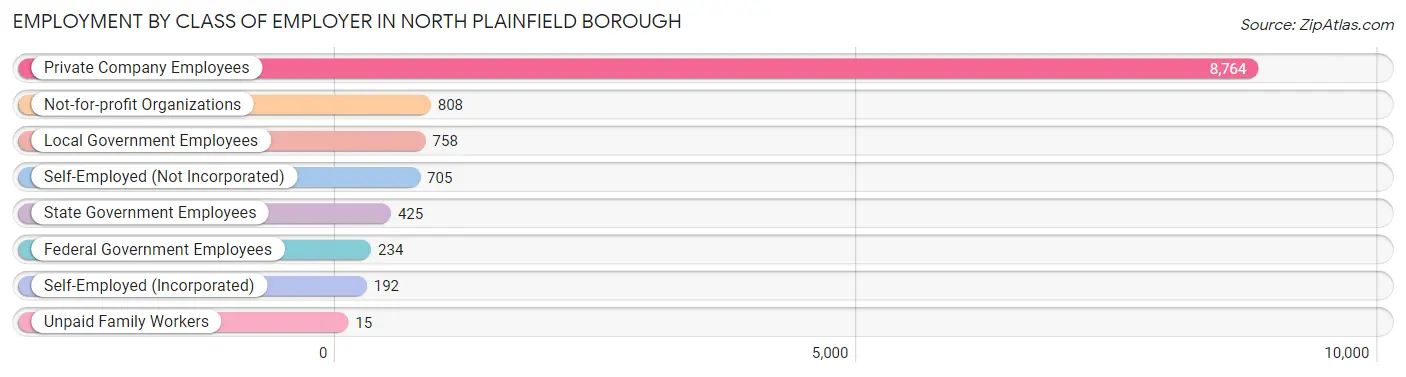
| Employer Class | # Employees | % Employees |
| Private Company Employees | 8,764 | 73.6% |
| Self-Employed (Incorporated) | 192 | 1.6% |
| Self-Employed (Not Incorporated) | 705 | 5.9% |
| Not-for-profit Organizations | 808 | 6.8% |
| Local Government Employees | 758 | 6.4% |
| State Government Employees | 425 | 3.6% |
| Federal Government Employees | 234 | 2.0% |
| Unpaid Family Workers | 15 | 0.1% |
| Total | 11,901 | 100.0% |
Employment Status by Age in North Plainfield borough
According to the labor force statistics for North Plainfield borough, out of the total population over 16 years of age (18,307), 73.0% or 13,364 individuals are in the labor force, with 9.6% or 1,283 of them unemployed. The age group with the highest labor force participation rate is 35 to 44 years, with 87.4% or 2,624 individuals in the labor force. Within the labor force, the 25 to 29 years age range has the highest percentage of unemployed individuals, with 29.2% or 389 of them being unemployed.
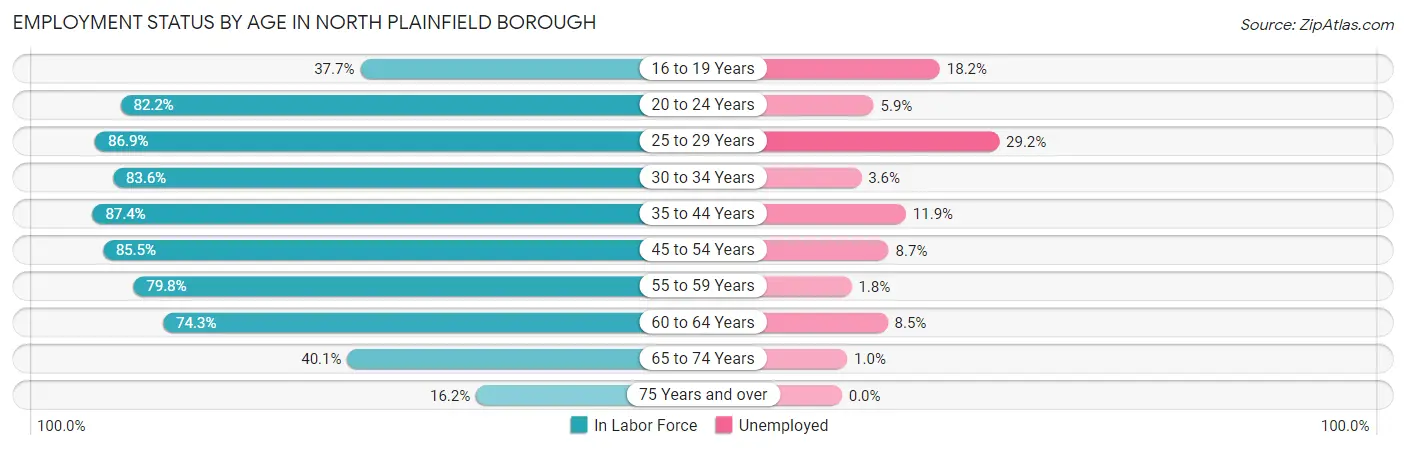
| Age Bracket | In Labor Force | Unemployed |
| 16 to 19 Years | 450 (37.7%) | 82 (18.2%) |
| 20 to 24 Years | 1,503 (82.2%) | 89 (5.9%) |
| 25 to 29 Years | 1,332 (86.9%) | 389 (29.2%) |
| 30 to 34 Years | 1,330 (83.6%) | 48 (3.6%) |
| 35 to 44 Years | 2,624 (87.4%) | 312 (11.9%) |
| 45 to 54 Years | 2,527 (85.5%) | 220 (8.7%) |
| 55 to 59 Years | 1,424 (79.8%) | 26 (1.8%) |
| 60 to 64 Years | 1,313 (74.3%) | 112 (8.5%) |
| 65 to 74 Years | 731 (40.1%) | 7 (1.0%) |
| 75 Years and over | 134 (16.2%) | 0 (0.0%) |
| Total | 13,364 (73.0%) | 1,283 (9.6%) |
Employment Status by Educational Attainment in North Plainfield borough
According to labor force statistics for North Plainfield borough, 83.5% of individuals (10,548) out of the total population between 25 and 64 years of age (12,632) are in the labor force, with 10.5% or 1,108 of them being unemployed. The group with the highest labor force participation rate are those with the educational attainment of bachelor's degree or higher, with 90.7% or 3,433 individuals in the labor force. Within the labor force, individuals with college / associate degree education have the highest percentage of unemployment, with 13.8% or 476 of them being unemployed.
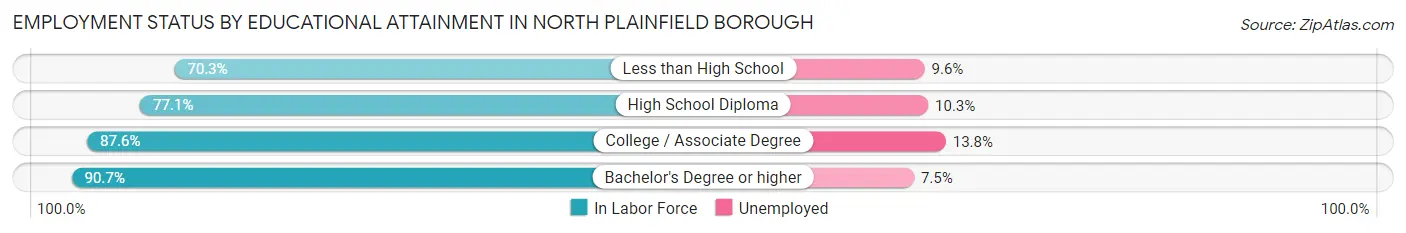
| Educational Attainment | In Labor Force | Unemployed |
| Less than High School | 1,214 (70.3%) | 166 (9.6%) |
| High School Diploma | 2,455 (77.1%) | 328 (10.3%) |
| College / Associate Degree | 3,448 (87.6%) | 543 (13.8%) |
| Bachelor's Degree or higher | 3,433 (90.7%) | 284 (7.5%) |
| Total | 10,548 (83.5%) | 1,326 (10.5%) |
Employment Occupations by Sex in North Plainfield borough
Management, Business, Science and Arts Occupations
The most common Management, Business, Science and Arts occupations in North Plainfield borough are Community & Social Service (1,213 | 10.0%), Management (984 | 8.1%), Education Instruction & Library (761 | 6.3%), Business & Financial (678 | 5.6%), and Computers, Engineering & Science (636 | 5.3%).
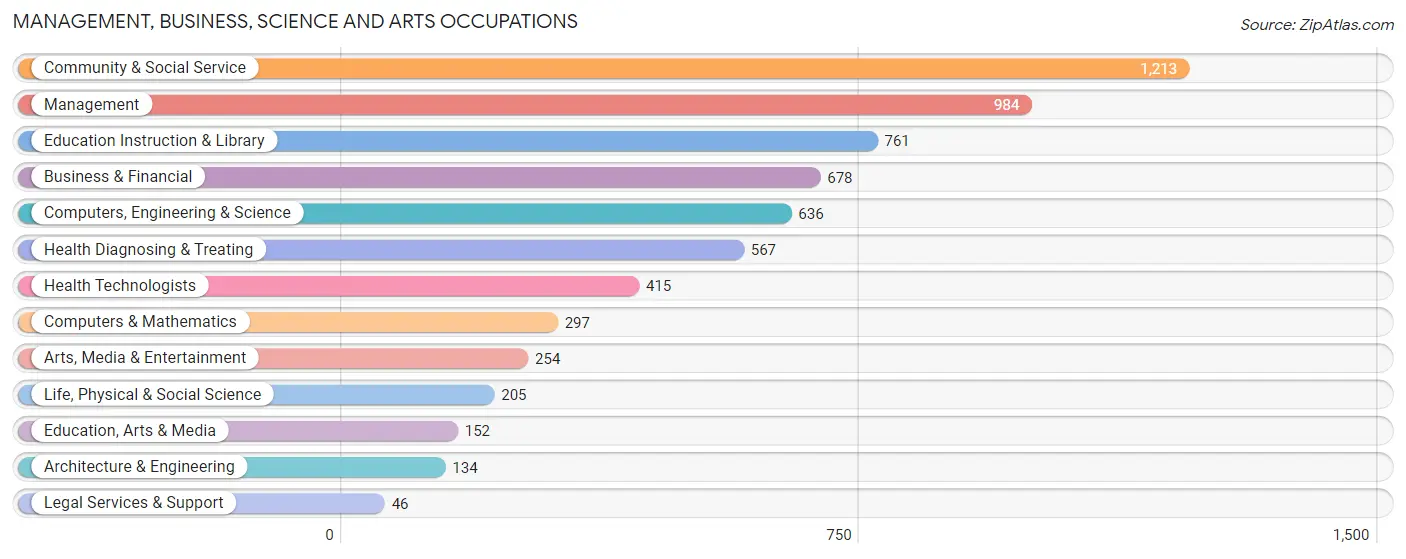
Management, Business, Science and Arts Occupations by Sex
Within the Management, Business, Science and Arts occupations in North Plainfield borough, the most male-oriented occupations are Architecture & Engineering (75.4%), Computers & Mathematics (70.4%), and Business & Financial (64.6%), while the most female-oriented occupations are Health Technologists (100.0%), Education, Arts & Media (92.1%), and Health Diagnosing & Treating (78.7%).
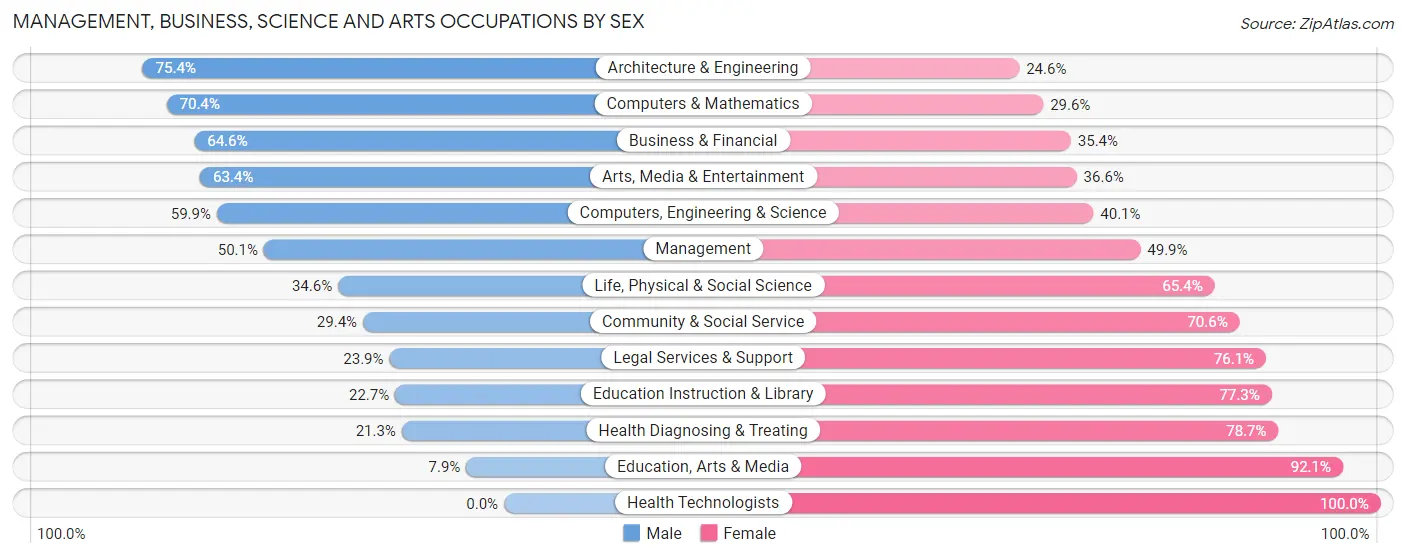
| Occupation | Male | Female |
| Management | 493 (50.1%) | 491 (49.9%) |
| Business & Financial | 438 (64.6%) | 240 (35.4%) |
| Computers, Engineering & Science | 381 (59.9%) | 255 (40.1%) |
| Computers & Mathematics | 209 (70.4%) | 88 (29.6%) |
| Architecture & Engineering | 101 (75.4%) | 33 (24.6%) |
| Life, Physical & Social Science | 71 (34.6%) | 134 (65.4%) |
| Community & Social Service | 357 (29.4%) | 856 (70.6%) |
| Education, Arts & Media | 12 (7.9%) | 140 (92.1%) |
| Legal Services & Support | 11 (23.9%) | 35 (76.1%) |
| Education Instruction & Library | 173 (22.7%) | 588 (77.3%) |
| Arts, Media & Entertainment | 161 (63.4%) | 93 (36.6%) |
| Health Diagnosing & Treating | 121 (21.3%) | 446 (78.7%) |
| Health Technologists | 0 (0.0%) | 415 (100.0%) |
| Total (Category) | 1,790 (43.9%) | 2,288 (56.1%) |
| Total (Overall) | 6,250 (51.7%) | 5,832 (48.3%) |
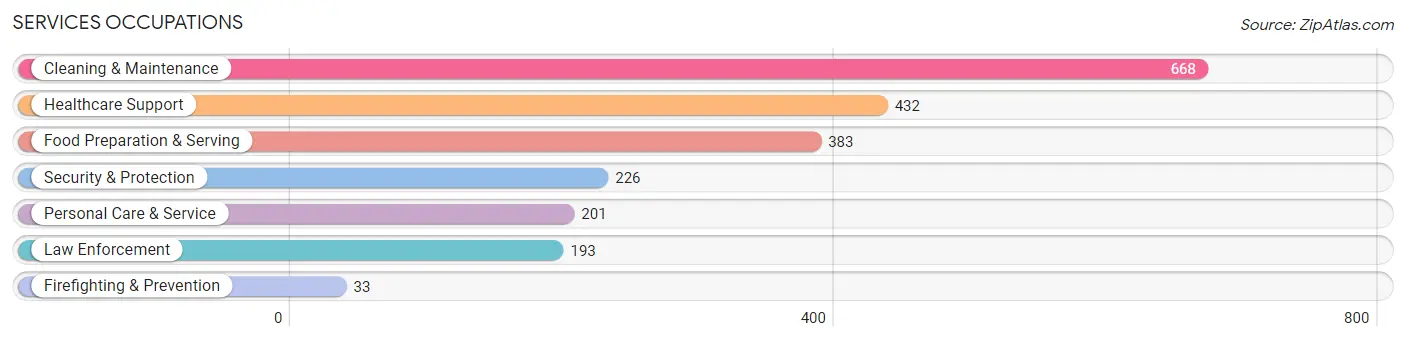
Services Occupations
The most common Services occupations in North Plainfield borough are Cleaning & Maintenance (668 | 5.5%), Healthcare Support (432 | 3.6%), Food Preparation & Serving (383 | 3.2%), Security & Protection (226 | 1.9%), and Personal Care & Service (201 | 1.7%).
Services Occupations by Sex
Within the Services occupations in North Plainfield borough, the most male-oriented occupations are Firefighting & Prevention (100.0%), Cleaning & Maintenance (64.4%), and Security & Protection (53.5%), while the most female-oriented occupations are Healthcare Support (100.0%), Personal Care & Service (94.5%), and Food Preparation & Serving (60.6%).
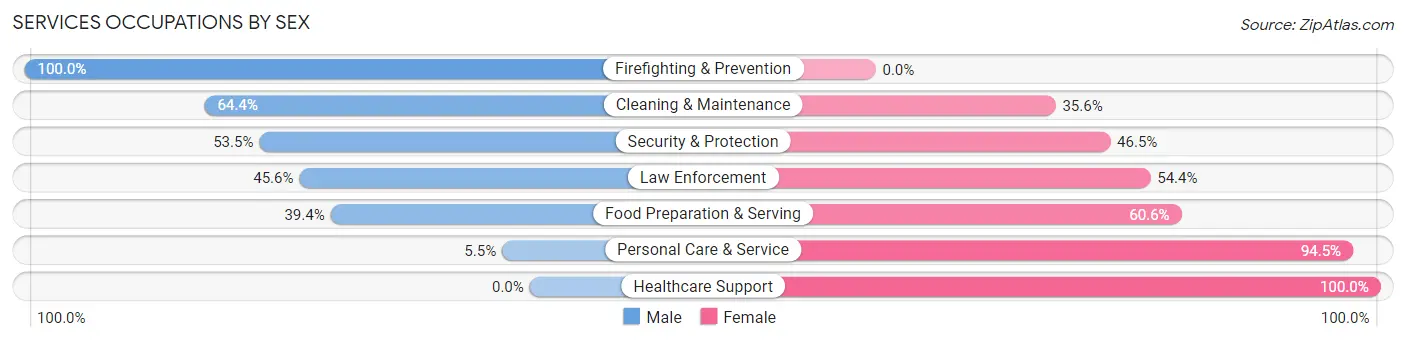
| Occupation | Male | Female |
| Healthcare Support | 0 (0.0%) | 432 (100.0%) |
| Security & Protection | 121 (53.5%) | 105 (46.5%) |
| Firefighting & Prevention | 33 (100.0%) | 0 (0.0%) |
| Law Enforcement | 88 (45.6%) | 105 (54.4%) |
| Food Preparation & Serving | 151 (39.4%) | 232 (60.6%) |
| Cleaning & Maintenance | 430 (64.4%) | 238 (35.6%) |
| Personal Care & Service | 11 (5.5%) | 190 (94.5%) |
| Total (Category) | 713 (37.3%) | 1,197 (62.7%) |
| Total (Overall) | 6,250 (51.7%) | 5,832 (48.3%) |
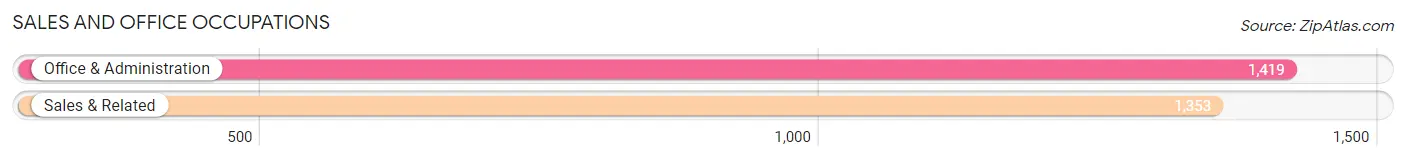
Sales and Office Occupations
The most common Sales and Office occupations in North Plainfield borough are Office & Administration (1,419 | 11.7%), and Sales & Related (1,353 | 11.2%).
Sales and Office Occupations by Sex
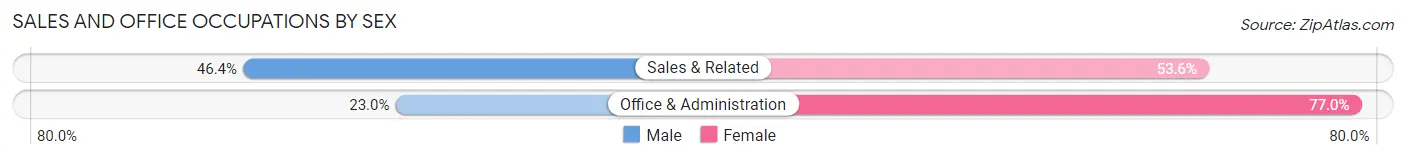
| Occupation | Male | Female |
| Sales & Related | 628 (46.4%) | 725 (53.6%) |
| Office & Administration | 326 (23.0%) | 1,093 (77.0%) |
| Total (Category) | 954 (34.4%) | 1,818 (65.6%) |
| Total (Overall) | 6,250 (51.7%) | 5,832 (48.3%) |
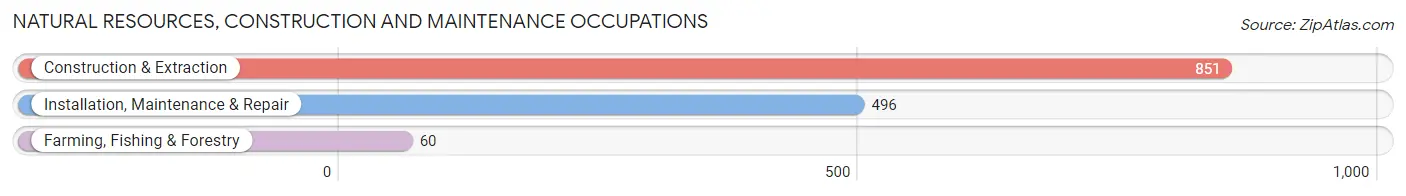
Natural Resources, Construction and Maintenance Occupations
The most common Natural Resources, Construction and Maintenance occupations in North Plainfield borough are Construction & Extraction (851 | 7.0%), Installation, Maintenance & Repair (496 | 4.1%), and Farming, Fishing & Forestry (60 | 0.5%).
Natural Resources, Construction and Maintenance Occupations by Sex
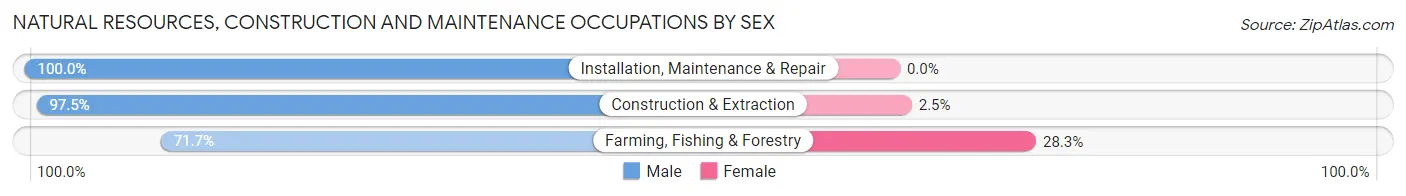
| Occupation | Male | Female |
| Farming, Fishing & Forestry | 43 (71.7%) | 17 (28.3%) |
| Construction & Extraction | 830 (97.5%) | 21 (2.5%) |
| Installation, Maintenance & Repair | 496 (100.0%) | 0 (0.0%) |
| Total (Category) | 1,369 (97.3%) | 38 (2.7%) |
| Total (Overall) | 6,250 (51.7%) | 5,832 (48.3%) |
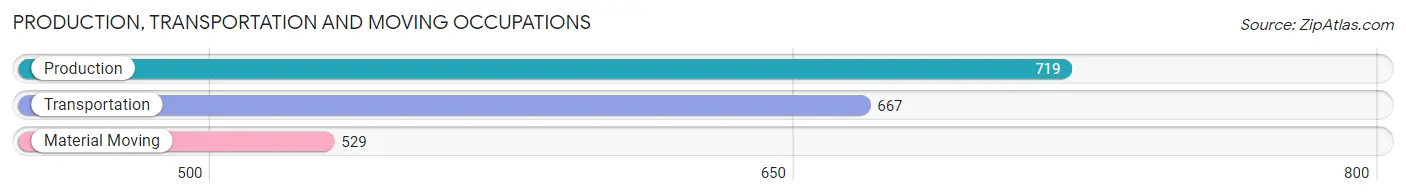
Production, Transportation and Moving Occupations
The most common Production, Transportation and Moving occupations in North Plainfield borough are Production (719 | 5.9%), Transportation (667 | 5.5%), and Material Moving (529 | 4.4%).
Production, Transportation and Moving Occupations by Sex
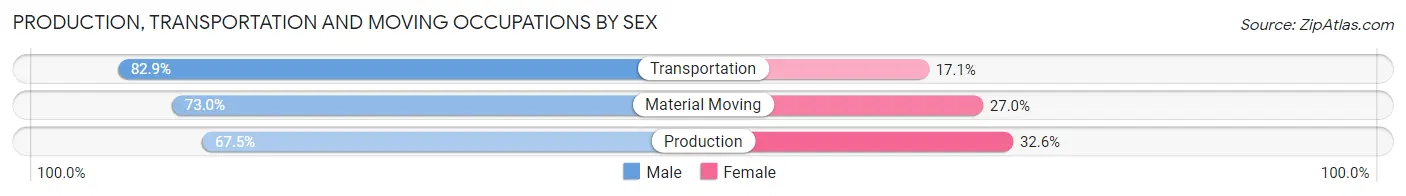
| Occupation | Male | Female |
| Production | 485 (67.4%) | 234 (32.6%) |
| Transportation | 553 (82.9%) | 114 (17.1%) |
| Material Moving | 386 (73.0%) | 143 (27.0%) |
| Total (Category) | 1,424 (74.4%) | 491 (25.6%) |
| Total (Overall) | 6,250 (51.7%) | 5,832 (48.3%) |
Employment Industries by Sex in North Plainfield borough
Employment Industries in North Plainfield borough
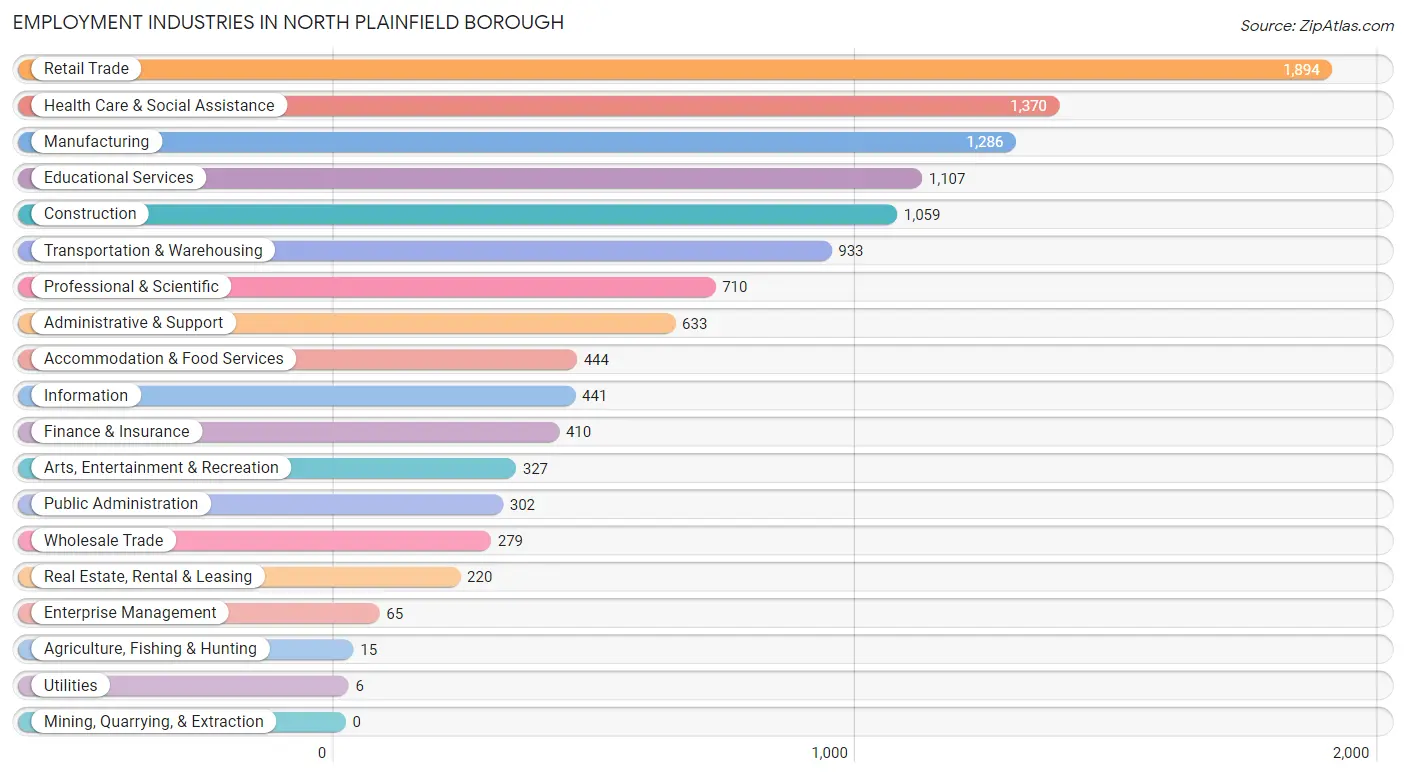
The major employment industries in North Plainfield borough include Retail Trade (1,894 | 15.7%), Health Care & Social Assistance (1,370 | 11.3%), Manufacturing (1,286 | 10.6%), Educational Services (1,107 | 9.2%), and Construction (1,059 | 8.8%).
Employment Industries by Sex in North Plainfield borough
The North Plainfield borough industries that see more men than women are Agriculture, Fishing & Hunting (100.0%), Utilities (100.0%), and Construction (94.3%), whereas the industries that tend to have a higher number of women are Health Care & Social Assistance (90.2%), Finance & Insurance (71.2%), and Educational Services (62.8%).
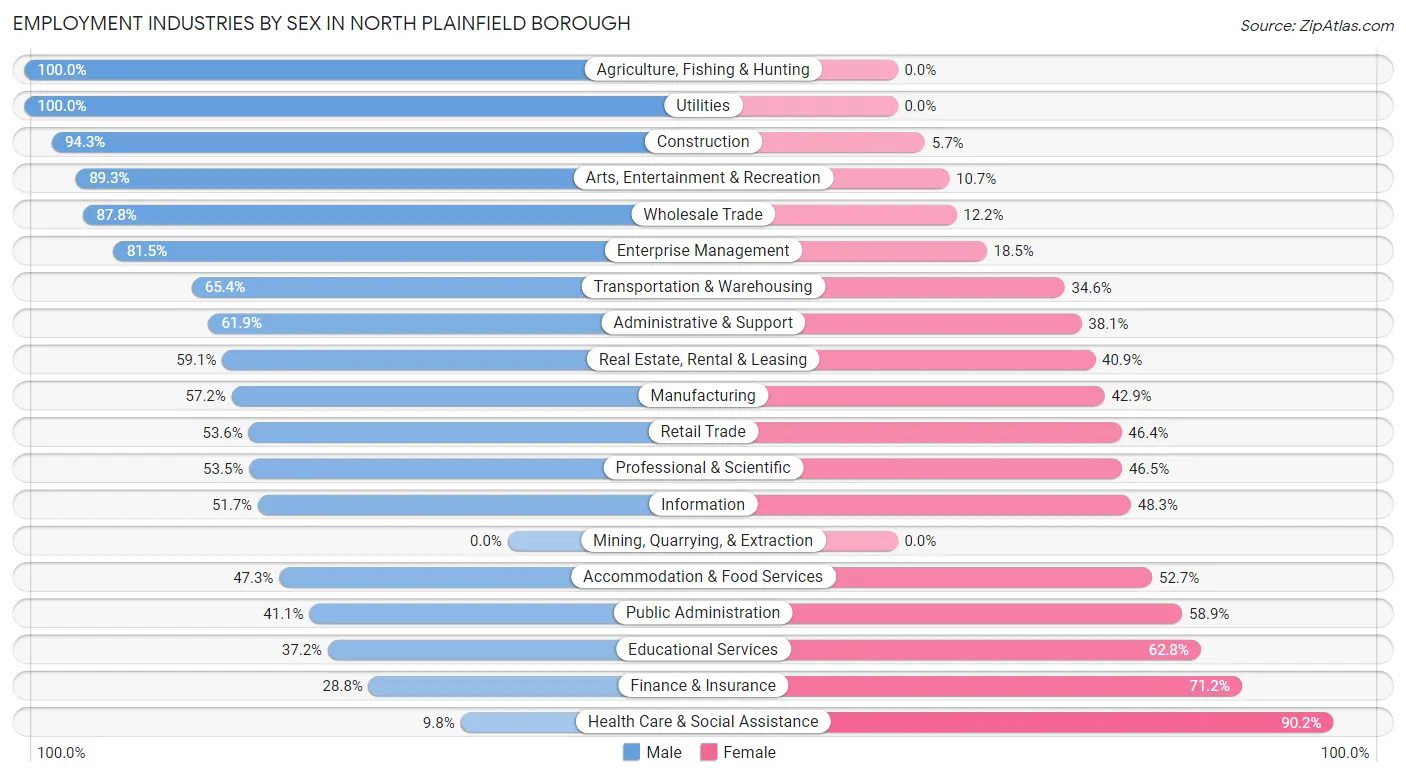
| Industry | Male | Female |
| Agriculture, Fishing & Hunting | 15 (100.0%) | 0 (0.0%) |
| Mining, Quarrying, & Extraction | 0 (0.0%) | 0 (0.0%) |
| Construction | 999 (94.3%) | 60 (5.7%) |
| Manufacturing | 735 (57.2%) | 551 (42.8%) |
| Wholesale Trade | 245 (87.8%) | 34 (12.2%) |
| Retail Trade | 1,016 (53.6%) | 878 (46.4%) |
| Transportation & Warehousing | 610 (65.4%) | 323 (34.6%) |
| Utilities | 6 (100.0%) | 0 (0.0%) |
| Information | 228 (51.7%) | 213 (48.3%) |
| Finance & Insurance | 118 (28.8%) | 292 (71.2%) |
| Real Estate, Rental & Leasing | 130 (59.1%) | 90 (40.9%) |
| Professional & Scientific | 380 (53.5%) | 330 (46.5%) |
| Enterprise Management | 53 (81.5%) | 12 (18.5%) |
| Administrative & Support | 392 (61.9%) | 241 (38.1%) |
| Educational Services | 412 (37.2%) | 695 (62.8%) |
| Health Care & Social Assistance | 134 (9.8%) | 1,236 (90.2%) |
| Arts, Entertainment & Recreation | 292 (89.3%) | 35 (10.7%) |
| Accommodation & Food Services | 210 (47.3%) | 234 (52.7%) |
| Public Administration | 124 (41.1%) | 178 (58.9%) |
| Total | 6,250 (51.7%) | 5,832 (48.3%) |
Education in North Plainfield borough
School Enrollment in North Plainfield borough
The most common levels of schooling among the 5,361 students in North Plainfield borough are college / undergraduate (1,585 | 29.6%), middle school (1,231 | 23.0%), and high school (1,148 | 21.4%).
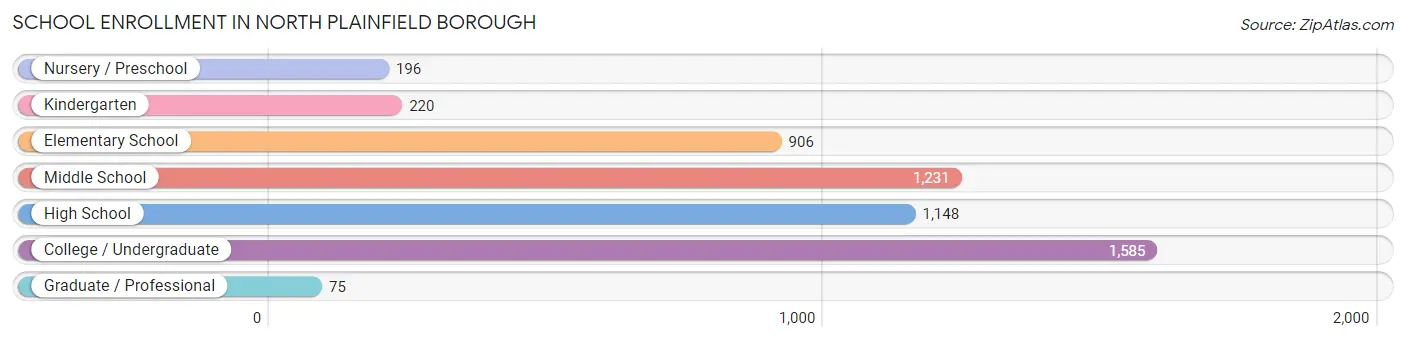
| School Level | # Students | % Students |
| Nursery / Preschool | 196 | 3.7% |
| Kindergarten | 220 | 4.1% |
| Elementary School | 906 | 16.9% |
| Middle School | 1,231 | 23.0% |
| High School | 1,148 | 21.4% |
| College / Undergraduate | 1,585 | 29.6% |
| Graduate / Professional | 75 | 1.4% |
| Total | 5,361 | 100.0% |
School Enrollment by Age by Funding Source in North Plainfield borough
Out of a total of 5,361 students who are enrolled in schools in North Plainfield borough, 970 (18.1%) attend a private institution, while the remaining 4,391 (81.9%) are enrolled in public schools. The age group of 25 to 34 year olds has the highest likelihood of being enrolled in private schools, with 219 (45.7% in the age bracket) enrolled. Conversely, the age group of 15 to 17 year olds has the lowest likelihood of being enrolled in a private school, with 690 (89.8% in the age bracket) attending a public institution.
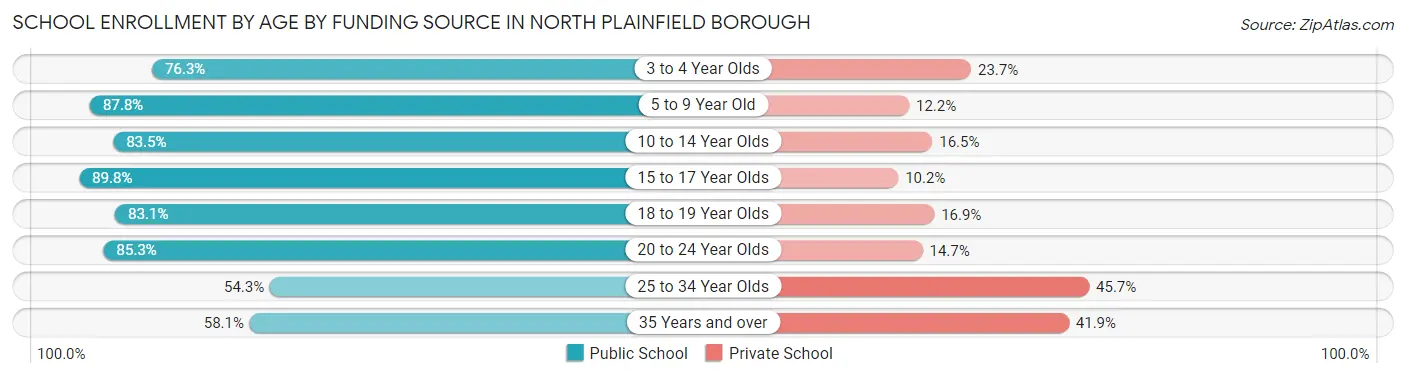
| Age Bracket | Public School | Private School |
| 3 to 4 Year Olds | 135 (76.3%) | 42 (23.7%) |
| 5 to 9 Year Old | 989 (87.8%) | 137 (12.2%) |
| 10 to 14 Year Olds | 1,178 (83.5%) | 233 (16.5%) |
| 15 to 17 Year Olds | 690 (89.8%) | 78 (10.2%) |
| 18 to 19 Year Olds | 217 (83.1%) | 44 (16.9%) |
| 20 to 24 Year Olds | 813 (85.3%) | 140 (14.7%) |
| 25 to 34 Year Olds | 260 (54.3%) | 219 (45.7%) |
| 35 Years and over | 108 (58.1%) | 78 (41.9%) |
| Total | 4,391 (81.9%) | 970 (18.1%) |
Educational Attainment by Field of Study in North Plainfield borough
Business (933 | 19.5%), psychology (491 | 10.2%), education (488 | 10.2%), engineering (389 | 8.1%), and computers & mathematics (367 | 7.6%) are the most common fields of study among 4,798 individuals in North Plainfield borough who have obtained a bachelor's degree or higher.
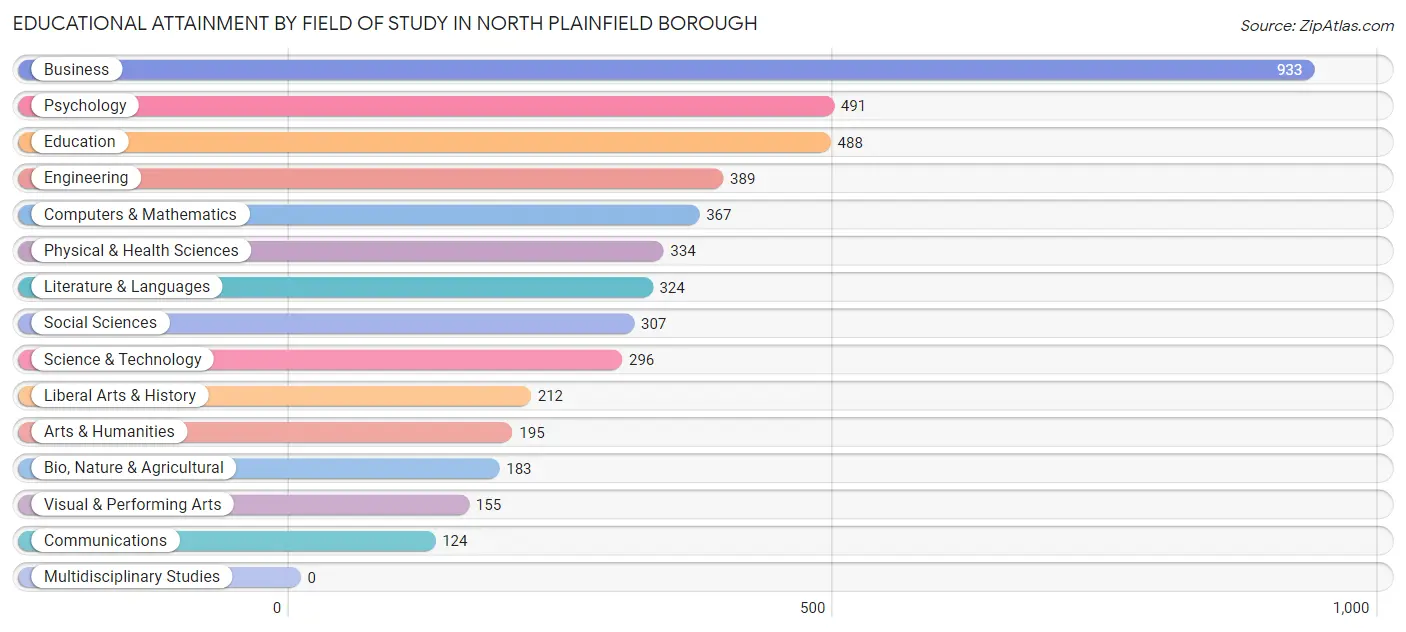
| Field of Study | # Graduates | % Graduates |
| Computers & Mathematics | 367 | 7.6% |
| Bio, Nature & Agricultural | 183 | 3.8% |
| Physical & Health Sciences | 334 | 7.0% |
| Psychology | 491 | 10.2% |
| Social Sciences | 307 | 6.4% |
| Engineering | 389 | 8.1% |
| Multidisciplinary Studies | 0 | 0.0% |
| Science & Technology | 296 | 6.2% |
| Business | 933 | 19.5% |
| Education | 488 | 10.2% |
| Literature & Languages | 324 | 6.8% |
| Liberal Arts & History | 212 | 4.4% |
| Visual & Performing Arts | 155 | 3.2% |
| Communications | 124 | 2.6% |
| Arts & Humanities | 195 | 4.1% |
| Total | 4,798 | 100.0% |
Transportation & Commute in North Plainfield borough
Vehicle Availability by Sex in North Plainfield borough
The most prevalent vehicle ownership categories in North Plainfield borough are males with 2 vehicles (2,541, accounting for 40.9%) and females with 2 vehicles (2,267, making up 44.7%).
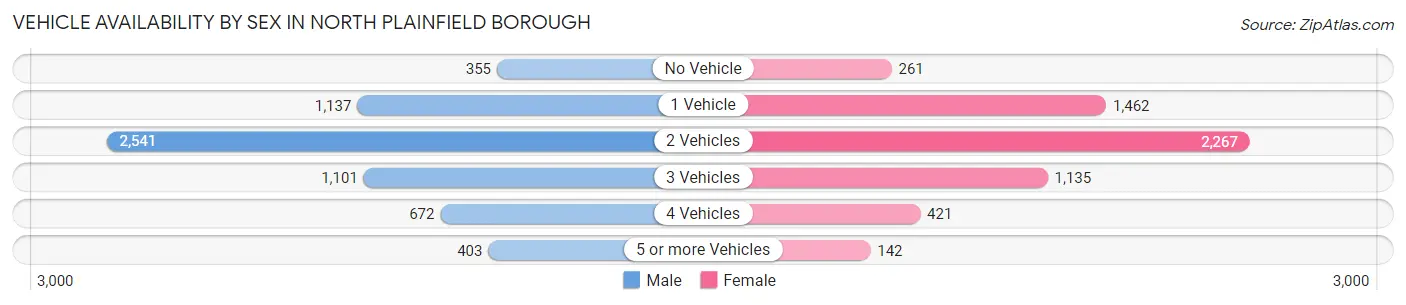
| Vehicles Available | Male | Female |
| No Vehicle | 355 (5.7%) | 261 (4.6%) |
| 1 Vehicle | 1,137 (18.3%) | 1,462 (25.7%) |
| 2 Vehicles | 2,541 (40.9%) | 2,267 (39.9%) |
| 3 Vehicles | 1,101 (17.7%) | 1,135 (20.0%) |
| 4 Vehicles | 672 (10.8%) | 421 (7.4%) |
| 5 or more Vehicles | 403 (6.5%) | 142 (2.5%) |
| Total | 6,209 (100.0%) | 5,688 (100.0%) |
Commute Time in North Plainfield borough
The most frequently occuring commute durations in North Plainfield borough are 30 to 34 minutes (2,005 commuters, 18.2%), 20 to 24 minutes (1,468 commuters, 13.3%), and 15 to 19 minutes (1,327 commuters, 12.0%).
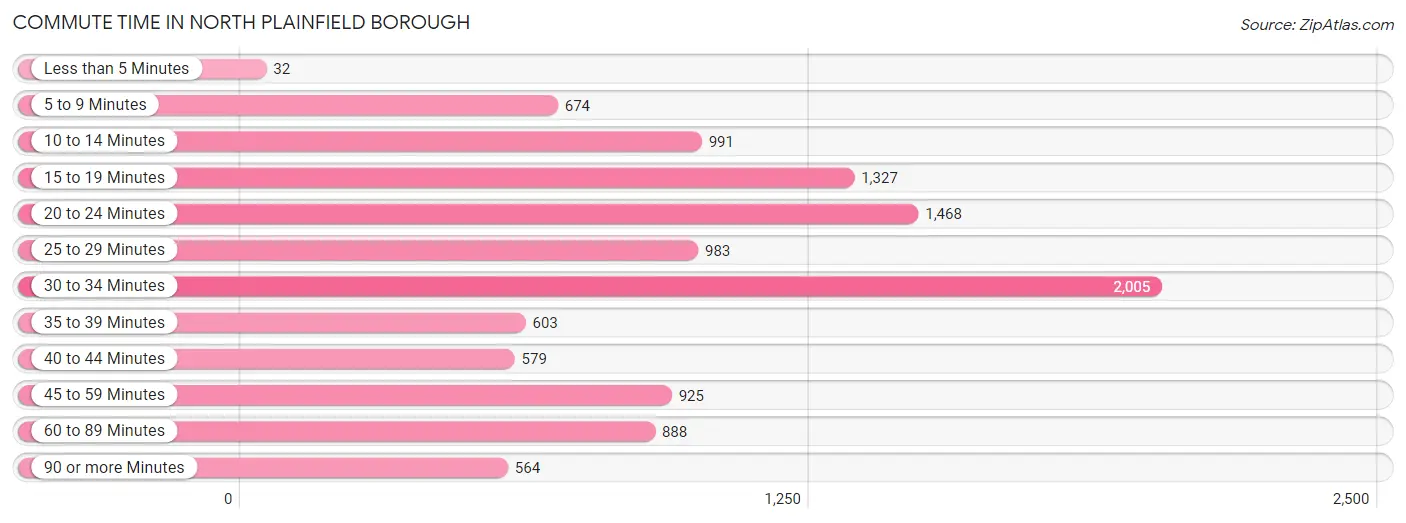
| Commute Time | # Commuters | % Commuters |
| Less than 5 Minutes | 32 | 0.3% |
| 5 to 9 Minutes | 674 | 6.1% |
| 10 to 14 Minutes | 991 | 9.0% |
| 15 to 19 Minutes | 1,327 | 12.0% |
| 20 to 24 Minutes | 1,468 | 13.3% |
| 25 to 29 Minutes | 983 | 8.9% |
| 30 to 34 Minutes | 2,005 | 18.2% |
| 35 to 39 Minutes | 603 | 5.5% |
| 40 to 44 Minutes | 579 | 5.2% |
| 45 to 59 Minutes | 925 | 8.4% |
| 60 to 89 Minutes | 888 | 8.0% |
| 90 or more Minutes | 564 | 5.1% |
Commute Time by Sex in North Plainfield borough
The most common commute times in North Plainfield borough are 30 to 34 minutes (1,081 commuters, 18.5%) for males and 30 to 34 minutes (924 commuters, 17.7%) for females.
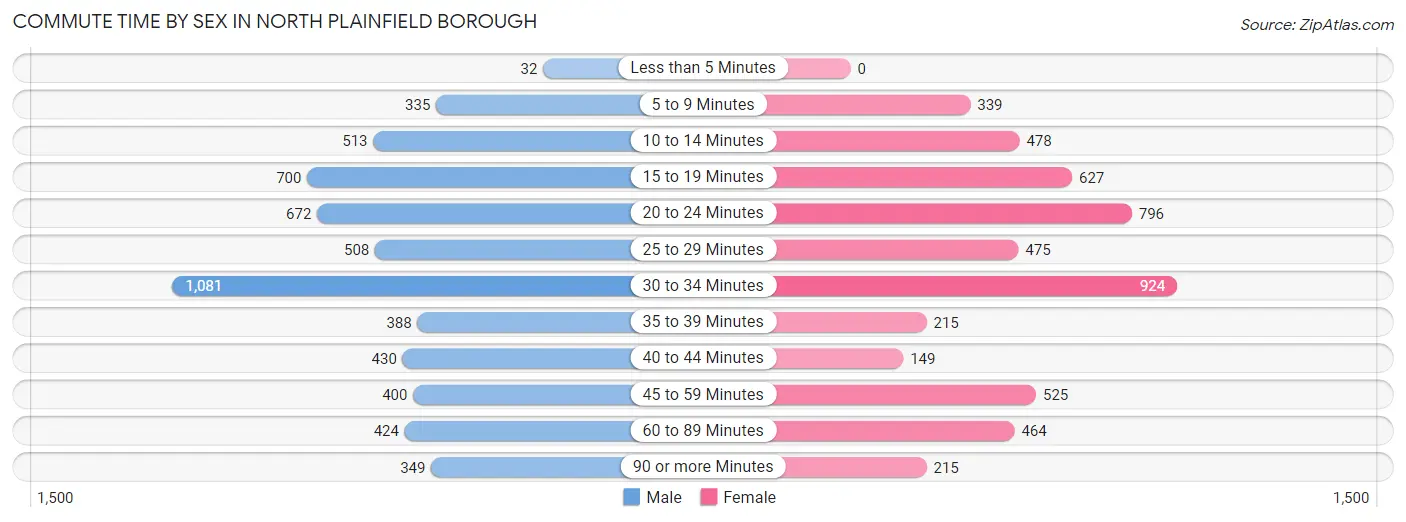
| Commute Time | Male | Female |
| Less than 5 Minutes | 32 (0.5%) | 0 (0.0%) |
| 5 to 9 Minutes | 335 (5.7%) | 339 (6.5%) |
| 10 to 14 Minutes | 513 (8.8%) | 478 (9.2%) |
| 15 to 19 Minutes | 700 (12.0%) | 627 (12.0%) |
| 20 to 24 Minutes | 672 (11.5%) | 796 (15.3%) |
| 25 to 29 Minutes | 508 (8.7%) | 475 (9.1%) |
| 30 to 34 Minutes | 1,081 (18.5%) | 924 (17.7%) |
| 35 to 39 Minutes | 388 (6.7%) | 215 (4.1%) |
| 40 to 44 Minutes | 430 (7.4%) | 149 (2.9%) |
| 45 to 59 Minutes | 400 (6.9%) | 525 (10.1%) |
| 60 to 89 Minutes | 424 (7.3%) | 464 (8.9%) |
| 90 or more Minutes | 349 (6.0%) | 215 (4.1%) |
Time of Departure to Work by Sex in North Plainfield borough
The most frequent times of departure to work in North Plainfield borough are 7:00 AM to 7:29 AM (935, 16.0%) for males and 8:00 AM to 8:29 AM (1,009, 19.4%) for females.
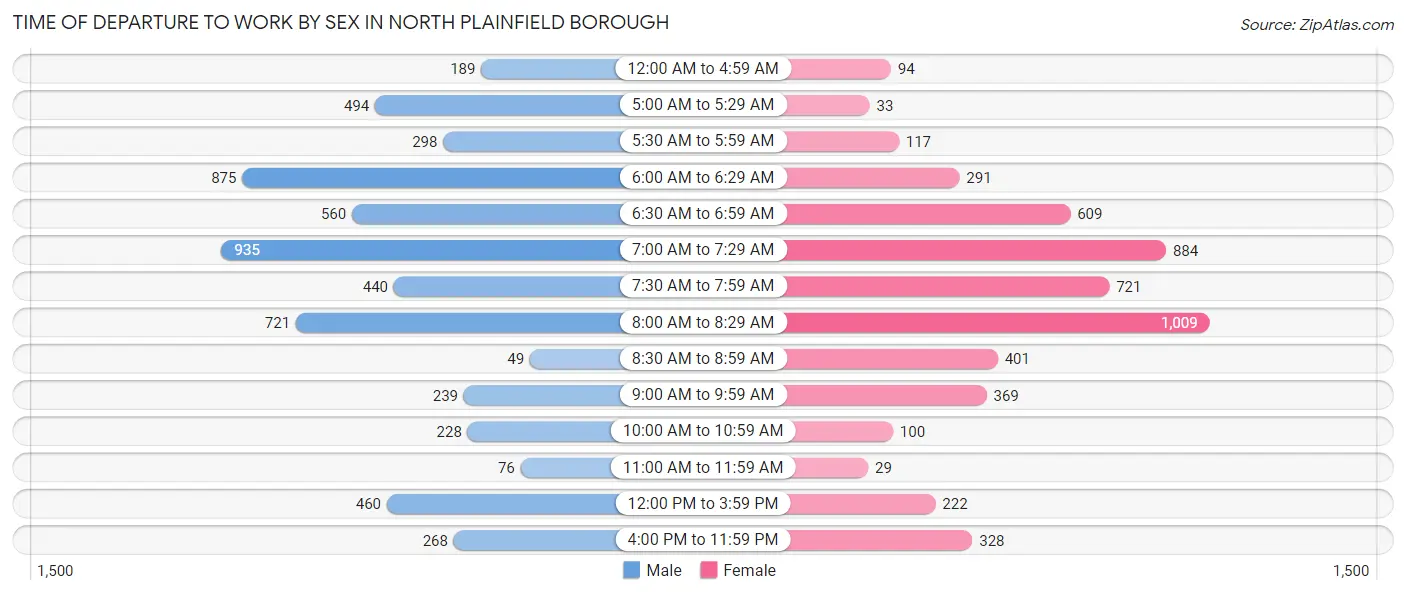
| Time of Departure | Male | Female |
| 12:00 AM to 4:59 AM | 189 (3.2%) | 94 (1.8%) |
| 5:00 AM to 5:29 AM | 494 (8.5%) | 33 (0.6%) |
| 5:30 AM to 5:59 AM | 298 (5.1%) | 117 (2.2%) |
| 6:00 AM to 6:29 AM | 875 (15.0%) | 291 (5.6%) |
| 6:30 AM to 6:59 AM | 560 (9.6%) | 609 (11.7%) |
| 7:00 AM to 7:29 AM | 935 (16.0%) | 884 (17.0%) |
| 7:30 AM to 7:59 AM | 440 (7.5%) | 721 (13.9%) |
| 8:00 AM to 8:29 AM | 721 (12.4%) | 1,009 (19.4%) |
| 8:30 AM to 8:59 AM | 49 (0.8%) | 401 (7.7%) |
| 9:00 AM to 9:59 AM | 239 (4.1%) | 369 (7.1%) |
| 10:00 AM to 10:59 AM | 228 (3.9%) | 100 (1.9%) |
| 11:00 AM to 11:59 AM | 76 (1.3%) | 29 (0.6%) |
| 12:00 PM to 3:59 PM | 460 (7.9%) | 222 (4.3%) |
| 4:00 PM to 11:59 PM | 268 (4.6%) | 328 (6.3%) |
| Total | 5,832 (100.0%) | 5,207 (100.0%) |
Housing Occupancy in North Plainfield borough
Occupancy by Ownership in North Plainfield borough
Of the total 8,077 dwellings in North Plainfield borough, owner-occupied units account for 4,481 (55.5%), while renter-occupied units make up 3,596 (44.5%).
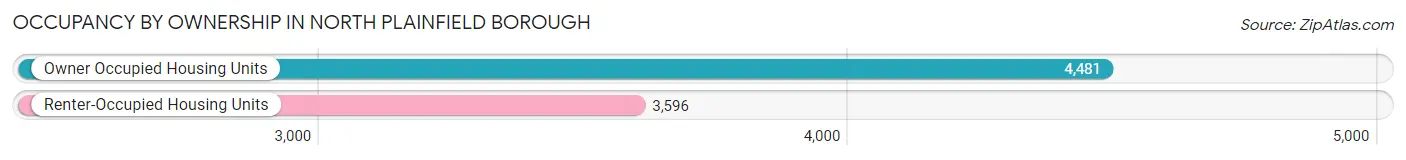
| Occupancy | # Housing Units | % Housing Units |
| Owner Occupied Housing Units | 4,481 | 55.5% |
| Renter-Occupied Housing Units | 3,596 | 44.5% |
| Total Occupied Housing Units | 8,077 | 100.0% |
Occupancy by Household Size in North Plainfield borough
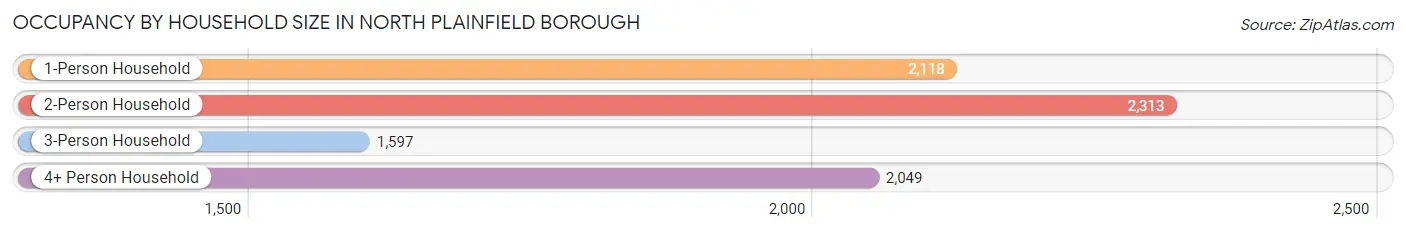
| Household Size | # Housing Units | % Housing Units |
| 1-Person Household | 2,118 | 26.2% |
| 2-Person Household | 2,313 | 28.6% |
| 3-Person Household | 1,597 | 19.8% |
| 4+ Person Household | 2,049 | 25.4% |
| Total Housing Units | 8,077 | 100.0% |
Occupancy by Ownership by Household Size in North Plainfield borough
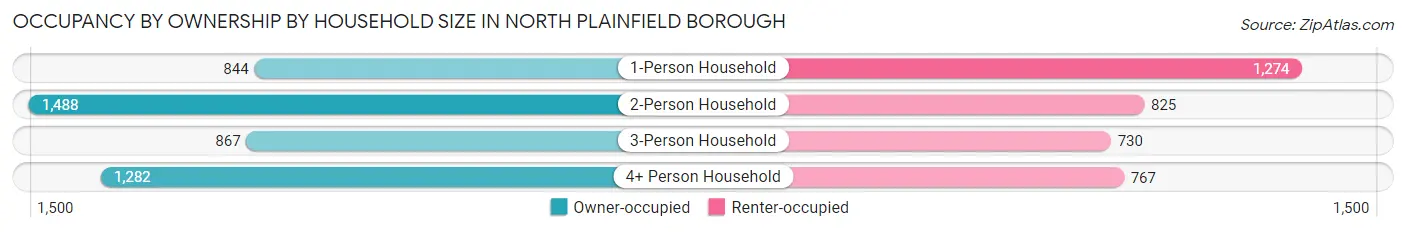
| Household Size | Owner-occupied | Renter-occupied |
| 1-Person Household | 844 (39.9%) | 1,274 (60.2%) |
| 2-Person Household | 1,488 (64.3%) | 825 (35.7%) |
| 3-Person Household | 867 (54.3%) | 730 (45.7%) |
| 4+ Person Household | 1,282 (62.6%) | 767 (37.4%) |
| Total Housing Units | 4,481 (55.5%) | 3,596 (44.5%) |
Occupancy by Educational Attainment in North Plainfield borough
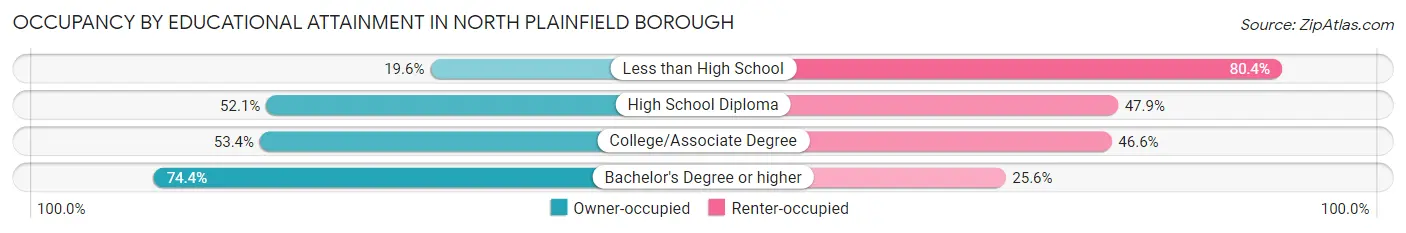
| Household Size | Owner-occupied | Renter-occupied |
| Less than High School | 207 (19.6%) | 850 (80.4%) |
| High School Diploma | 988 (52.1%) | 908 (47.9%) |
| College/Associate Degree | 1,334 (53.4%) | 1,166 (46.6%) |
| Bachelor's Degree or higher | 1,952 (74.4%) | 672 (25.6%) |
Occupancy by Age of Householder in North Plainfield borough
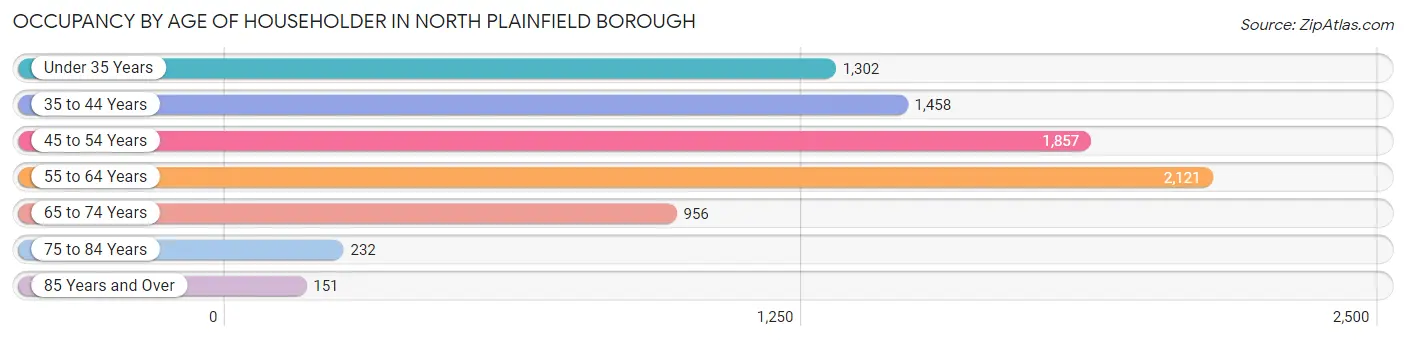
| Age Bracket | # Households | % Households |
| Under 35 Years | 1,302 | 16.1% |
| 35 to 44 Years | 1,458 | 18.0% |
| 45 to 54 Years | 1,857 | 23.0% |
| 55 to 64 Years | 2,121 | 26.3% |
| 65 to 74 Years | 956 | 11.8% |
| 75 to 84 Years | 232 | 2.9% |
| 85 Years and Over | 151 | 1.9% |
| Total | 8,077 | 100.0% |
Housing Finances in North Plainfield borough
Median Income by Occupancy in North Plainfield borough
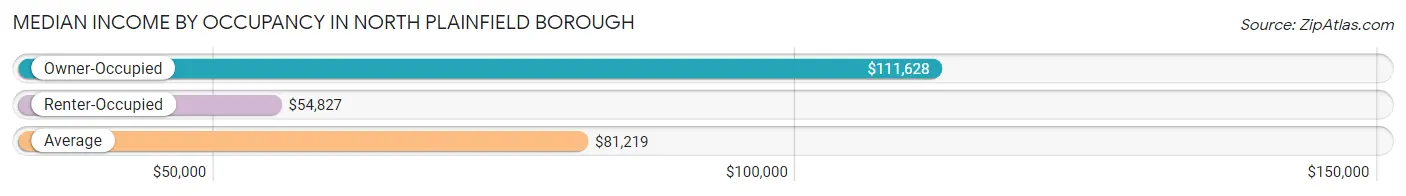
| Occupancy Type | # Households | Median Income |
| Owner-Occupied | 4,481 (55.5%) | $111,628 |
| Renter-Occupied | 3,596 (44.5%) | $54,827 |
| Average | 8,077 (100.0%) | $81,219 |
Occupancy by Householder Income Bracket in North Plainfield borough
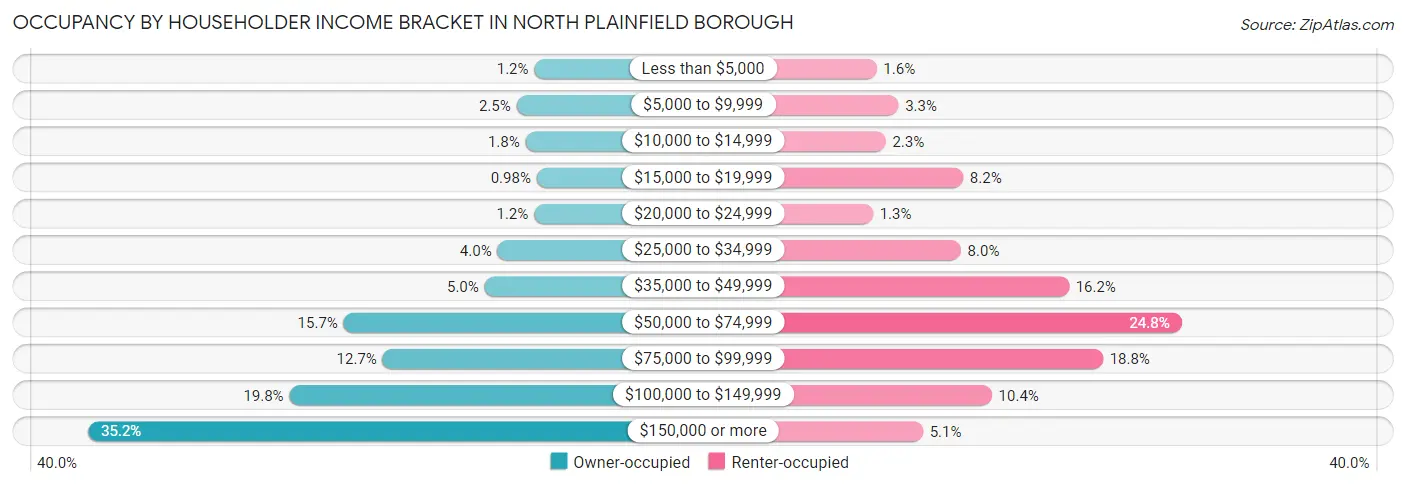
| Income Bracket | Owner-occupied | Renter-occupied |
| Less than $5,000 | 52 (1.2%) | 57 (1.6%) |
| $5,000 to $9,999 | 113 (2.5%) | 117 (3.3%) |
| $10,000 to $14,999 | 82 (1.8%) | 82 (2.3%) |
| $15,000 to $19,999 | 44 (1.0%) | 294 (8.2%) |
| $20,000 to $24,999 | 53 (1.2%) | 47 (1.3%) |
| $25,000 to $34,999 | 178 (4.0%) | 288 (8.0%) |
| $35,000 to $49,999 | 222 (5.0%) | 584 (16.2%) |
| $50,000 to $74,999 | 703 (15.7%) | 893 (24.8%) |
| $75,000 to $99,999 | 570 (12.7%) | 677 (18.8%) |
| $100,000 to $149,999 | 888 (19.8%) | 373 (10.4%) |
| $150,000 or more | 1,576 (35.2%) | 184 (5.1%) |
| Total | 4,481 (100.0%) | 3,596 (100.0%) |
Monthly Housing Cost Tiers in North Plainfield borough
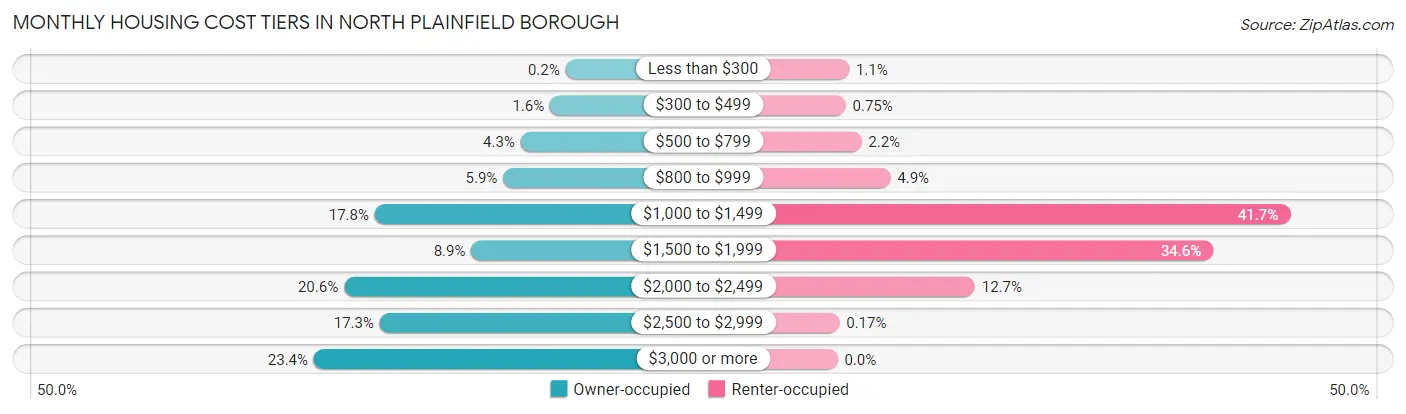
| Monthly Cost | Owner-occupied | Renter-occupied |
| Less than $300 | 9 (0.2%) | 38 (1.1%) |
| $300 to $499 | 73 (1.6%) | 27 (0.7%) |
| $500 to $799 | 194 (4.3%) | 79 (2.2%) |
| $800 to $999 | 266 (5.9%) | 175 (4.9%) |
| $1,000 to $1,499 | 796 (17.8%) | 1,498 (41.7%) |
| $1,500 to $1,999 | 398 (8.9%) | 1,243 (34.6%) |
| $2,000 to $2,499 | 923 (20.6%) | 455 (12.7%) |
| $2,500 to $2,999 | 775 (17.3%) | 6 (0.2%) |
| $3,000 or more | 1,047 (23.4%) | 0 (0.0%) |
| Total | 4,481 (100.0%) | 3,596 (100.0%) |
Physical Housing Characteristics in North Plainfield borough
Housing Structures in North Plainfield borough
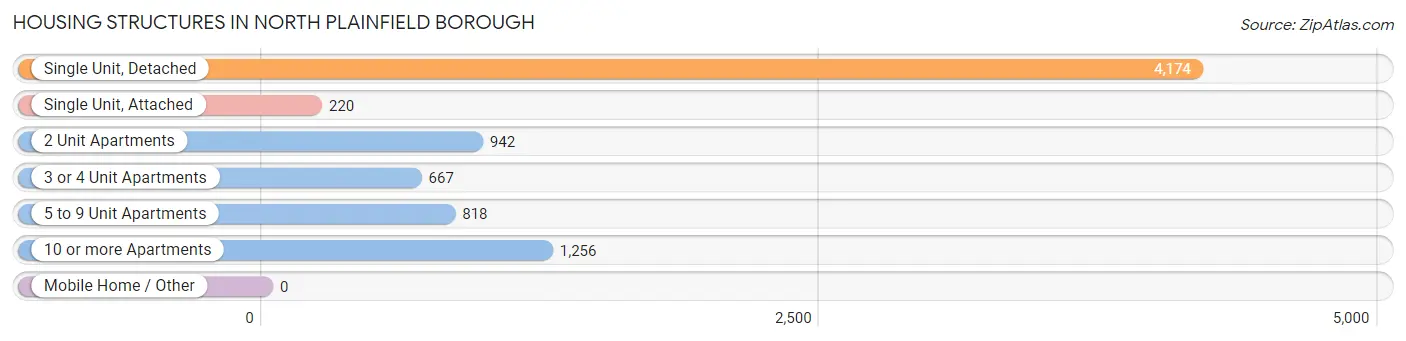
| Structure Type | # Housing Units | % Housing Units |
| Single Unit, Detached | 4,174 | 51.7% |
| Single Unit, Attached | 220 | 2.7% |
| 2 Unit Apartments | 942 | 11.7% |
| 3 or 4 Unit Apartments | 667 | 8.3% |
| 5 to 9 Unit Apartments | 818 | 10.1% |
| 10 or more Apartments | 1,256 | 15.5% |
| Mobile Home / Other | 0 | 0.0% |
| Total | 8,077 | 100.0% |
Housing Structures by Occupancy in North Plainfield borough
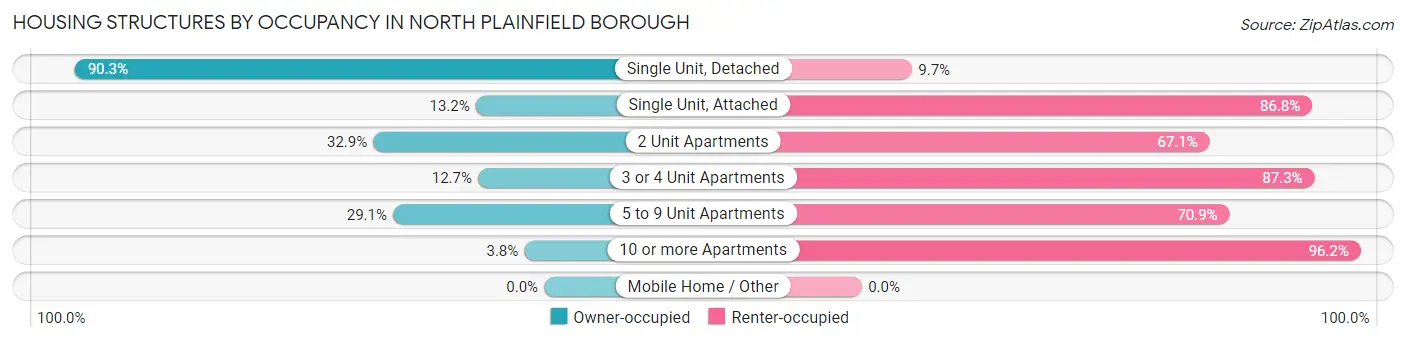
| Structure Type | Owner-occupied | Renter-occupied |
| Single Unit, Detached | 3,771 (90.3%) | 403 (9.7%) |
| Single Unit, Attached | 29 (13.2%) | 191 (86.8%) |
| 2 Unit Apartments | 310 (32.9%) | 632 (67.1%) |
| 3 or 4 Unit Apartments | 85 (12.7%) | 582 (87.3%) |
| 5 to 9 Unit Apartments | 238 (29.1%) | 580 (70.9%) |
| 10 or more Apartments | 48 (3.8%) | 1,208 (96.2%) |
| Mobile Home / Other | 0 (0.0%) | 0 (0.0%) |
| Total | 4,481 (55.5%) | 3,596 (44.5%) |
Housing Structures by Number of Rooms in North Plainfield borough
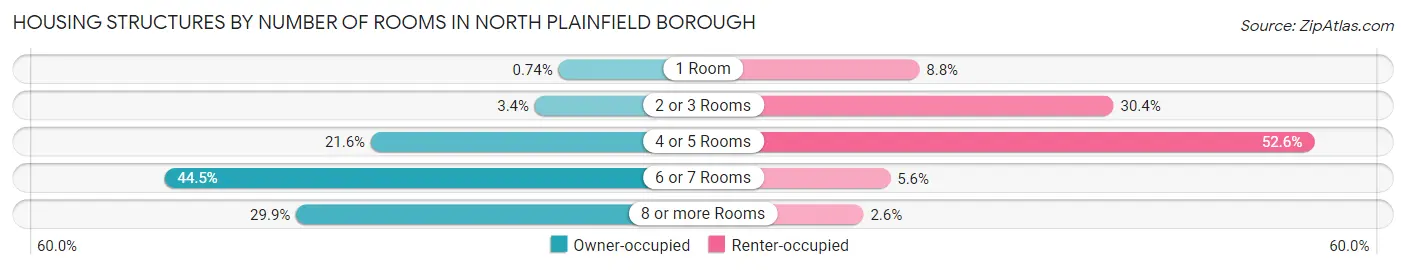
| Number of Rooms | Owner-occupied | Renter-occupied |
| 1 Room | 33 (0.7%) | 317 (8.8%) |
| 2 or 3 Rooms | 151 (3.4%) | 1,092 (30.4%) |
| 4 or 5 Rooms | 966 (21.6%) | 1,892 (52.6%) |
| 6 or 7 Rooms | 1,993 (44.5%) | 201 (5.6%) |
| 8 or more Rooms | 1,338 (29.9%) | 94 (2.6%) |
| Total | 4,481 (100.0%) | 3,596 (100.0%) |
Housing Structure by Heating Type in North Plainfield borough
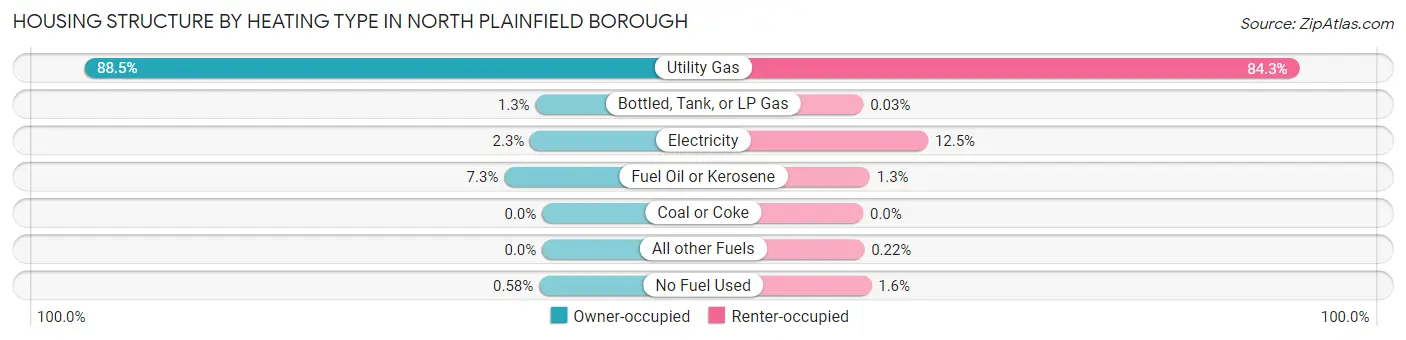
| Heating Type | Owner-occupied | Renter-occupied |
| Utility Gas | 3,966 (88.5%) | 3,032 (84.3%) |
| Bottled, Tank, or LP Gas | 58 (1.3%) | 1 (0.0%) |
| Electricity | 103 (2.3%) | 451 (12.5%) |
| Fuel Oil or Kerosene | 328 (7.3%) | 47 (1.3%) |
| Coal or Coke | 0 (0.0%) | 0 (0.0%) |
| All other Fuels | 0 (0.0%) | 8 (0.2%) |
| No Fuel Used | 26 (0.6%) | 57 (1.6%) |
| Total | 4,481 (100.0%) | 3,596 (100.0%) |
Household Vehicle Usage in North Plainfield borough
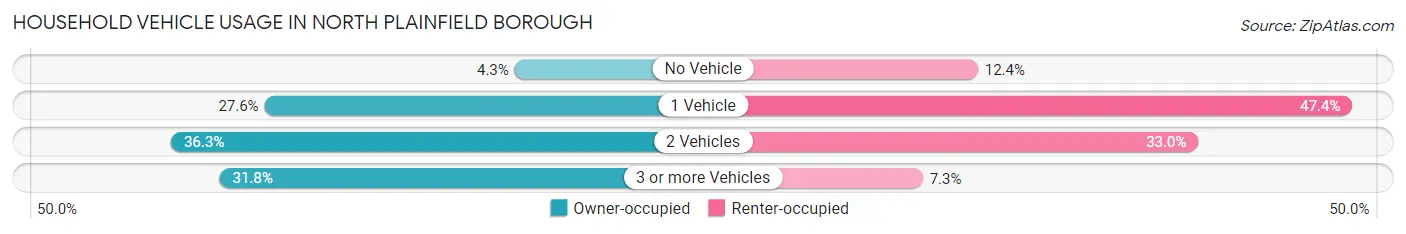
| Vehicles per Household | Owner-occupied | Renter-occupied |
| No Vehicle | 191 (4.3%) | 446 (12.4%) |
| 1 Vehicle | 1,237 (27.6%) | 1,703 (47.4%) |
| 2 Vehicles | 1,628 (36.3%) | 1,186 (33.0%) |
| 3 or more Vehicles | 1,425 (31.8%) | 261 (7.3%) |
| Total | 4,481 (100.0%) | 3,596 (100.0%) |
Real Estate & Mortgages in North Plainfield borough
Real Estate and Mortgage Overview in North Plainfield borough
| Characteristic | Without Mortgage | With Mortgage |
| Housing Units | 1,383 | 3,098 |
| Median Property Value | $300,100 | $345,000 |
| Median Household Income | $88,798 | $1,268 |
| Monthly Housing Costs | $1,146 | $1,012 |
| Real Estate Taxes | $9,151 | $57 |
Property Value by Mortgage Status in North Plainfield borough
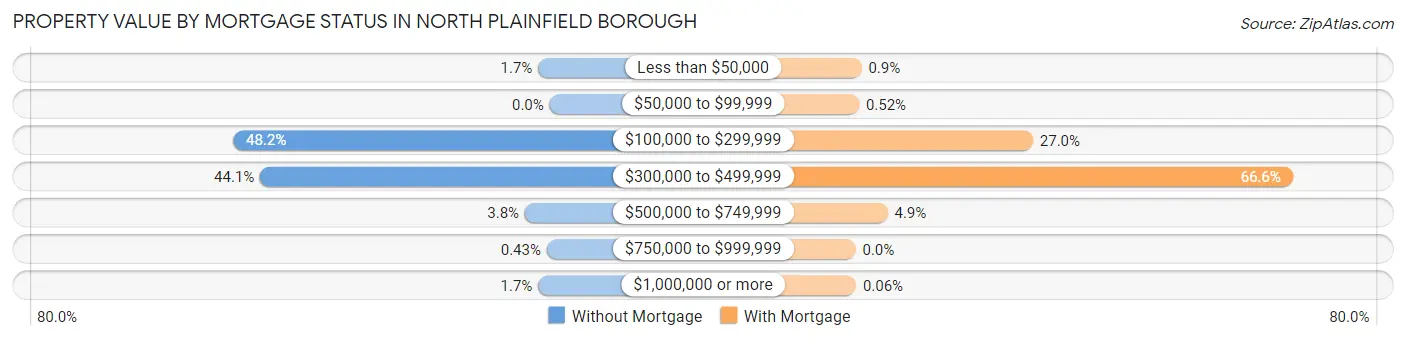
| Property Value | Without Mortgage | With Mortgage |
| Less than $50,000 | 24 (1.7%) | 28 (0.9%) |
| $50,000 to $99,999 | 0 (0.0%) | 16 (0.5%) |
| $100,000 to $299,999 | 667 (48.2%) | 837 (27.0%) |
| $300,000 to $499,999 | 610 (44.1%) | 2,064 (66.6%) |
| $500,000 to $749,999 | 52 (3.8%) | 151 (4.9%) |
| $750,000 to $999,999 | 6 (0.4%) | 0 (0.0%) |
| $1,000,000 or more | 24 (1.7%) | 2 (0.1%) |
| Total | 1,383 (100.0%) | 3,098 (100.0%) |
Household Income by Mortgage Status in North Plainfield borough
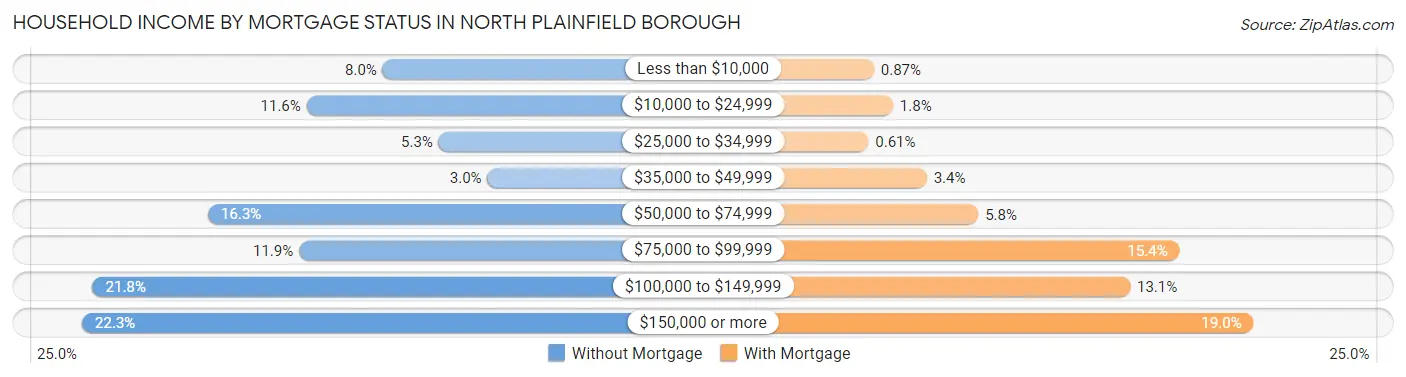
| Household Income | Without Mortgage | With Mortgage |
| Less than $10,000 | 110 (8.0%) | 27 (0.9%) |
| $10,000 to $24,999 | 160 (11.6%) | 55 (1.8%) |
| $25,000 to $34,999 | 73 (5.3%) | 19 (0.6%) |
| $35,000 to $49,999 | 41 (3.0%) | 105 (3.4%) |
| $50,000 to $74,999 | 225 (16.3%) | 181 (5.8%) |
| $75,000 to $99,999 | 165 (11.9%) | 478 (15.4%) |
| $100,000 to $149,999 | 301 (21.8%) | 405 (13.1%) |
| $150,000 or more | 308 (22.3%) | 587 (19.0%) |
| Total | 1,383 (100.0%) | 3,098 (100.0%) |
Property Value to Household Income Ratio in North Plainfield borough
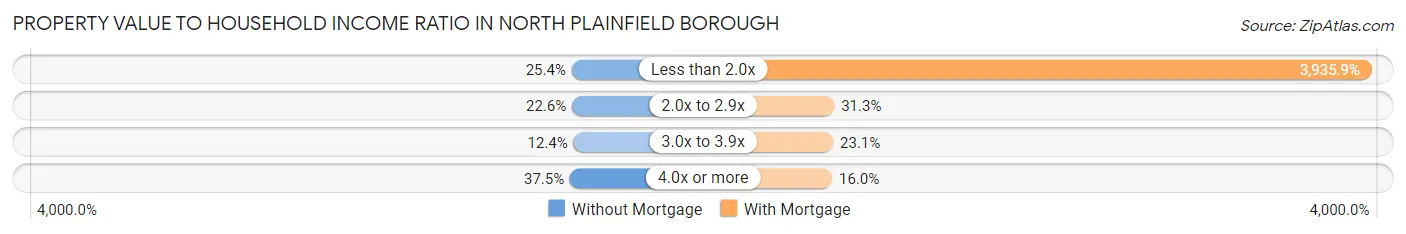
| Value-to-Income Ratio | Without Mortgage | With Mortgage |
| Less than 2.0x | 351 (25.4%) | 121,934 (3,935.9%) |
| 2.0x to 2.9x | 312 (22.6%) | 968 (31.2%) |
| 3.0x to 3.9x | 171 (12.4%) | 715 (23.1%) |
| 4.0x or more | 518 (37.4%) | 495 (16.0%) |
| Total | 1,383 (100.0%) | 3,098 (100.0%) |
Real Estate Taxes by Mortgage Status in North Plainfield borough
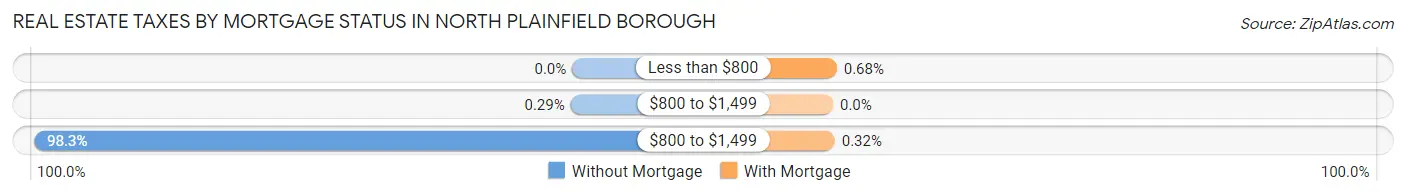
| Property Taxes | Without Mortgage | With Mortgage |
| Less than $800 | 0 (0.0%) | 21 (0.7%) |
| $800 to $1,499 | 4 (0.3%) | 0 (0.0%) |
| $800 to $1,499 | 1,359 (98.3%) | 10 (0.3%) |
| Total | 1,383 (100.0%) | 3,098 (100.0%) |
Health & Disability in North Plainfield borough
Health Insurance Coverage by Age in North Plainfield borough
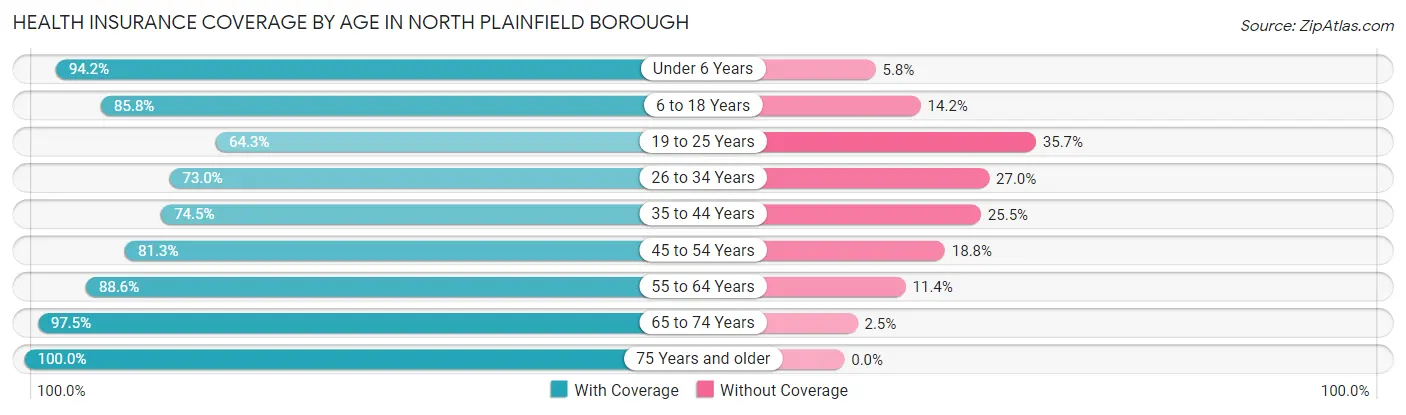
| Age Bracket | With Coverage | Without Coverage |
| Under 6 Years | 1,664 (94.2%) | 103 (5.8%) |
| 6 to 18 Years | 3,095 (85.8%) | 514 (14.2%) |
| 19 to 25 Years | 1,472 (64.3%) | 818 (35.7%) |
| 26 to 34 Years | 2,094 (73.0%) | 775 (27.0%) |
| 35 to 44 Years | 2,237 (74.5%) | 765 (25.5%) |
| 45 to 54 Years | 2,401 (81.2%) | 554 (18.8%) |
| 55 to 64 Years | 3,145 (88.6%) | 406 (11.4%) |
| 65 to 74 Years | 1,778 (97.5%) | 45 (2.5%) |
| 75 Years and older | 829 (100.0%) | 0 (0.0%) |
| Total | 18,715 (82.5%) | 3,980 (17.5%) |
Health Insurance Coverage by Citizenship Status in North Plainfield borough
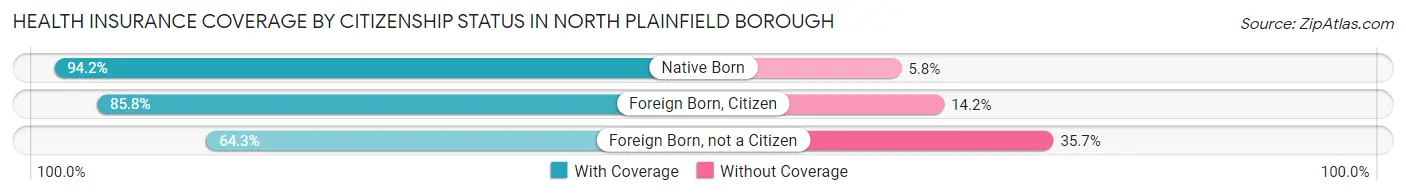
| Citizenship Status | With Coverage | Without Coverage |
| Native Born | 1,664 (94.2%) | 103 (5.8%) |
| Foreign Born, Citizen | 3,095 (85.8%) | 514 (14.2%) |
| Foreign Born, not a Citizen | 1,472 (64.3%) | 818 (35.7%) |
Health Insurance Coverage by Household Income in North Plainfield borough
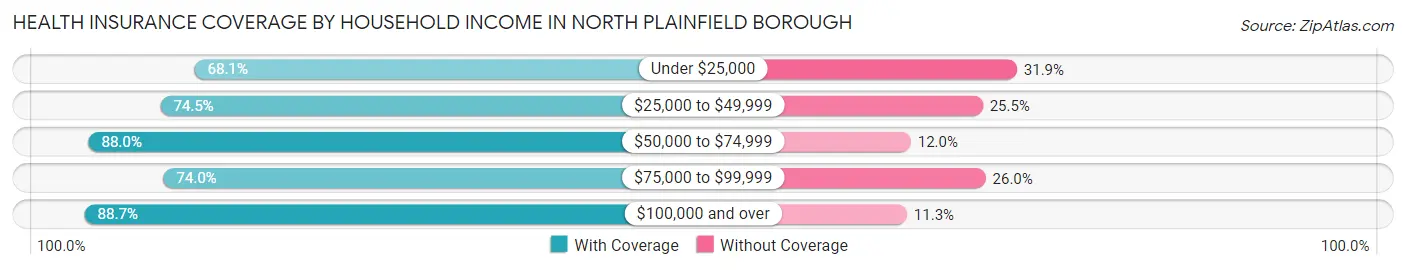
| Household Income | With Coverage | Without Coverage |
| Under $25,000 | 1,020 (68.1%) | 477 (31.9%) |
| $25,000 to $49,999 | 2,793 (74.5%) | 954 (25.5%) |
| $50,000 to $74,999 | 3,251 (88.0%) | 443 (12.0%) |
| $75,000 to $99,999 | 2,788 (74.0%) | 980 (26.0%) |
| $100,000 and over | 8,826 (88.7%) | 1,120 (11.3%) |
Public vs Private Health Insurance Coverage by Age in North Plainfield borough
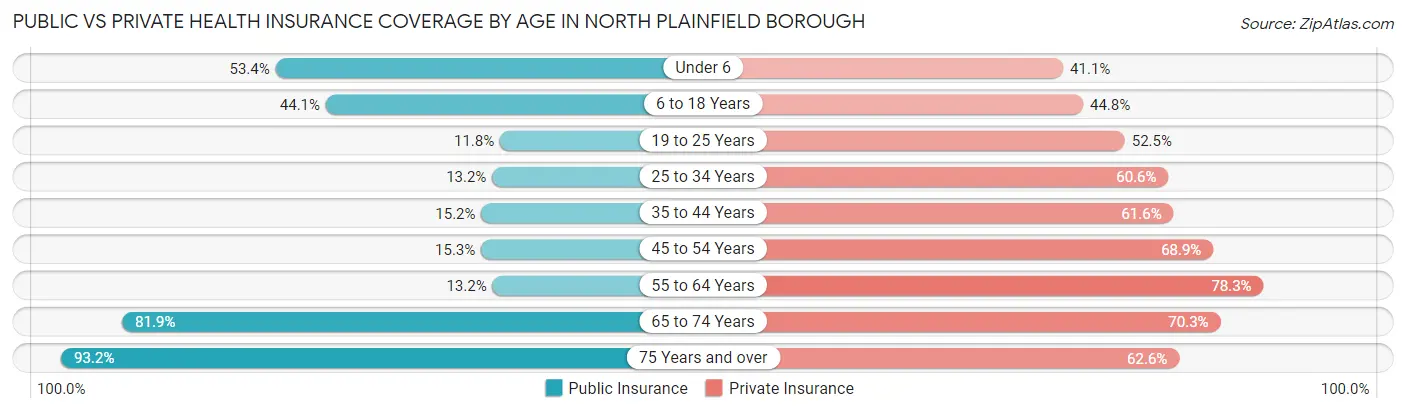
| Age Bracket | Public Insurance | Private Insurance |
| Under 6 | 944 (53.4%) | 726 (41.1%) |
| 6 to 18 Years | 1,591 (44.1%) | 1,616 (44.8%) |
| 19 to 25 Years | 269 (11.7%) | 1,203 (52.5%) |
| 25 to 34 Years | 379 (13.2%) | 1,739 (60.6%) |
| 35 to 44 Years | 457 (15.2%) | 1,848 (61.6%) |
| 45 to 54 Years | 451 (15.3%) | 2,037 (68.9%) |
| 55 to 64 Years | 467 (13.2%) | 2,779 (78.3%) |
| 65 to 74 Years | 1,493 (81.9%) | 1,281 (70.3%) |
| 75 Years and over | 773 (93.2%) | 519 (62.6%) |
| Total | 6,824 (30.1%) | 13,748 (60.6%) |
Disability Status by Sex by Age in North Plainfield borough
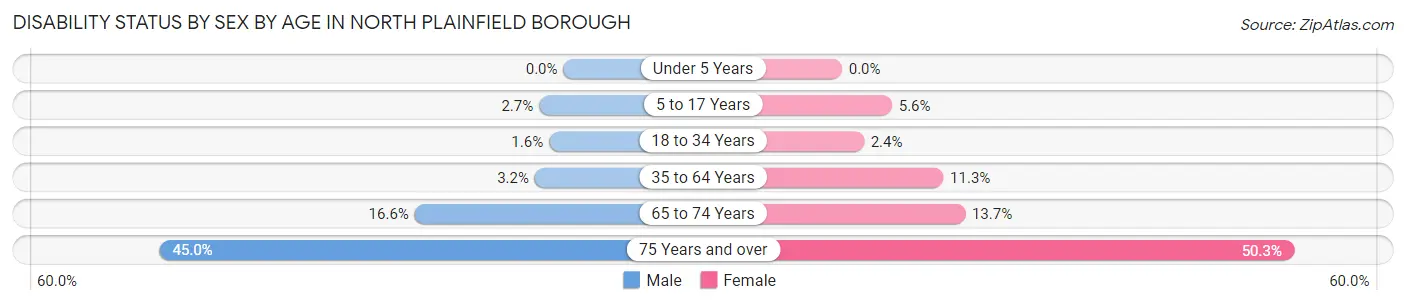
| Age Bracket | Male | Female |
| Under 5 Years | 0 (0.0%) | 0 (0.0%) |
| 5 to 17 Years | 49 (2.7%) | 86 (5.6%) |
| 18 to 34 Years | 38 (1.6%) | 78 (2.4%) |
| 35 to 64 Years | 145 (3.2%) | 559 (11.3%) |
| 65 to 74 Years | 151 (16.6%) | 125 (13.7%) |
| 75 Years and over | 103 (45.0%) | 302 (50.3%) |
Disability Class by Sex by Age in North Plainfield borough
Disability Class: Hearing Difficulty
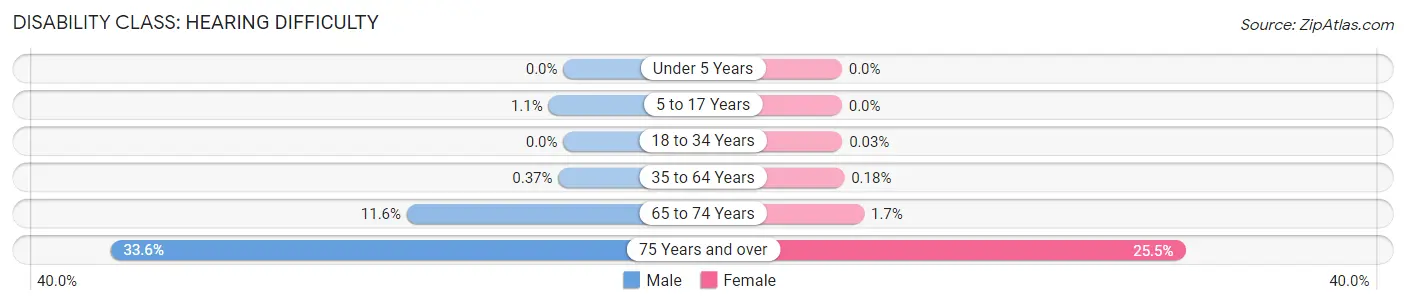
| Age Bracket | Male | Female |
| Under 5 Years | 0 (0.0%) | 0 (0.0%) |
| 5 to 17 Years | 20 (1.1%) | 0 (0.0%) |
| 18 to 34 Years | 0 (0.0%) | 1 (0.0%) |
| 35 to 64 Years | 17 (0.4%) | 9 (0.2%) |
| 65 to 74 Years | 106 (11.6%) | 15 (1.7%) |
| 75 Years and over | 77 (33.6%) | 153 (25.5%) |
Disability Class: Vision Difficulty
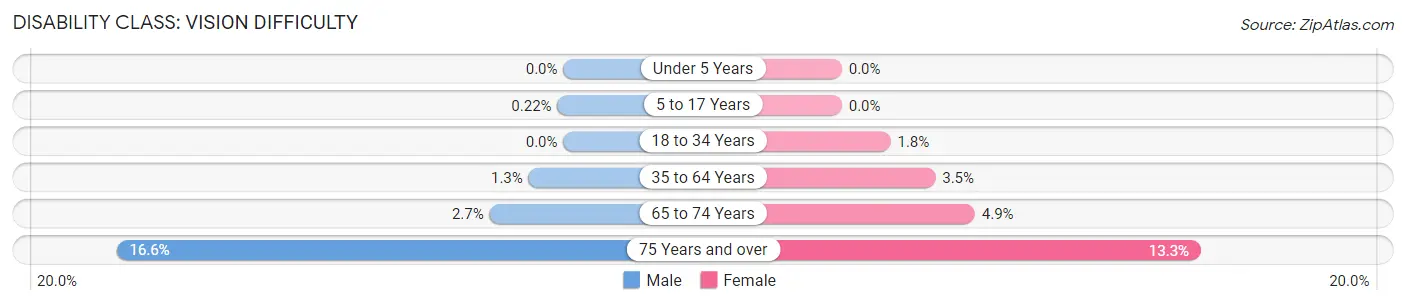
| Age Bracket | Male | Female |
| Under 5 Years | 0 (0.0%) | 0 (0.0%) |
| 5 to 17 Years | 4 (0.2%) | 0 (0.0%) |
| 18 to 34 Years | 0 (0.0%) | 58 (1.8%) |
| 35 to 64 Years | 59 (1.3%) | 172 (3.5%) |
| 65 to 74 Years | 25 (2.7%) | 45 (4.9%) |
| 75 Years and over | 38 (16.6%) | 80 (13.3%) |
Disability Class: Cognitive Difficulty
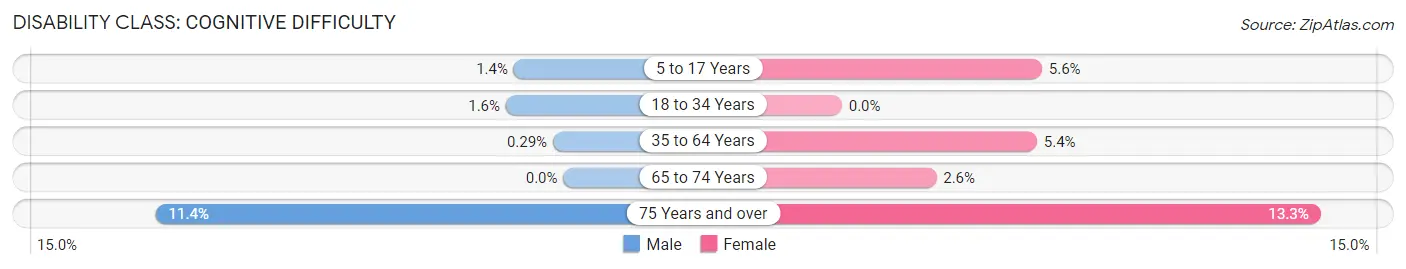
| Age Bracket | Male | Female |
| 5 to 17 Years | 25 (1.4%) | 86 (5.6%) |
| 18 to 34 Years | 38 (1.6%) | 0 (0.0%) |
| 35 to 64 Years | 13 (0.3%) | 269 (5.4%) |
| 65 to 74 Years | 0 (0.0%) | 24 (2.6%) |
| 75 Years and over | 26 (11.4%) | 80 (13.3%) |
Disability Class: Ambulatory Difficulty
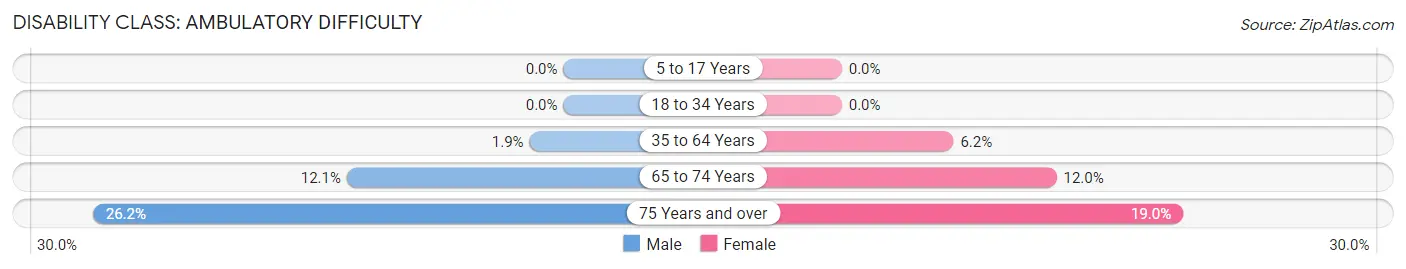
| Age Bracket | Male | Female |
| 5 to 17 Years | 0 (0.0%) | 0 (0.0%) |
| 18 to 34 Years | 0 (0.0%) | 0 (0.0%) |
| 35 to 64 Years | 86 (1.9%) | 308 (6.2%) |
| 65 to 74 Years | 110 (12.1%) | 109 (12.0%) |
| 75 Years and over | 60 (26.2%) | 114 (19.0%) |
Disability Class: Self-Care Difficulty
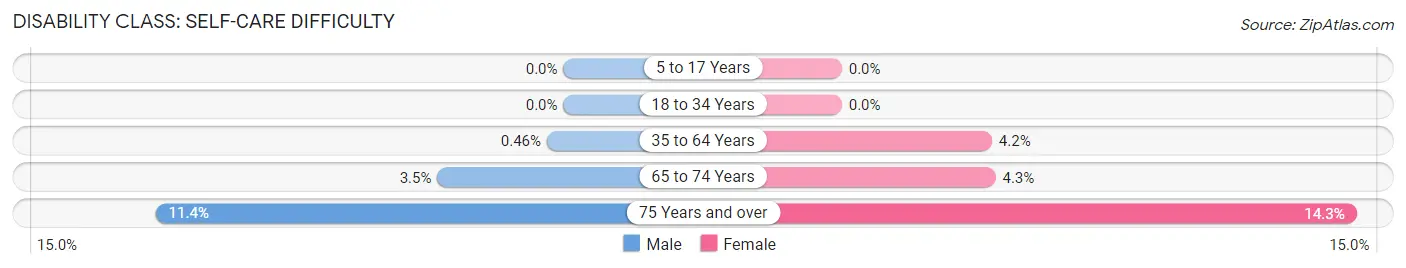
| Age Bracket | Male | Female |
| 5 to 17 Years | 0 (0.0%) | 0 (0.0%) |
| 18 to 34 Years | 0 (0.0%) | 0 (0.0%) |
| 35 to 64 Years | 21 (0.5%) | 207 (4.2%) |
| 65 to 74 Years | 32 (3.5%) | 39 (4.3%) |
| 75 Years and over | 26 (11.4%) | 86 (14.3%) |
Technology Access in North Plainfield borough
Computing Device Access in North Plainfield borough
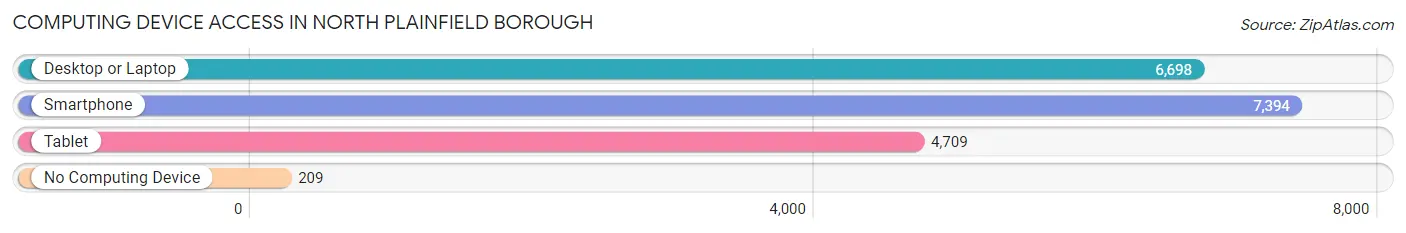
| Device Type | # Households | % Households |
| Desktop or Laptop | 6,698 | 82.9% |
| Smartphone | 7,394 | 91.5% |
| Tablet | 4,709 | 58.3% |
| No Computing Device | 209 | 2.6% |
| Total | 8,077 | 100.0% |
Internet Access in North Plainfield borough
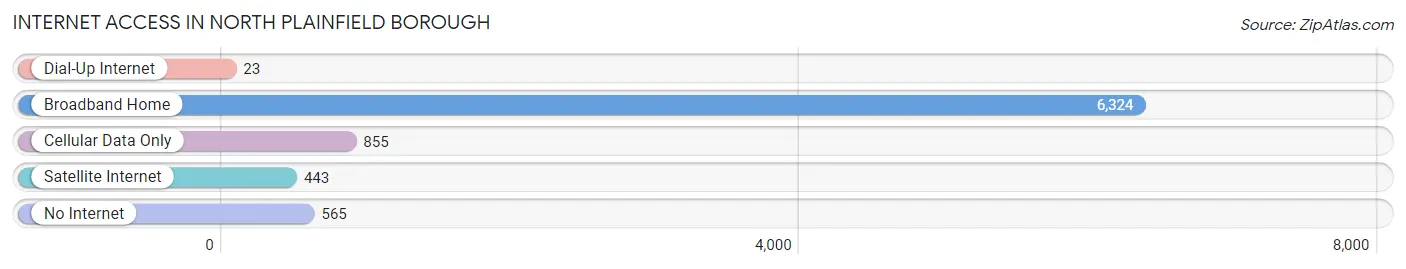
| Internet Type | # Households | % Households |
| Dial-Up Internet | 23 | 0.3% |
| Broadband Home | 6,324 | 78.3% |
| Cellular Data Only | 855 | 10.6% |
| Satellite Internet | 443 | 5.5% |
| No Internet | 565 | 7.0% |
| Total | 8,077 | 100.0% |
North Plainfield borough Summary
Introduction
North Plainfield Borough is a small borough located in Somerset County, New Jersey. It is situated in the Raritan Valley region of the state and is part of the larger New York metropolitan area. The borough has a population of approximately 21,000 people and covers an area of 2.7 square miles. North Plainfield is a diverse community with a rich history and a vibrant economy.
History
North Plainfield was first settled in the early 1700s by Dutch and English settlers. The area was originally part of Piscataway Township and was known as “Plainfield”. In 1885, the area was incorporated as the Borough of North Plainfield. The borough was named after the nearby Plainfield Township, which was established in 1798.
The borough experienced rapid growth in the late 19th and early 20th centuries. This growth was due to the construction of the Central Railroad of New Jersey, which connected North Plainfield to New York City. The railroad brought many new residents to the area, and the borough’s population grew from 1,000 in 1880 to over 10,000 by 1920.
Geography
North Plainfield is located in the Raritan Valley region of New Jersey. The borough is situated between the Watchung Mountains to the east and the Passaic River to the west. The borough is bordered by Plainfield to the north, Green Brook to the east, and Warren Township to the south.
The borough has a total area of 2.7 square miles, all of which is land. The borough is mostly flat, with some rolling hills in the northern part of the borough. The borough is located in a temperate climate zone, with hot summers and cold winters.
Economy
North Plainfield’s economy is largely based on manufacturing and retail. The borough is home to several large manufacturing companies, including Johnson & Johnson, Merck & Co., and PSE&G. The borough also has a thriving retail sector, with several large shopping centers and malls.
The borough also has a growing tourism industry. The borough is home to several historic sites, including the North Plainfield Historic District and the Van Wyck-Snellenberger House. The borough also has several parks and recreational areas, including the North Plainfield Park and the Watchung Reservation.
Demographics
As of the 2010 census, North Plainfield had a population of 21,936. The population was spread out, with 48.3% male and 51.7% female. The median age was 38.7 years.
The racial makeup of the borough was 64.2% White, 22.2% African American, 0.3% Native American, 8.2% Asian, and 4.9% from other races. Hispanic or Latino of any race were 18.3% of the population.
Conclusion
North Plainfield Borough is a small borough located in Somerset County, New Jersey. It is situated in the Raritan Valley region of the state and is part of the larger New York metropolitan area. The borough has a population of approximately 21,000 people and covers an area of 2.7 square miles. North Plainfield is a diverse community with a rich history and a vibrant economy. The borough’s economy is largely based on manufacturing and retail, and the borough also has a growing tourism industry. The borough has a population that is 64.2% White, 22.2% African American, 0.3% Native American, 8.2% Asian, and 4.9% from other races. North Plainfield is a vibrant community with a rich history and a bright future.
Common Questions
What is Per Capita Income in North Plainfield borough?
Per Capita income in North Plainfield borough is $35,195.
What is the Median Family Income in North Plainfield borough?
Median Family Income in North Plainfield borough is $93,066.
What is the Median Household income in North Plainfield borough?
Median Household Income in North Plainfield borough is $81,219.
What is Income or Wage Gap in North Plainfield borough?
Income or Wage Gap in North Plainfield borough is 12.5%.
Women in North Plainfield borough earn 87.5 cents for every dollar earned by a man.
What is Inequality or Gini Index in North Plainfield borough?
Inequality or Gini Index in North Plainfield borough is 0.40.
What is the Total Population of North Plainfield borough?
Total Population of North Plainfield borough is 22,695.
What is the Total Male Population of North Plainfield borough?
Total Male Population of North Plainfield borough is 10,612.
What is the Total Female Population of North Plainfield borough?
Total Female Population of North Plainfield borough is 12,083.
What is the Ratio of Males per 100 Females in North Plainfield borough?
There are 87.83 Males per 100 Females in North Plainfield borough.
What is the Ratio of Females per 100 Males in North Plainfield borough?
There are 113.86 Females per 100 Males in North Plainfield borough.
What is the Median Population Age in North Plainfield borough?
Median Population Age in North Plainfield borough is 37.2 Years.
What is the Average Family Size in North Plainfield borough
Average Family Size in North Plainfield borough is 3.4 People.
What is the Average Household Size in North Plainfield borough
Average Household Size in North Plainfield borough is 2.8 People.
How Large is the Labor Force in North Plainfield borough?
There are 13,364 People in the Labor Forcein in North Plainfield borough.
What is the Percentage of People in the Labor Force in North Plainfield borough?
73.0% of People are in the Labor Force in North Plainfield borough.
What is the Unemployment Rate in North Plainfield borough?
Unemployment Rate in North Plainfield borough is 9.6%.