Cities with the Highest Percentage of Hispanic or Latino Population in South Carolina
RELATED REPORTS & OPTIONS
Hispanic or Latino
South Carolina
Compare Cities
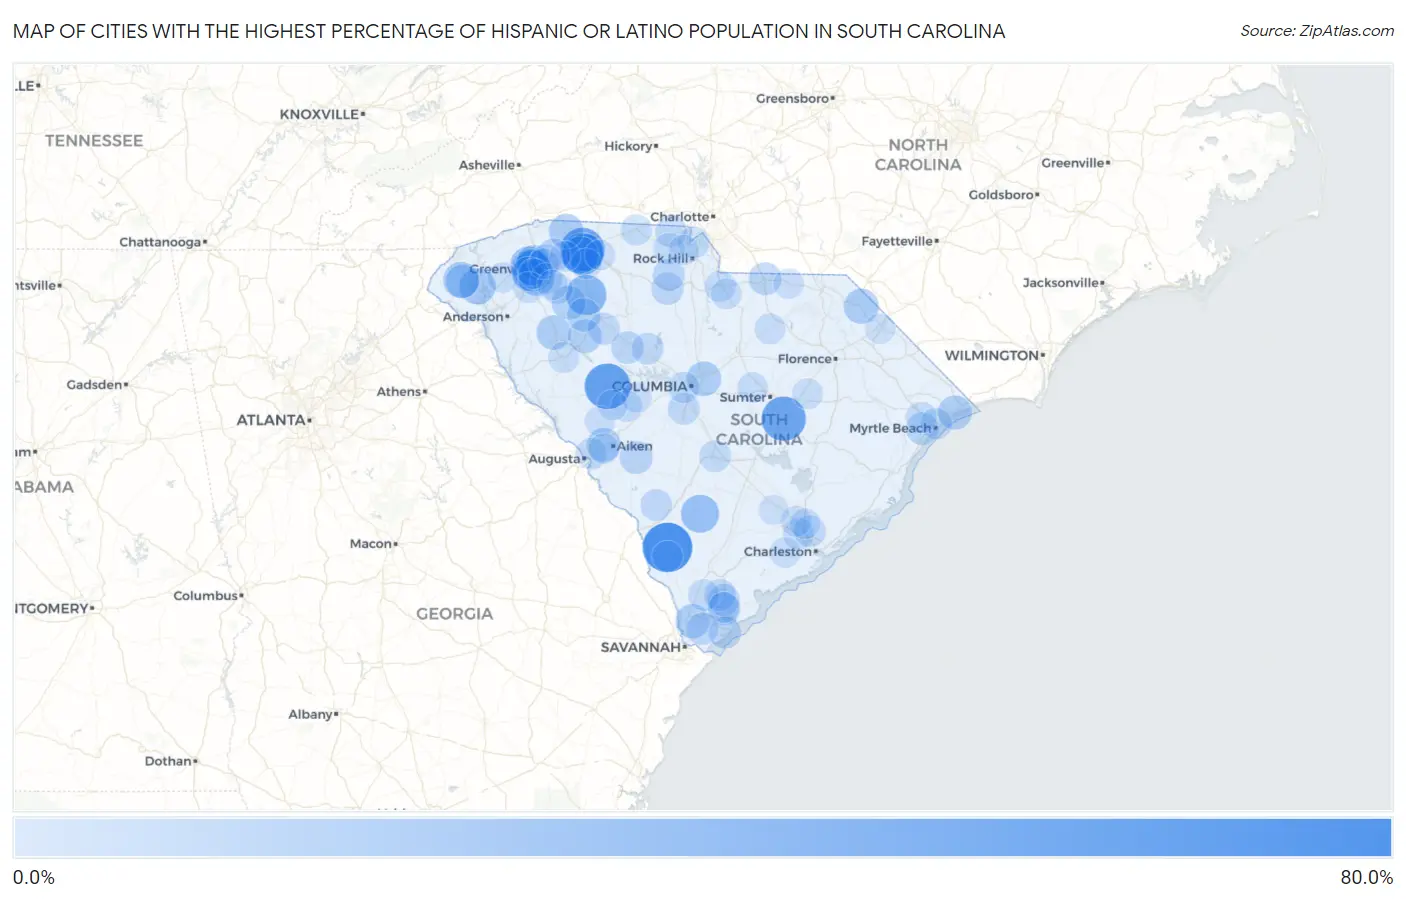
Map of Cities with the Highest Percentage of Hispanic or Latino Population in South Carolina
0.0%
80.0%
Cities with the Highest Percentage of Hispanic or Latino Population in South Carolina
| City | Hispanic or Latino | vs State | vs National | |
| 1. | Luray | 64.8% | 6.2%(+58.6)#1 | 18.7%(+46.1)#1,416 |
| 2. | Saluda | 53.2% | 6.2%(+47.0)#2 | 18.7%(+34.6)#1,823 |
| 3. | Alcolu | 49.1% | 6.2%(+42.9)#3 | 18.7%(+30.4)#2,000 |
| 4. | Southern Shops | 49.0% | 6.2%(+42.8)#4 | 18.7%(+30.3)#2,008 |
| 5. | Arcadia | 42.6% | 6.2%(+36.4)#5 | 18.7%(+24.0)#2,354 |
| 6. | Enoree | 36.7% | 6.2%(+30.5)#6 | 18.7%(+18.1)#2,729 |
| 7. | Judson | 36.6% | 6.2%(+30.4)#7 | 18.7%(+18.0)#2,746 |
| 8. | Daufuskie Island | 31.5% | 6.2%(+25.3)#8 | 18.7%(+12.8)#3,233 |
| 9. | Unity | 31.3% | 6.2%(+25.1)#9 | 18.7%(+12.6)#3,251 |
| 10. | Lodge | 30.0% | 6.2%(+23.8)#10 | 18.7%(+11.3)#3,393 |
| 11. | Saxon | 29.0% | 6.2%(+22.8)#11 | 18.7%(+10.4)#3,508 |
| 12. | Fairforest | 27.6% | 6.2%(+21.4)#12 | 18.7%(+8.90)#3,684 |
| 13. | Berea | 27.4% | 6.2%(+21.2)#13 | 18.7%(+8.78)#3,702 |
| 14. | Parker | 25.6% | 6.2%(+19.4)#14 | 18.7%(+6.94)#3,942 |
| 15. | Newry | 25.2% | 6.2%(+19.0)#15 | 18.7%(+6.57)#3,987 |
| 16. | Gantt | 25.0% | 6.2%(+18.8)#16 | 18.7%(+6.35)#4,011 |
| 17. | Walhalla | 24.5% | 6.2%(+18.3)#17 | 18.7%(+5.87)#4,090 |
| 18. | City View | 24.1% | 6.2%(+17.9)#18 | 18.7%(+5.46)#4,161 |
| 19. | Conestee | 23.6% | 6.2%(+17.4)#19 | 18.7%(+4.95)#4,254 |
| 20. | Sandy Springs | 23.5% | 6.2%(+17.3)#20 | 18.7%(+4.83)#4,271 |
| 21. | Arkwright | 22.1% | 6.2%(+15.9)#21 | 18.7%(+3.44)#4,527 |
| 22. | Clio | 21.5% | 6.2%(+15.3)#22 | 18.7%(+2.85)#4,633 |
| 23. | Campobello | 20.7% | 6.2%(+14.5)#23 | 18.7%(+2.02)#4,811 |
| 24. | Woodfield | 20.4% | 6.2%(+14.2)#24 | 18.7%(+1.77)#4,863 |
| 25. | Ware Shoals | 20.1% | 6.2%(+13.9)#25 | 18.7%(+1.46)#4,945 |
| 26. | Sans Souci | 20.0% | 6.2%(+13.8)#26 | 18.7%(+1.31)#4,974 |
| 27. | Hardeeville | 19.2% | 6.2%(+13.0)#27 | 18.7%(+0.595)#5,144 |
| 28. | Welcome | 19.0% | 6.2%(+12.8)#28 | 18.7%(+0.347)#5,192 |
| 29. | Graniteville | 18.9% | 6.2%(+12.7)#29 | 18.7%(+0.212)#5,216 |
| 30. | Atlantic Beach | 18.7% | 6.2%(+12.5)#30 | 18.7%(+0.023)#5,260 |
| 31. | Gray Court | 18.4% | 6.2%(+12.2)#31 | 18.7%(-0.271)#5,340 |
| 32. | Mountville | 17.8% | 6.2%(+11.6)#32 | 18.7%(-0.874)#5,507 |
| 33. | West Union | 17.3% | 6.2%(+11.1)#33 | 18.7%(-1.35)#5,645 |
| 34. | Watts Mills | 17.0% | 6.2%(+10.8)#34 | 18.7%(-1.66)#5,738 |
| 35. | Port Royal | 16.6% | 6.2%(+10.4)#35 | 18.7%(-2.04)#5,838 |
| 36. | North Santee | 16.6% | 6.2%(+10.4)#36 | 18.7%(-2.06)#5,841 |
| 37. | Hamer | 16.4% | 6.2%(+10.2)#37 | 18.7%(-2.20)#5,889 |
| 38. | Greer | 15.8% | 6.2%(+9.55)#38 | 18.7%(-2.90)#6,130 |
| 39. | Windsor | 15.6% | 6.2%(+9.45)#39 | 18.7%(-3.01)#6,159 |
| 40. | Pageland | 15.0% | 6.2%(+8.84)#40 | 18.7%(-3.61)#6,345 |
| 41. | Socastee | 14.8% | 6.2%(+8.60)#41 | 18.7%(-3.85)#6,439 |
| 42. | Newberry | 14.1% | 6.2%(+7.92)#42 | 18.7%(-4.53)#6,683 |
| 43. | Gayle Mill | 13.8% | 6.2%(+7.57)#43 | 18.7%(-4.88)#6,803 |
| 44. | Hilton Head Island | 13.8% | 6.2%(+7.56)#44 | 18.7%(-4.89)#6,806 |
| 45. | Burton | 13.2% | 6.2%(+7.02)#45 | 18.7%(-5.43)#7,041 |
| 46. | Lowrys | 13.1% | 6.2%(+6.93)#46 | 18.7%(-5.52)#7,077 |
| 47. | Bluffton | 13.1% | 6.2%(+6.86)#47 | 18.7%(-5.59)#7,108 |
| 48. | Joanna | 12.9% | 6.2%(+6.74)#48 | 18.7%(-5.71)#7,164 |
| 49. | Kline | 12.8% | 6.2%(+6.62)#49 | 18.7%(-5.83)#7,219 |
| 50. | Hanahan | 12.6% | 6.2%(+6.37)#50 | 18.7%(-6.09)#7,330 |
| 51. | Laurel Bay | 12.6% | 6.2%(+6.35)#51 | 18.7%(-6.10)#7,333 |
| 52. | Elliott | 12.5% | 6.2%(+6.34)#52 | 18.7%(-6.11)#7,336 |
| 53. | Cash | 12.5% | 6.2%(+6.27)#53 | 18.7%(-6.18)#7,369 |
| 54. | Gaston | 12.5% | 6.2%(+6.26)#54 | 18.7%(-6.20)#7,375 |
| 55. | East Camden | 12.1% | 6.2%(+5.94)#55 | 18.7%(-6.51)#7,528 |
| 56. | Pomaria | 12.1% | 6.2%(+5.89)#56 | 18.7%(-6.56)#7,557 |
| 57. | Clover | 12.1% | 6.2%(+5.86)#57 | 18.7%(-6.59)#7,569 |
| 58. | Tega Cay | 11.9% | 6.2%(+5.69)#58 | 18.7%(-6.76)#7,648 |
| 59. | Taylors | 11.6% | 6.2%(+5.41)#59 | 18.7%(-7.04)#7,798 |
| 60. | Wilkinson Heights | 11.5% | 6.2%(+5.26)#60 | 18.7%(-7.19)#7,875 |
| 61. | Monetta | 11.4% | 6.2%(+5.21)#61 | 18.7%(-7.24)#7,902 |
| 62. | Myrtle Beach | 11.4% | 6.2%(+5.20)#62 | 18.7%(-7.25)#7,909 |
| 63. | West Columbia | 11.2% | 6.2%(+5.00)#63 | 18.7%(-7.45)#8,017 |
| 64. | Clearwater | 11.1% | 6.2%(+4.94)#64 | 18.7%(-7.51)#8,050 |
| 65. | York | 11.0% | 6.2%(+4.76)#65 | 18.7%(-7.70)#8,141 |
| 66. | Mauldin | 10.9% | 6.2%(+4.68)#66 | 18.7%(-7.77)#8,188 |
| 67. | Ridgeland | 10.8% | 6.2%(+4.58)#67 | 18.7%(-7.87)#8,237 |
| 68. | Piedmont | 10.7% | 6.2%(+4.51)#68 | 18.7%(-7.94)#8,274 |
| 69. | Lancaster | 10.7% | 6.2%(+4.46)#69 | 18.7%(-7.99)#8,299 |
| 70. | Blacksburg | 10.6% | 6.2%(+4.44)#70 | 18.7%(-8.01)#8,315 |
| 71. | Camp Croft | 10.4% | 6.2%(+4.20)#71 | 18.7%(-8.26)#8,476 |
| 72. | North Charleston | 10.3% | 6.2%(+4.10)#72 | 18.7%(-8.35)#8,527 |
| 73. | Red Hill | 10.3% | 6.2%(+4.05)#73 | 18.7%(-8.40)#8,555 |
| 74. | Greenwood | 9.7% | 6.2%(+3.53)#74 | 18.7%(-8.92)#8,890 |
| 75. | Fountain Inn | 9.7% | 6.2%(+3.46)#75 | 18.7%(-8.99)#8,938 |
| 76. | Elgin | 9.6% | 6.2%(+3.45)#76 | 18.7%(-9.01)#8,950 |
| 77. | Estill | 9.6% | 6.2%(+3.40)#77 | 18.7%(-9.06)#8,983 |
| 78. | Roebuck | 9.6% | 6.2%(+3.39)#78 | 18.7%(-9.06)#8,987 |
| 79. | Bethune | 9.5% | 6.2%(+3.27)#79 | 18.7%(-9.18)#9,065 |
| 80. | Wade Hampton | 9.4% | 6.2%(+3.16)#80 | 18.7%(-9.29)#9,147 |
| 81. | Oakland | 9.3% | 6.2%(+3.09)#81 | 18.7%(-9.36)#9,185 |
| 82. | Ladson | 9.3% | 6.2%(+3.08)#82 | 18.7%(-9.38)#9,197 |
| 83. | Shiloh | 9.2% | 6.2%(+3.03)#83 | 18.7%(-9.42)#9,246 |
| 84. | Duncan | 9.1% | 6.2%(+2.85)#84 | 18.7%(-9.60)#9,387 |
| 85. | Shell Point | 9.0% | 6.2%(+2.78)#85 | 18.7%(-9.67)#9,446 |
| 86. | Batesburg Leesville | 8.8% | 6.2%(+2.59)#86 | 18.7%(-9.86)#9,581 |
| 87. | Ravenel | 8.8% | 6.2%(+2.59)#87 | 18.7%(-9.86)#9,587 |
| 88. | Ruby | 8.6% | 6.2%(+2.43)#88 | 18.7%(-10.0)#9,717 |
| 89. | Trenton | 8.4% | 6.2%(+2.21)#89 | 18.7%(-10.2)#9,882 |
| 90. | Goose Creek | 8.4% | 6.2%(+2.19)#90 | 18.7%(-10.3)#9,907 |
| 91. | Liberty | 8.4% | 6.2%(+2.15)#91 | 18.7%(-10.3)#9,944 |
| 92. | Ward | 8.3% | 6.2%(+2.13)#92 | 18.7%(-10.3)#9,965 |
| 93. | Hilltop | 8.3% | 6.2%(+2.13)#93 | 18.7%(-10.3)#9,969 |
| 94. | Warrenville | 8.3% | 6.2%(+2.07)#94 | 18.7%(-10.4)#10,033 |
| 95. | Glendale | 8.3% | 6.2%(+2.07)#95 | 18.7%(-10.4)#10,036 |
| 96. | Dunean | 8.1% | 6.2%(+1.88)#96 | 18.7%(-10.6)#10,203 |
| 97. | Ridgeville | 8.1% | 6.2%(+1.87)#97 | 18.7%(-10.6)#10,213 |
| 98. | Newport | 8.1% | 6.2%(+1.87)#98 | 18.7%(-10.6)#10,220 |
| 99. | Simpsonville | 8.0% | 6.2%(+1.80)#99 | 18.7%(-10.7)#10,283 |
| 100. | Dillon | 7.7% | 6.2%(+1.52)#100 | 18.7%(-10.9)#10,551 |
Common Questions
What are the Top 10 Cities with the Highest Percentage of Hispanic or Latino Population in South Carolina?
Top 10 Cities with the Highest Percentage of Hispanic or Latino Population in South Carolina are:
#1
64.8%
#2
53.2%
#3
49.1%
#4
49.0%
#5
42.6%
#6
36.7%
#7
36.6%
#8
30.0%
#9
29.0%
#10
27.6%
What city has the Highest Percentage of Hispanic or Latino Population in South Carolina?
Luray has the Highest Percentage of Hispanic or Latino Population in South Carolina with 64.8%.
What is the Percentage of Hispanic or Latino Population in the State of South Carolina?
Percentage of Hispanic or Latino Population in South Carolina is 6.2%.
What is the Percentage of Hispanic or Latino Population in the United States?
Percentage of Hispanic or Latino Population in the United States is 18.7%.