Woodbridge, NJ Map & Demographics
Woodbridge Map
Woodbridge Overview
$43,125
PER CAPITA INCOME
$121,356
AVG FAMILY INCOME
$103,481
AVG HOUSEHOLD INCOME
37.9%
WAGE / INCOME GAP [ % ]
62.1¢/ $1
WAGE / INCOME GAP [ $ ]
$11,893
FAMILY INCOME DEFICIT
0.36
INEQUALITY / GINI INDEX
20,927
TOTAL POPULATION
10,517
MALE POPULATION
10,410
FEMALE POPULATION
101.03
MALES / 100 FEMALES
98.98
FEMALES / 100 MALES
37.9
MEDIAN AGE
3.1
AVG FAMILY SIZE
2.7
AVG HOUSEHOLD SIZE
11,684
LABOR FORCE [ PEOPLE ]
69.4%
PERCENT IN LABOR FORCE
6.4%
UNEMPLOYMENT RATE
Woodbridge Zip Codes
Income in Woodbridge
Income Overview in Woodbridge
Per Capita Income in Woodbridge is $43,125, while median incomes of families and households are $121,356 and $103,481 respectively.
| Characteristic | Number | Measure |
| Per Capita Income | 20,927 | $43,125 |
| Median Family Income | 5,546 | $121,356 |
| Mean Family Income | 5,546 | $129,425 |
| Median Household Income | 7,812 | $103,481 |
| Mean Household Income | 7,812 | $114,854 |
| Income Deficit | 5,546 | $11,893 |
| Wage / Income Gap (%) | 20,927 | 37.89% |
| Wage / Income Gap ($) | 20,927 | 62.11¢ per $1 |
| Gini / Inequality Index | 20,927 | 0.36 |
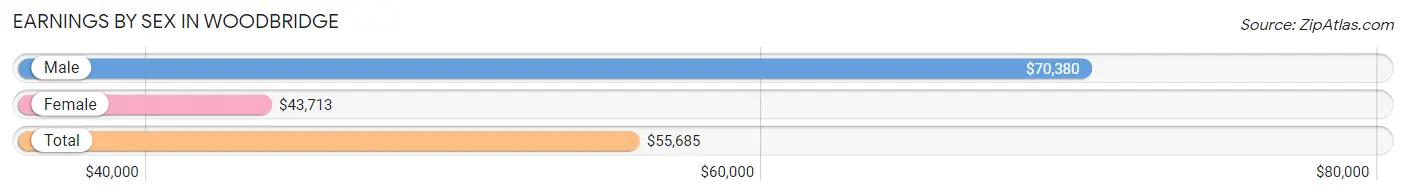
Earnings by Sex in Woodbridge
Average Earnings in Woodbridge are $55,685, $70,380 for men and $43,713 for women, a difference of 37.9%.
| Sex | Number | Average Earnings |
| Male | 6,461 (54.4%) | $70,380 |
| Female | 5,413 (45.6%) | $43,713 |
| Total | 11,874 (100.0%) | $55,685 |
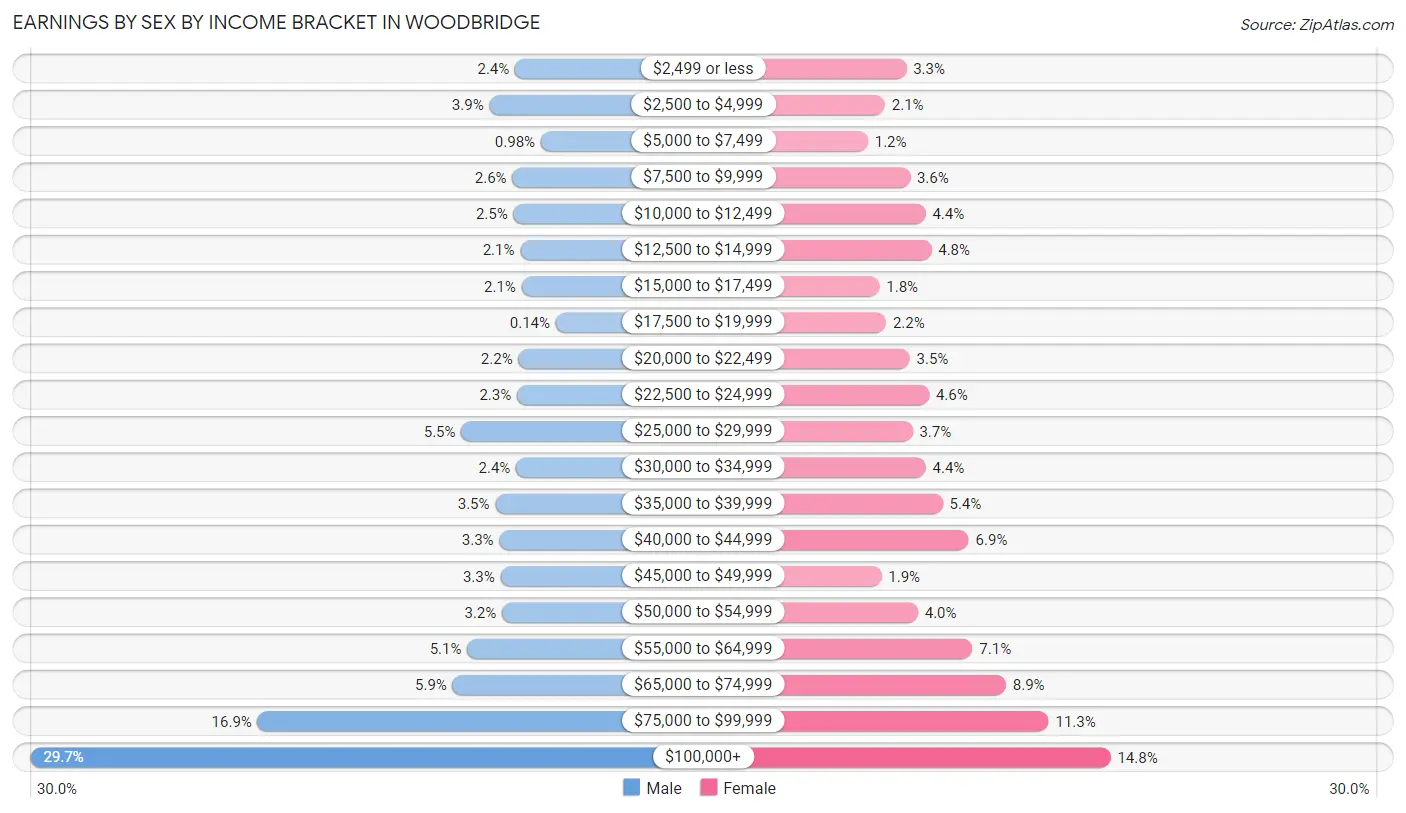
Earnings by Sex by Income Bracket in Woodbridge
The most common earnings brackets in Woodbridge are $100,000+ for men (1,917 | 29.7%) and $100,000+ for women (802 | 14.8%).
| Income | Male | Female |
| $2,499 or less | 157 (2.4%) | 181 (3.3%) |
| $2,500 to $4,999 | 250 (3.9%) | 116 (2.1%) |
| $5,000 to $7,499 | 63 (1.0%) | 64 (1.2%) |
| $7,500 to $9,999 | 167 (2.6%) | 192 (3.5%) |
| $10,000 to $12,499 | 163 (2.5%) | 239 (4.4%) |
| $12,500 to $14,999 | 138 (2.1%) | 257 (4.8%) |
| $15,000 to $17,499 | 133 (2.1%) | 99 (1.8%) |
| $17,500 to $19,999 | 9 (0.1%) | 119 (2.2%) |
| $20,000 to $22,499 | 145 (2.2%) | 191 (3.5%) |
| $22,500 to $24,999 | 150 (2.3%) | 250 (4.6%) |
| $25,000 to $29,999 | 352 (5.4%) | 200 (3.7%) |
| $30,000 to $34,999 | 153 (2.4%) | 240 (4.4%) |
| $35,000 to $39,999 | 229 (3.5%) | 291 (5.4%) |
| $40,000 to $44,999 | 214 (3.3%) | 371 (6.9%) |
| $45,000 to $49,999 | 210 (3.3%) | 105 (1.9%) |
| $50,000 to $54,999 | 204 (3.2%) | 216 (4.0%) |
| $55,000 to $64,999 | 331 (5.1%) | 382 (7.1%) |
| $65,000 to $74,999 | 384 (5.9%) | 484 (8.9%) |
| $75,000 to $99,999 | 1,092 (16.9%) | 614 (11.3%) |
| $100,000+ | 1,917 (29.7%) | 802 (14.8%) |
| Total | 6,461 (100.0%) | 5,413 (100.0%) |
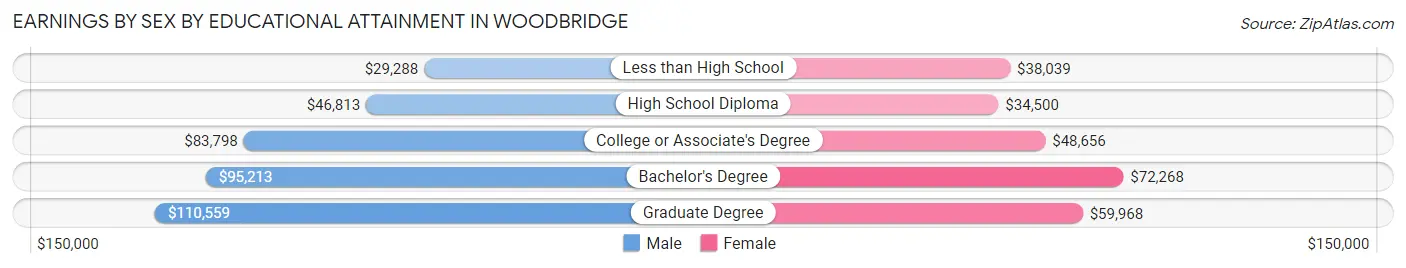
Earnings by Sex by Educational Attainment in Woodbridge
Average earnings in Woodbridge are $78,367 for men and $50,299 for women, a difference of 35.8%. Men with an educational attainment of graduate degree enjoy the highest average annual earnings of $110,559, while those with less than high school education earn the least with $29,288. Women with an educational attainment of bachelor's degree earn the most with the average annual earnings of $72,268, while those with high school diploma education have the smallest earnings of $34,500.
| Educational Attainment | Male Income | Female Income |
| Less than High School | $29,288 | $38,039 |
| High School Diploma | $46,813 | $34,500 |
| College or Associate's Degree | $83,798 | $48,656 |
| Bachelor's Degree | $95,213 | $72,268 |
| Graduate Degree | $110,559 | $59,968 |
| Total | $78,367 | $50,299 |
Family Income in Woodbridge
Family Income Brackets in Woodbridge
According to the Woodbridge family income data, there are 1,642 families falling into the $100,000 to $149,999 income range, which is the most common income bracket and makes up 29.6% of all families. Conversely, the less than $10,000 income bracket is the least frequent group with only 67 families (1.2%) belonging to this category.
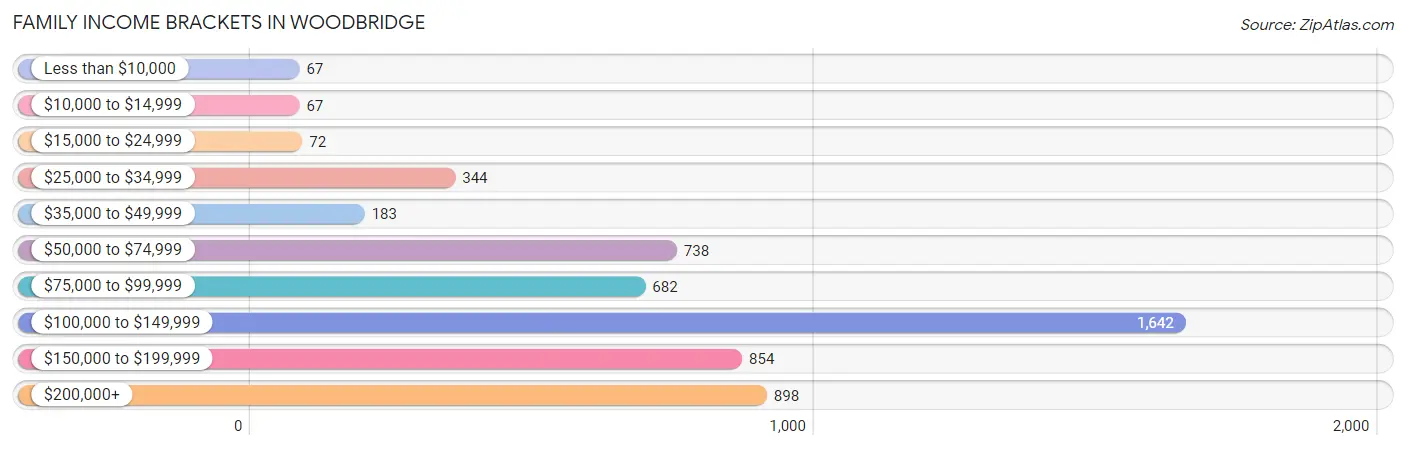
| Income Bracket | # Families | % Families |
| Less than $10,000 | 67 | 1.2% |
| $10,000 to $14,999 | 67 | 1.2% |
| $15,000 to $24,999 | 72 | 1.3% |
| $25,000 to $34,999 | 344 | 6.2% |
| $35,000 to $49,999 | 183 | 3.3% |
| $50,000 to $74,999 | 738 | 13.3% |
| $75,000 to $99,999 | 682 | 12.3% |
| $100,000 to $149,999 | 1,642 | 29.6% |
| $150,000 to $199,999 | 854 | 15.4% |
| $200,000+ | 898 | 16.2% |
Family Income by Famaliy Size in Woodbridge
7+ person families (106 | 1.9%) account for the highest median family income in Woodbridge with $193,214 per family, while 2-person families (1,916 | 34.5%) have the highest median income of $52,222 per family member.
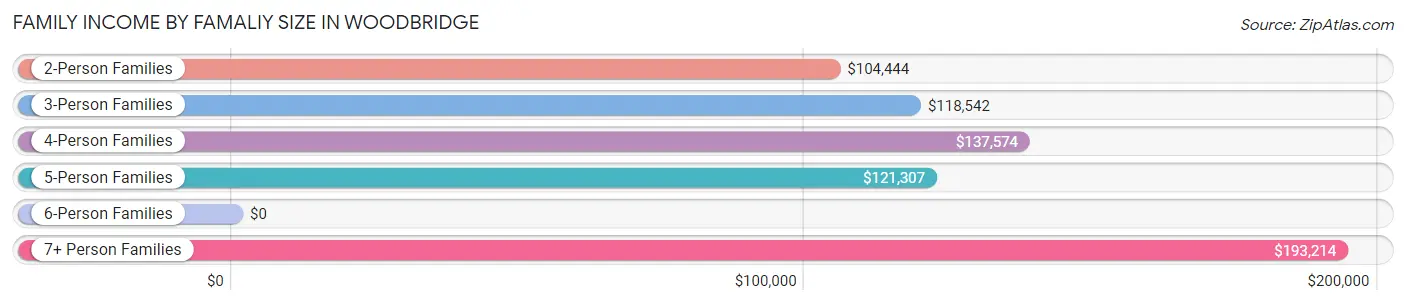
| Income Bracket | # Families | Median Income |
| 2-Person Families | 1,916 (34.5%) | $104,444 |
| 3-Person Families | 1,753 (31.6%) | $118,542 |
| 4-Person Families | 1,300 (23.4%) | $137,574 |
| 5-Person Families | 333 (6.0%) | $121,307 |
| 6-Person Families | 138 (2.5%) | $0 |
| 7+ Person Families | 106 (1.9%) | $193,214 |
| Total | 5,546 (100.0%) | $121,356 |
Family Income by Number of Earners in Woodbridge
The median family income in Woodbridge is $121,356, with families comprising 3+ earners (879) having the highest median family income of $158,843, while families with no earners (455) have the lowest median family income of $60,481, accounting for 15.9% and 8.2% of families, respectively.
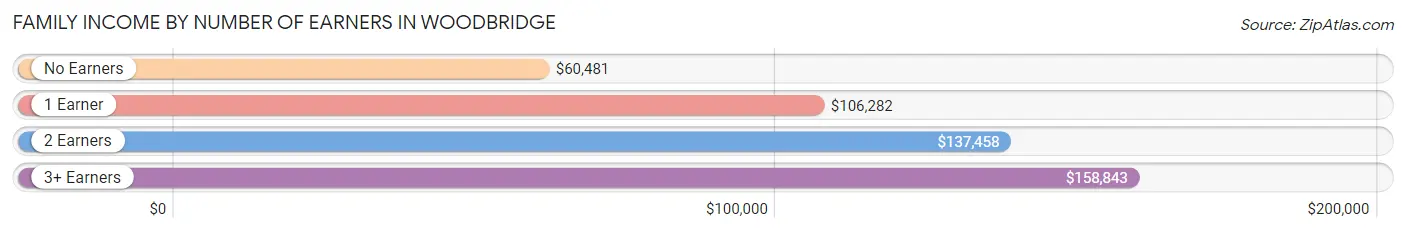
| Number of Earners | # Families | Median Income |
| No Earners | 455 (8.2%) | $60,481 |
| 1 Earner | 1,836 (33.1%) | $106,282 |
| 2 Earners | 2,376 (42.8%) | $137,458 |
| 3+ Earners | 879 (15.9%) | $158,843 |
| Total | 5,546 (100.0%) | $121,356 |
Household Income in Woodbridge
Household Income Brackets in Woodbridge
With 1,914 households falling in the category, the $100,000 to $149,999 income range is the most frequent in Woodbridge, accounting for 24.5% of all households. In contrast, only 133 households (1.7%) fall into the less than $10,000 income bracket, making it the least populous group.
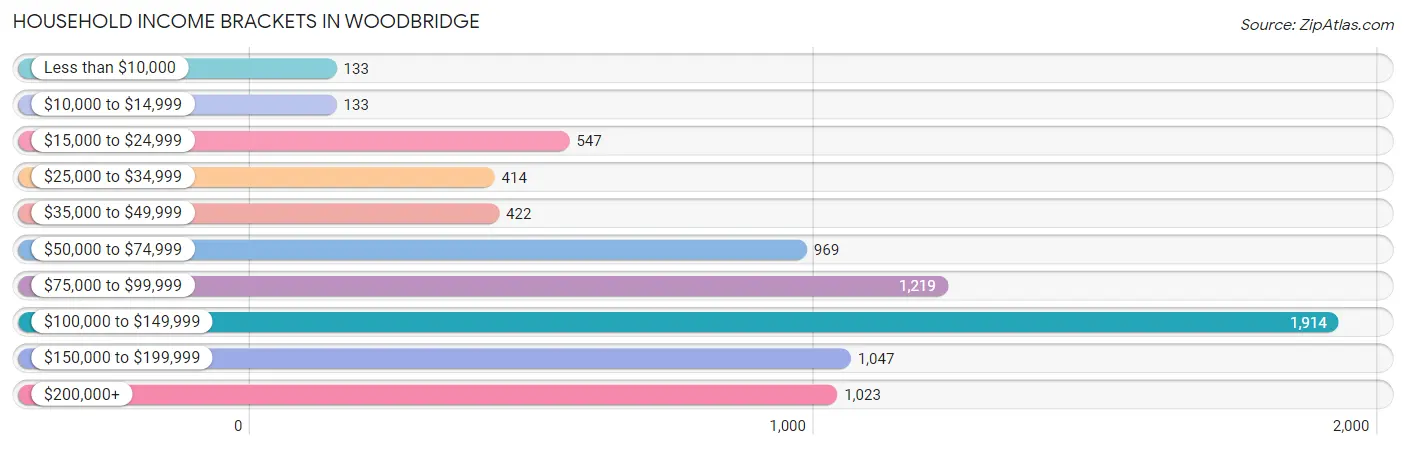
| Income Bracket | # Households | % Households |
| Less than $10,000 | 133 | 1.7% |
| $10,000 to $14,999 | 133 | 1.7% |
| $15,000 to $24,999 | 547 | 7.0% |
| $25,000 to $34,999 | 414 | 5.3% |
| $35,000 to $49,999 | 422 | 5.4% |
| $50,000 to $74,999 | 969 | 12.4% |
| $75,000 to $99,999 | 1,219 | 15.6% |
| $100,000 to $149,999 | 1,914 | 24.5% |
| $150,000 to $199,999 | 1,047 | 13.4% |
| $200,000+ | 1,023 | 13.1% |
Household Income by Householder Age in Woodbridge
The median household income in Woodbridge is $103,481, with the highest median household income of $120,661 found in the 45 to 64 years age bracket for the primary householder. A total of 3,288 households (42.1%) fall into this category. Meanwhile, the 15 to 24 years age bracket for the primary householder has the lowest median household income of $0, with 10 households (0.1%) in this group.
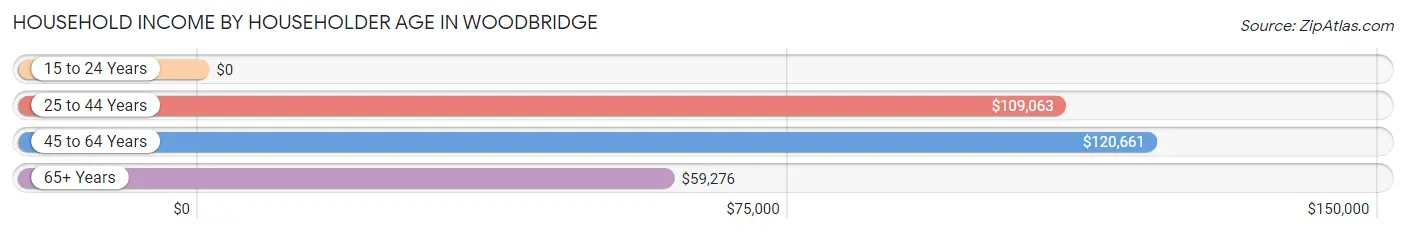
| Income Bracket | # Households | Median Income |
| 15 to 24 Years | 10 (0.1%) | $0 |
| 25 to 44 Years | 3,103 (39.7%) | $109,063 |
| 45 to 64 Years | 3,288 (42.1%) | $120,661 |
| 65+ Years | 1,411 (18.1%) | $59,276 |
| Total | 7,812 (100.0%) | $103,481 |
Poverty in Woodbridge
Income Below Poverty by Sex and Age in Woodbridge
With 5.4% poverty level for males and 6.1% for females among the residents of Woodbridge, 15 year old males and 12 to 14 year old females are the most vulnerable to poverty, with 47 males (46.1%) and 64 females (18.1%) in their respective age groups living below the poverty level.
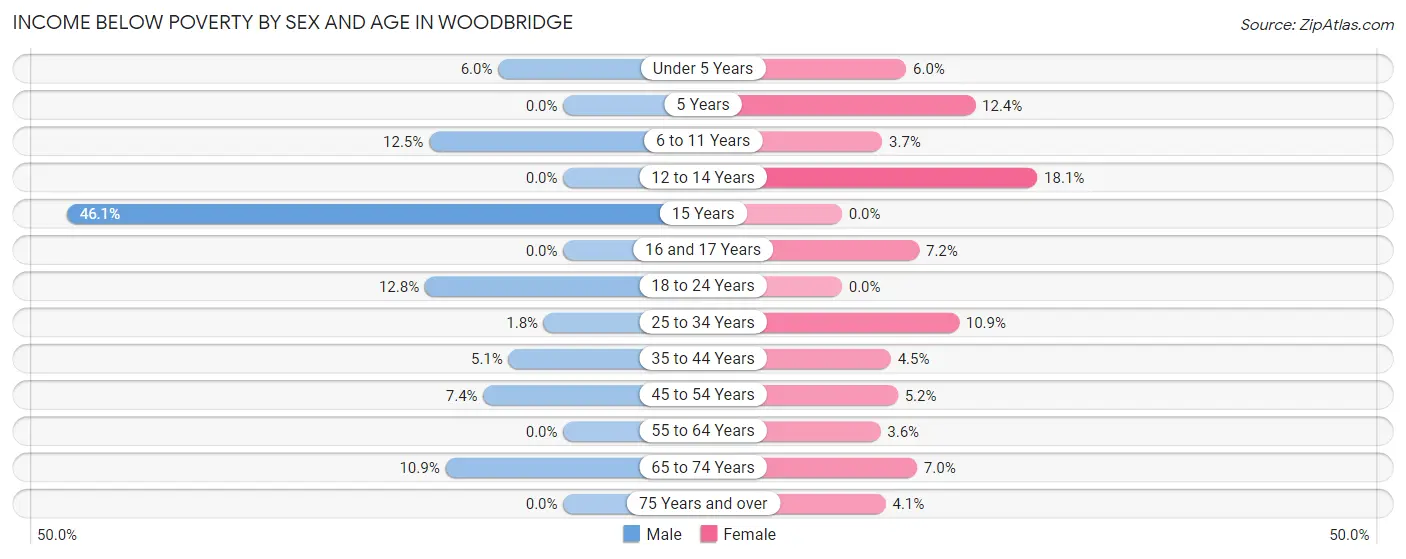
| Age Bracket | Male | Female |
| Under 5 Years | 44 (6.0%) | 45 (6.0%) |
| 5 Years | 0 (0.0%) | 23 (12.4%) |
| 6 to 11 Years | 81 (12.5%) | 23 (3.7%) |
| 12 to 14 Years | 0 (0.0%) | 64 (18.1%) |
| 15 Years | 47 (46.1%) | 0 (0.0%) |
| 16 and 17 Years | 0 (0.0%) | 19 (7.2%) |
| 18 to 24 Years | 89 (12.8%) | 0 (0.0%) |
| 25 to 34 Years | 30 (1.8%) | 171 (10.9%) |
| 35 to 44 Years | 84 (5.1%) | 69 (4.5%) |
| 45 to 54 Years | 120 (7.4%) | 92 (5.2%) |
| 55 to 64 Years | 0 (0.0%) | 43 (3.6%) |
| 65 to 74 Years | 65 (10.9%) | 60 (7.0%) |
| 75 Years and over | 0 (0.0%) | 22 (4.1%) |
| Total | 560 (5.4%) | 631 (6.1%) |
Income Above Poverty by Sex and Age in Woodbridge
According to the poverty statistics in Woodbridge, males aged 5 years and females aged 15 years are the age groups that are most secure financially, with 100.0% of males and 100.0% of females in these age groups living above the poverty line.
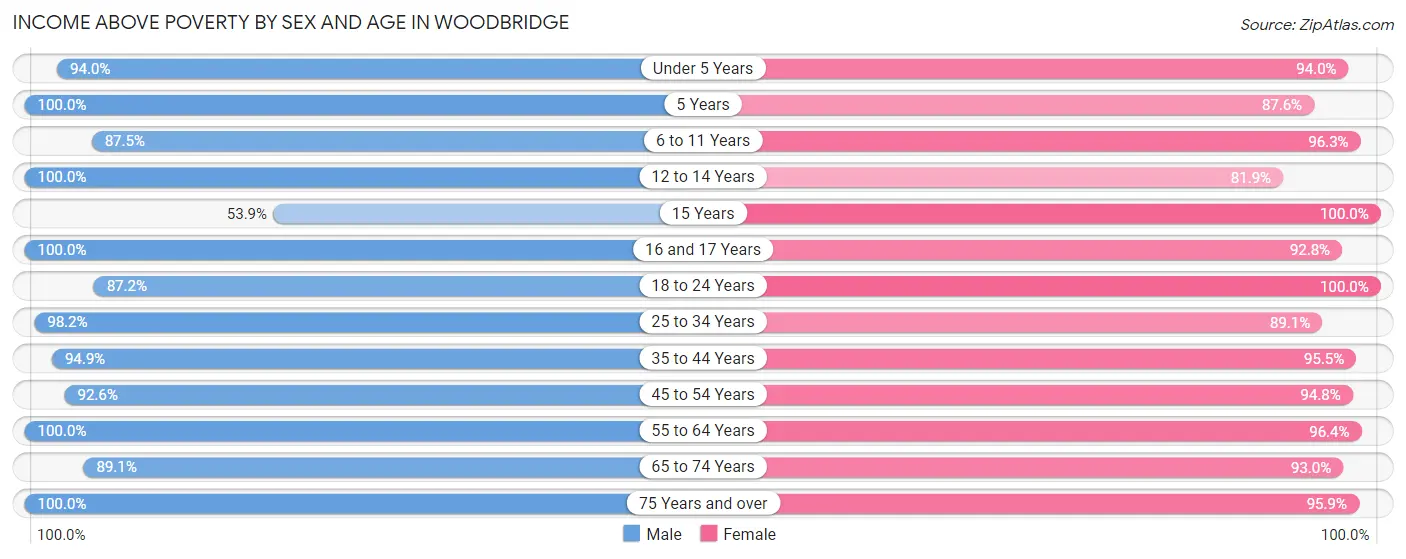
| Age Bracket | Male | Female |
| Under 5 Years | 685 (94.0%) | 709 (94.0%) |
| 5 Years | 132 (100.0%) | 163 (87.6%) |
| 6 to 11 Years | 569 (87.5%) | 592 (96.3%) |
| 12 to 14 Years | 437 (100.0%) | 289 (81.9%) |
| 15 Years | 55 (53.9%) | 14 (100.0%) |
| 16 and 17 Years | 549 (100.0%) | 246 (92.8%) |
| 18 to 24 Years | 604 (87.2%) | 661 (100.0%) |
| 25 to 34 Years | 1,636 (98.2%) | 1,404 (89.1%) |
| 35 to 44 Years | 1,569 (94.9%) | 1,451 (95.5%) |
| 45 to 54 Years | 1,497 (92.6%) | 1,681 (94.8%) |
| 55 to 64 Years | 1,061 (100.0%) | 1,157 (96.4%) |
| 65 to 74 Years | 529 (89.1%) | 801 (93.0%) |
| 75 Years and over | 569 (100.0%) | 520 (95.9%) |
| Total | 9,892 (94.6%) | 9,688 (93.9%) |
Income Below Poverty Among Married-Couple Families in Woodbridge
The poverty statistics for married-couple families in Woodbridge show that 2.1% or 82 of the total 3,937 families live below the poverty line. Families with no children have the highest poverty rate of 2.2%, comprising of 39 families. On the other hand, families with 3 or 4 children have the lowest poverty rate of 0.0%, which includes 0 families.
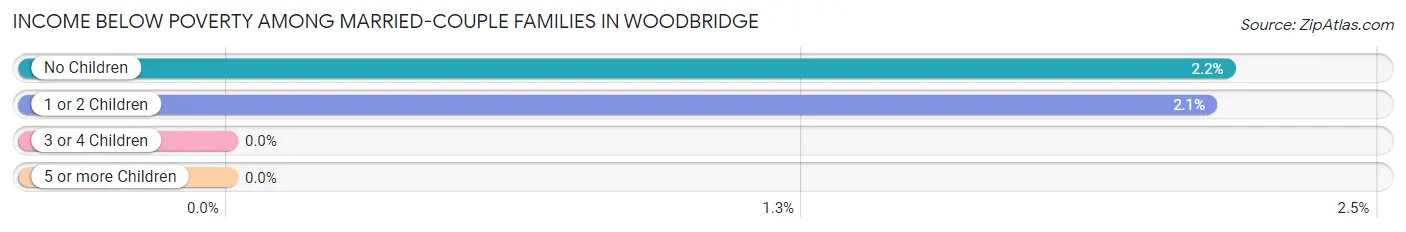
| Children | Above Poverty | Below Poverty |
| No Children | 1,760 (97.8%) | 39 (2.2%) |
| 1 or 2 Children | 1,973 (97.9%) | 43 (2.1%) |
| 3 or 4 Children | 104 (100.0%) | 0 (0.0%) |
| 5 or more Children | 18 (100.0%) | 0 (0.0%) |
| Total | 3,855 (97.9%) | 82 (2.1%) |
Income Below Poverty Among Single-Parent Households in Woodbridge

| Children | Single Father | Single Mother |
| No Children | 0 (0.0%) | 0 (0.0%) |
| 1 or 2 Children | 0 (0.0%) | 99 (19.1%) |
| 3 or 4 Children | 0 (0.0%) | 20 (18.0%) |
| 5 or more Children | 0 (0.0%) | 0 (0.0%) |
| Total | 0 (0.0%) | 119 (10.7%) |
Income Below Poverty Among Married-Couple vs Single-Parent Households in Woodbridge
The poverty data for Woodbridge shows that 82 of the married-couple family households (2.1%) and 119 of the single-parent households (7.4%) are living below the poverty level. Within the married-couple family households, those with no children have the highest poverty rate, with 39 households (2.2%) falling below the poverty line. Among the single-parent households, those with 3 or 4 children have the highest poverty rate, with 20 household (18.0%) living below poverty.
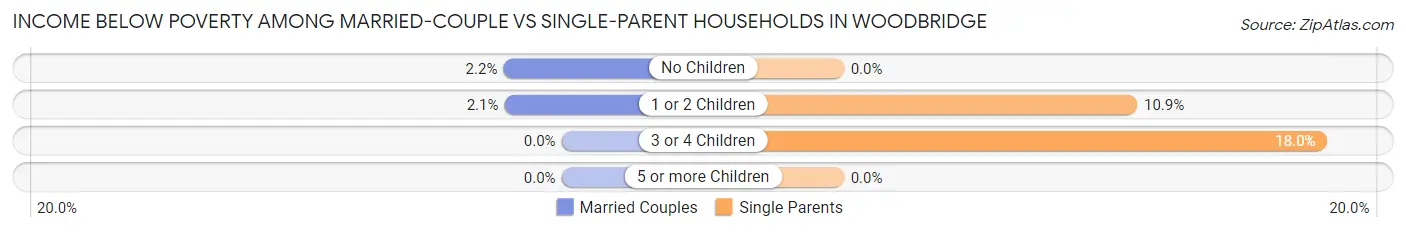
| Children | Married-Couple Families | Single-Parent Households |
| No Children | 39 (2.2%) | 0 (0.0%) |
| 1 or 2 Children | 43 (2.1%) | 99 (10.9%) |
| 3 or 4 Children | 0 (0.0%) | 20 (18.0%) |
| 5 or more Children | 0 (0.0%) | 0 (0.0%) |
| Total | 82 (2.1%) | 119 (7.4%) |
Race in Woodbridge
The most populous races in Woodbridge are White / Caucasian (11,162 | 53.3%), Hispanic or Latino (5,719 | 27.3%), and Asian (3,669 | 17.5%).
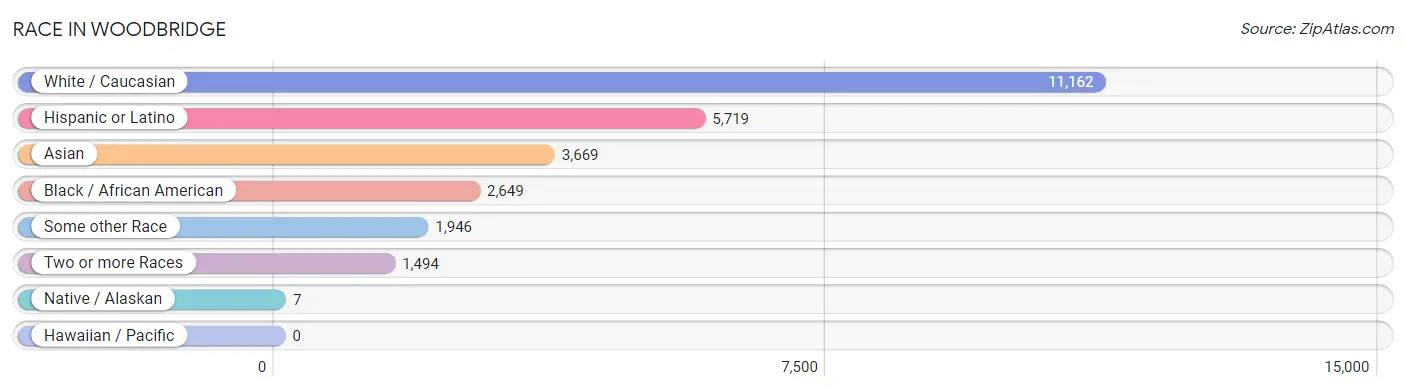
| Race | # Population | % Population |
| Asian | 3,669 | 17.5% |
| Black / African American | 2,649 | 12.7% |
| Hawaiian / Pacific | 0 | 0.0% |
| Hispanic or Latino | 5,719 | 27.3% |
| Native / Alaskan | 7 | 0.0% |
| White / Caucasian | 11,162 | 53.3% |
| Two or more Races | 1,494 | 7.1% |
| Some other Race | 1,946 | 9.3% |
| Total | 20,927 | 100.0% |
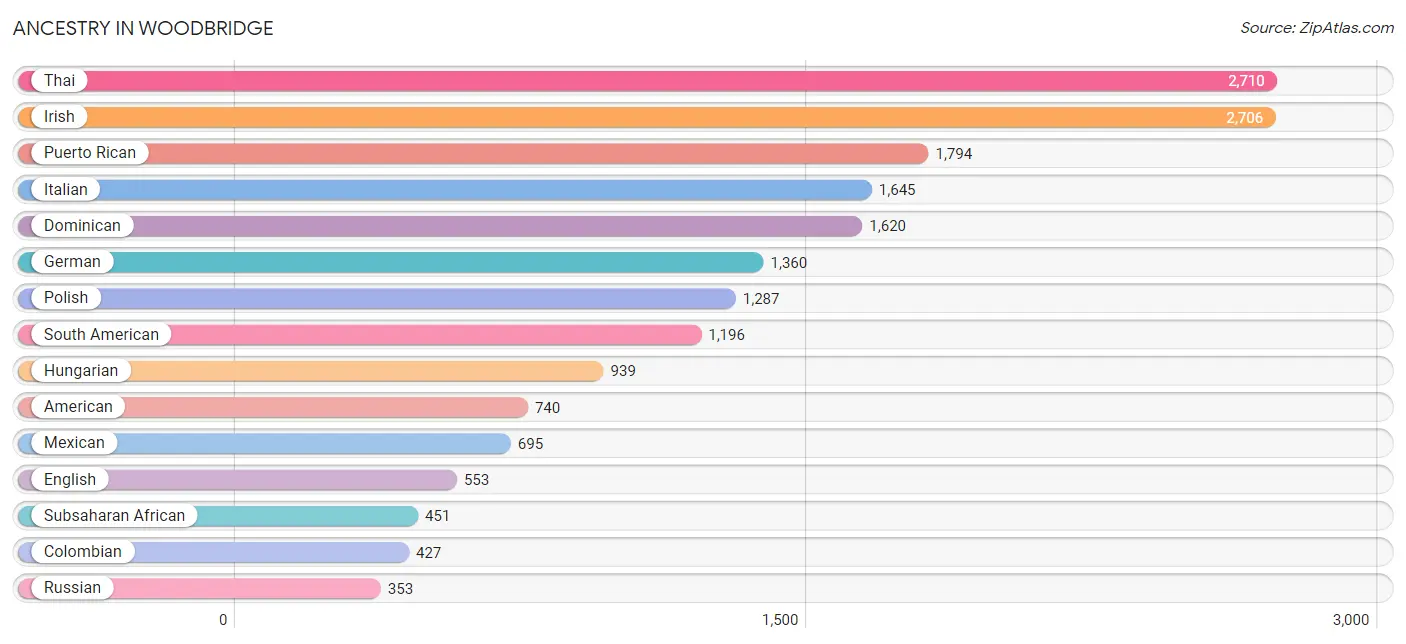
Ancestry in Woodbridge
The most populous ancestries reported in Woodbridge are Thai (2,710 | 13.0%), Irish (2,706 | 12.9%), Puerto Rican (1,794 | 8.6%), Italian (1,645 | 7.9%), and Dominican (1,620 | 7.7%), together accounting for 50.1% of all Woodbridge residents.
| Ancestry | # Population | % Population |
| Afghan | 21 | 0.1% |
| African | 236 | 1.1% |
| American | 740 | 3.5% |
| Arab | 140 | 0.7% |
| Argentinean | 331 | 1.6% |
| Armenian | 38 | 0.2% |
| Austrian | 62 | 0.3% |
| Bhutanese | 37 | 0.2% |
| Bolivian | 42 | 0.2% |
| Brazilian | 41 | 0.2% |
| British | 68 | 0.3% |
| Burmese | 150 | 0.7% |
| Cambodian | 16 | 0.1% |
| Central American | 227 | 1.1% |
| Central American Indian | 233 | 1.1% |
| Chilean | 14 | 0.1% |
| Colombian | 427 | 2.0% |
| Cuban | 91 | 0.4% |
| Czech | 75 | 0.4% |
| Czechoslovakian | 129 | 0.6% |
| Danish | 62 | 0.3% |
| Dominican | 1,620 | 7.7% |
| Dutch | 16 | 0.1% |
| Eastern European | 51 | 0.2% |
| Ecuadorian | 255 | 1.2% |
| Egyptian | 106 | 0.5% |
| English | 553 | 2.6% |
| Ethiopian | 56 | 0.3% |
| European | 97 | 0.5% |
| Finnish | 47 | 0.2% |
| French | 123 | 0.6% |
| French Canadian | 6 | 0.0% |
| German | 1,360 | 6.5% |
| Greek | 57 | 0.3% |
| Guyanese | 12 | 0.1% |
| Haitian | 257 | 1.2% |
| Honduran | 56 | 0.3% |
| Hungarian | 939 | 4.5% |
| Indian (Asian) | 246 | 1.2% |
| Iranian | 51 | 0.2% |
| Iraqi | 25 | 0.1% |
| Irish | 2,706 | 12.9% |
| Italian | 1,645 | 7.9% |
| Jamaican | 79 | 0.4% |
| Japanese | 17 | 0.1% |
| Korean | 351 | 1.7% |
| Lebanese | 9 | 0.0% |
| Lithuanian | 40 | 0.2% |
| Mexican | 695 | 3.3% |
| Mexican American Indian | 5 | 0.0% |
| Nigerian | 65 | 0.3% |
| Northern European | 16 | 0.1% |
| Norwegian | 53 | 0.3% |
| Panamanian | 82 | 0.4% |
| Pennsylvania German | 50 | 0.2% |
| Peruvian | 105 | 0.5% |
| Polish | 1,287 | 6.1% |
| Portuguese | 143 | 0.7% |
| Puerto Rican | 1,794 | 8.6% |
| Romanian | 62 | 0.3% |
| Russian | 353 | 1.7% |
| Salvadoran | 89 | 0.4% |
| Scotch-Irish | 24 | 0.1% |
| Scottish | 119 | 0.6% |
| Serbian | 24 | 0.1% |
| Slovak | 110 | 0.5% |
| South African | 16 | 0.1% |
| South American | 1,196 | 5.7% |
| South American Indian | 15 | 0.1% |
| Spaniard | 16 | 0.1% |
| Sri Lankan | 90 | 0.4% |
| Subsaharan African | 451 | 2.2% |
| Swedish | 146 | 0.7% |
| Thai | 2,710 | 13.0% |
| Trinidadian and Tobagonian | 4 | 0.0% |
| Turkish | 85 | 0.4% |
| Ukrainian | 345 | 1.7% |
| Uruguayan | 6 | 0.0% |
| Venezuelan | 16 | 0.1% |
| Welsh | 69 | 0.3% |
| West Indian | 106 | 0.5% | View All 81 Rows |
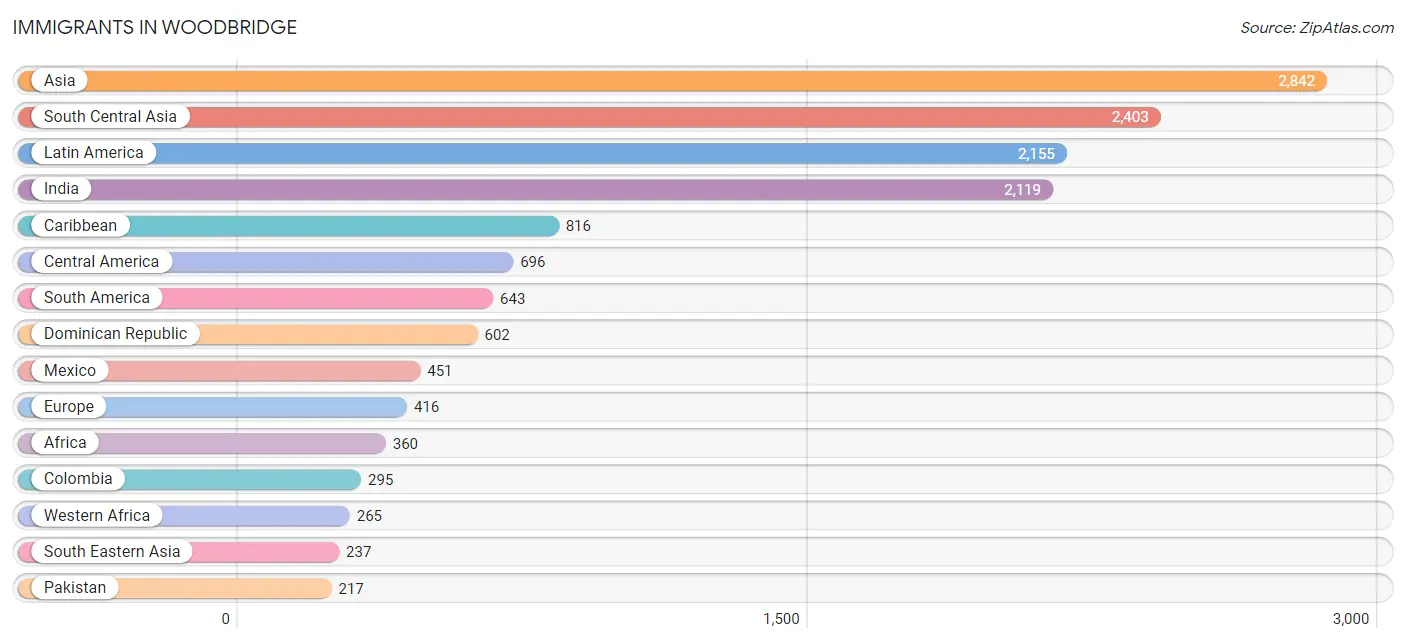
Immigrants in Woodbridge
The most numerous immigrant groups reported in Woodbridge came from Asia (2,842 | 13.6%), South Central Asia (2,403 | 11.5%), Latin America (2,155 | 10.3%), India (2,119 | 10.1%), and Caribbean (816 | 3.9%), together accounting for 49.4% of all Woodbridge residents.
| Immigration Origin | # Population | % Population |
| Africa | 360 | 1.7% |
| Argentina | 134 | 0.6% |
| Asia | 2,842 | 13.6% |
| Bangladesh | 32 | 0.2% |
| Brazil | 38 | 0.2% |
| Cambodia | 6 | 0.0% |
| Caribbean | 816 | 3.9% |
| Central America | 696 | 3.3% |
| Chile | 14 | 0.1% |
| China | 63 | 0.3% |
| Colombia | 295 | 1.4% |
| Cuba | 11 | 0.1% |
| Czechoslovakia | 12 | 0.1% |
| Dominican Republic | 602 | 2.9% |
| Eastern Africa | 52 | 0.3% |
| Eastern Asia | 109 | 0.5% |
| Eastern Europe | 183 | 0.9% |
| Ecuador | 96 | 0.5% |
| Egypt | 43 | 0.2% |
| El Salvador | 107 | 0.5% |
| England | 37 | 0.2% |
| Europe | 416 | 2.0% |
| Germany | 75 | 0.4% |
| Grenada | 13 | 0.1% |
| Haiti | 74 | 0.4% |
| Honduras | 56 | 0.3% |
| Hong Kong | 28 | 0.1% |
| Hungary | 15 | 0.1% |
| India | 2,119 | 10.1% |
| Iran | 34 | 0.2% |
| Ireland | 9 | 0.0% |
| Italy | 15 | 0.1% |
| Jamaica | 79 | 0.4% |
| Korea | 46 | 0.2% |
| Kuwait | 6 | 0.0% |
| Latin America | 2,155 | 10.3% |
| Mexico | 451 | 2.2% |
| Nigeria | 181 | 0.9% |
| Northern Africa | 43 | 0.2% |
| Northern Europe | 69 | 0.3% |
| Pakistan | 217 | 1.0% |
| Panama | 82 | 0.4% |
| Peru | 60 | 0.3% |
| Philippines | 146 | 0.7% |
| Poland | 138 | 0.7% |
| Portugal | 55 | 0.3% |
| Russia | 10 | 0.1% |
| Scotland | 8 | 0.0% |
| Sierra Leone | 84 | 0.4% |
| South America | 643 | 3.1% |
| South Central Asia | 2,403 | 11.5% |
| South Eastern Asia | 237 | 1.1% |
| Southern Europe | 70 | 0.3% |
| Sri Lanka | 1 | 0.0% |
| Switzerland | 19 | 0.1% |
| Trinidad and Tobago | 11 | 0.1% |
| Turkey | 43 | 0.2% |
| Uruguay | 6 | 0.0% |
| Vietnam | 85 | 0.4% |
| Western Africa | 265 | 1.3% |
| Western Asia | 93 | 0.4% |
| Western Europe | 94 | 0.4% | View All 62 Rows |
Sex and Age in Woodbridge
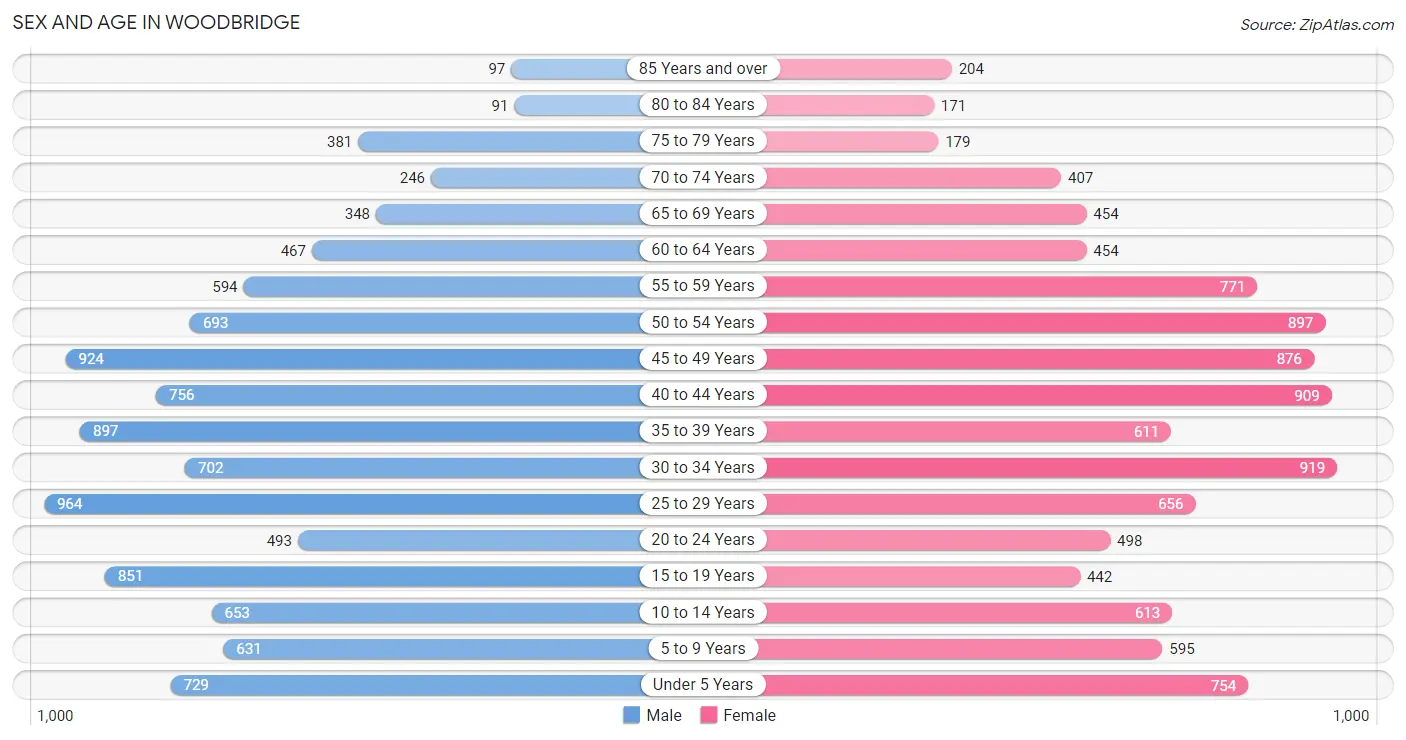
Sex and Age in Woodbridge
The most populous age groups in Woodbridge are 25 to 29 Years (964 | 9.2%) for men and 30 to 34 Years (919 | 8.8%) for women.
| Age Bracket | Male | Female |
| Under 5 Years | 729 (6.9%) | 754 (7.2%) |
| 5 to 9 Years | 631 (6.0%) | 595 (5.7%) |
| 10 to 14 Years | 653 (6.2%) | 613 (5.9%) |
| 15 to 19 Years | 851 (8.1%) | 442 (4.3%) |
| 20 to 24 Years | 493 (4.7%) | 498 (4.8%) |
| 25 to 29 Years | 964 (9.2%) | 656 (6.3%) |
| 30 to 34 Years | 702 (6.7%) | 919 (8.8%) |
| 35 to 39 Years | 897 (8.5%) | 611 (5.9%) |
| 40 to 44 Years | 756 (7.2%) | 909 (8.7%) |
| 45 to 49 Years | 924 (8.8%) | 876 (8.4%) |
| 50 to 54 Years | 693 (6.6%) | 897 (8.6%) |
| 55 to 59 Years | 594 (5.7%) | 771 (7.4%) |
| 60 to 64 Years | 467 (4.4%) | 454 (4.4%) |
| 65 to 69 Years | 348 (3.3%) | 454 (4.4%) |
| 70 to 74 Years | 246 (2.3%) | 407 (3.9%) |
| 75 to 79 Years | 381 (3.6%) | 179 (1.7%) |
| 80 to 84 Years | 91 (0.9%) | 171 (1.6%) |
| 85 Years and over | 97 (0.9%) | 204 (2.0%) |
| Total | 10,517 (100.0%) | 10,410 (100.0%) |
Families and Households in Woodbridge
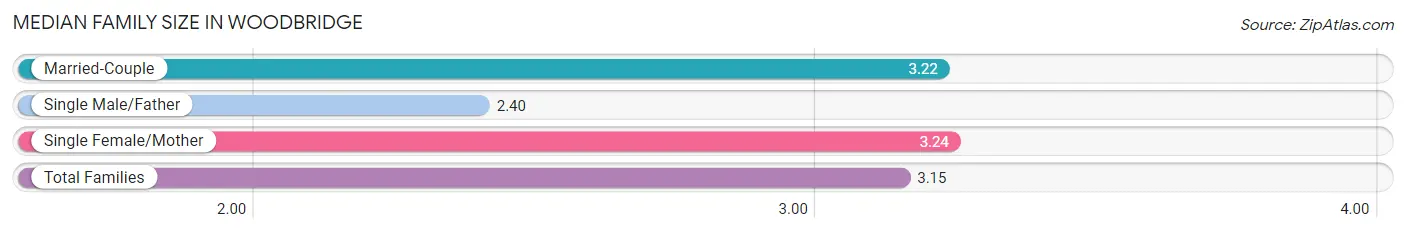
Median Family Size in Woodbridge
The median family size in Woodbridge is 3.15 persons per family, with single female/mother families (1,116 | 20.1%) accounting for the largest median family size of 3.24 persons per family. On the other hand, single male/father families (493 | 8.9%) represent the smallest median family size with 2.40 persons per family.
| Family Type | # Families | Family Size |
| Married-Couple | 3,937 (71.0%) | 3.22 |
| Single Male/Father | 493 (8.9%) | 2.40 |
| Single Female/Mother | 1,116 (20.1%) | 3.24 |
| Total Families | 5,546 (100.0%) | 3.15 |
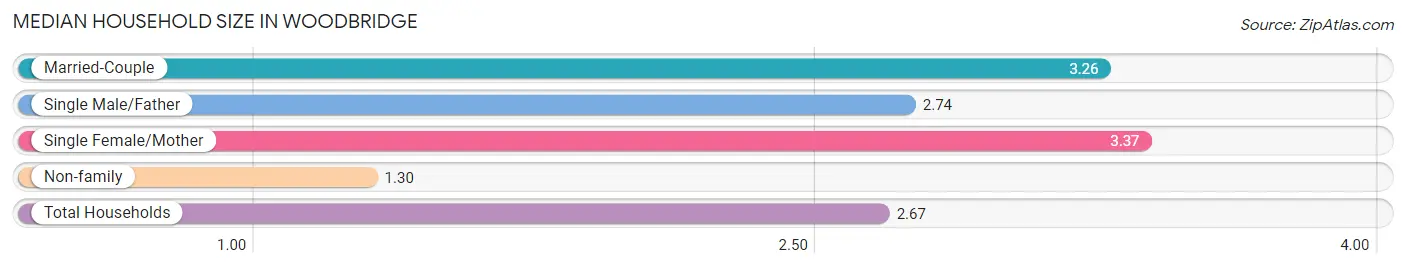
Median Household Size in Woodbridge
The median household size in Woodbridge is 2.67 persons per household, with single female/mother households (1,116 | 14.3%) accounting for the largest median household size of 3.37 persons per household. non-family households (2,266 | 29.0%) represent the smallest median household size with 1.30 persons per household.
| Household Type | # Households | Household Size |
| Married-Couple | 3,937 (50.4%) | 3.26 |
| Single Male/Father | 493 (6.3%) | 2.74 |
| Single Female/Mother | 1,116 (14.3%) | 3.37 |
| Non-family | 2,266 (29.0%) | 1.30 |
| Total Households | 7,812 (100.0%) | 2.67 |
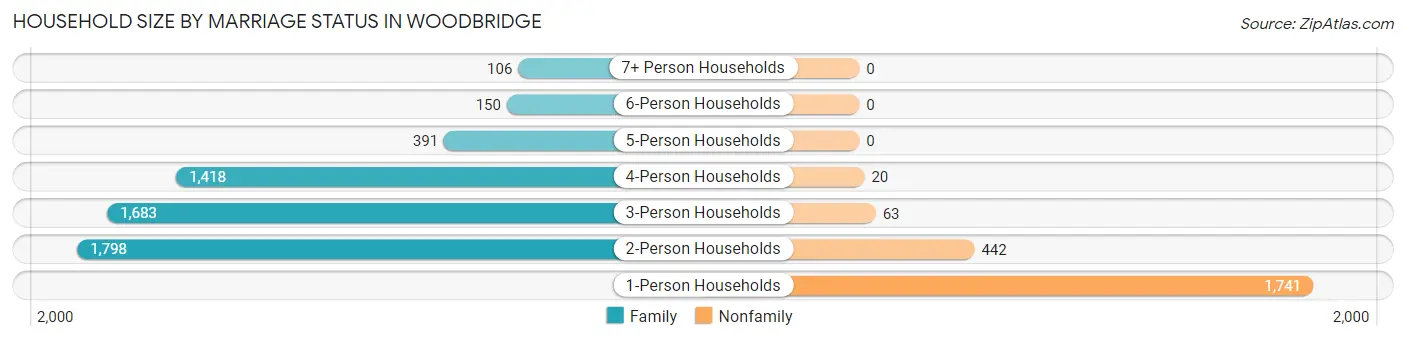
Household Size by Marriage Status in Woodbridge
Out of a total of 7,812 households in Woodbridge, 5,546 (71.0%) are family households, while 2,266 (29.0%) are nonfamily households. The most numerous type of family households are 2-person households, comprising 1,798, and the most common type of nonfamily households are 1-person households, comprising 1,741.
| Household Size | Family Households | Nonfamily Households |
| 1-Person Households | - | 1,741 (22.3%) |
| 2-Person Households | 1,798 (23.0%) | 442 (5.7%) |
| 3-Person Households | 1,683 (21.5%) | 63 (0.8%) |
| 4-Person Households | 1,418 (18.1%) | 20 (0.3%) |
| 5-Person Households | 391 (5.0%) | 0 (0.0%) |
| 6-Person Households | 150 (1.9%) | 0 (0.0%) |
| 7+ Person Households | 106 (1.4%) | 0 (0.0%) |
| Total | 5,546 (71.0%) | 2,266 (29.0%) |
Female Fertility in Woodbridge
Fertility by Age in Woodbridge
Average fertility rate in Woodbridge is 48.0 births per 1,000 women. Women in the age bracket of 20 to 34 years have the highest fertility rate with 75.0 births per 1,000 women. Women in the age bracket of 20 to 34 years acount for 64.3% of all women with births.
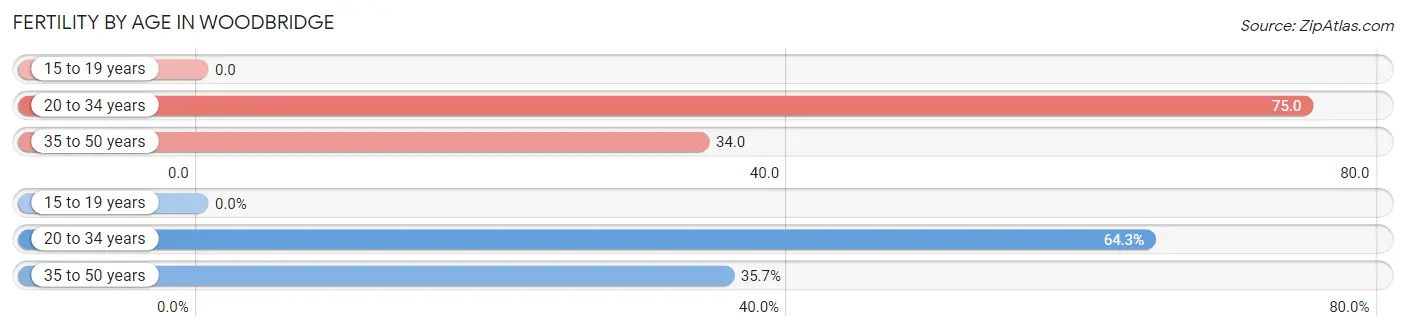
| Age Bracket | Women with Births | Births / 1,000 Women |
| 15 to 19 years | 0 (0.0%) | 0.0 |
| 20 to 34 years | 155 (64.3%) | 75.0 |
| 35 to 50 years | 86 (35.7%) | 34.0 |
| Total | 241 (100.0%) | 48.0 |
Fertility by Age by Marriage Status in Woodbridge
84.2% of women with births (241) in Woodbridge are married. The highest percentage of unmarried women with births falls into 35 to 50 years age bracket with 29.1% of them unmarried at the time of birth, while the lowest percentage of unmarried women with births belong to 20 to 34 years age bracket with 8.4% of them unmarried.
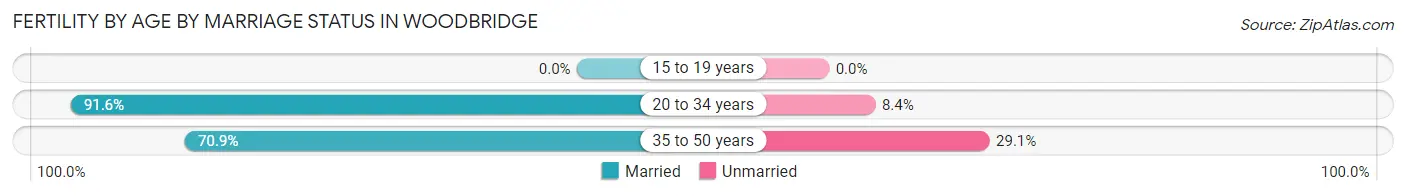
| Age Bracket | Married | Unmarried |
| 15 to 19 years | 0 (0.0%) | 0 (0.0%) |
| 20 to 34 years | 142 (91.6%) | 13 (8.4%) |
| 35 to 50 years | 61 (70.9%) | 25 (29.1%) |
| Total | 203 (84.2%) | 38 (15.8%) |
Fertility by Education in Woodbridge
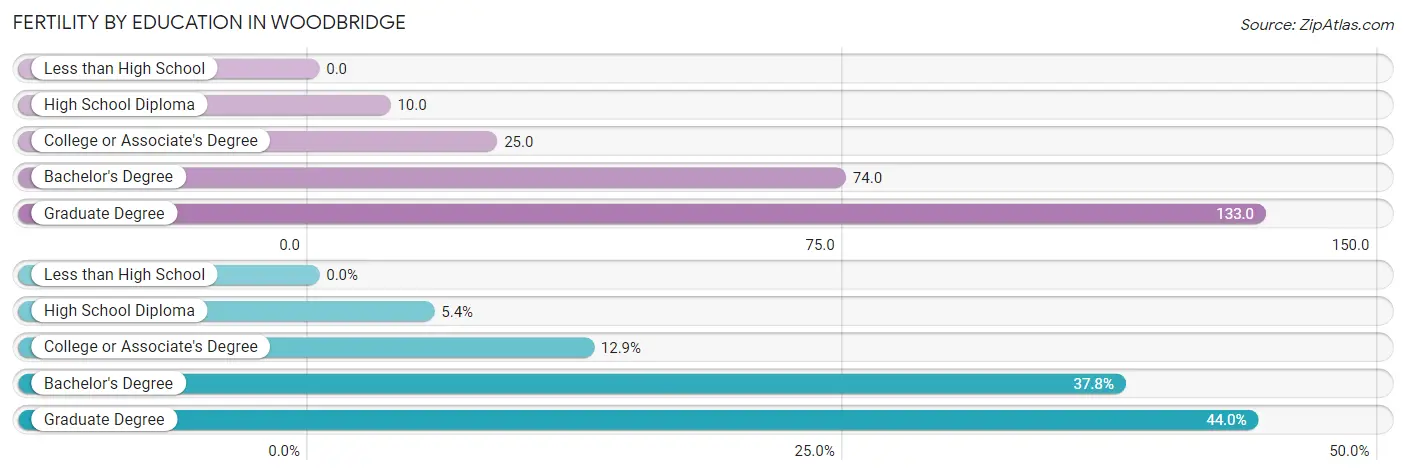
| Educational Attainment | Women with Births | Births / 1,000 Women |
| Less than High School | 0 (0.0%) | 0.0 |
| High School Diploma | 13 (5.4%) | 10.0 |
| College or Associate's Degree | 31 (12.9%) | 25.0 |
| Bachelor's Degree | 91 (37.8%) | 74.0 |
| Graduate Degree | 106 (44.0%) | 133.0 |
| Total | 241 (100.0%) | 48.0 |
Fertility by Education by Marriage Status in Woodbridge
15.8% of women with births in Woodbridge are unmarried. Women with the educational attainment of bachelor's degree are most likely to be married with 100.0% of them married at childbirth, while women with the educational attainment of high school diploma are least likely to be married with 100.0% of them unmarried at childbirth.
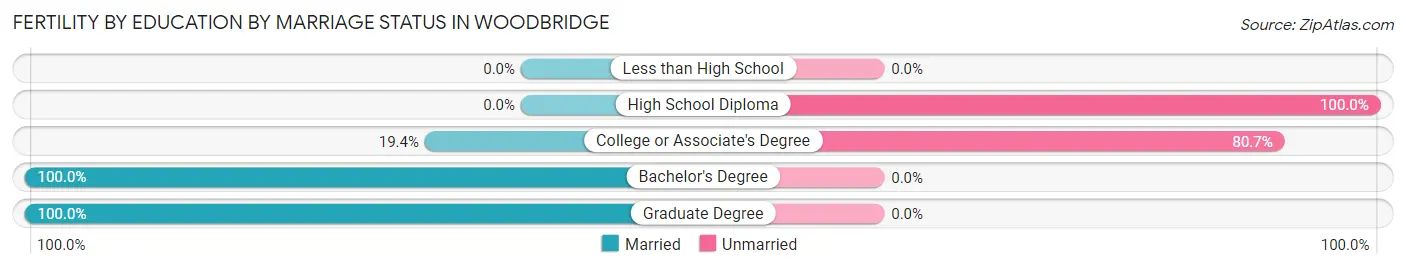
| Educational Attainment | Married | Unmarried |
| Less than High School | 0 (0.0%) | 0 (0.0%) |
| High School Diploma | 0 (0.0%) | 13 (100.0%) |
| College or Associate's Degree | 6 (19.4%) | 25 (80.6%) |
| Bachelor's Degree | 91 (100.0%) | 0 (0.0%) |
| Graduate Degree | 106 (100.0%) | 0 (0.0%) |
| Total | 203 (84.2%) | 38 (15.8%) |
Employment Characteristics in Woodbridge
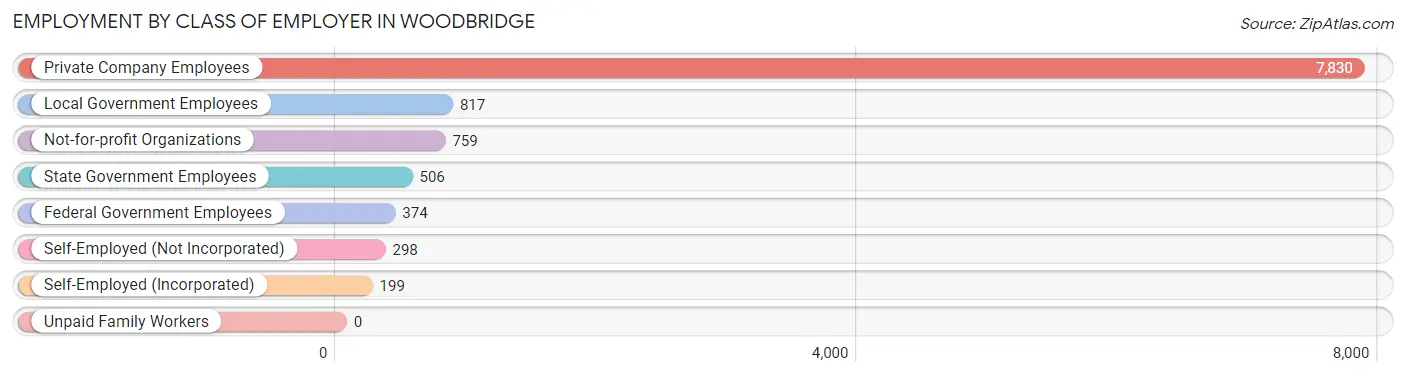
Employment by Class of Employer in Woodbridge
Among the 10,783 employed individuals in Woodbridge, private company employees (7,830 | 72.6%), local government employees (817 | 7.6%), and not-for-profit organizations (759 | 7.0%) make up the most common classes of employment.
| Employer Class | # Employees | % Employees |
| Private Company Employees | 7,830 | 72.6% |
| Self-Employed (Incorporated) | 199 | 1.8% |
| Self-Employed (Not Incorporated) | 298 | 2.8% |
| Not-for-profit Organizations | 759 | 7.0% |
| Local Government Employees | 817 | 7.6% |
| State Government Employees | 506 | 4.7% |
| Federal Government Employees | 374 | 3.5% |
| Unpaid Family Workers | 0 | 0.0% |
| Total | 10,783 | 100.0% |
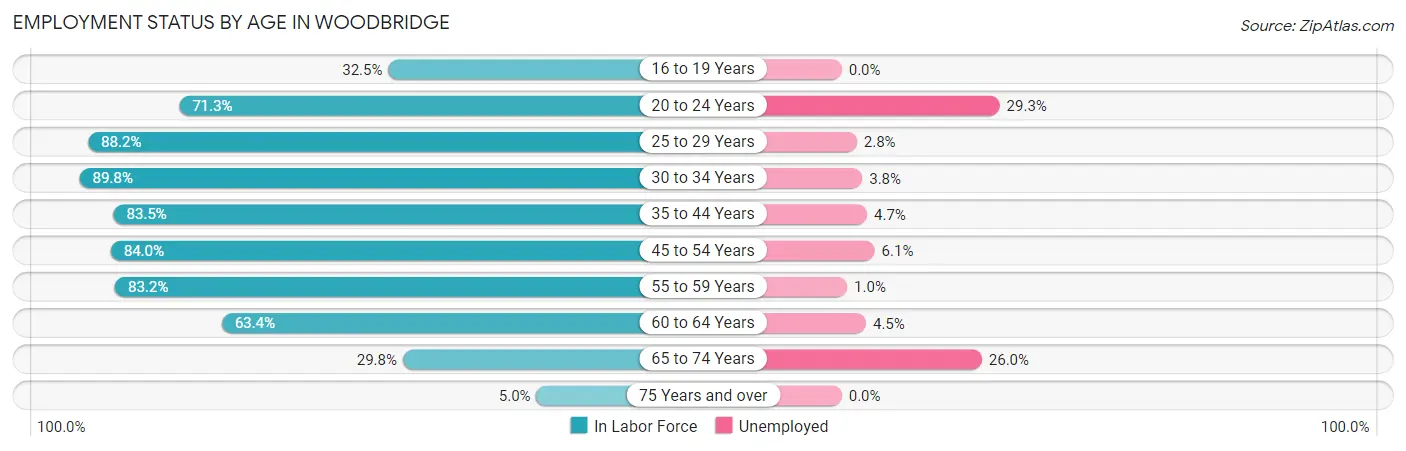
Employment Status by Age in Woodbridge
According to the labor force statistics for Woodbridge, out of the total population over 16 years of age (16,836), 69.4% or 11,684 individuals are in the labor force, with 6.4% or 748 of them unemployed. The age group with the highest labor force participation rate is 30 to 34 years, with 89.8% or 1,456 individuals in the labor force. Within the labor force, the 20 to 24 years age range has the highest percentage of unemployed individuals, with 29.3% or 207 of them being unemployed.
| Age Bracket | In Labor Force | Unemployed |
| 16 to 19 Years | 383 (32.5%) | 0 (0.0%) |
| 20 to 24 Years | 707 (71.3%) | 207 (29.3%) |
| 25 to 29 Years | 1,429 (88.2%) | 40 (2.8%) |
| 30 to 34 Years | 1,456 (89.8%) | 55 (3.8%) |
| 35 to 44 Years | 2,649 (83.5%) | 125 (4.7%) |
| 45 to 54 Years | 2,848 (84.0%) | 174 (6.1%) |
| 55 to 59 Years | 1,136 (83.2%) | 11 (1.0%) |
| 60 to 64 Years | 584 (63.4%) | 26 (4.5%) |
| 65 to 74 Years | 434 (29.8%) | 113 (26.0%) |
| 75 Years and over | 56 (5.0%) | 0 (0.0%) |
| Total | 11,684 (69.4%) | 748 (6.4%) |
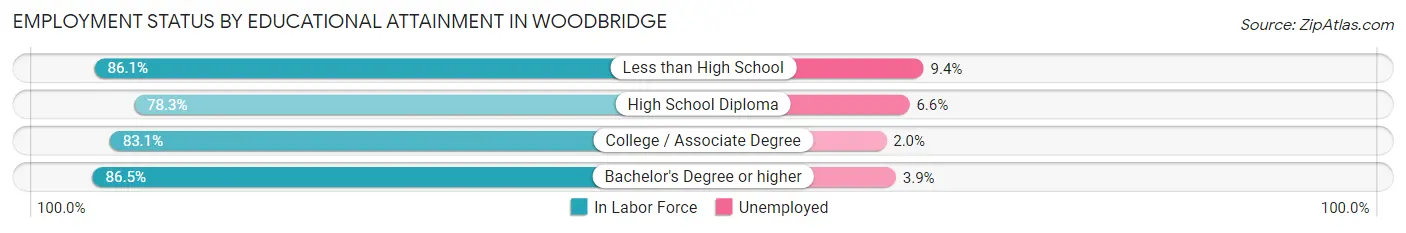
Employment Status by Educational Attainment in Woodbridge
According to labor force statistics for Woodbridge, 83.5% of individuals (10,095) out of the total population between 25 and 64 years of age (12,090) are in the labor force, with 4.3% or 434 of them being unemployed. The group with the highest labor force participation rate are those with the educational attainment of bachelor's degree or higher, with 86.5% or 4,241 individuals in the labor force. Within the labor force, individuals with less than high school education have the highest percentage of unemployment, with 9.4% or 61 of them being unemployed.
| Educational Attainment | In Labor Force | Unemployed |
| Less than High School | 651 (86.1%) | 71 (9.4%) |
| High School Diploma | 2,283 (78.3%) | 192 (6.6%) |
| College / Associate Degree | 2,921 (83.1%) | 70 (2.0%) |
| Bachelor's Degree or higher | 4,241 (86.5%) | 191 (3.9%) |
| Total | 10,095 (83.5%) | 520 (4.3%) |
Employment Occupations by Sex in Woodbridge
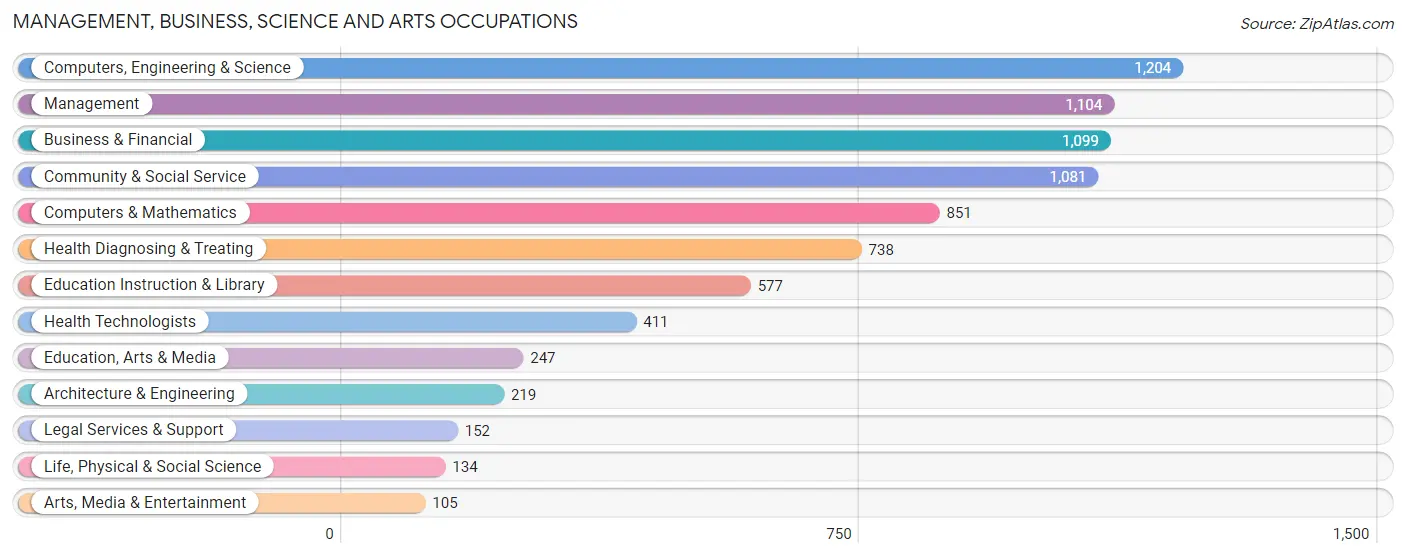
Management, Business, Science and Arts Occupations
The most common Management, Business, Science and Arts occupations in Woodbridge are Computers, Engineering & Science (1,204 | 11.0%), Management (1,104 | 10.1%), Business & Financial (1,099 | 10.1%), Community & Social Service (1,081 | 9.9%), and Computers & Mathematics (851 | 7.8%).
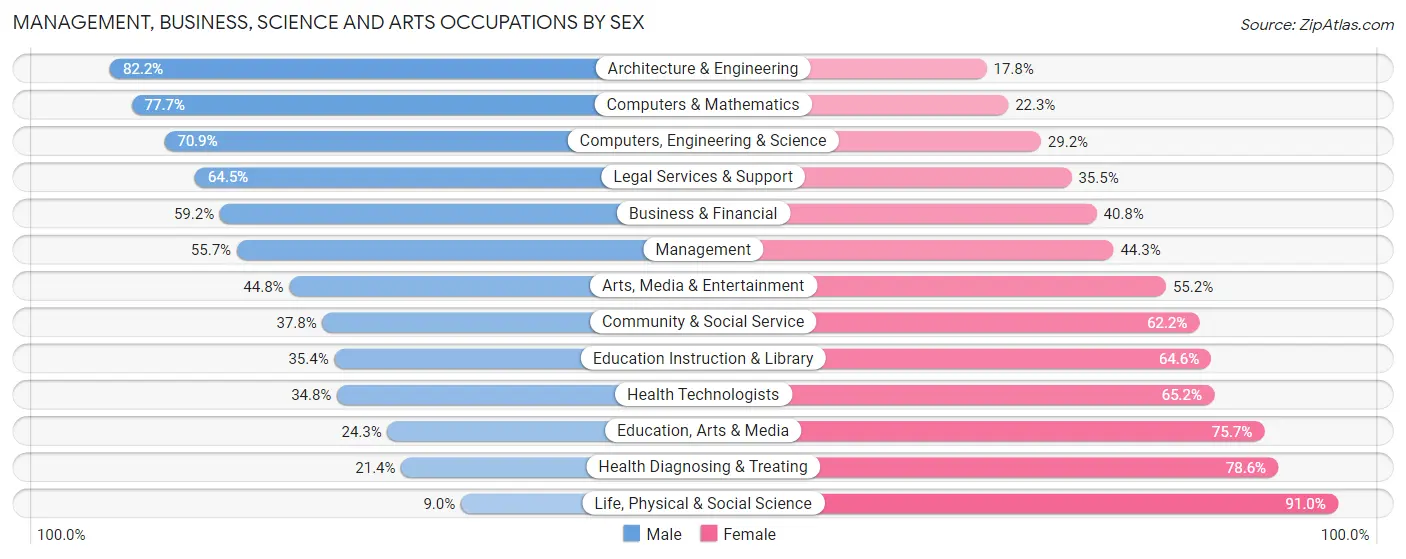
Management, Business, Science and Arts Occupations by Sex
Within the Management, Business, Science and Arts occupations in Woodbridge, the most male-oriented occupations are Architecture & Engineering (82.2%), Computers & Mathematics (77.7%), and Computers, Engineering & Science (70.9%), while the most female-oriented occupations are Life, Physical & Social Science (91.0%), Health Diagnosing & Treating (78.6%), and Education, Arts & Media (75.7%).
| Occupation | Male | Female |
| Management | 615 (55.7%) | 489 (44.3%) |
| Business & Financial | 651 (59.2%) | 448 (40.8%) |
| Computers, Engineering & Science | 853 (70.9%) | 351 (29.1%) |
| Computers & Mathematics | 661 (77.7%) | 190 (22.3%) |
| Architecture & Engineering | 180 (82.2%) | 39 (17.8%) |
| Life, Physical & Social Science | 12 (9.0%) | 122 (91.0%) |
| Community & Social Service | 409 (37.8%) | 672 (62.2%) |
| Education, Arts & Media | 60 (24.3%) | 187 (75.7%) |
| Legal Services & Support | 98 (64.5%) | 54 (35.5%) |
| Education Instruction & Library | 204 (35.4%) | 373 (64.6%) |
| Arts, Media & Entertainment | 47 (44.8%) | 58 (55.2%) |
| Health Diagnosing & Treating | 158 (21.4%) | 580 (78.6%) |
| Health Technologists | 143 (34.8%) | 268 (65.2%) |
| Total (Category) | 2,686 (51.4%) | 2,540 (48.6%) |
| Total (Overall) | 5,950 (54.4%) | 4,977 (45.6%) |
Services Occupations
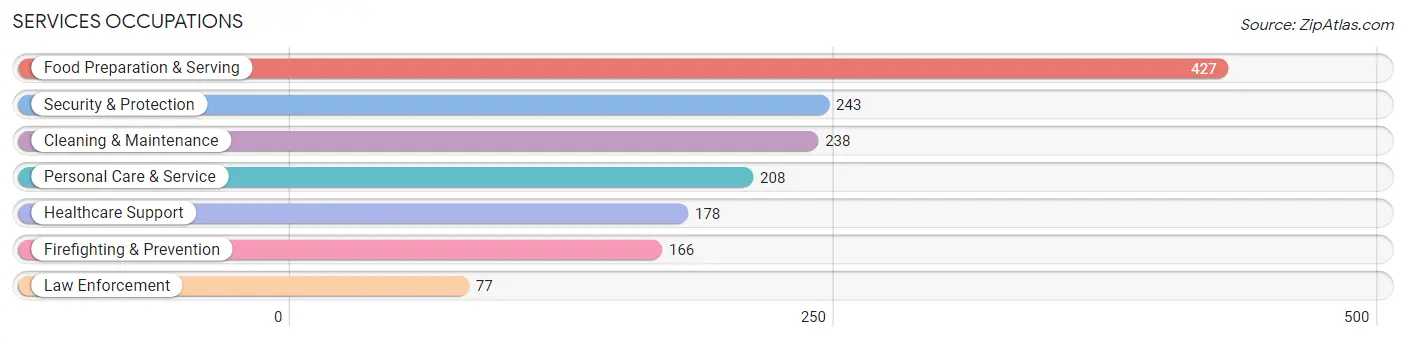
The most common Services occupations in Woodbridge are Food Preparation & Serving (427 | 3.9%), Security & Protection (243 | 2.2%), Cleaning & Maintenance (238 | 2.2%), Personal Care & Service (208 | 1.9%), and Healthcare Support (178 | 1.6%).
Services Occupations by Sex
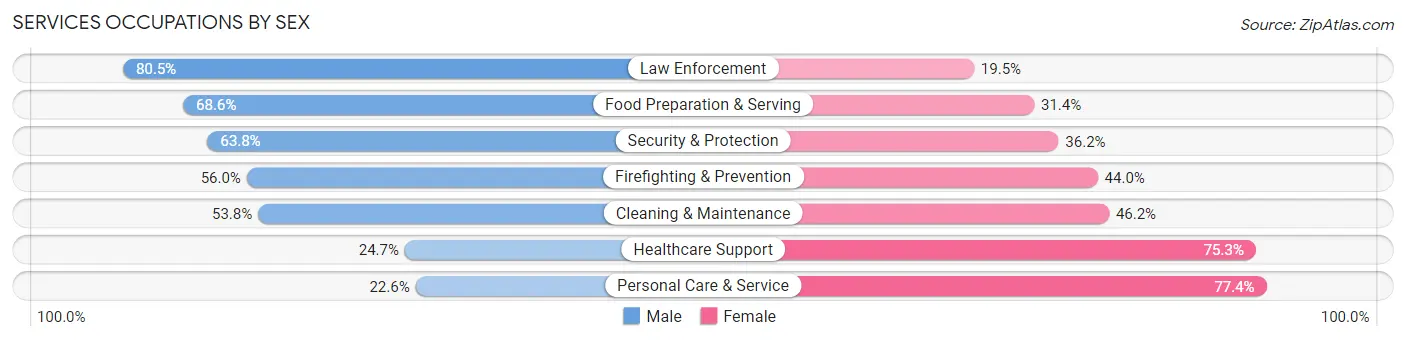
Within the Services occupations in Woodbridge, the most male-oriented occupations are Law Enforcement (80.5%), Food Preparation & Serving (68.6%), and Security & Protection (63.8%), while the most female-oriented occupations are Personal Care & Service (77.4%), Healthcare Support (75.3%), and Cleaning & Maintenance (46.2%).
| Occupation | Male | Female |
| Healthcare Support | 44 (24.7%) | 134 (75.3%) |
| Security & Protection | 155 (63.8%) | 88 (36.2%) |
| Firefighting & Prevention | 93 (56.0%) | 73 (44.0%) |
| Law Enforcement | 62 (80.5%) | 15 (19.5%) |
| Food Preparation & Serving | 293 (68.6%) | 134 (31.4%) |
| Cleaning & Maintenance | 128 (53.8%) | 110 (46.2%) |
| Personal Care & Service | 47 (22.6%) | 161 (77.4%) |
| Total (Category) | 667 (51.5%) | 627 (48.4%) |
| Total (Overall) | 5,950 (54.4%) | 4,977 (45.6%) |
Sales and Office Occupations
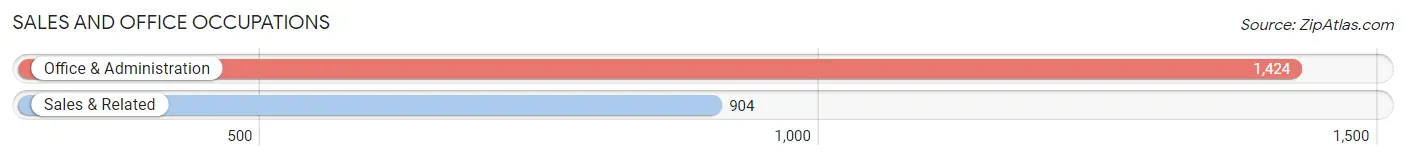
The most common Sales and Office occupations in Woodbridge are Office & Administration (1,424 | 13.0%), and Sales & Related (904 | 8.3%).
Sales and Office Occupations by Sex
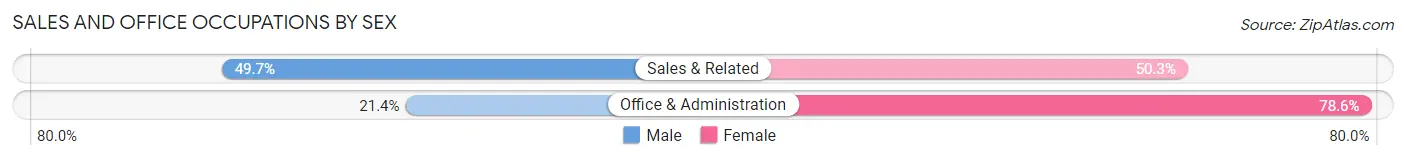
| Occupation | Male | Female |
| Sales & Related | 449 (49.7%) | 455 (50.3%) |
| Office & Administration | 305 (21.4%) | 1,119 (78.6%) |
| Total (Category) | 754 (32.4%) | 1,574 (67.6%) |
| Total (Overall) | 5,950 (54.4%) | 4,977 (45.6%) |
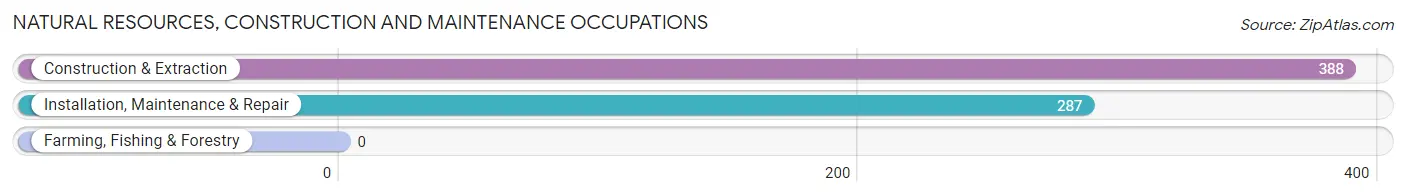
Natural Resources, Construction and Maintenance Occupations
The most common Natural Resources, Construction and Maintenance occupations in Woodbridge are Construction & Extraction (388 | 3.5%), and Installation, Maintenance & Repair (287 | 2.6%).
Natural Resources, Construction and Maintenance Occupations by Sex
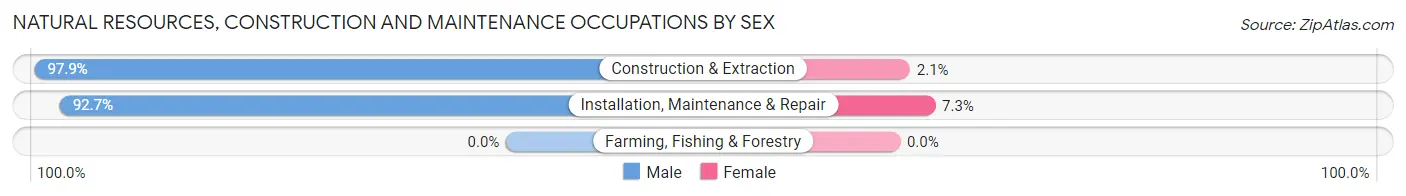
| Occupation | Male | Female |
| Farming, Fishing & Forestry | 0 (0.0%) | 0 (0.0%) |
| Construction & Extraction | 380 (97.9%) | 8 (2.1%) |
| Installation, Maintenance & Repair | 266 (92.7%) | 21 (7.3%) |
| Total (Category) | 646 (95.7%) | 29 (4.3%) |
| Total (Overall) | 5,950 (54.4%) | 4,977 (45.6%) |
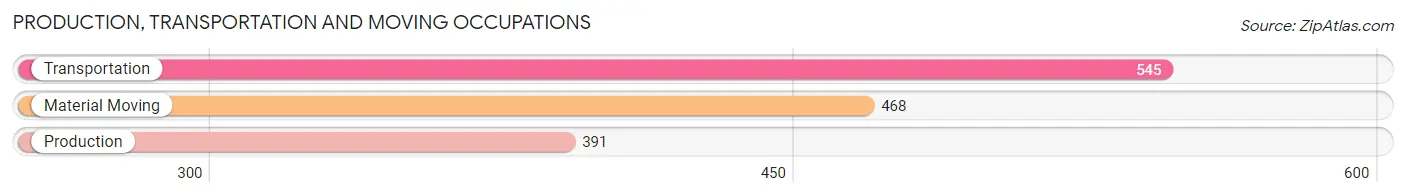
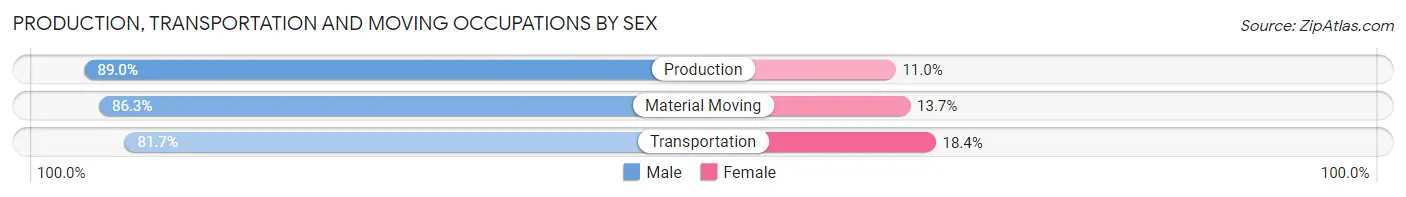
Production, Transportation and Moving Occupations
The most common Production, Transportation and Moving occupations in Woodbridge are Transportation (545 | 5.0%), Material Moving (468 | 4.3%), and Production (391 | 3.6%).
Production, Transportation and Moving Occupations by Sex
| Occupation | Male | Female |
| Production | 348 (89.0%) | 43 (11.0%) |
| Transportation | 445 (81.7%) | 100 (18.3%) |
| Material Moving | 404 (86.3%) | 64 (13.7%) |
| Total (Category) | 1,197 (85.3%) | 207 (14.7%) |
| Total (Overall) | 5,950 (54.4%) | 4,977 (45.6%) |
Employment Industries by Sex in Woodbridge
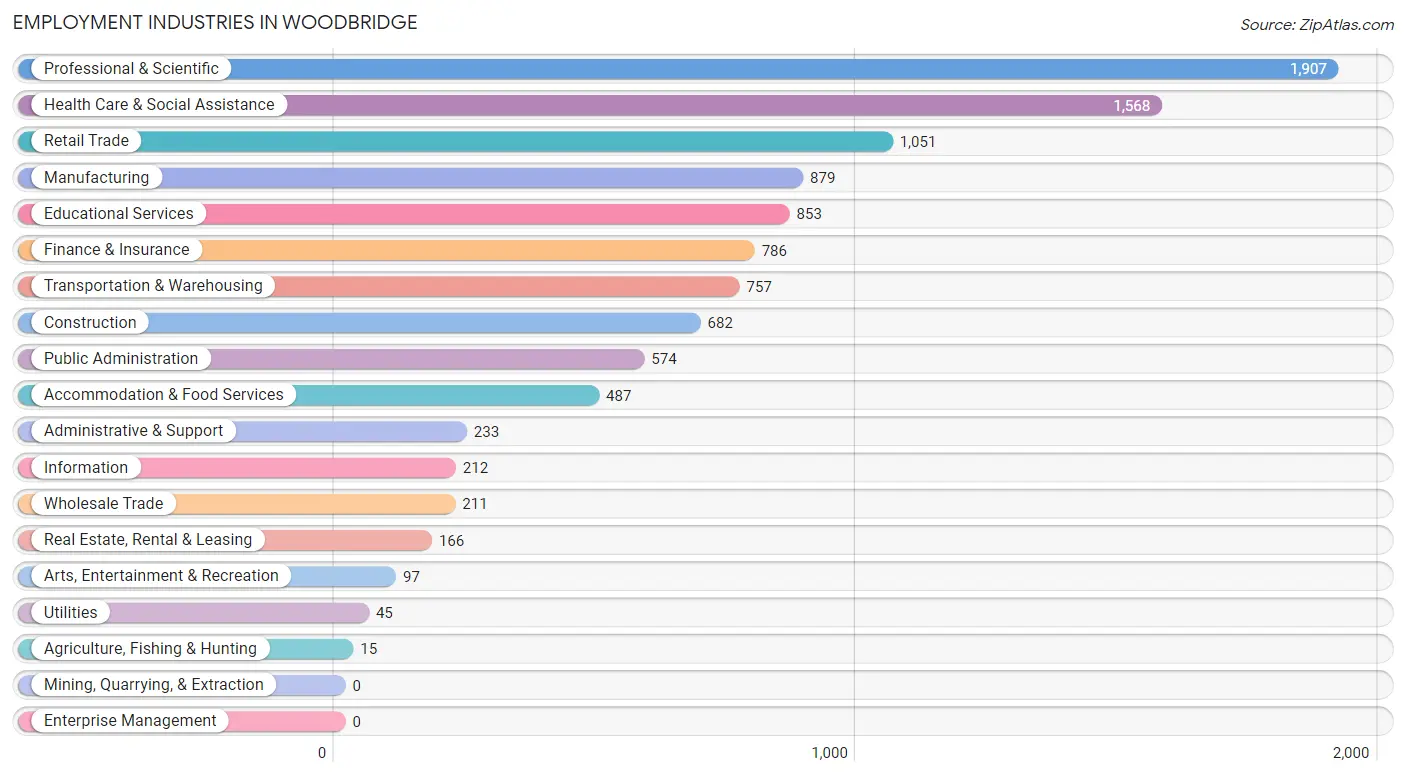
Employment Industries in Woodbridge
The major employment industries in Woodbridge include Professional & Scientific (1,907 | 17.4%), Health Care & Social Assistance (1,568 | 14.3%), Retail Trade (1,051 | 9.6%), Manufacturing (879 | 8.0%), and Educational Services (853 | 7.8%).
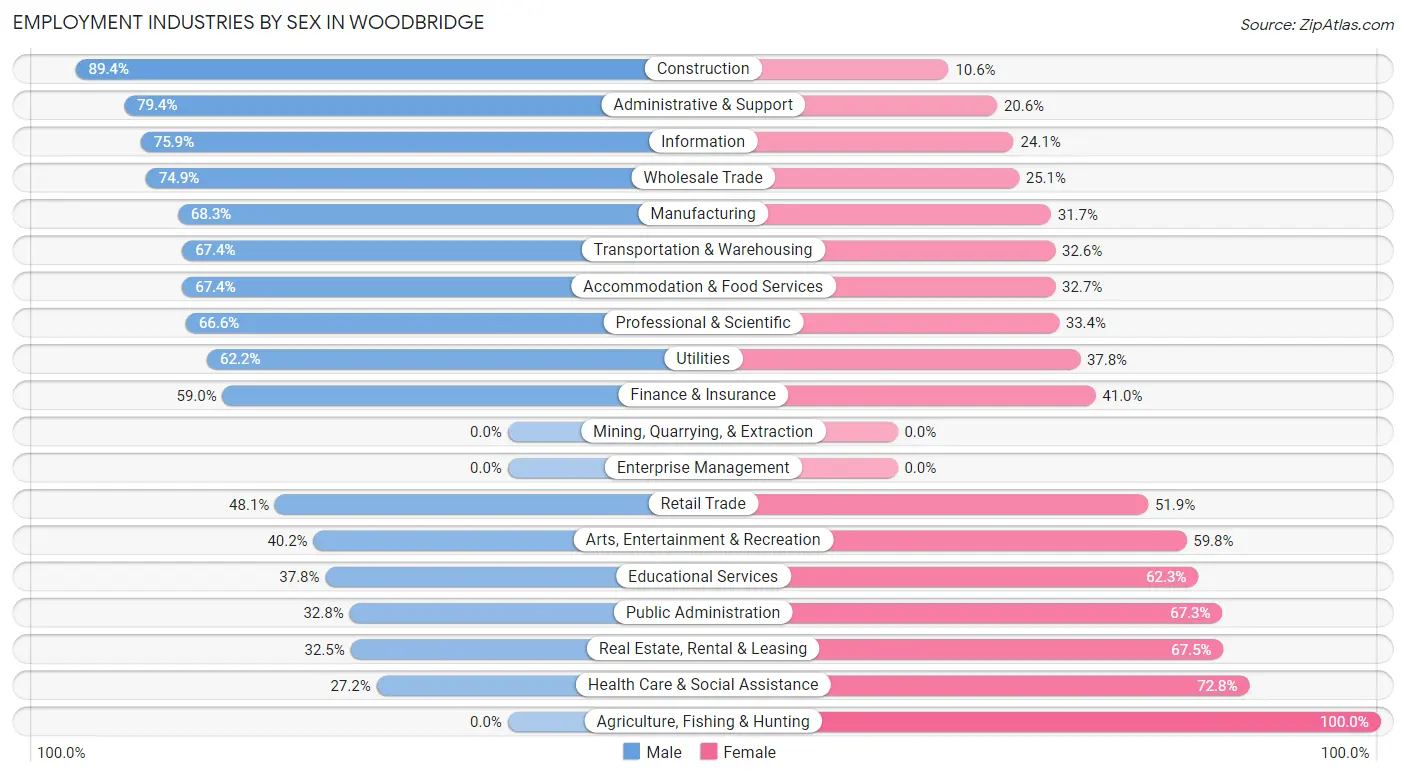
Employment Industries by Sex in Woodbridge
The Woodbridge industries that see more men than women are Construction (89.4%), Administrative & Support (79.4%), and Information (75.9%), whereas the industries that tend to have a higher number of women are Agriculture, Fishing & Hunting (100.0%), Health Care & Social Assistance (72.8%), and Real Estate, Rental & Leasing (67.5%).
| Industry | Male | Female |
| Agriculture, Fishing & Hunting | 0 (0.0%) | 15 (100.0%) |
| Mining, Quarrying, & Extraction | 0 (0.0%) | 0 (0.0%) |
| Construction | 610 (89.4%) | 72 (10.6%) |
| Manufacturing | 600 (68.3%) | 279 (31.7%) |
| Wholesale Trade | 158 (74.9%) | 53 (25.1%) |
| Retail Trade | 506 (48.1%) | 545 (51.9%) |
| Transportation & Warehousing | 510 (67.4%) | 247 (32.6%) |
| Utilities | 28 (62.2%) | 17 (37.8%) |
| Information | 161 (75.9%) | 51 (24.1%) |
| Finance & Insurance | 464 (59.0%) | 322 (41.0%) |
| Real Estate, Rental & Leasing | 54 (32.5%) | 112 (67.5%) |
| Professional & Scientific | 1,270 (66.6%) | 637 (33.4%) |
| Enterprise Management | 0 (0.0%) | 0 (0.0%) |
| Administrative & Support | 185 (79.4%) | 48 (20.6%) |
| Educational Services | 322 (37.8%) | 531 (62.3%) |
| Health Care & Social Assistance | 426 (27.2%) | 1,142 (72.8%) |
| Arts, Entertainment & Recreation | 39 (40.2%) | 58 (59.8%) |
| Accommodation & Food Services | 328 (67.3%) | 159 (32.7%) |
| Public Administration | 188 (32.8%) | 386 (67.2%) |
| Total | 5,950 (54.4%) | 4,977 (45.6%) |
Education in Woodbridge
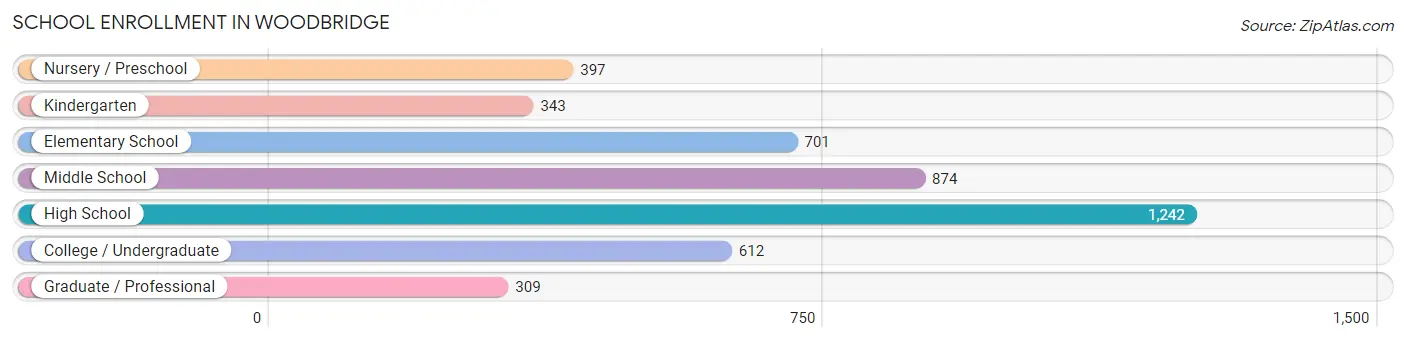
School Enrollment in Woodbridge
The most common levels of schooling among the 4,478 students in Woodbridge are high school (1,242 | 27.7%), middle school (874 | 19.5%), and elementary school (701 | 15.7%).
| School Level | # Students | % Students |
| Nursery / Preschool | 397 | 8.9% |
| Kindergarten | 343 | 7.7% |
| Elementary School | 701 | 15.7% |
| Middle School | 874 | 19.5% |
| High School | 1,242 | 27.7% |
| College / Undergraduate | 612 | 13.7% |
| Graduate / Professional | 309 | 6.9% |
| Total | 4,478 | 100.0% |
School Enrollment by Age by Funding Source in Woodbridge
Out of a total of 4,478 students who are enrolled in schools in Woodbridge, 819 (18.3%) attend a private institution, while the remaining 3,659 (81.7%) are enrolled in public schools. The age group of 3 to 4 year olds has the highest likelihood of being enrolled in private schools, with 152 (62.8% in the age bracket) enrolled. Conversely, the age group of 18 to 19 year olds has the lowest likelihood of being enrolled in a private school, with 241 (98.4% in the age bracket) attending a public institution.
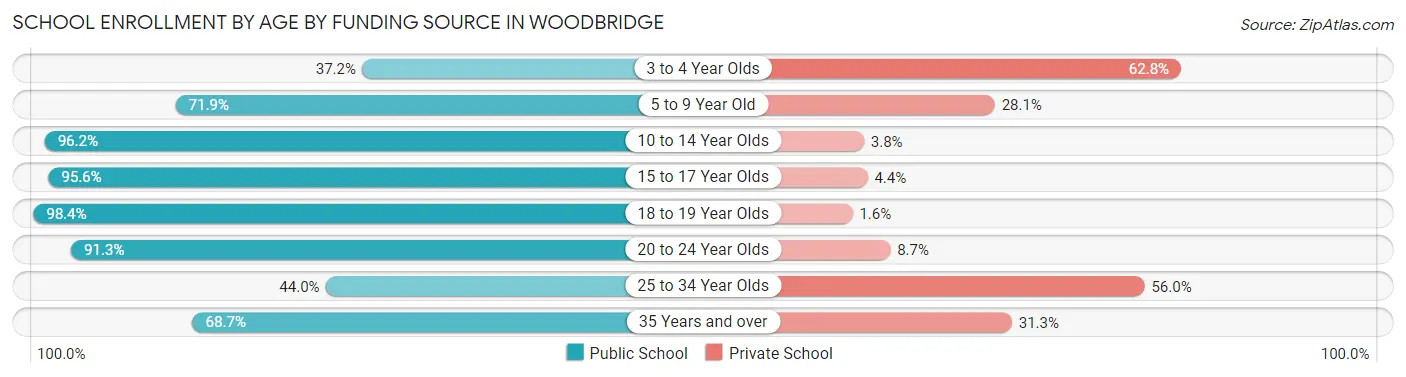
| Age Bracket | Public School | Private School |
| 3 to 4 Year Olds | 90 (37.2%) | 152 (62.8%) |
| 5 to 9 Year Old | 815 (71.9%) | 319 (28.1%) |
| 10 to 14 Year Olds | 1,127 (96.2%) | 44 (3.8%) |
| 15 to 17 Year Olds | 820 (95.6%) | 38 (4.4%) |
| 18 to 19 Year Olds | 241 (98.4%) | 4 (1.6%) |
| 20 to 24 Year Olds | 295 (91.3%) | 28 (8.7%) |
| 25 to 34 Year Olds | 135 (44.0%) | 172 (56.0%) |
| 35 Years and over | 136 (68.7%) | 62 (31.3%) |
| Total | 3,659 (81.7%) | 819 (18.3%) |
Educational Attainment by Field of Study in Woodbridge
Engineering (1,020 | 18.6%), business (968 | 17.6%), science & technology (513 | 9.3%), computers & mathematics (510 | 9.3%), and education (408 | 7.4%) are the most common fields of study among 5,496 individuals in Woodbridge who have obtained a bachelor's degree or higher.
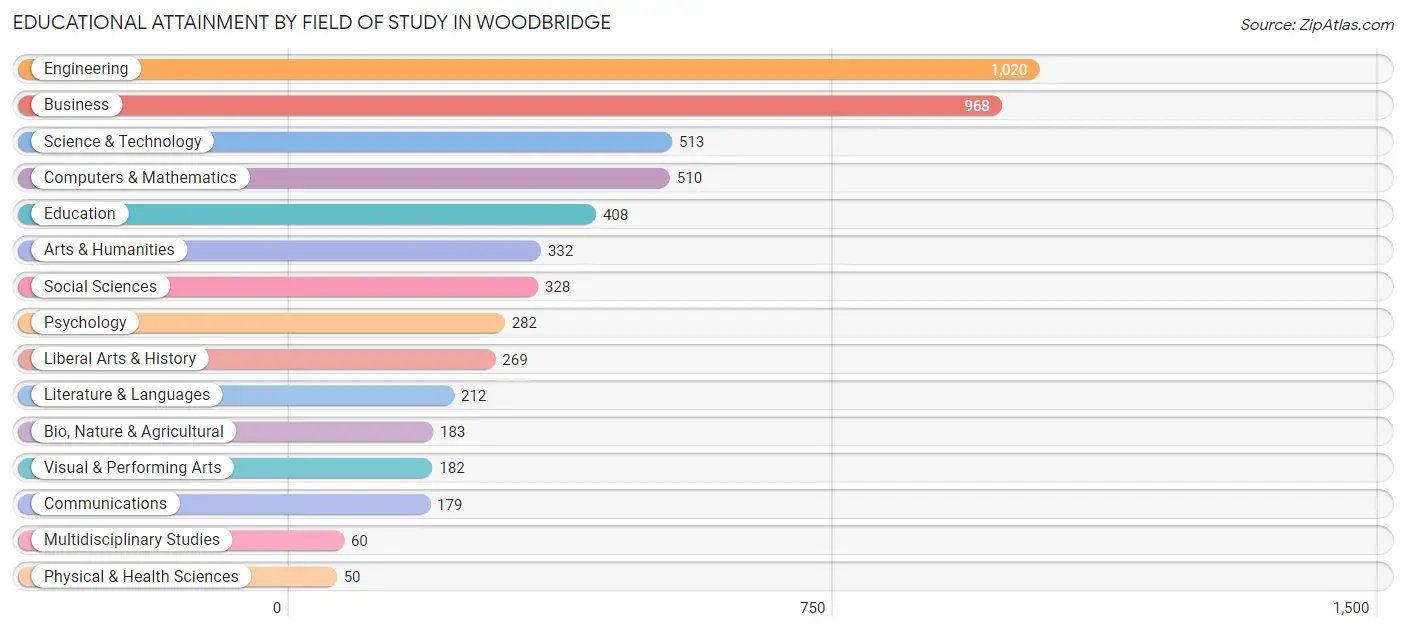
| Field of Study | # Graduates | % Graduates |
| Computers & Mathematics | 510 | 9.3% |
| Bio, Nature & Agricultural | 183 | 3.3% |
| Physical & Health Sciences | 50 | 0.9% |
| Psychology | 282 | 5.1% |
| Social Sciences | 328 | 6.0% |
| Engineering | 1,020 | 18.6% |
| Multidisciplinary Studies | 60 | 1.1% |
| Science & Technology | 513 | 9.3% |
| Business | 968 | 17.6% |
| Education | 408 | 7.4% |
| Literature & Languages | 212 | 3.9% |
| Liberal Arts & History | 269 | 4.9% |
| Visual & Performing Arts | 182 | 3.3% |
| Communications | 179 | 3.3% |
| Arts & Humanities | 332 | 6.0% |
| Total | 5,496 | 100.0% |
Transportation & Commute in Woodbridge
Vehicle Availability by Sex in Woodbridge
The most prevalent vehicle ownership categories in Woodbridge are males with 2 vehicles (2,703, accounting for 45.9%) and females with 2 vehicles (2,159, making up 55.3%).
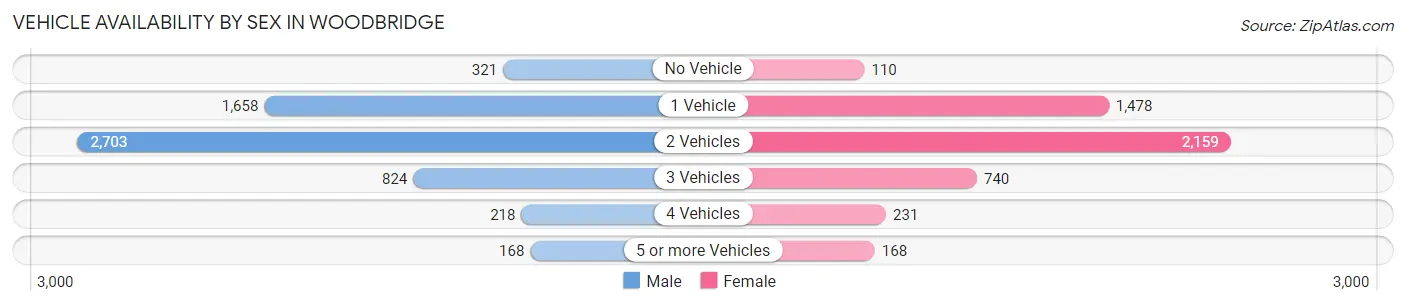
| Vehicles Available | Male | Female |
| No Vehicle | 321 (5.4%) | 110 (2.2%) |
| 1 Vehicle | 1,658 (28.1%) | 1,478 (30.2%) |
| 2 Vehicles | 2,703 (45.9%) | 2,159 (44.2%) |
| 3 Vehicles | 824 (14.0%) | 740 (15.1%) |
| 4 Vehicles | 218 (3.7%) | 231 (4.7%) |
| 5 or more Vehicles | 168 (2.9%) | 168 (3.4%) |
| Total | 5,892 (100.0%) | 4,886 (100.0%) |
Commute Time in Woodbridge
The most frequently occuring commute durations in Woodbridge are 15 to 19 minutes (1,388 commuters, 14.4%), 10 to 14 minutes (1,321 commuters, 13.7%), and 30 to 34 minutes (1,176 commuters, 12.2%).
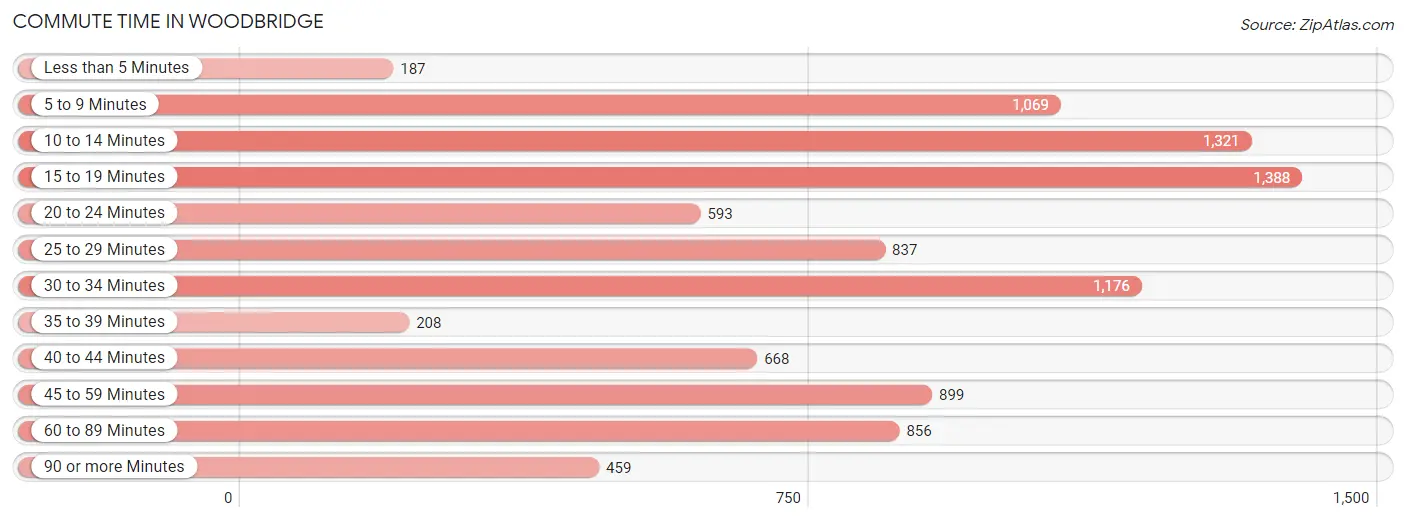
| Commute Time | # Commuters | % Commuters |
| Less than 5 Minutes | 187 | 1.9% |
| 5 to 9 Minutes | 1,069 | 11.1% |
| 10 to 14 Minutes | 1,321 | 13.7% |
| 15 to 19 Minutes | 1,388 | 14.4% |
| 20 to 24 Minutes | 593 | 6.1% |
| 25 to 29 Minutes | 837 | 8.7% |
| 30 to 34 Minutes | 1,176 | 12.2% |
| 35 to 39 Minutes | 208 | 2.1% |
| 40 to 44 Minutes | 668 | 6.9% |
| 45 to 59 Minutes | 899 | 9.3% |
| 60 to 89 Minutes | 856 | 8.9% |
| 90 or more Minutes | 459 | 4.8% |
Commute Time by Sex in Woodbridge
The most common commute times in Woodbridge are 10 to 14 minutes (801 commuters, 15.1%) for males and 15 to 19 minutes (747 commuters, 17.1%) for females.
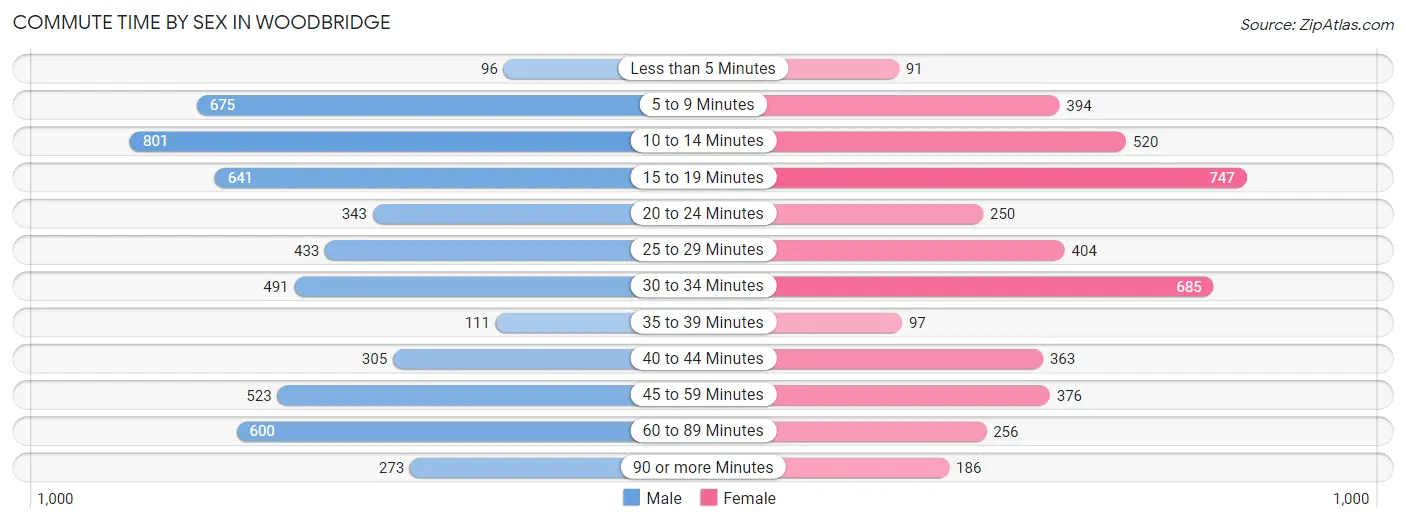
| Commute Time | Male | Female |
| Less than 5 Minutes | 96 (1.8%) | 91 (2.1%) |
| 5 to 9 Minutes | 675 (12.8%) | 394 (9.0%) |
| 10 to 14 Minutes | 801 (15.1%) | 520 (11.9%) |
| 15 to 19 Minutes | 641 (12.1%) | 747 (17.1%) |
| 20 to 24 Minutes | 343 (6.5%) | 250 (5.7%) |
| 25 to 29 Minutes | 433 (8.2%) | 404 (9.2%) |
| 30 to 34 Minutes | 491 (9.3%) | 685 (15.7%) |
| 35 to 39 Minutes | 111 (2.1%) | 97 (2.2%) |
| 40 to 44 Minutes | 305 (5.8%) | 363 (8.3%) |
| 45 to 59 Minutes | 523 (9.9%) | 376 (8.6%) |
| 60 to 89 Minutes | 600 (11.3%) | 256 (5.9%) |
| 90 or more Minutes | 273 (5.2%) | 186 (4.3%) |
Time of Departure to Work by Sex in Woodbridge
The most frequent times of departure to work in Woodbridge are 7:00 AM to 7:29 AM (582, 11.0%) for males and 7:30 AM to 7:59 AM (716, 16.4%) for females.
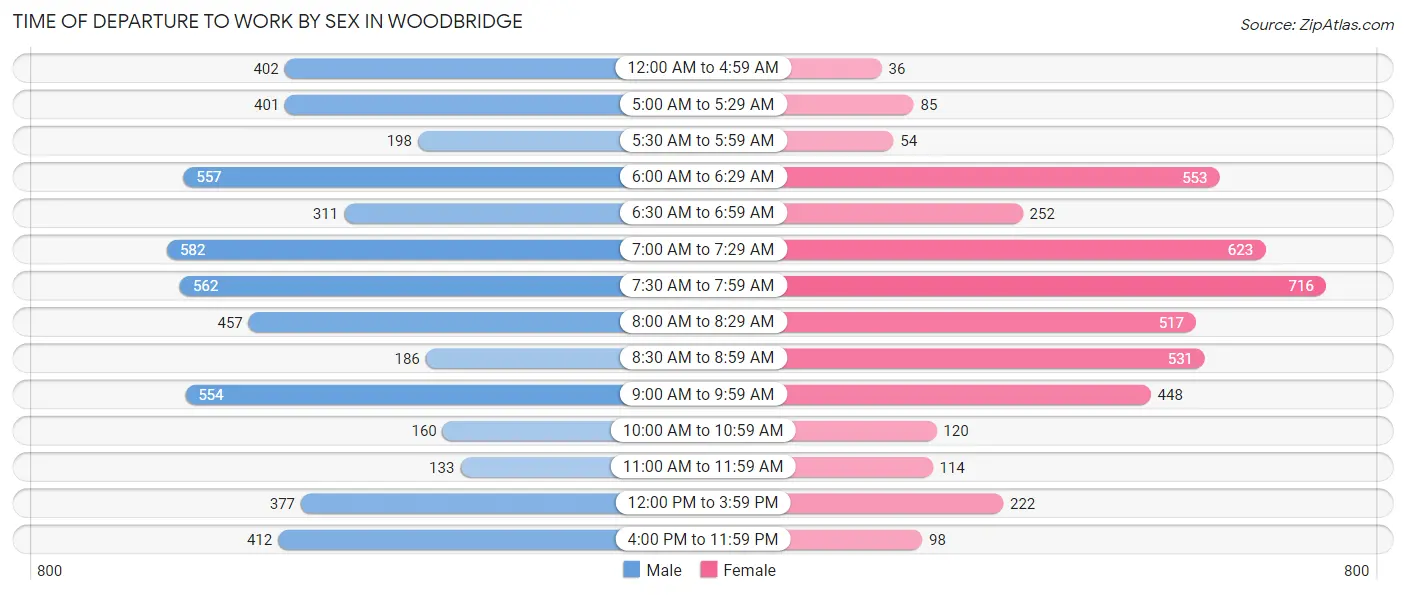
| Time of Departure | Male | Female |
| 12:00 AM to 4:59 AM | 402 (7.6%) | 36 (0.8%) |
| 5:00 AM to 5:29 AM | 401 (7.6%) | 85 (1.9%) |
| 5:30 AM to 5:59 AM | 198 (3.7%) | 54 (1.2%) |
| 6:00 AM to 6:29 AM | 557 (10.5%) | 553 (12.7%) |
| 6:30 AM to 6:59 AM | 311 (5.9%) | 252 (5.8%) |
| 7:00 AM to 7:29 AM | 582 (11.0%) | 623 (14.3%) |
| 7:30 AM to 7:59 AM | 562 (10.6%) | 716 (16.4%) |
| 8:00 AM to 8:29 AM | 457 (8.6%) | 517 (11.8%) |
| 8:30 AM to 8:59 AM | 186 (3.5%) | 531 (12.1%) |
| 9:00 AM to 9:59 AM | 554 (10.5%) | 448 (10.2%) |
| 10:00 AM to 10:59 AM | 160 (3.0%) | 120 (2.8%) |
| 11:00 AM to 11:59 AM | 133 (2.5%) | 114 (2.6%) |
| 12:00 PM to 3:59 PM | 377 (7.1%) | 222 (5.1%) |
| 4:00 PM to 11:59 PM | 412 (7.8%) | 98 (2.2%) |
| Total | 5,292 (100.0%) | 4,369 (100.0%) |
Housing Occupancy in Woodbridge
Occupancy by Ownership in Woodbridge
Of the total 7,812 dwellings in Woodbridge, owner-occupied units account for 4,187 (53.6%), while renter-occupied units make up 3,625 (46.4%).
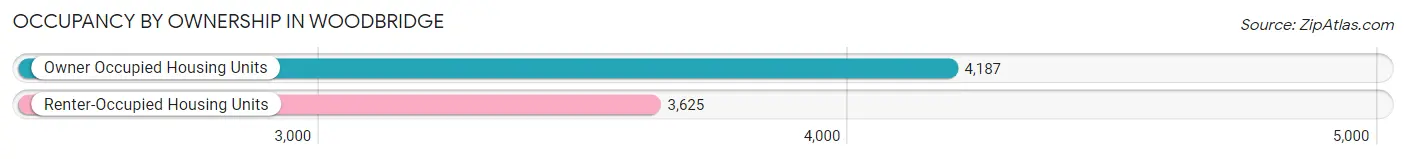
| Occupancy | # Housing Units | % Housing Units |
| Owner Occupied Housing Units | 4,187 | 53.6% |
| Renter-Occupied Housing Units | 3,625 | 46.4% |
| Total Occupied Housing Units | 7,812 | 100.0% |
Occupancy by Household Size in Woodbridge
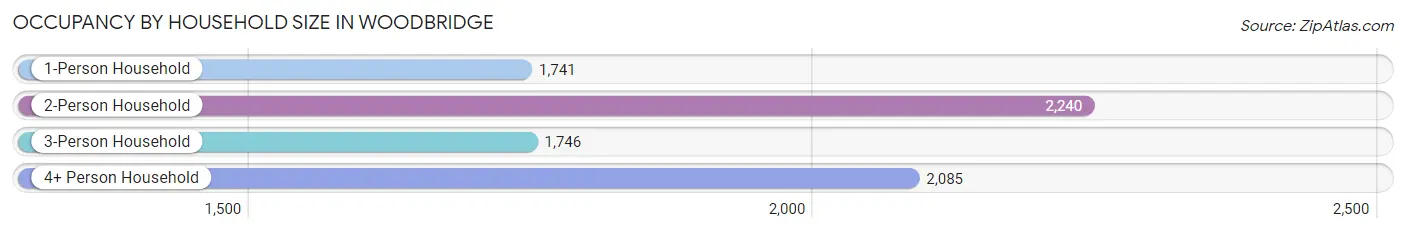
| Household Size | # Housing Units | % Housing Units |
| 1-Person Household | 1,741 | 22.3% |
| 2-Person Household | 2,240 | 28.7% |
| 3-Person Household | 1,746 | 22.4% |
| 4+ Person Household | 2,085 | 26.7% |
| Total Housing Units | 7,812 | 100.0% |
Occupancy by Ownership by Household Size in Woodbridge
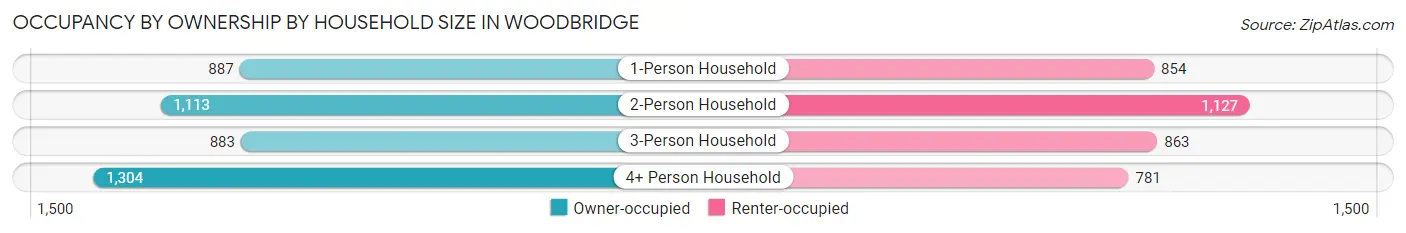
| Household Size | Owner-occupied | Renter-occupied |
| 1-Person Household | 887 (50.9%) | 854 (49.0%) |
| 2-Person Household | 1,113 (49.7%) | 1,127 (50.3%) |
| 3-Person Household | 883 (50.6%) | 863 (49.4%) |
| 4+ Person Household | 1,304 (62.5%) | 781 (37.5%) |
| Total Housing Units | 4,187 (53.6%) | 3,625 (46.4%) |
Occupancy by Educational Attainment in Woodbridge
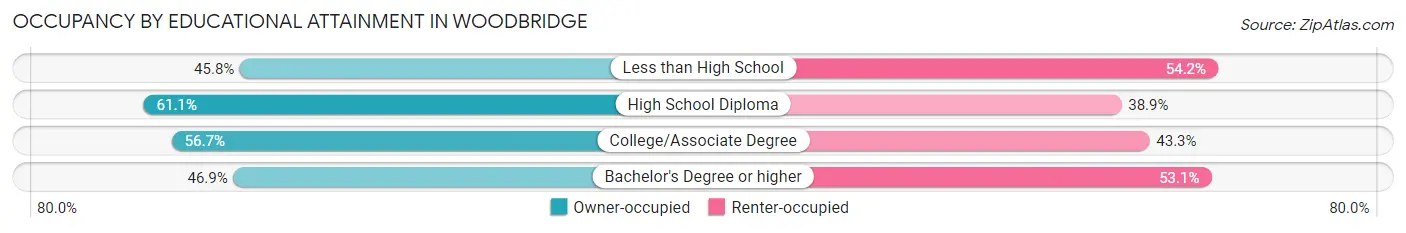
| Household Size | Owner-occupied | Renter-occupied |
| Less than High School | 175 (45.8%) | 207 (54.2%) |
| High School Diploma | 1,201 (61.1%) | 764 (38.9%) |
| College/Associate Degree | 1,444 (56.7%) | 1,104 (43.3%) |
| Bachelor's Degree or higher | 1,367 (46.9%) | 1,550 (53.1%) |
Occupancy by Age of Householder in Woodbridge
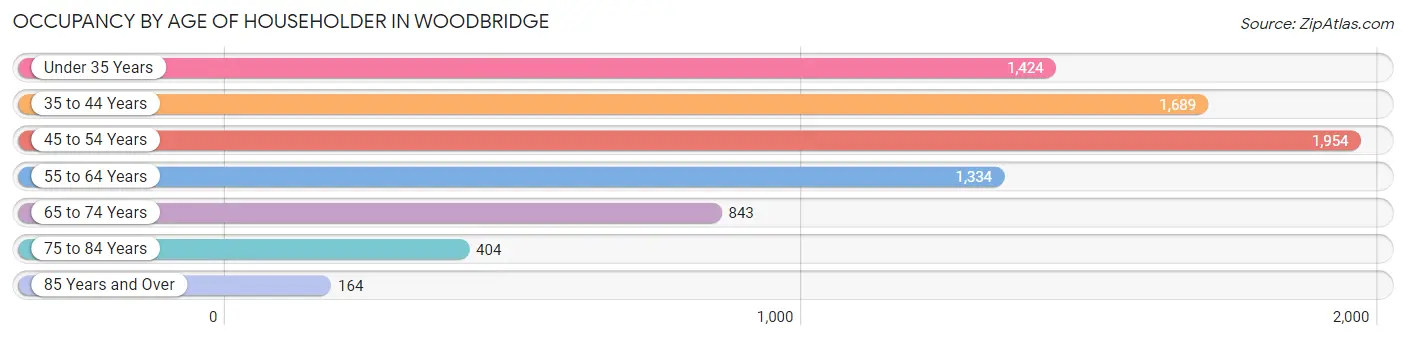
| Age Bracket | # Households | % Households |
| Under 35 Years | 1,424 | 18.2% |
| 35 to 44 Years | 1,689 | 21.6% |
| 45 to 54 Years | 1,954 | 25.0% |
| 55 to 64 Years | 1,334 | 17.1% |
| 65 to 74 Years | 843 | 10.8% |
| 75 to 84 Years | 404 | 5.2% |
| 85 Years and Over | 164 | 2.1% |
| Total | 7,812 | 100.0% |
Housing Finances in Woodbridge
Median Income by Occupancy in Woodbridge
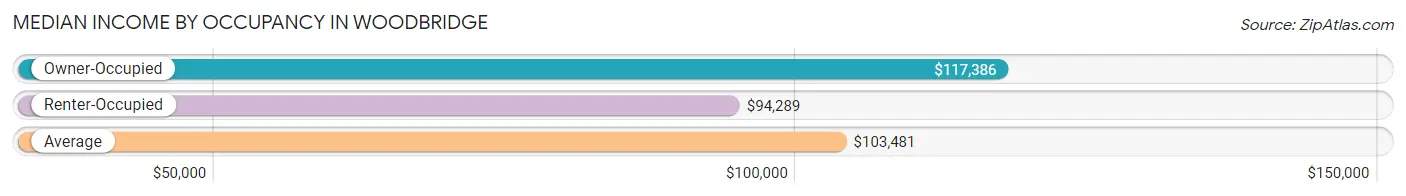
| Occupancy Type | # Households | Median Income |
| Owner-Occupied | 4,187 (53.6%) | $117,386 |
| Renter-Occupied | 3,625 (46.4%) | $94,289 |
| Average | 7,812 (100.0%) | $103,481 |
Occupancy by Householder Income Bracket in Woodbridge
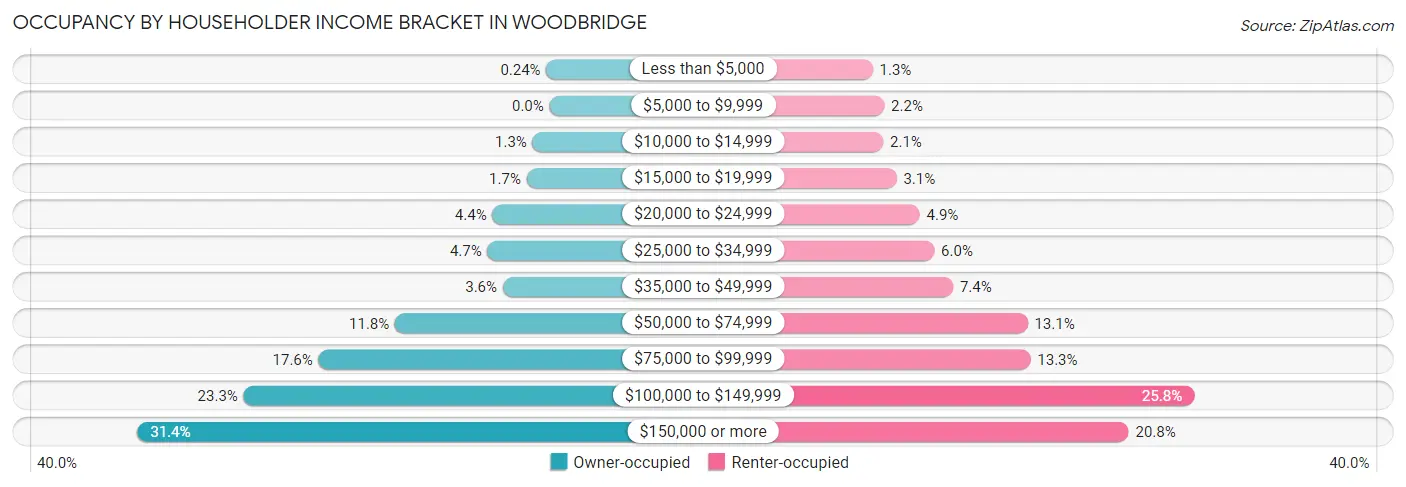
| Income Bracket | Owner-occupied | Renter-occupied |
| Less than $5,000 | 10 (0.2%) | 47 (1.3%) |
| $5,000 to $9,999 | 0 (0.0%) | 79 (2.2%) |
| $10,000 to $14,999 | 54 (1.3%) | 76 (2.1%) |
| $15,000 to $19,999 | 73 (1.7%) | 113 (3.1%) |
| $20,000 to $24,999 | 182 (4.3%) | 177 (4.9%) |
| $25,000 to $34,999 | 198 (4.7%) | 217 (6.0%) |
| $35,000 to $49,999 | 149 (3.6%) | 269 (7.4%) |
| $50,000 to $74,999 | 493 (11.8%) | 475 (13.1%) |
| $75,000 to $99,999 | 737 (17.6%) | 483 (13.3%) |
| $100,000 to $149,999 | 976 (23.3%) | 935 (25.8%) |
| $150,000 or more | 1,315 (31.4%) | 754 (20.8%) |
| Total | 4,187 (100.0%) | 3,625 (100.0%) |
Monthly Housing Cost Tiers in Woodbridge
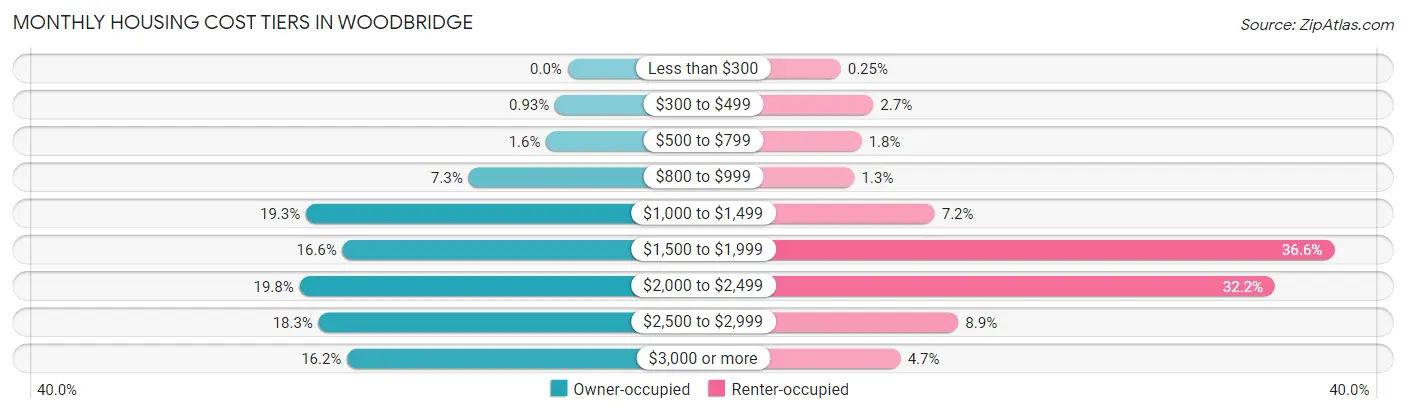
| Monthly Cost | Owner-occupied | Renter-occupied |
| Less than $300 | 0 (0.0%) | 9 (0.3%) |
| $300 to $499 | 39 (0.9%) | 96 (2.6%) |
| $500 to $799 | 66 (1.6%) | 65 (1.8%) |
| $800 to $999 | 306 (7.3%) | 46 (1.3%) |
| $1,000 to $1,499 | 807 (19.3%) | 260 (7.2%) |
| $1,500 to $1,999 | 694 (16.6%) | 1,326 (36.6%) |
| $2,000 to $2,499 | 827 (19.8%) | 1,168 (32.2%) |
| $2,500 to $2,999 | 768 (18.3%) | 323 (8.9%) |
| $3,000 or more | 680 (16.2%) | 169 (4.7%) |
| Total | 4,187 (100.0%) | 3,625 (100.0%) |
Physical Housing Characteristics in Woodbridge
Housing Structures in Woodbridge
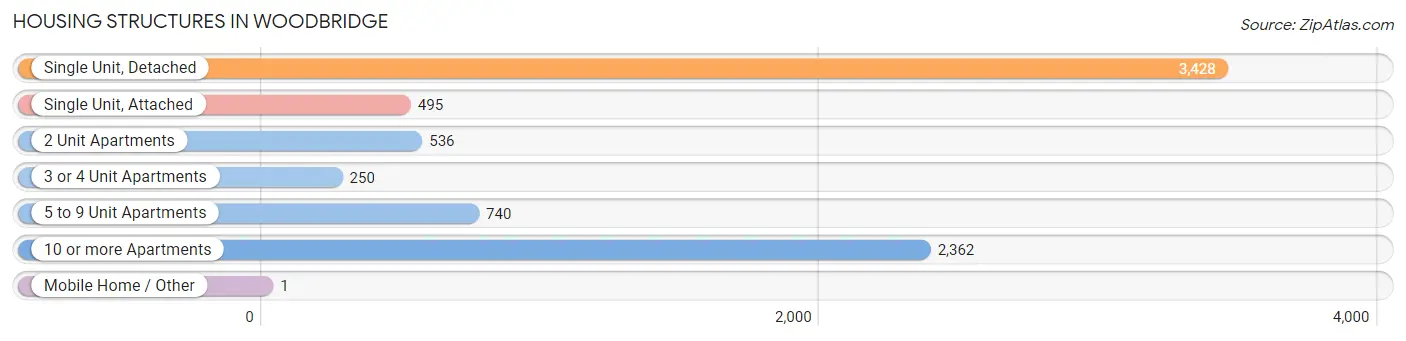
| Structure Type | # Housing Units | % Housing Units |
| Single Unit, Detached | 3,428 | 43.9% |
| Single Unit, Attached | 495 | 6.3% |
| 2 Unit Apartments | 536 | 6.9% |
| 3 or 4 Unit Apartments | 250 | 3.2% |
| 5 to 9 Unit Apartments | 740 | 9.5% |
| 10 or more Apartments | 2,362 | 30.2% |
| Mobile Home / Other | 1 | 0.0% |
| Total | 7,812 | 100.0% |
Housing Structures by Occupancy in Woodbridge
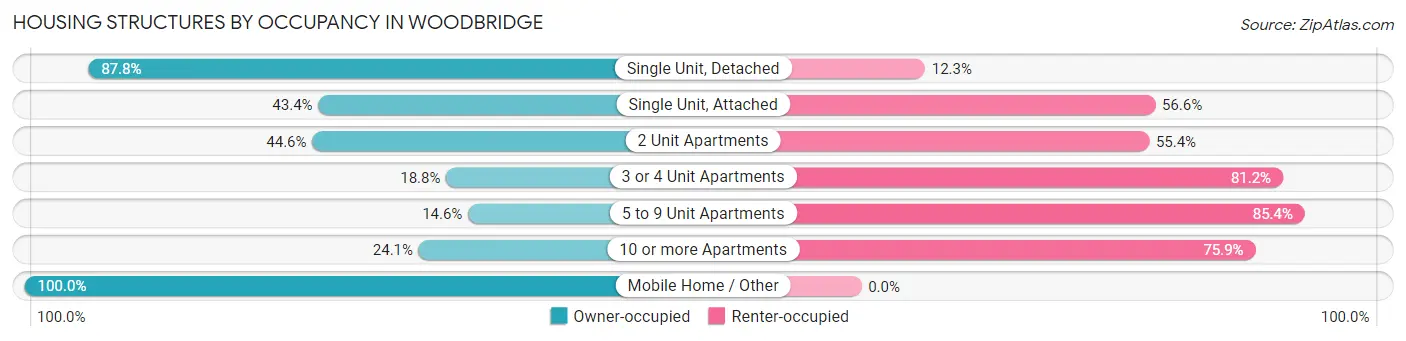
| Structure Type | Owner-occupied | Renter-occupied |
| Single Unit, Detached | 3,008 (87.7%) | 420 (12.2%) |
| Single Unit, Attached | 215 (43.4%) | 280 (56.6%) |
| 2 Unit Apartments | 239 (44.6%) | 297 (55.4%) |
| 3 or 4 Unit Apartments | 47 (18.8%) | 203 (81.2%) |
| 5 to 9 Unit Apartments | 108 (14.6%) | 632 (85.4%) |
| 10 or more Apartments | 569 (24.1%) | 1,793 (75.9%) |
| Mobile Home / Other | 1 (100.0%) | 0 (0.0%) |
| Total | 4,187 (53.6%) | 3,625 (46.4%) |
Housing Structures by Number of Rooms in Woodbridge
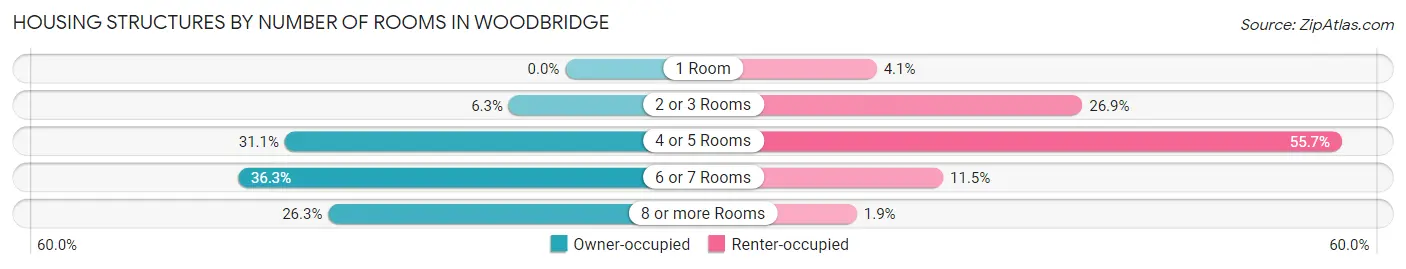
| Number of Rooms | Owner-occupied | Renter-occupied |
| 1 Room | 0 (0.0%) | 148 (4.1%) |
| 2 or 3 Rooms | 262 (6.3%) | 975 (26.9%) |
| 4 or 5 Rooms | 1,303 (31.1%) | 2,019 (55.7%) |
| 6 or 7 Rooms | 1,521 (36.3%) | 415 (11.5%) |
| 8 or more Rooms | 1,101 (26.3%) | 68 (1.9%) |
| Total | 4,187 (100.0%) | 3,625 (100.0%) |
Housing Structure by Heating Type in Woodbridge
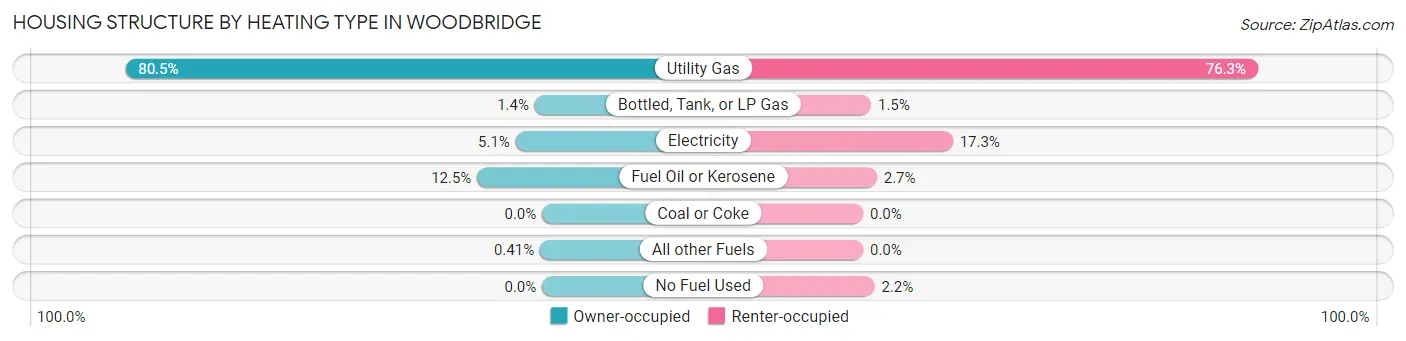
| Heating Type | Owner-occupied | Renter-occupied |
| Utility Gas | 3,372 (80.5%) | 2,765 (76.3%) |
| Bottled, Tank, or LP Gas | 59 (1.4%) | 56 (1.5%) |
| Electricity | 214 (5.1%) | 628 (17.3%) |
| Fuel Oil or Kerosene | 525 (12.5%) | 96 (2.6%) |
| Coal or Coke | 0 (0.0%) | 0 (0.0%) |
| All other Fuels | 17 (0.4%) | 0 (0.0%) |
| No Fuel Used | 0 (0.0%) | 80 (2.2%) |
| Total | 4,187 (100.0%) | 3,625 (100.0%) |
Household Vehicle Usage in Woodbridge
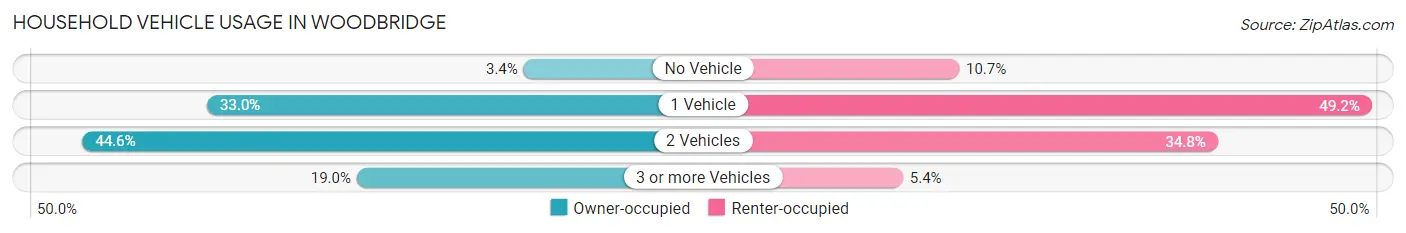
| Vehicles per Household | Owner-occupied | Renter-occupied |
| No Vehicle | 143 (3.4%) | 386 (10.6%) |
| 1 Vehicle | 1,381 (33.0%) | 1,782 (49.2%) |
| 2 Vehicles | 1,868 (44.6%) | 1,261 (34.8%) |
| 3 or more Vehicles | 795 (19.0%) | 196 (5.4%) |
| Total | 4,187 (100.0%) | 3,625 (100.0%) |
Real Estate & Mortgages in Woodbridge
Real Estate and Mortgage Overview in Woodbridge
| Characteristic | Without Mortgage | With Mortgage |
| Housing Units | 1,271 | 2,916 |
| Median Property Value | $332,700 | $349,600 |
| Median Household Income | $100,547 | $1,025 |
| Monthly Housing Costs | $1,166 | $680 |
| Real Estate Taxes | $9,146 | $38 |
Property Value by Mortgage Status in Woodbridge
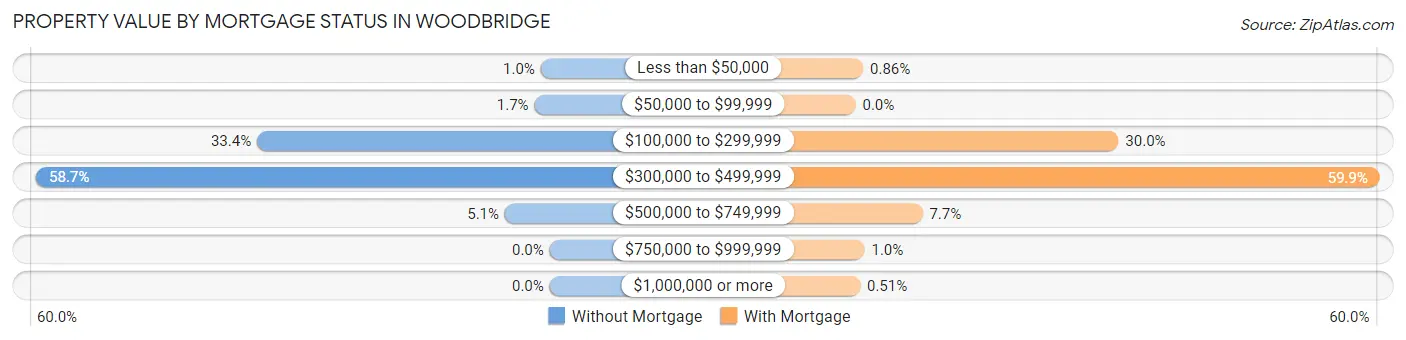
| Property Value | Without Mortgage | With Mortgage |
| Less than $50,000 | 13 (1.0%) | 25 (0.9%) |
| $50,000 to $99,999 | 22 (1.7%) | 0 (0.0%) |
| $100,000 to $299,999 | 425 (33.4%) | 876 (30.0%) |
| $300,000 to $499,999 | 746 (58.7%) | 1,747 (59.9%) |
| $500,000 to $749,999 | 65 (5.1%) | 223 (7.6%) |
| $750,000 to $999,999 | 0 (0.0%) | 30 (1.0%) |
| $1,000,000 or more | 0 (0.0%) | 15 (0.5%) |
| Total | 1,271 (100.0%) | 2,916 (100.0%) |
Household Income by Mortgage Status in Woodbridge
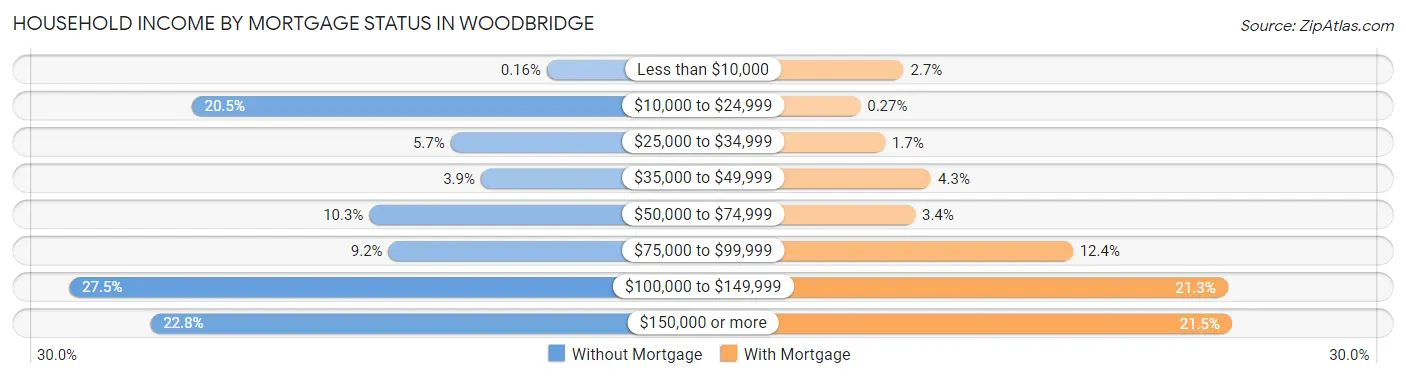
| Household Income | Without Mortgage | With Mortgage |
| Less than $10,000 | 2 (0.2%) | 80 (2.7%) |
| $10,000 to $24,999 | 260 (20.5%) | 8 (0.3%) |
| $25,000 to $34,999 | 72 (5.7%) | 49 (1.7%) |
| $35,000 to $49,999 | 50 (3.9%) | 126 (4.3%) |
| $50,000 to $74,999 | 131 (10.3%) | 99 (3.4%) |
| $75,000 to $99,999 | 117 (9.2%) | 362 (12.4%) |
| $100,000 to $149,999 | 349 (27.5%) | 620 (21.3%) |
| $150,000 or more | 290 (22.8%) | 627 (21.5%) |
| Total | 1,271 (100.0%) | 2,916 (100.0%) |
Property Value to Household Income Ratio in Woodbridge
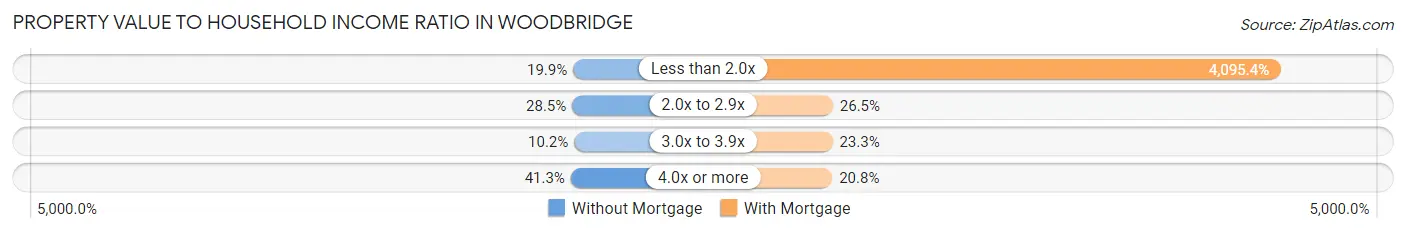
| Value-to-Income Ratio | Without Mortgage | With Mortgage |
| Less than 2.0x | 253 (19.9%) | 119,423 (4,095.4%) |
| 2.0x to 2.9x | 362 (28.5%) | 773 (26.5%) |
| 3.0x to 3.9x | 129 (10.2%) | 680 (23.3%) |
| 4.0x or more | 525 (41.3%) | 606 (20.8%) |
| Total | 1,271 (100.0%) | 2,916 (100.0%) |
Real Estate Taxes by Mortgage Status in Woodbridge
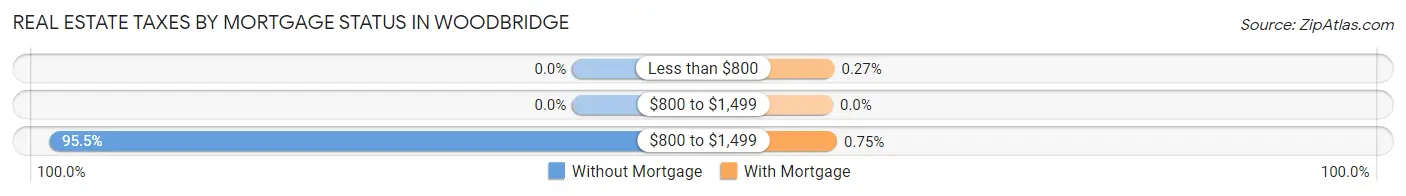
| Property Taxes | Without Mortgage | With Mortgage |
| Less than $800 | 0 (0.0%) | 8 (0.3%) |
| $800 to $1,499 | 0 (0.0%) | 0 (0.0%) |
| $800 to $1,499 | 1,214 (95.5%) | 22 (0.7%) |
| Total | 1,271 (100.0%) | 2,916 (100.0%) |
Health & Disability in Woodbridge
Health Insurance Coverage by Age in Woodbridge
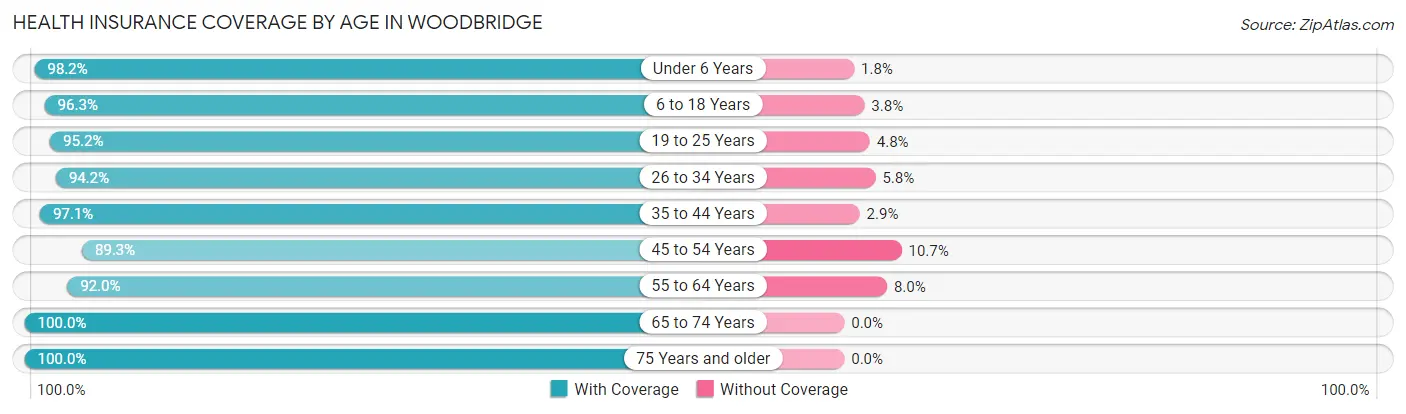
| Age Bracket | With Coverage | Without Coverage |
| Under 6 Years | 1,768 (98.2%) | 33 (1.8%) |
| 6 to 18 Years | 3,257 (96.3%) | 127 (3.7%) |
| 19 to 25 Years | 1,297 (95.2%) | 65 (4.8%) |
| 26 to 34 Years | 2,781 (94.2%) | 172 (5.8%) |
| 35 to 44 Years | 3,082 (97.1%) | 91 (2.9%) |
| 45 to 54 Years | 3,028 (89.3%) | 362 (10.7%) |
| 55 to 64 Years | 2,081 (92.0%) | 180 (8.0%) |
| 65 to 74 Years | 1,455 (100.0%) | 0 (0.0%) |
| 75 Years and older | 1,111 (100.0%) | 0 (0.0%) |
| Total | 19,860 (95.1%) | 1,030 (4.9%) |
Health Insurance Coverage by Citizenship Status in Woodbridge
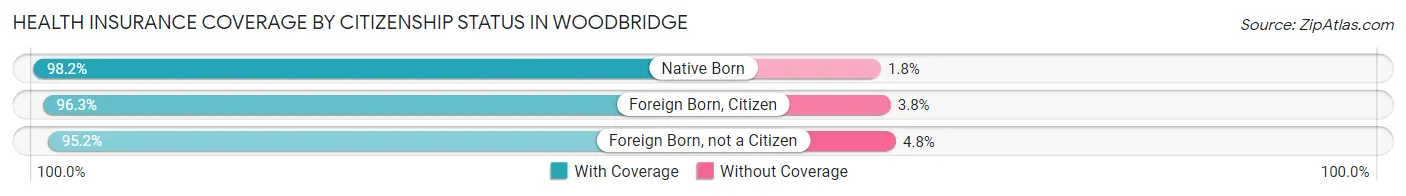
| Citizenship Status | With Coverage | Without Coverage |
| Native Born | 1,768 (98.2%) | 33 (1.8%) |
| Foreign Born, Citizen | 3,257 (96.3%) | 127 (3.7%) |
| Foreign Born, not a Citizen | 1,297 (95.2%) | 65 (4.8%) |
Health Insurance Coverage by Household Income in Woodbridge
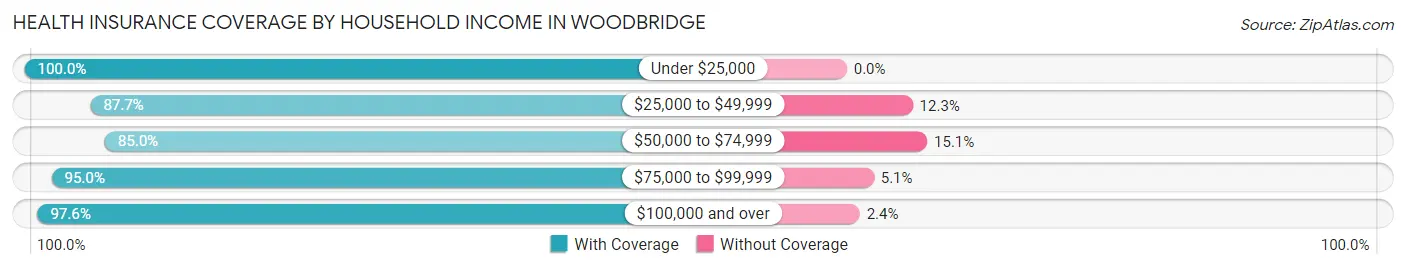
| Household Income | With Coverage | Without Coverage |
| Under $25,000 | 1,242 (100.0%) | 0 (0.0%) |
| $25,000 to $49,999 | 1,754 (87.7%) | 247 (12.3%) |
| $50,000 to $74,999 | 1,869 (85.0%) | 331 (15.0%) |
| $75,000 to $99,999 | 2,837 (95.0%) | 151 (5.1%) |
| $100,000 and over | 12,151 (97.6%) | 301 (2.4%) |
Public vs Private Health Insurance Coverage by Age in Woodbridge
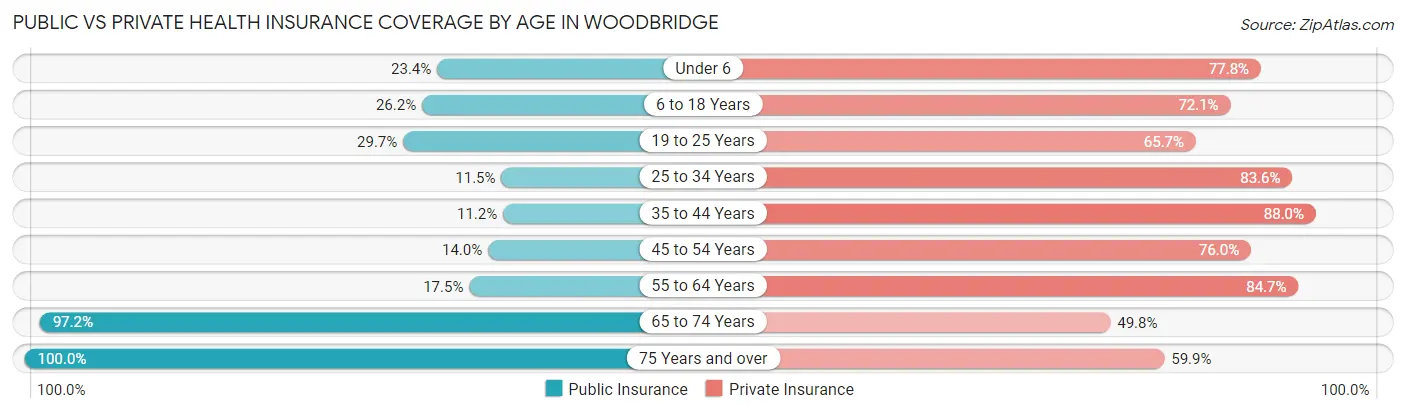
| Age Bracket | Public Insurance | Private Insurance |
| Under 6 | 422 (23.4%) | 1,401 (77.8%) |
| 6 to 18 Years | 888 (26.2%) | 2,441 (72.1%) |
| 19 to 25 Years | 405 (29.7%) | 895 (65.7%) |
| 25 to 34 Years | 340 (11.5%) | 2,469 (83.6%) |
| 35 to 44 Years | 355 (11.2%) | 2,792 (88.0%) |
| 45 to 54 Years | 474 (14.0%) | 2,575 (76.0%) |
| 55 to 64 Years | 395 (17.5%) | 1,916 (84.7%) |
| 65 to 74 Years | 1,414 (97.2%) | 725 (49.8%) |
| 75 Years and over | 1,111 (100.0%) | 665 (59.9%) |
| Total | 5,804 (27.8%) | 15,879 (76.0%) |
Disability Status by Sex by Age in Woodbridge
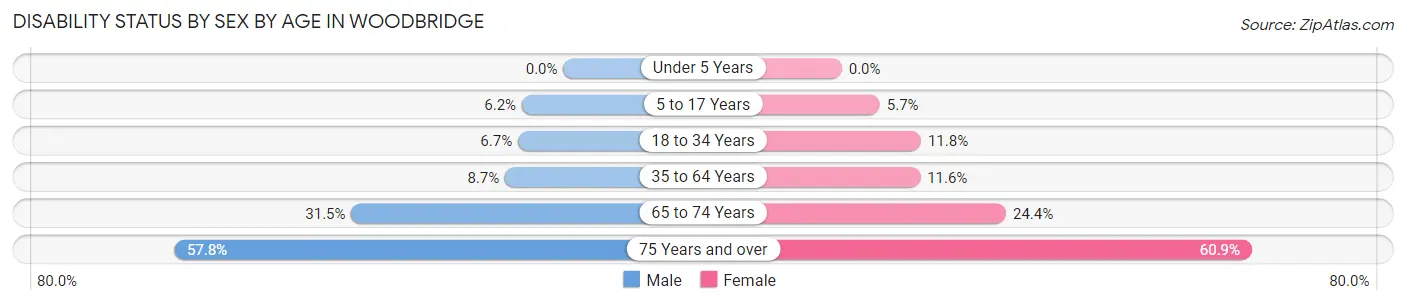
| Age Bracket | Male | Female |
| Under 5 Years | 0 (0.0%) | 0 (0.0%) |
| 5 to 17 Years | 119 (6.1%) | 84 (5.7%) |
| 18 to 34 Years | 159 (6.7%) | 263 (11.8%) |
| 35 to 64 Years | 375 (8.7%) | 523 (11.6%) |
| 65 to 74 Years | 187 (31.5%) | 210 (24.4%) |
| 75 Years and over | 329 (57.8%) | 330 (60.9%) |
Disability Class by Sex by Age in Woodbridge
Disability Class: Hearing Difficulty
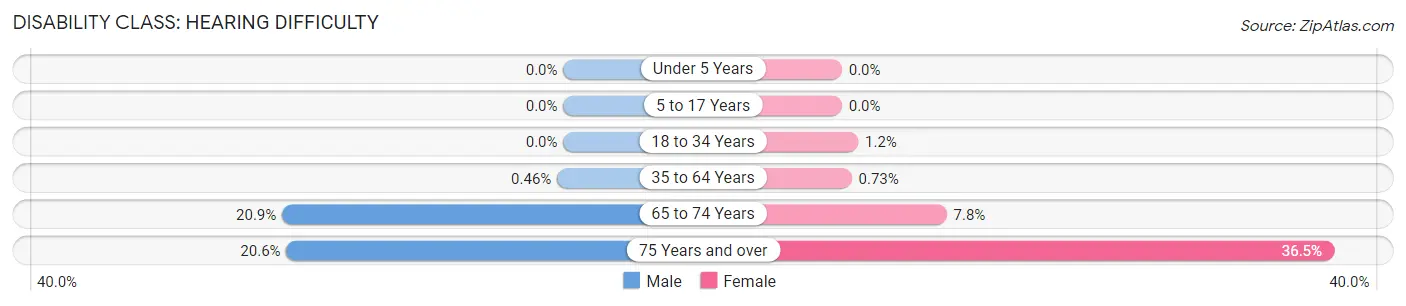
| Age Bracket | Male | Female |
| Under 5 Years | 0 (0.0%) | 0 (0.0%) |
| 5 to 17 Years | 0 (0.0%) | 0 (0.0%) |
| 18 to 34 Years | 0 (0.0%) | 27 (1.2%) |
| 35 to 64 Years | 20 (0.5%) | 33 (0.7%) |
| 65 to 74 Years | 124 (20.9%) | 67 (7.8%) |
| 75 Years and over | 117 (20.6%) | 198 (36.5%) |
Disability Class: Vision Difficulty
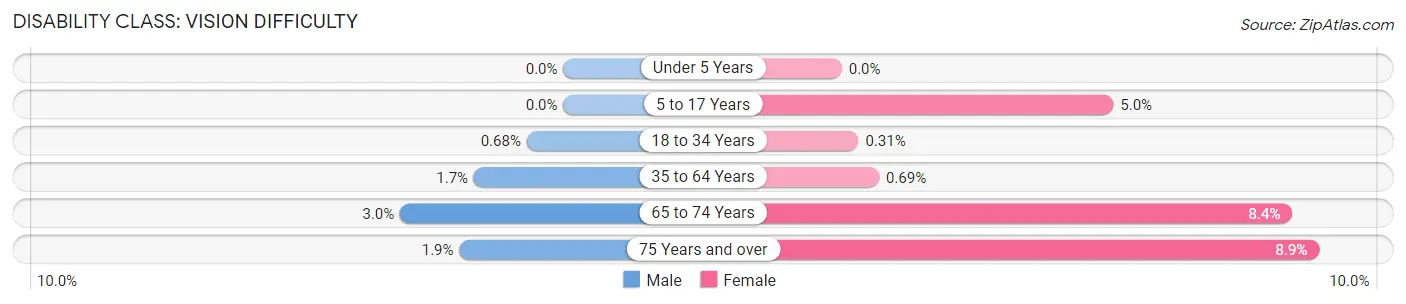
| Age Bracket | Male | Female |
| Under 5 Years | 0 (0.0%) | 0 (0.0%) |
| 5 to 17 Years | 0 (0.0%) | 75 (5.0%) |
| 18 to 34 Years | 16 (0.7%) | 7 (0.3%) |
| 35 to 64 Years | 72 (1.7%) | 31 (0.7%) |
| 65 to 74 Years | 18 (3.0%) | 72 (8.4%) |
| 75 Years and over | 11 (1.9%) | 48 (8.9%) |
Disability Class: Cognitive Difficulty
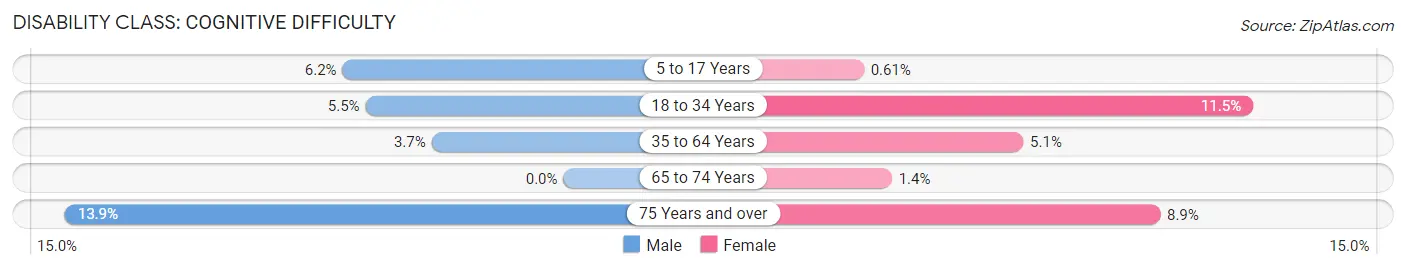
| Age Bracket | Male | Female |
| 5 to 17 Years | 119 (6.1%) | 9 (0.6%) |
| 18 to 34 Years | 130 (5.5%) | 256 (11.5%) |
| 35 to 64 Years | 159 (3.7%) | 227 (5.1%) |
| 65 to 74 Years | 0 (0.0%) | 12 (1.4%) |
| 75 Years and over | 79 (13.9%) | 48 (8.9%) |
Disability Class: Ambulatory Difficulty
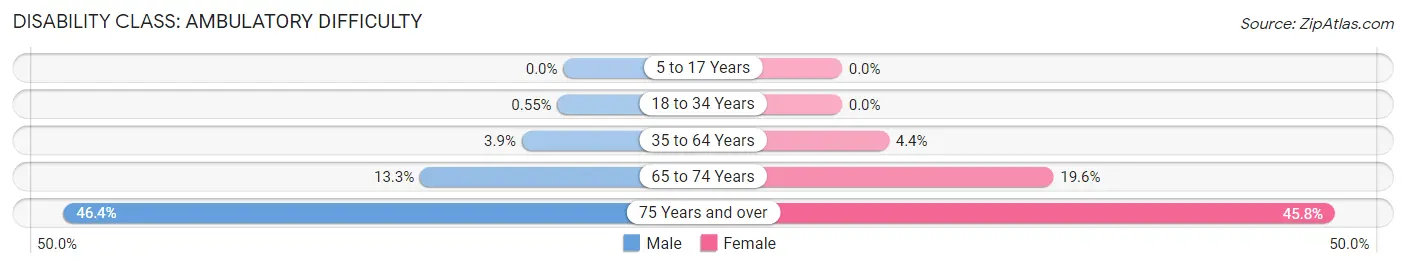
| Age Bracket | Male | Female |
| 5 to 17 Years | 0 (0.0%) | 0 (0.0%) |
| 18 to 34 Years | 13 (0.5%) | 0 (0.0%) |
| 35 to 64 Years | 167 (3.9%) | 196 (4.4%) |
| 65 to 74 Years | 79 (13.3%) | 169 (19.6%) |
| 75 Years and over | 264 (46.4%) | 248 (45.8%) |
Disability Class: Self-Care Difficulty
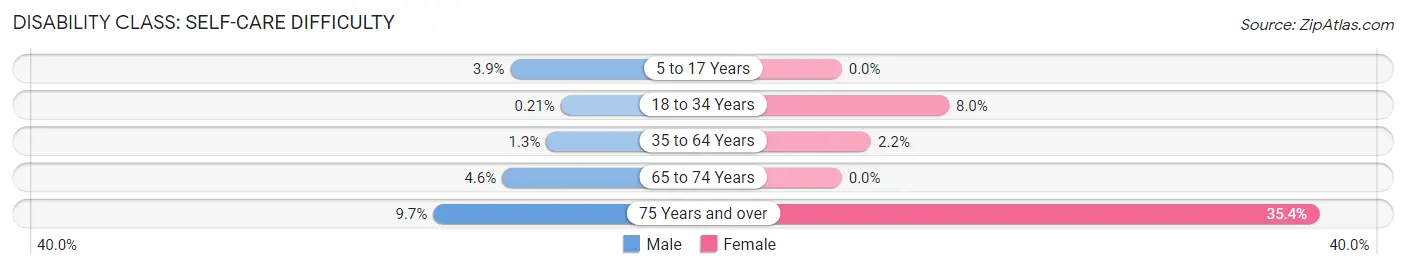
| Age Bracket | Male | Female |
| 5 to 17 Years | 76 (3.9%) | 0 (0.0%) |
| 18 to 34 Years | 5 (0.2%) | 178 (8.0%) |
| 35 to 64 Years | 55 (1.3%) | 98 (2.2%) |
| 65 to 74 Years | 27 (4.5%) | 0 (0.0%) |
| 75 Years and over | 55 (9.7%) | 192 (35.4%) |
Technology Access in Woodbridge
Computing Device Access in Woodbridge
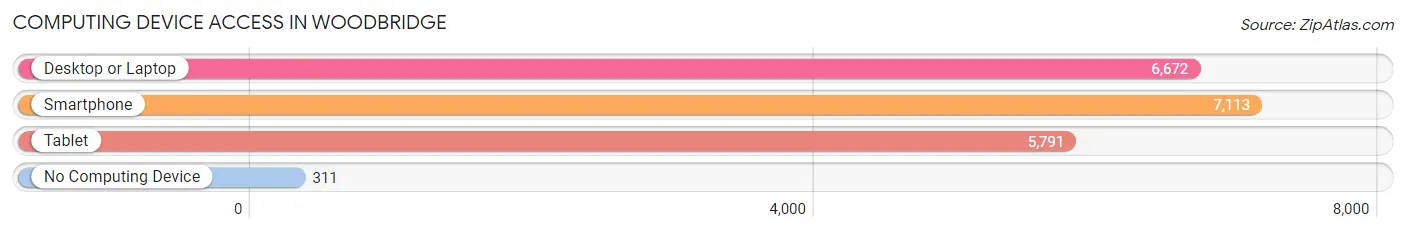
| Device Type | # Households | % Households |
| Desktop or Laptop | 6,672 | 85.4% |
| Smartphone | 7,113 | 91.0% |
| Tablet | 5,791 | 74.1% |
| No Computing Device | 311 | 4.0% |
| Total | 7,812 | 100.0% |
Internet Access in Woodbridge
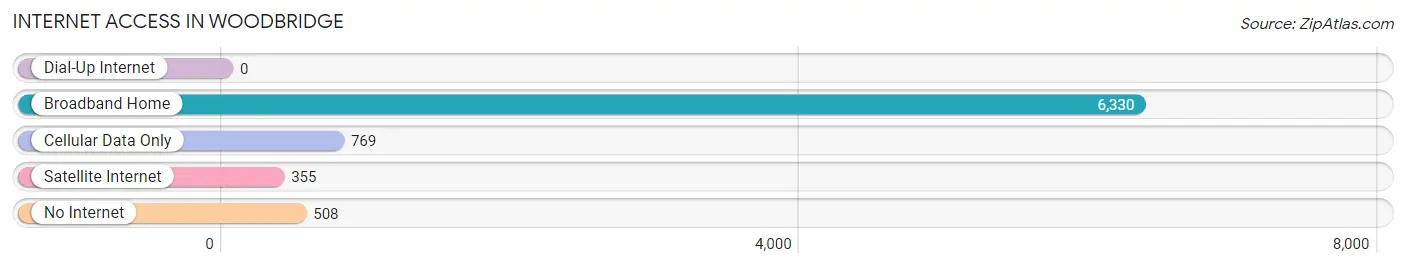
| Internet Type | # Households | % Households |
| Dial-Up Internet | 0 | 0.0% |
| Broadband Home | 6,330 | 81.0% |
| Cellular Data Only | 769 | 9.8% |
| Satellite Internet | 355 | 4.5% |
| No Internet | 508 | 6.5% |
| Total | 7,812 | 100.0% |
Woodbridge Summary
Introduction
Woodbridge is a township located in Middlesex County, New Jersey. It is the oldest original township in the state and was founded in 1669. The township is home to a diverse population of over 100,000 people and is a major hub for transportation, commerce, and industry. This paper will provide an overview of the history, geography, economy, and demographics of Woodbridge Township in 2000 words.
History
Woodbridge Township was founded in 1669 by John Bowne, a Quaker settler from Long Island. The township was named after the wooded area that surrounded it. The area was originally inhabited by the Lenape Native Americans, who were displaced by the settlers. The township was part of the original Elizabethtown Tract, which was granted to the settlers by the British Crown.
In the 18th century, Woodbridge Township was a major agricultural center, producing wheat, corn, and other crops. The township was also home to several mills, which provided employment for many of the residents.
In the 19th century, the township began to industrialize. The Central Railroad of New Jersey opened a line through the township in 1864, connecting it to New York City and other major cities. This allowed for the development of factories and other industries in the area.
The 20th century saw the continued growth of Woodbridge Township. The township was home to several military bases during World War II, and the population grew rapidly after the war. The township also saw the development of several shopping centers and malls, as well as the construction of the Garden State Parkway in 1955.
Geography
Woodbridge Township is located in Middlesex County, New Jersey. It is bordered by the Raritan River to the east, the Rahway River to the south, and the Arthur Kill to the west. The township covers an area of approximately 24 square miles and is home to several parks and recreational areas.
The township is located in the northern part of the state, approximately 25 miles from New York City. It is part of the New York metropolitan area and is connected to the city by several major highways, including the Garden State Parkway, the New Jersey Turnpike, and Interstate 287.
Economy
Woodbridge Township has a diverse economy, with a mix of manufacturing, retail, and service industries. The township is home to several major employers, including Johnson & Johnson, Merck & Co., and Prudential Financial.
The township is also home to several shopping centers and malls, including Woodbridge Center, Menlo Park Mall, and Brunswick Square Mall. These malls provide employment for many of the township’s residents.
The township is also home to several industrial parks, which provide employment for many of the township’s residents. These parks are home to a variety of businesses, including pharmaceutical companies, food processing plants, and electronics manufacturers.
Demographics
As of the 2010 census, Woodbridge Township had a population of 99,585. The population is diverse, with a mix of races and ethnicities. The largest racial group is White (63.3%), followed by Hispanic or Latino (19.2%), Asian (10.2%), and African American (7.3%).
The median household income in the township is $76,837, and the median home value is $346,400. The unemployment rate is 4.2%, which is lower than the national average.
Conclusion
Woodbridge Township is a diverse and vibrant community located in Middlesex County, New Jersey. The township has a rich history, and it has been a major hub for transportation, commerce, and industry for centuries. The township is home to a diverse population and a diverse economy, with a mix of manufacturing, retail, and service industries. The township is also home to several shopping centers and malls, as well as several industrial parks. The population is diverse, with a mix of races and ethnicities, and the median household income is higher than the national average.
Common Questions
What is Per Capita Income in Woodbridge?
Per Capita income in Woodbridge is $43,125.
What is the Median Family Income in Woodbridge?
Median Family Income in Woodbridge is $121,356.
What is the Median Household income in Woodbridge?
Median Household Income in Woodbridge is $103,481.
What is Income or Wage Gap in Woodbridge?
Income or Wage Gap in Woodbridge is 37.9%.
Women in Woodbridge earn 62.1 cents for every dollar earned by a man.
What is Family Income Deficit in Woodbridge?
Family Income Deficit in Woodbridge is $11,893.
Families that are below poverty line in Woodbridge earn $11,893 less on average than the poverty threshold level.
What is Inequality or Gini Index in Woodbridge?
Inequality or Gini Index in Woodbridge is 0.36.
What is the Total Population of Woodbridge?
Total Population of Woodbridge is 20,927.
What is the Total Male Population of Woodbridge?
Total Male Population of Woodbridge is 10,517.
What is the Total Female Population of Woodbridge?
Total Female Population of Woodbridge is 10,410.
What is the Ratio of Males per 100 Females in Woodbridge?
There are 101.03 Males per 100 Females in Woodbridge.
What is the Ratio of Females per 100 Males in Woodbridge?
There are 98.98 Females per 100 Males in Woodbridge.
What is the Median Population Age in Woodbridge?
Median Population Age in Woodbridge is 37.9 Years.
What is the Average Family Size in Woodbridge
Average Family Size in Woodbridge is 3.1 People.
What is the Average Household Size in Woodbridge
Average Household Size in Woodbridge is 2.7 People.
How Large is the Labor Force in Woodbridge?
There are 11,684 People in the Labor Forcein in Woodbridge.
What is the Percentage of People in the Labor Force in Woodbridge?
69.4% of People are in the Labor Force in Woodbridge.
What is the Unemployment Rate in Woodbridge?
Unemployment Rate in Woodbridge is 6.4%.