Cities with the Highest Percentage of Hispanic or Latino Population in Indiana
RELATED REPORTS & OPTIONS
Hispanic or Latino
Indiana
Compare Cities
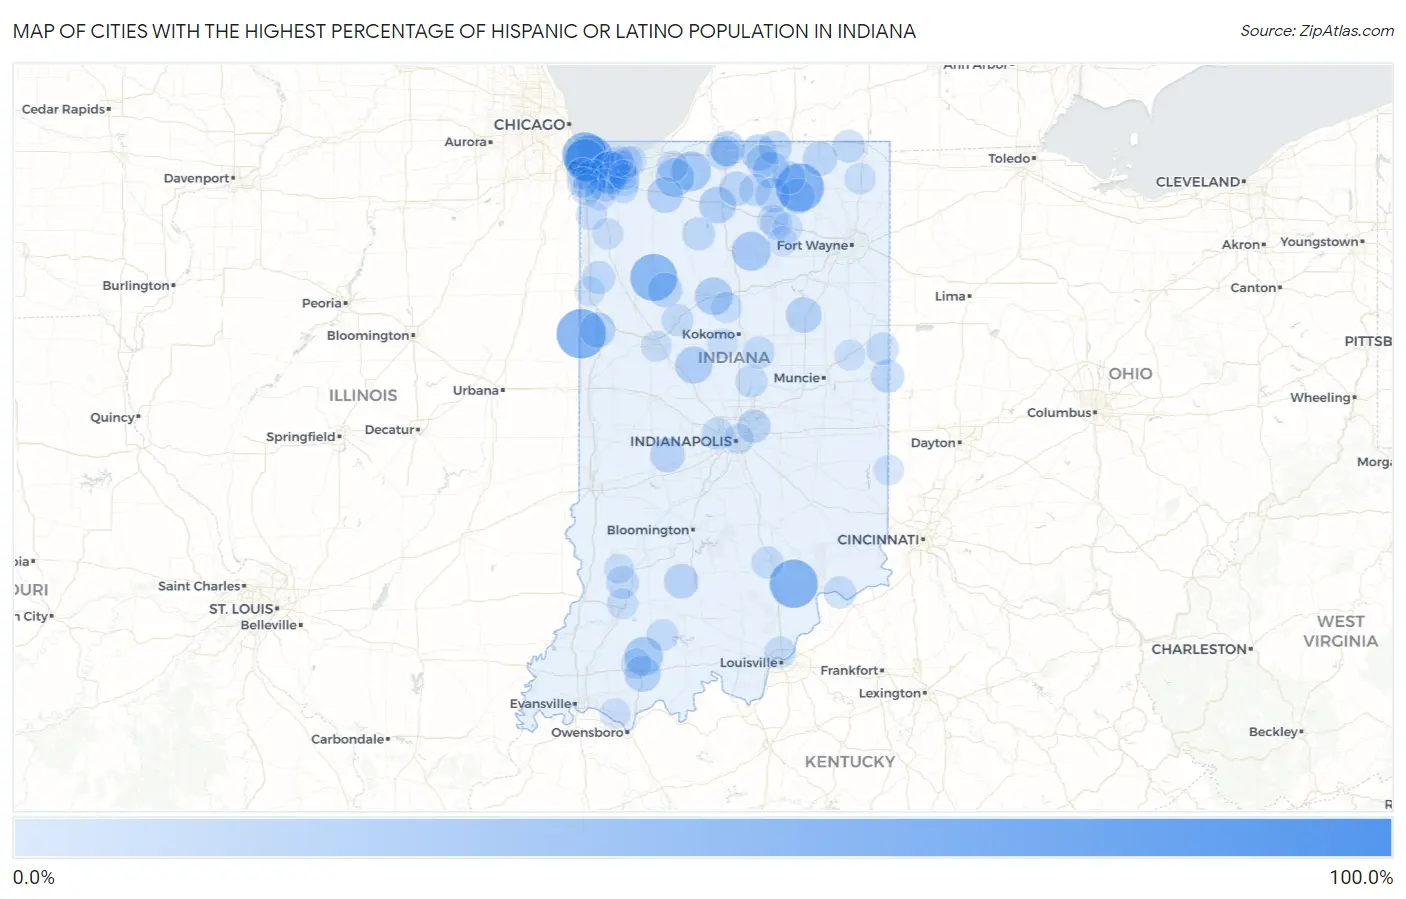
Map of Cities with the Highest Percentage of Hispanic or Latino Population in Indiana
0.0%
100.0%
Cities with the Highest Percentage of Hispanic or Latino Population in Indiana
| City | Hispanic or Latino | vs State | vs National | |
| 1. | Fair Oaks | 100.0% | 7.5%(+92.5)#1 | 18.7%(+81.3)#214 |
| 2. | Linn Grove | 94.0% | 7.5%(+86.5)#2 | 18.7%(+75.4)#681 |
| 3. | Hillisburg | 89.3% | 7.5%(+81.8)#3 | 18.7%(+70.6)#798 |
| 4. | Pence | 78.5% | 7.5%(+71.0)#4 | 18.7%(+59.9)#1,043 |
| 5. | Ireland | 75.3% | 7.5%(+67.8)#5 | 18.7%(+56.7)#1,118 |
| 6. | Ambia | 61.3% | 7.5%(+53.8)#6 | 18.7%(+42.7)#1,507 |
| 7. | Deputy | 57.9% | 7.5%(+50.4)#7 | 18.7%(+39.2)#1,627 |
| 8. | Ligonier | 57.5% | 7.5%(+49.9)#8 | 18.7%(+38.8)#1,642 |
| 9. | Monon | 54.9% | 7.5%(+47.3)#9 | 18.7%(+36.2)#1,737 |
| 10. | East Chicago | 54.8% | 7.5%(+47.2)#10 | 18.7%(+36.1)#1,744 |
| 11. | Whiting | 50.5% | 7.5%(+43.0)#11 | 18.7%(+31.9)#1,926 |
| 12. | Brimfield | 48.3% | 7.5%(+40.8)#12 | 18.7%(+29.7)#2,048 |
| 13. | Hammond | 40.4% | 7.5%(+32.9)#13 | 18.7%(+21.7)#2,486 |
| 14. | New Chicago | 38.7% | 7.5%(+31.2)#14 | 18.7%(+20.1)#2,592 |
| 15. | Fish Lake | 34.7% | 7.5%(+27.1)#15 | 18.7%(+16.0)#2,915 |
| 16. | Akron | 33.2% | 7.5%(+25.7)#16 | 18.7%(+14.6)#3,055 |
| 17. | Huntingburg | 32.0% | 7.5%(+24.5)#17 | 18.7%(+13.4)#3,169 |
| 18. | Kingsbury | 31.7% | 7.5%(+24.2)#18 | 18.7%(+13.1)#3,201 |
| 19. | Lake Station | 30.8% | 7.5%(+23.2)#19 | 18.7%(+12.1)#3,309 |
| 20. | Philadelphia | 30.3% | 7.5%(+22.8)#20 | 18.7%(+11.7)#3,356 |
| 21. | Rockfield | 30.3% | 7.5%(+22.7)#21 | 18.7%(+11.6)#3,363 |
| 22. | Logansport | 29.9% | 7.5%(+22.4)#22 | 18.7%(+11.3)#3,405 |
| 23. | Frankfort | 28.6% | 7.5%(+21.1)#23 | 18.7%(+9.97)#3,546 |
| 24. | Plymouth | 27.5% | 7.5%(+20.0)#24 | 18.7%(+8.88)#3,689 |
| 25. | Elkhart | 26.2% | 7.5%(+18.7)#25 | 18.7%(+7.56)#3,868 |
| 26. | Goshen | 26.0% | 7.5%(+18.5)#26 | 18.7%(+7.39)#3,882 |
| 27. | Dale | 25.6% | 7.5%(+18.0)#27 | 18.7%(+6.93)#3,944 |
| 28. | Hanna | 24.5% | 7.5%(+17.0)#28 | 18.7%(+5.83)#4,100 |
| 29. | Landess | 24.5% | 7.5%(+16.9)#29 | 18.7%(+5.82)#4,103 |
| 30. | Boswell | 24.0% | 7.5%(+16.5)#30 | 18.7%(+5.34)#4,186 |
| 31. | Indian Village | 23.3% | 7.5%(+15.8)#31 | 18.7%(+4.66)#4,313 |
| 32. | Malden | 22.7% | 7.5%(+15.2)#32 | 18.7%(+4.09)#4,406 |
| 33. | Cromwell | 22.7% | 7.5%(+15.1)#33 | 18.7%(+4.00)#4,423 |
| 34. | Milford | 22.2% | 7.5%(+14.7)#34 | 18.7%(+3.60)#4,494 |
| 35. | Fillmore | 21.9% | 7.5%(+14.4)#35 | 18.7%(+3.25)#4,558 |
| 36. | Williams | 21.7% | 7.5%(+14.2)#36 | 18.7%(+3.09)#4,588 |
| 37. | Spencerville | 21.6% | 7.5%(+14.1)#37 | 18.7%(+2.97)#4,614 |
| 38. | Norway | 21.4% | 7.5%(+13.9)#38 | 18.7%(+2.78)#4,654 |
| 39. | Bremen | 21.0% | 7.5%(+13.5)#39 | 18.7%(+2.39)#4,735 |
| 40. | Lagrange | 20.6% | 7.5%(+13.1)#40 | 18.7%(+1.97)#4,821 |
| 41. | Benton | 19.9% | 7.5%(+12.4)#41 | 18.7%(+1.28)#4,978 |
| 42. | Bristol | 19.3% | 7.5%(+11.7)#42 | 18.7%(+0.628)#5,134 |
| 43. | Portage | 19.2% | 7.5%(+11.7)#43 | 18.7%(+0.589)#5,146 |
| 44. | Otisco | 18.9% | 7.5%(+11.4)#44 | 18.7%(+0.267)#5,206 |
| 45. | Lawrence | 18.5% | 7.5%(+11.0)#45 | 18.7%(-0.163)#5,304 |
| 46. | Union City | 18.5% | 7.5%(+10.9)#46 | 18.7%(-0.196)#5,317 |
| 47. | Millersburg | 18.1% | 7.5%(+10.5)#47 | 18.7%(-0.578)#5,420 |
| 48. | Griffith | 17.8% | 7.5%(+10.2)#48 | 18.7%(-0.898)#5,514 |
| 49. | Monterey | 17.7% | 7.5%(+10.1)#49 | 18.7%(-0.987)#5,535 |
| 50. | Brook | 17.5% | 7.5%(+9.97)#50 | 18.7%(-1.15)#5,582 |
| 51. | Merrillville | 17.3% | 7.5%(+9.80)#51 | 18.7%(-1.32)#5,634 |
| 52. | Orland | 17.0% | 7.5%(+9.51)#52 | 18.7%(-1.61)#5,727 |
| 53. | Plainville | 17.0% | 7.5%(+9.44)#53 | 18.7%(-1.68)#5,746 |
| 54. | Hobart | 16.7% | 7.5%(+9.19)#54 | 18.7%(-1.93)#5,810 |
| 55. | Dunlap | 16.5% | 7.5%(+8.99)#55 | 18.7%(-2.13)#5,865 |
| 56. | Salamonia | 16.4% | 7.5%(+8.84)#56 | 18.7%(-2.28)#5,917 |
| 57. | South Bend | 16.4% | 7.5%(+8.84)#57 | 18.7%(-2.28)#5,920 |
| 58. | Arcadia | 15.8% | 7.5%(+8.29)#58 | 18.7%(-2.83)#6,101 |
| 59. | Nappanee | 15.8% | 7.5%(+8.22)#59 | 18.7%(-2.90)#6,131 |
| 60. | Seymour | 15.7% | 7.5%(+8.14)#60 | 18.7%(-2.98)#6,147 |
| 61. | Delphi | 15.6% | 7.5%(+8.05)#61 | 18.7%(-3.07)#6,181 |
| 62. | Clermont | 15.5% | 7.5%(+7.99)#62 | 18.7%(-3.13)#6,200 |
| 63. | Windfall City | 15.4% | 7.5%(+7.87)#63 | 18.7%(-3.25)#6,223 |
| 64. | Schererville | 15.3% | 7.5%(+7.73)#64 | 18.7%(-3.39)#6,271 |
| 65. | Brooksburg | 15.3% | 7.5%(+7.72)#65 | 18.7%(-3.40)#6,275 |
| 66. | Salt Creek Commons | 14.9% | 7.5%(+7.35)#66 | 18.7%(-3.77)#6,404 |
| 67. | Pleasantville | 14.5% | 7.5%(+6.94)#67 | 18.7%(-4.18)#6,559 |
| 68. | Shorewood Forest | 14.3% | 7.5%(+6.78)#68 | 18.7%(-4.34)#6,612 |
| 69. | Burns Harbor | 14.3% | 7.5%(+6.75)#69 | 18.7%(-4.37)#6,624 |
| 70. | Clarksville | 14.2% | 7.5%(+6.72)#70 | 18.7%(-4.40)#6,634 |
| 71. | Munster | 13.9% | 7.5%(+6.35)#71 | 18.7%(-4.77)#6,764 |
| 72. | Winona Lake | 13.8% | 7.5%(+6.24)#72 | 18.7%(-4.88)#6,805 |
| 73. | Dubois | 13.8% | 7.5%(+6.23)#73 | 18.7%(-4.89)#6,809 |
| 74. | Ashley | 13.5% | 7.5%(+5.95)#74 | 18.7%(-5.17)#6,933 |
| 75. | Young America | 13.3% | 7.5%(+5.80)#75 | 18.7%(-5.32)#6,996 |
| 76. | La Porte | 13.1% | 7.5%(+5.52)#76 | 18.7%(-5.60)#7,112 |
| 77. | Walton | 13.0% | 7.5%(+5.46)#77 | 18.7%(-5.66)#7,152 |
| 78. | Roselawn | 12.7% | 7.5%(+5.14)#78 | 18.7%(-5.98)#7,291 |
| 79. | Lafayette | 12.5% | 7.5%(+4.96)#79 | 18.7%(-6.16)#7,362 |
| 80. | St John | 12.4% | 7.5%(+4.91)#80 | 18.7%(-6.21)#7,380 |
| 81. | Washington | 12.1% | 7.5%(+4.59)#81 | 18.7%(-6.53)#7,535 |
| 82. | Crown Point | 12.1% | 7.5%(+4.56)#82 | 18.7%(-6.56)#7,556 |
| 83. | Warsaw | 12.1% | 7.5%(+4.55)#83 | 18.7%(-6.57)#7,560 |
| 84. | Hatfield | 12.0% | 7.5%(+4.46)#84 | 18.7%(-6.66)#7,597 |
| 85. | Redkey | 12.0% | 7.5%(+4.43)#85 | 18.7%(-6.69)#7,612 |
| 86. | Holland | 11.9% | 7.5%(+4.40)#86 | 18.7%(-6.72)#7,629 |
| 87. | Porter | 11.9% | 7.5%(+4.36)#87 | 18.7%(-6.76)#7,646 |
| 88. | Lowell | 11.4% | 7.5%(+3.91)#88 | 18.7%(-7.21)#7,888 |
| 89. | Notre Dame | 11.4% | 7.5%(+3.89)#89 | 18.7%(-7.23)#7,895 |
| 90. | Russiaville | 11.4% | 7.5%(+3.88)#90 | 18.7%(-7.24)#7,899 |
| 91. | Dyer | 11.3% | 7.5%(+3.79)#91 | 18.7%(-7.33)#7,947 |
| 92. | Indianapolis | 10.9% | 7.5%(+3.38)#92 | 18.7%(-7.74)#8,166 |
| 93. | Ogden Dunes | 10.8% | 7.5%(+3.30)#93 | 18.7%(-7.82)#8,219 |
| 94. | West College Corner | 10.6% | 7.5%(+3.12)#94 | 18.7%(-8.00)#8,311 |
| 95. | Pierceton | 10.6% | 7.5%(+3.11)#95 | 18.7%(-8.01)#8,314 |
| 96. | Sidney | 10.5% | 7.5%(+2.99)#96 | 18.7%(-8.13)#8,385 |
| 97. | South Haven | 10.4% | 7.5%(+2.87)#97 | 18.7%(-8.25)#8,471 |
| 98. | Kentland | 10.3% | 7.5%(+2.74)#98 | 18.7%(-8.38)#8,543 |
| 99. | Servia | 10.1% | 7.5%(+2.57)#99 | 18.7%(-8.55)#8,643 |
| 100. | Sandborn | 9.9% | 7.5%(+2.34)#100 | 18.7%(-8.78)#8,796 |
Common Questions
What are the Top 10 Cities with the Highest Percentage of Hispanic or Latino Population in Indiana?
Top 10 Cities with the Highest Percentage of Hispanic or Latino Population in Indiana are:
#1
61.3%
#2
57.9%
#3
57.5%
#4
54.9%
#5
54.8%
#6
50.5%
#7
40.4%
#8
38.7%
#9
34.7%
#10
33.2%
What city has the Highest Percentage of Hispanic or Latino Population in Indiana?
Ambia has the Highest Percentage of Hispanic or Latino Population in Indiana with 61.3%.
What is the Percentage of Hispanic or Latino Population in the State of Indiana?
Percentage of Hispanic or Latino Population in Indiana is 7.5%.
What is the Percentage of Hispanic or Latino Population in the United States?
Percentage of Hispanic or Latino Population in the United States is 18.7%.