Elmwood Park borough, NJ Map & Demographics
Elmwood Park borough Overview
$36,519
PER CAPITA INCOME
$96,818
AVG FAMILY INCOME
$84,578
AVG HOUSEHOLD INCOME
23.6%
WAGE / INCOME GAP [ % ]
76.4¢/ $1
WAGE / INCOME GAP [ $ ]
$14,494
FAMILY INCOME DEFICIT
0.42
INEQUALITY / GINI INDEX
21,261
TOTAL POPULATION
10,075
MALE POPULATION
11,186
FEMALE POPULATION
90.07
MALES / 100 FEMALES
111.03
FEMALES / 100 MALES
39.1
MEDIAN AGE
3.4
AVG FAMILY SIZE
2.9
AVG HOUSEHOLD SIZE
11,575
LABOR FORCE [ PEOPLE ]
67.4%
PERCENT IN LABOR FORCE
6.6%
UNEMPLOYMENT RATE
Income in Elmwood Park borough
Income Overview in Elmwood Park borough
Per Capita Income in Elmwood Park borough is $36,519, while median incomes of families and households are $96,818 and $84,578 respectively.
| Characteristic | Number | Measure |
| Per Capita Income | 21,261 | $36,519 |
| Median Family Income | 5,390 | $96,818 |
| Mean Family Income | 5,390 | $113,521 |
| Median Household Income | 7,220 | $84,578 |
| Mean Household Income | 7,220 | $105,948 |
| Income Deficit | 5,390 | $14,494 |
| Wage / Income Gap (%) | 21,261 | 23.56% |
| Wage / Income Gap ($) | 21,261 | 76.44¢ per $1 |
| Gini / Inequality Index | 21,261 | 0.42 |
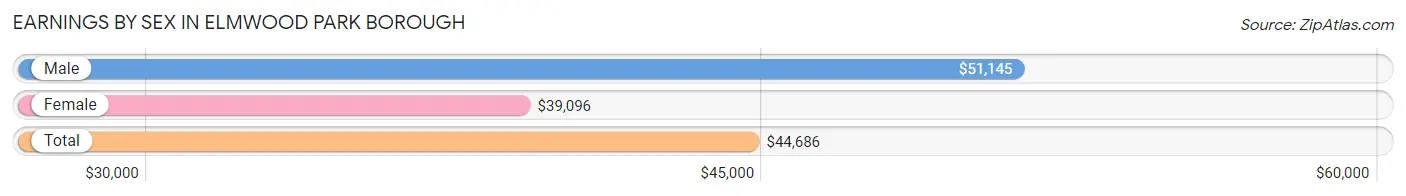
Earnings by Sex in Elmwood Park borough
Average Earnings in Elmwood Park borough are $44,686, $51,145 for men and $39,096 for women, a difference of 23.6%.
| Sex | Number | Average Earnings |
| Male | 5,876 (50.2%) | $51,145 |
| Female | 5,828 (49.8%) | $39,096 |
| Total | 11,704 (100.0%) | $44,686 |
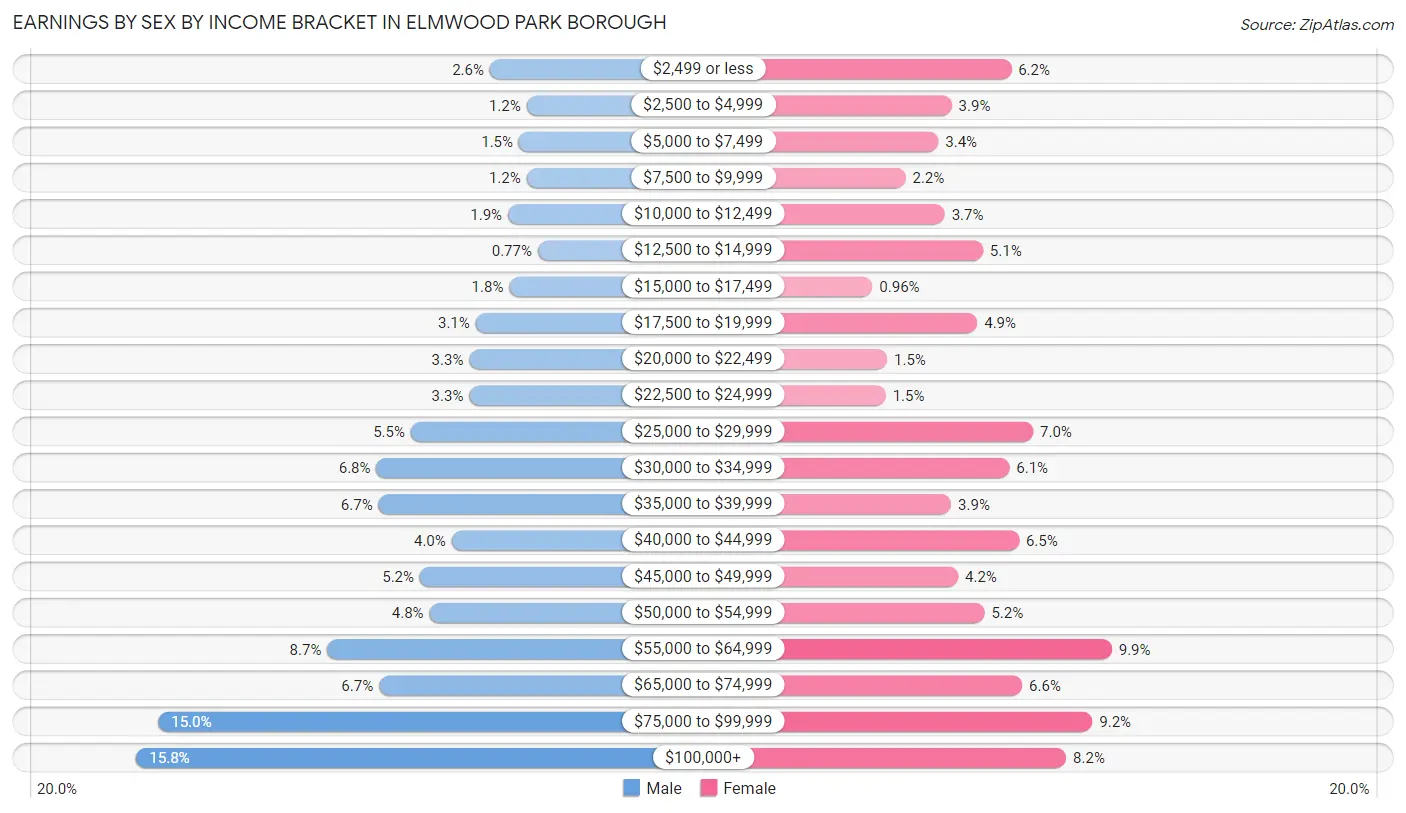
Earnings by Sex by Income Bracket in Elmwood Park borough
The most common earnings brackets in Elmwood Park borough are $100,000+ for men (929 | 15.8%) and $55,000 to $64,999 for women (579 | 9.9%).
| Income | Male | Female |
| $2,499 or less | 151 (2.6%) | 359 (6.2%) |
| $2,500 to $4,999 | 70 (1.2%) | 229 (3.9%) |
| $5,000 to $7,499 | 87 (1.5%) | 200 (3.4%) |
| $7,500 to $9,999 | 70 (1.2%) | 128 (2.2%) |
| $10,000 to $12,499 | 111 (1.9%) | 214 (3.7%) |
| $12,500 to $14,999 | 45 (0.8%) | 297 (5.1%) |
| $15,000 to $17,499 | 108 (1.8%) | 56 (1.0%) |
| $17,500 to $19,999 | 182 (3.1%) | 285 (4.9%) |
| $20,000 to $22,499 | 196 (3.3%) | 88 (1.5%) |
| $22,500 to $24,999 | 196 (3.3%) | 85 (1.5%) |
| $25,000 to $29,999 | 325 (5.5%) | 407 (7.0%) |
| $30,000 to $34,999 | 401 (6.8%) | 355 (6.1%) |
| $35,000 to $39,999 | 396 (6.7%) | 228 (3.9%) |
| $40,000 to $44,999 | 235 (4.0%) | 376 (6.5%) |
| $45,000 to $49,999 | 305 (5.2%) | 243 (4.2%) |
| $50,000 to $54,999 | 284 (4.8%) | 301 (5.2%) |
| $55,000 to $64,999 | 509 (8.7%) | 579 (9.9%) |
| $65,000 to $74,999 | 395 (6.7%) | 383 (6.6%) |
| $75,000 to $99,999 | 881 (15.0%) | 536 (9.2%) |
| $100,000+ | 929 (15.8%) | 479 (8.2%) |
| Total | 5,876 (100.0%) | 5,828 (100.0%) |
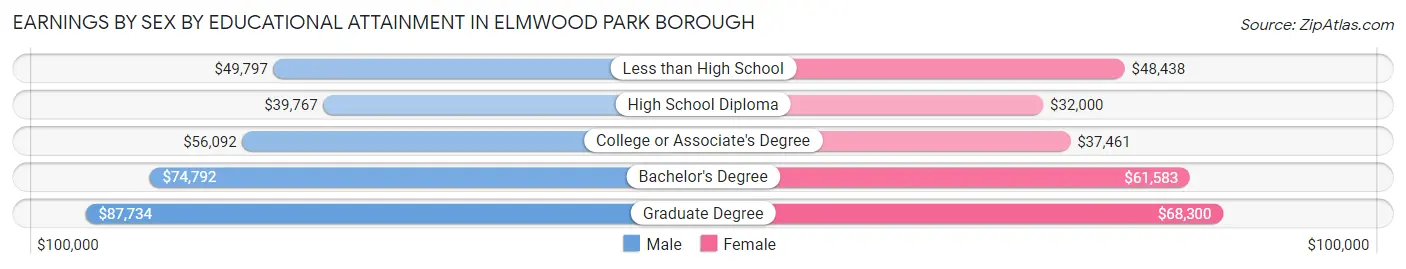
Earnings by Sex by Educational Attainment in Elmwood Park borough
Average earnings in Elmwood Park borough are $58,002 for men and $44,694 for women, a difference of 22.9%. Men with an educational attainment of graduate degree enjoy the highest average annual earnings of $87,734, while those with high school diploma education earn the least with $39,767. Women with an educational attainment of graduate degree earn the most with the average annual earnings of $68,300, while those with high school diploma education have the smallest earnings of $32,000.
| Educational Attainment | Male Income | Female Income |
| Less than High School | $49,797 | $48,438 |
| High School Diploma | $39,767 | $32,000 |
| College or Associate's Degree | $56,092 | $37,461 |
| Bachelor's Degree | $74,792 | $61,583 |
| Graduate Degree | $87,734 | $68,300 |
| Total | $58,002 | $44,694 |
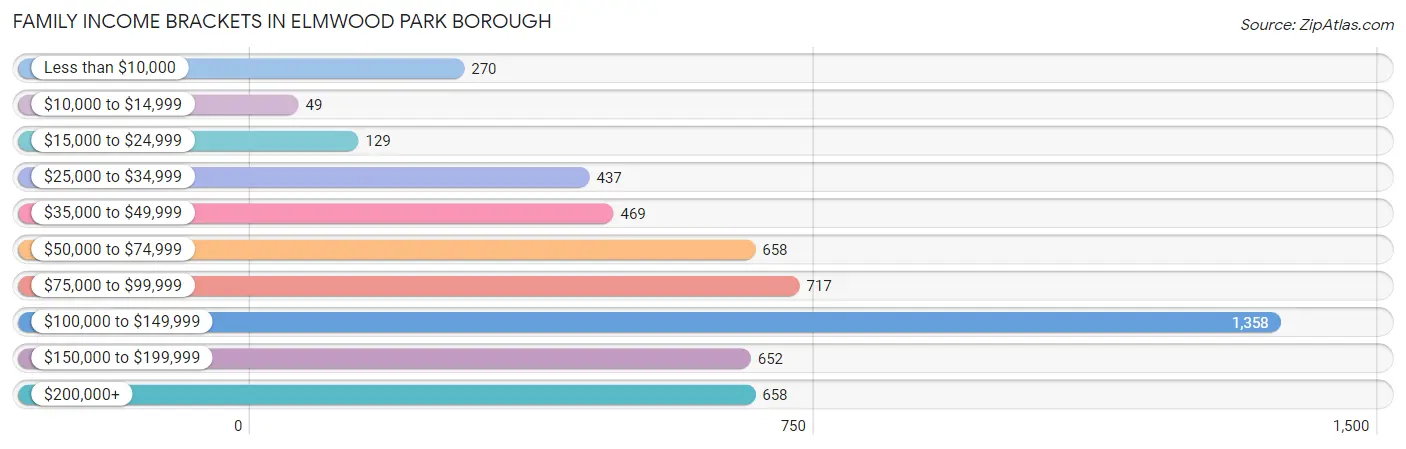
Family Income in Elmwood Park borough
Family Income Brackets in Elmwood Park borough
According to the Elmwood Park borough family income data, there are 1,358 families falling into the $100,000 to $149,999 income range, which is the most common income bracket and makes up 25.2% of all families. Conversely, the $10,000 to $14,999 income bracket is the least frequent group with only 49 families (0.9%) belonging to this category.
| Income Bracket | # Families | % Families |
| Less than $10,000 | 270 | 5.0% |
| $10,000 to $14,999 | 49 | 0.9% |
| $15,000 to $24,999 | 129 | 2.4% |
| $25,000 to $34,999 | 437 | 8.1% |
| $35,000 to $49,999 | 469 | 8.7% |
| $50,000 to $74,999 | 658 | 12.2% |
| $75,000 to $99,999 | 717 | 13.3% |
| $100,000 to $149,999 | 1,358 | 25.2% |
| $150,000 to $199,999 | 652 | 12.1% |
| $200,000+ | 658 | 12.2% |
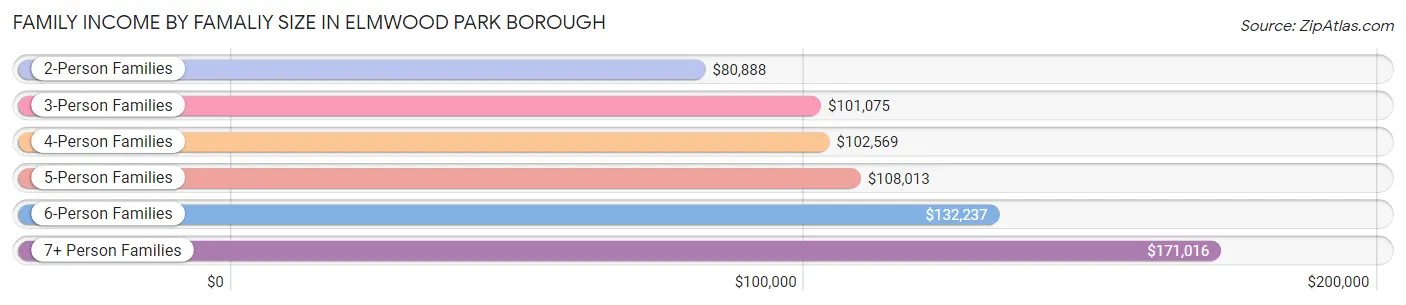
Family Income by Famaliy Size in Elmwood Park borough
7+ person families (155 | 2.9%) account for the highest median family income in Elmwood Park borough with $171,016 per family, while 2-person families (1,972 | 36.6%) have the highest median income of $40,444 per family member.
| Income Bracket | # Families | Median Income |
| 2-Person Families | 1,972 (36.6%) | $80,888 |
| 3-Person Families | 1,252 (23.2%) | $101,075 |
| 4-Person Families | 1,229 (22.8%) | $102,569 |
| 5-Person Families | 490 (9.1%) | $108,013 |
| 6-Person Families | 292 (5.4%) | $132,237 |
| 7+ Person Families | 155 (2.9%) | $171,016 |
| Total | 5,390 (100.0%) | $96,818 |
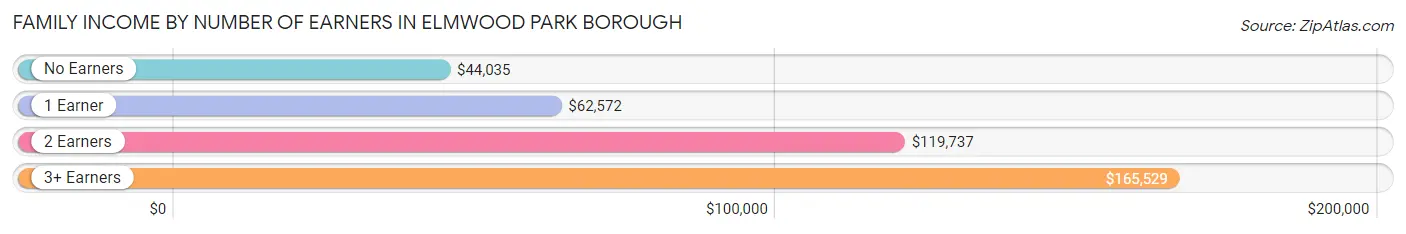
Family Income by Number of Earners in Elmwood Park borough
The median family income in Elmwood Park borough is $96,818, with families comprising 3+ earners (1,083) having the highest median family income of $165,529, while families with no earners (628) have the lowest median family income of $44,035, accounting for 20.1% and 11.7% of families, respectively.
| Number of Earners | # Families | Median Income |
| No Earners | 628 (11.7%) | $44,035 |
| 1 Earner | 1,933 (35.9%) | $62,572 |
| 2 Earners | 1,746 (32.4%) | $119,737 |
| 3+ Earners | 1,083 (20.1%) | $165,529 |
| Total | 5,390 (100.0%) | $96,818 |
Household Income in Elmwood Park borough
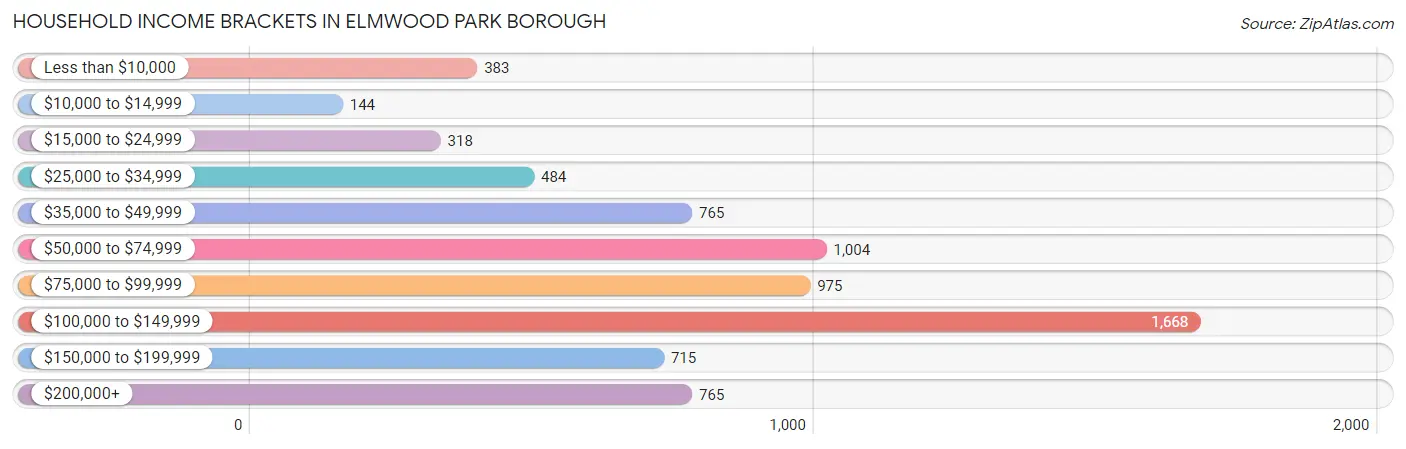
Household Income Brackets in Elmwood Park borough
With 1,668 households falling in the category, the $100,000 to $149,999 income range is the most frequent in Elmwood Park borough, accounting for 23.1% of all households. In contrast, only 144 households (2.0%) fall into the $10,000 to $14,999 income bracket, making it the least populous group.
| Income Bracket | # Households | % Households |
| Less than $10,000 | 383 | 5.3% |
| $10,000 to $14,999 | 144 | 2.0% |
| $15,000 to $24,999 | 318 | 4.4% |
| $25,000 to $34,999 | 484 | 6.7% |
| $35,000 to $49,999 | 765 | 10.6% |
| $50,000 to $74,999 | 1,004 | 13.9% |
| $75,000 to $99,999 | 975 | 13.5% |
| $100,000 to $149,999 | 1,668 | 23.1% |
| $150,000 to $199,999 | 715 | 9.9% |
| $200,000+ | 765 | 10.6% |
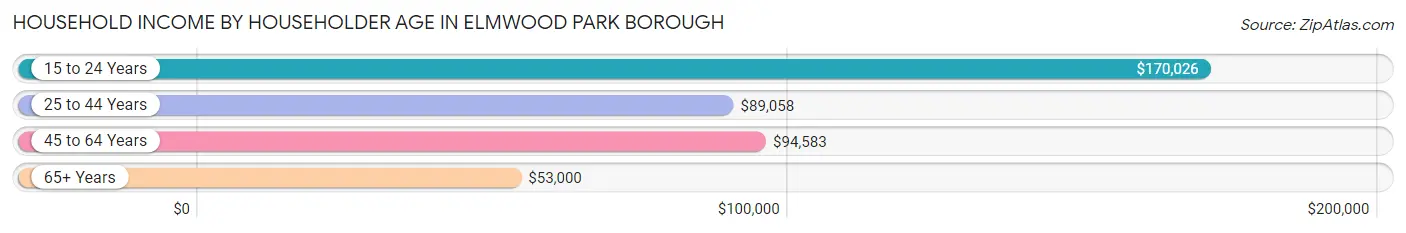
Household Income by Householder Age in Elmwood Park borough
The median household income in Elmwood Park borough is $84,578, with the highest median household income of $170,026 found in the 15 to 24 years age bracket for the primary householder. A total of 183 households (2.5%) fall into this category. Meanwhile, the 65+ years age bracket for the primary householder has the lowest median household income of $53,000, with 2,028 households (28.1%) in this group.
| Income Bracket | # Households | Median Income |
| 15 to 24 Years | 183 (2.5%) | $170,026 |
| 25 to 44 Years | 2,214 (30.7%) | $89,058 |
| 45 to 64 Years | 2,795 (38.7%) | $94,583 |
| 65+ Years | 2,028 (28.1%) | $53,000 |
| Total | 7,220 (100.0%) | $84,578 |
Poverty in Elmwood Park borough
Income Below Poverty by Sex and Age in Elmwood Park borough
With 9.0% poverty level for males and 14.7% for females among the residents of Elmwood Park borough, under 5 year old males and 15 year old females are the most vulnerable to poverty, with 193 males (35.8%) and 42 females (36.8%) in their respective age groups living below the poverty level.
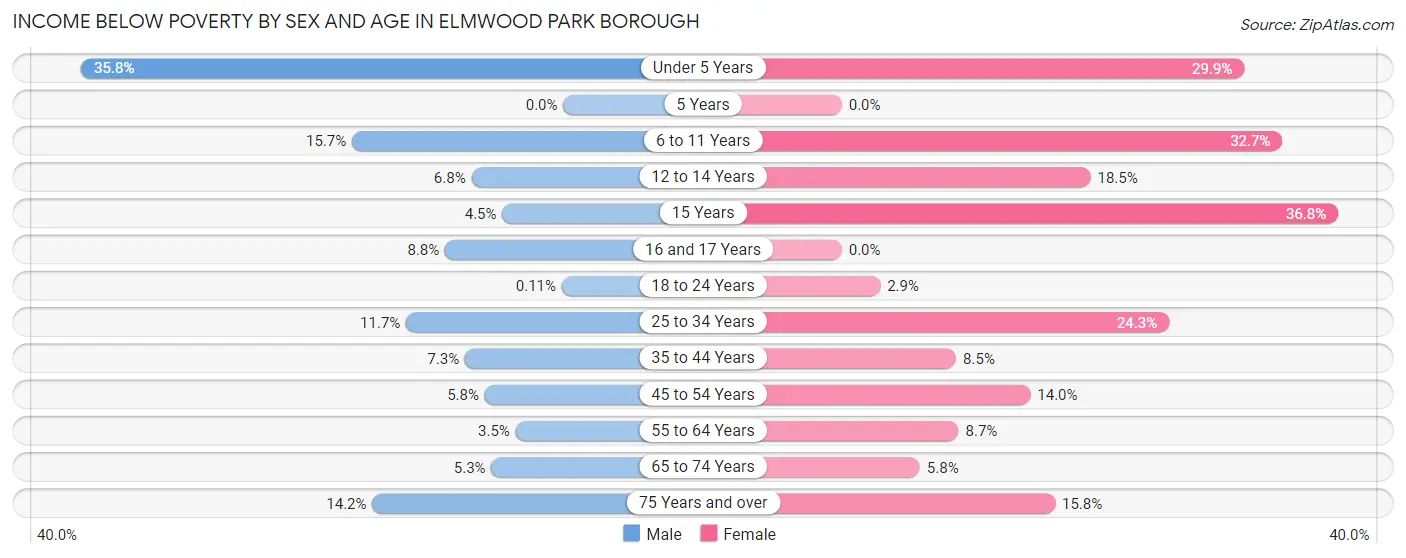
| Age Bracket | Male | Female |
| Under 5 Years | 193 (35.8%) | 253 (29.9%) |
| 5 Years | 0 (0.0%) | 0 (0.0%) |
| 6 to 11 Years | 107 (15.7%) | 224 (32.7%) |
| 12 to 14 Years | 26 (6.8%) | 65 (18.5%) |
| 15 Years | 15 (4.5%) | 42 (36.8%) |
| 16 and 17 Years | 18 (8.8%) | 0 (0.0%) |
| 18 to 24 Years | 1 (0.1%) | 30 (2.9%) |
| 25 to 34 Years | 184 (11.7%) | 393 (24.3%) |
| 35 to 44 Years | 85 (7.3%) | 111 (8.5%) |
| 45 to 54 Years | 78 (5.8%) | 196 (14.0%) |
| 55 to 64 Years | 43 (3.5%) | 133 (8.7%) |
| 65 to 74 Years | 48 (5.3%) | 67 (5.8%) |
| 75 Years and over | 110 (14.2%) | 123 (15.8%) |
| Total | 908 (9.0%) | 1,637 (14.7%) |
Income Above Poverty by Sex and Age in Elmwood Park borough
According to the poverty statistics in Elmwood Park borough, males aged 5 years and females aged 5 years are the age groups that are most secure financially, with 100.0% of males and 100.0% of females in these age groups living above the poverty line.
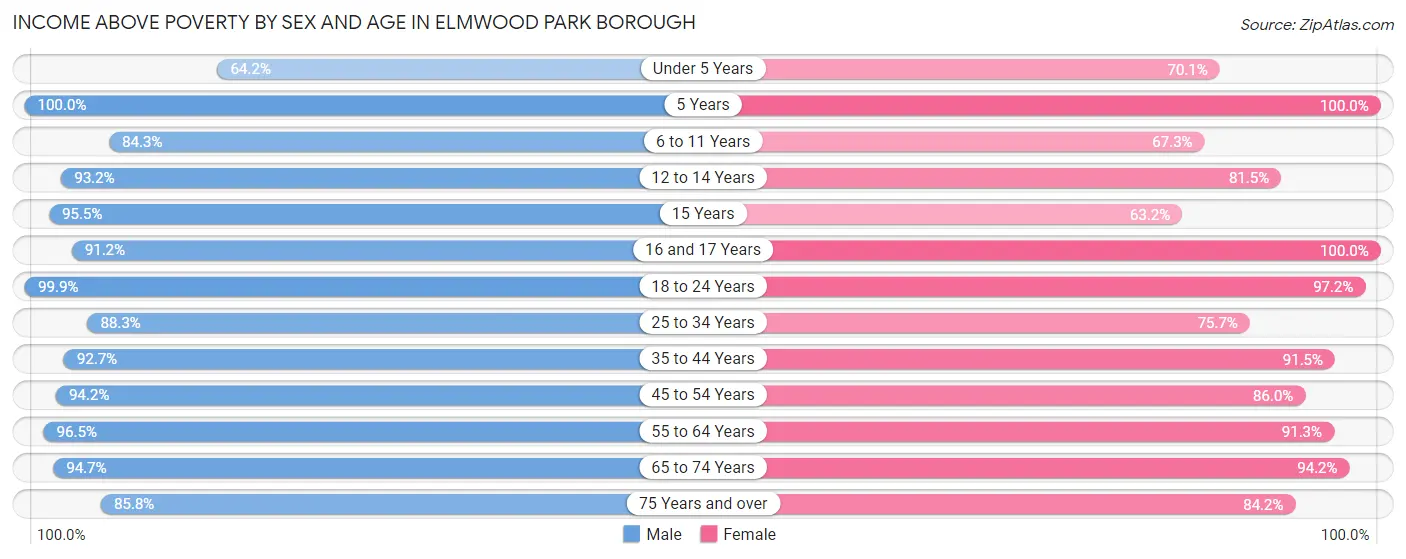
| Age Bracket | Male | Female |
| Under 5 Years | 346 (64.2%) | 594 (70.1%) |
| 5 Years | 60 (100.0%) | 60 (100.0%) |
| 6 to 11 Years | 575 (84.3%) | 461 (67.3%) |
| 12 to 14 Years | 355 (93.2%) | 287 (81.5%) |
| 15 Years | 316 (95.5%) | 72 (63.2%) |
| 16 and 17 Years | 187 (91.2%) | 261 (100.0%) |
| 18 to 24 Years | 892 (99.9%) | 1,024 (97.2%) |
| 25 to 34 Years | 1,393 (88.3%) | 1,225 (75.7%) |
| 35 to 44 Years | 1,080 (92.7%) | 1,196 (91.5%) |
| 45 to 54 Years | 1,259 (94.2%) | 1,204 (86.0%) |
| 55 to 64 Years | 1,172 (96.5%) | 1,401 (91.3%) |
| 65 to 74 Years | 851 (94.7%) | 1,088 (94.2%) |
| 75 Years and over | 666 (85.8%) | 654 (84.2%) |
| Total | 9,152 (91.0%) | 9,527 (85.3%) |
Income Below Poverty Among Married-Couple Families in Elmwood Park borough
The poverty statistics for married-couple families in Elmwood Park borough show that 7.2% or 271 of the total 3,750 families live below the poverty line. Families with 3 or 4 children have the highest poverty rate of 47.7%, comprising of 156 families. On the other hand, families with no children have the lowest poverty rate of 2.9%, which includes 64 families.
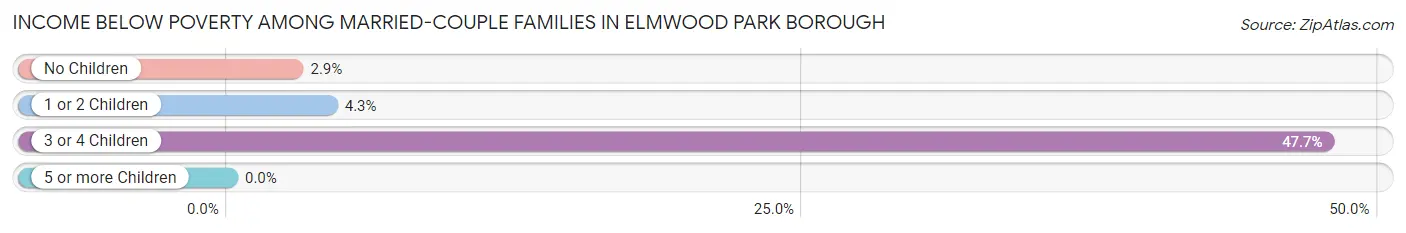
| Children | Above Poverty | Below Poverty |
| No Children | 2,184 (97.2%) | 64 (2.9%) |
| 1 or 2 Children | 1,124 (95.7%) | 51 (4.3%) |
| 3 or 4 Children | 171 (52.3%) | 156 (47.7%) |
| 5 or more Children | 0 (0.0%) | 0 (0.0%) |
| Total | 3,479 (92.8%) | 271 (7.2%) |
Income Below Poverty Among Single-Parent Households in Elmwood Park borough
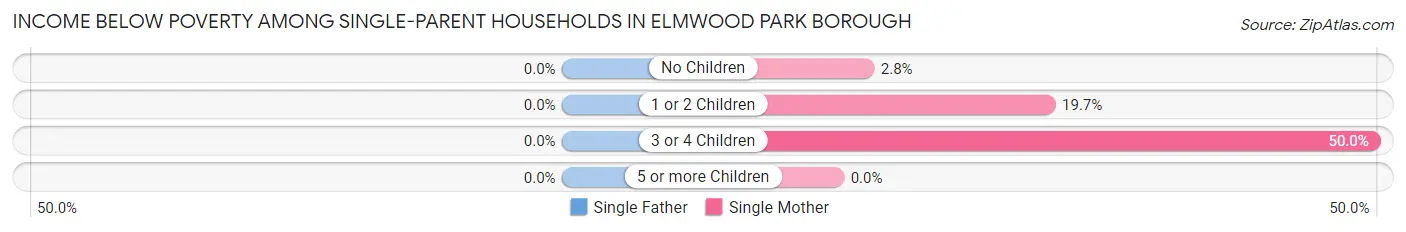
| Children | Single Father | Single Mother |
| No Children | 0 (0.0%) | 12 (2.8%) |
| 1 or 2 Children | 0 (0.0%) | 152 (19.7%) |
| 3 or 4 Children | 0 (0.0%) | 74 (50.0%) |
| 5 or more Children | 0 (0.0%) | 0 (0.0%) |
| Total | 0 (0.0%) | 238 (17.7%) |
Income Below Poverty Among Married-Couple vs Single-Parent Households in Elmwood Park borough
The poverty data for Elmwood Park borough shows that 271 of the married-couple family households (7.2%) and 238 of the single-parent households (14.5%) are living below the poverty level. Within the married-couple family households, those with 3 or 4 children have the highest poverty rate, with 156 households (47.7%) falling below the poverty line. Among the single-parent households, those with 3 or 4 children have the highest poverty rate, with 74 household (50.0%) living below poverty.
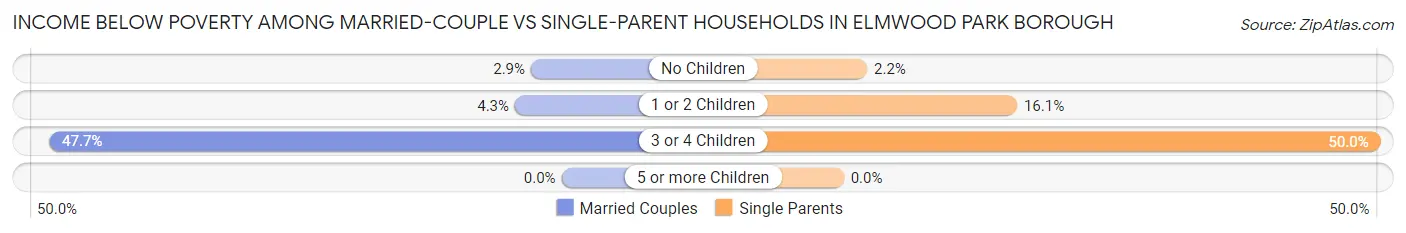
| Children | Married-Couple Families | Single-Parent Households |
| No Children | 64 (2.9%) | 12 (2.2%) |
| 1 or 2 Children | 51 (4.3%) | 152 (16.1%) |
| 3 or 4 Children | 156 (47.7%) | 74 (50.0%) |
| 5 or more Children | 0 (0.0%) | 0 (0.0%) |
| Total | 271 (7.2%) | 238 (14.5%) |
Race in Elmwood Park borough
The most populous races in Elmwood Park borough are White / Caucasian (13,585 | 63.9%), Hispanic or Latino (6,759 | 31.8%), and Some other Race (2,389 | 11.2%).
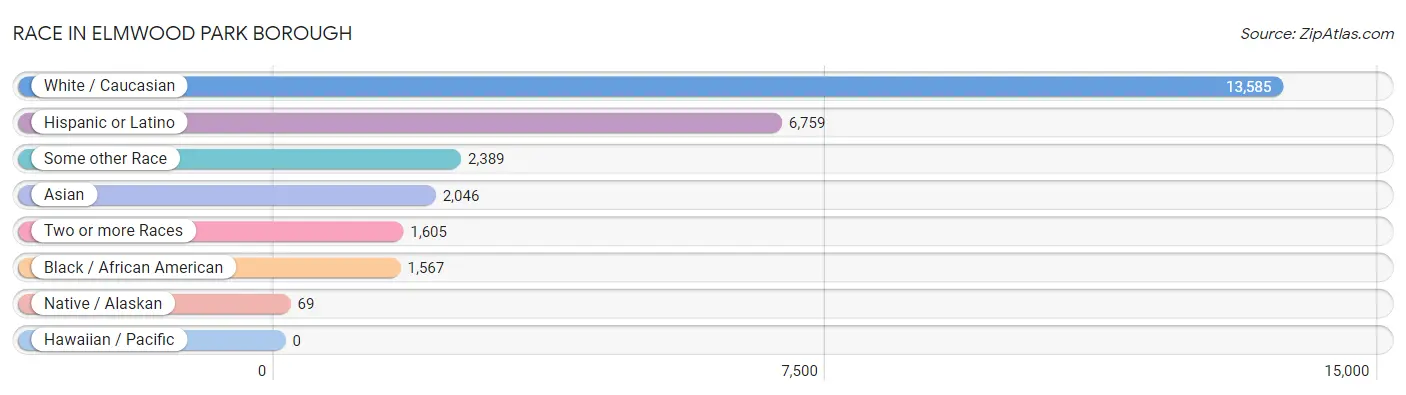
| Race | # Population | % Population |
| Asian | 2,046 | 9.6% |
| Black / African American | 1,567 | 7.4% |
| Hawaiian / Pacific | 0 | 0.0% |
| Hispanic or Latino | 6,759 | 31.8% |
| Native / Alaskan | 69 | 0.3% |
| White / Caucasian | 13,585 | 63.9% |
| Two or more Races | 1,605 | 7.5% |
| Some other Race | 2,389 | 11.2% |
| Total | 21,261 | 100.0% |
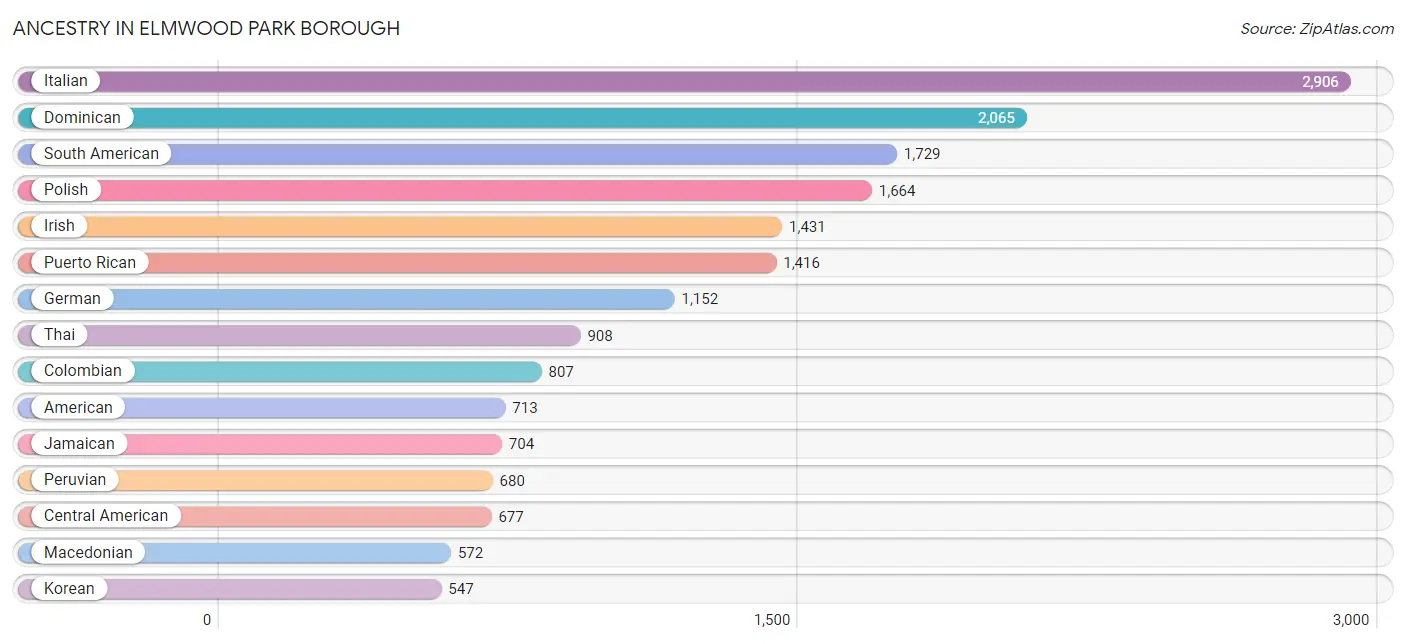
Ancestry in Elmwood Park borough
The most populous ancestries reported in Elmwood Park borough are Italian (2,906 | 13.7%), Dominican (2,065 | 9.7%), South American (1,729 | 8.1%), Polish (1,664 | 7.8%), and Irish (1,431 | 6.7%), together accounting for 46.1% of all Elmwood Park borough residents.
| Ancestry | # Population | % Population |
| African | 20 | 0.1% |
| Albanian | 527 | 2.5% |
| American | 713 | 3.4% |
| Arab | 373 | 1.8% |
| Armenian | 35 | 0.2% |
| Assyrian / Chaldean / Syriac | 51 | 0.2% |
| Belgian | 15 | 0.1% |
| Bhutanese | 12 | 0.1% |
| Bolivian | 16 | 0.1% |
| Brazilian | 37 | 0.2% |
| British | 18 | 0.1% |
| British West Indian | 37 | 0.2% |
| Bulgarian | 21 | 0.1% |
| Burmese | 153 | 0.7% |
| Canadian | 72 | 0.3% |
| Central American | 677 | 3.2% |
| Central American Indian | 16 | 0.1% |
| Chilean | 4 | 0.0% |
| Colombian | 807 | 3.8% |
| Costa Rican | 94 | 0.4% |
| Croatian | 80 | 0.4% |
| Cuban | 213 | 1.0% |
| Czech | 34 | 0.2% |
| Czechoslovakian | 29 | 0.1% |
| Danish | 8 | 0.0% |
| Dominican | 2,065 | 9.7% |
| Dutch | 114 | 0.5% |
| Eastern European | 22 | 0.1% |
| Ecuadorian | 194 | 0.9% |
| Egyptian | 81 | 0.4% |
| English | 228 | 1.1% |
| European | 11 | 0.1% |
| Filipino | 4 | 0.0% |
| French | 115 | 0.5% |
| French Canadian | 14 | 0.1% |
| German | 1,152 | 5.4% |
| Ghanaian | 20 | 0.1% |
| Greek | 117 | 0.5% |
| Guatemalan | 136 | 0.6% |
| Haitian | 56 | 0.3% |
| Honduran | 30 | 0.1% |
| Hungarian | 215 | 1.0% |
| Indian (Asian) | 162 | 0.8% |
| Irish | 1,431 | 6.7% |
| Italian | 2,906 | 13.7% |
| Jamaican | 704 | 3.3% |
| Korean | 547 | 2.6% |
| Macedonian | 572 | 2.7% |
| Mexican | 275 | 1.3% |
| Native Hawaiian | 15 | 0.1% |
| Nicaraguan | 107 | 0.5% |
| Norwegian | 6 | 0.0% |
| Panamanian | 99 | 0.5% |
| Peruvian | 680 | 3.2% |
| Polish | 1,664 | 7.8% |
| Portuguese | 65 | 0.3% |
| Puerto Rican | 1,416 | 6.7% |
| Russian | 307 | 1.4% |
| Salvadoran | 211 | 1.0% |
| Scotch-Irish | 6 | 0.0% |
| Scottish | 39 | 0.2% |
| Serbian | 29 | 0.1% |
| Slavic | 7 | 0.0% |
| Slovak | 141 | 0.7% |
| South American | 1,729 | 8.1% |
| South American Indian | 48 | 0.2% |
| Spaniard | 121 | 0.6% |
| Spanish | 4 | 0.0% |
| Sri Lankan | 31 | 0.2% |
| Subsaharan African | 20 | 0.1% |
| Swedish | 9 | 0.0% |
| Swiss | 9 | 0.0% |
| Syrian | 281 | 1.3% |
| Thai | 908 | 4.3% |
| Trinidadian and Tobagonian | 18 | 0.1% |
| Turkish | 19 | 0.1% |
| Ukrainian | 186 | 0.9% |
| Venezuelan | 28 | 0.1% |
| Vietnamese | 29 | 0.1% |
| Welsh | 40 | 0.2% |
| Yugoslavian | 31 | 0.2% | View All 81 Rows |
Immigrants in Elmwood Park borough
The most numerous immigrant groups reported in Elmwood Park borough came from Latin America (3,008 | 14.1%), Europe (2,616 | 12.3%), Eastern Europe (2,139 | 10.1%), Asia (1,983 | 9.3%), and Caribbean (1,600 | 7.5%), together accounting for 53.4% of all Elmwood Park borough residents.

| Immigration Origin | # Population | % Population |
| Africa | 101 | 0.5% |
| Albania | 218 | 1.0% |
| Armenia | 35 | 0.2% |
| Asia | 1,983 | 9.3% |
| Austria | 10 | 0.1% |
| Bangladesh | 18 | 0.1% |
| Belarus | 35 | 0.2% |
| Bolivia | 7 | 0.0% |
| Brazil | 56 | 0.3% |
| Bulgaria | 10 | 0.1% |
| Canada | 42 | 0.2% |
| Caribbean | 1,600 | 7.5% |
| Central America | 289 | 1.4% |
| Chile | 4 | 0.0% |
| China | 89 | 0.4% |
| Colombia | 423 | 2.0% |
| Costa Rica | 74 | 0.4% |
| Croatia | 52 | 0.2% |
| Cuba | 124 | 0.6% |
| Czechoslovakia | 56 | 0.3% |
| Dominican Republic | 1,100 | 5.2% |
| Eastern Asia | 269 | 1.3% |
| Eastern Europe | 2,139 | 10.1% |
| Ecuador | 213 | 1.0% |
| Egypt | 69 | 0.3% |
| El Salvador | 75 | 0.4% |
| England | 21 | 0.1% |
| Europe | 2,616 | 12.3% |
| France | 10 | 0.1% |
| Germany | 11 | 0.1% |
| Ghana | 32 | 0.2% |
| Greece | 59 | 0.3% |
| Honduras | 30 | 0.1% |
| Hong Kong | 19 | 0.1% |
| Hungary | 50 | 0.2% |
| India | 767 | 3.6% |
| Italy | 340 | 1.6% |
| Jamaica | 358 | 1.7% |
| Jordan | 4 | 0.0% |
| Korea | 180 | 0.9% |
| Latin America | 3,008 | 14.1% |
| Latvia | 23 | 0.1% |
| Lebanon | 21 | 0.1% |
| Mexico | 65 | 0.3% |
| North Macedonia | 393 | 1.8% |
| Northern Africa | 69 | 0.3% |
| Northern Europe | 38 | 0.2% |
| Pakistan | 124 | 0.6% |
| Panama | 45 | 0.2% |
| Peru | 381 | 1.8% |
| Philippines | 376 | 1.8% |
| Poland | 907 | 4.3% |
| Russia | 12 | 0.1% |
| Saudi Arabia | 42 | 0.2% |
| South America | 1,119 | 5.3% |
| South Central Asia | 953 | 4.5% |
| South Eastern Asia | 395 | 1.9% |
| Southern Europe | 408 | 1.9% |
| Spain | 9 | 0.0% |
| Syria | 173 | 0.8% |
| Trinidad and Tobago | 18 | 0.1% |
| Turkey | 62 | 0.3% |
| Ukraine | 213 | 1.0% |
| Uzbekistan | 12 | 0.1% |
| Venezuela | 35 | 0.2% |
| Vietnam | 19 | 0.1% |
| Western Africa | 32 | 0.2% |
| Western Asia | 366 | 1.7% |
| Western Europe | 31 | 0.2% | View All 69 Rows |
Sex and Age in Elmwood Park borough
Sex and Age in Elmwood Park borough
The most populous age groups in Elmwood Park borough are 25 to 29 Years (822 | 8.2%) for men and 55 to 59 Years (863 | 7.7%) for women.
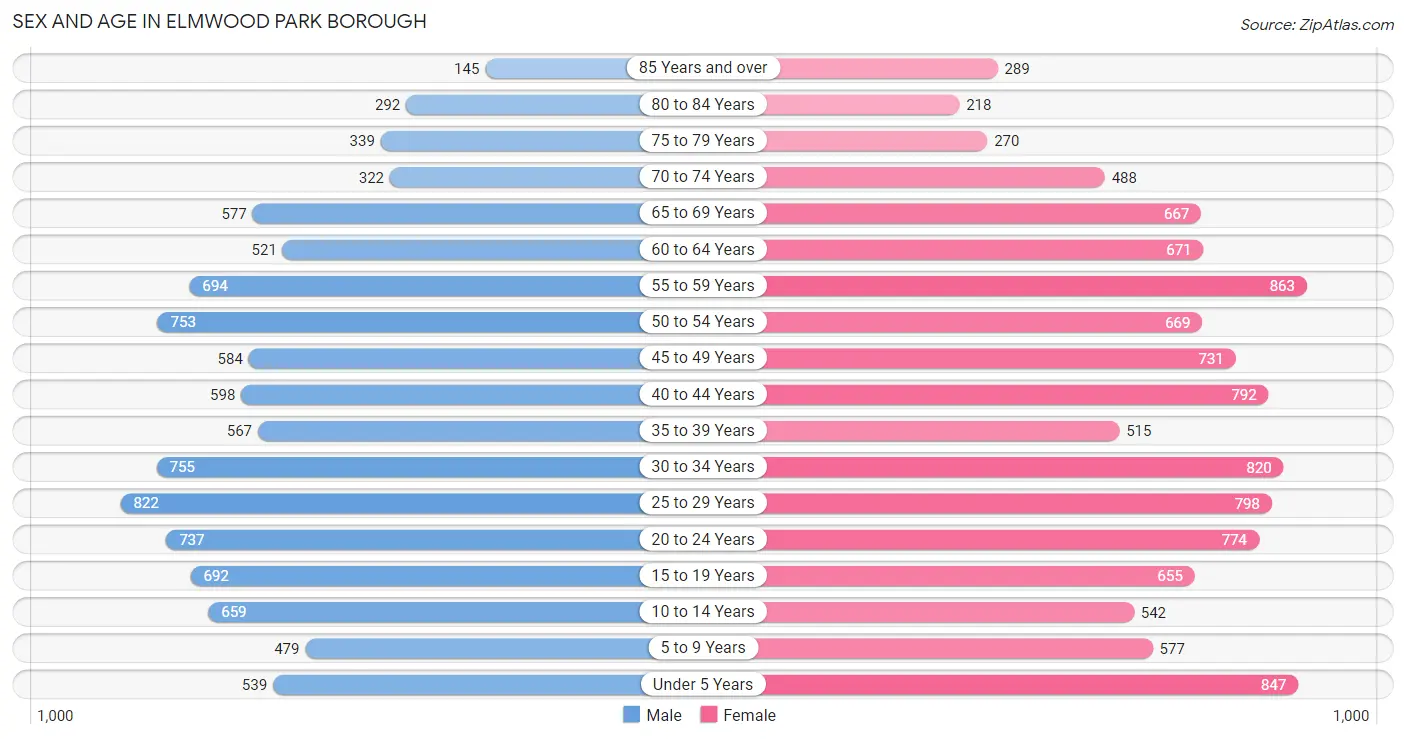
| Age Bracket | Male | Female |
| Under 5 Years | 539 (5.3%) | 847 (7.6%) |
| 5 to 9 Years | 479 (4.8%) | 577 (5.2%) |
| 10 to 14 Years | 659 (6.5%) | 542 (4.9%) |
| 15 to 19 Years | 692 (6.9%) | 655 (5.9%) |
| 20 to 24 Years | 737 (7.3%) | 774 (6.9%) |
| 25 to 29 Years | 822 (8.2%) | 798 (7.1%) |
| 30 to 34 Years | 755 (7.5%) | 820 (7.3%) |
| 35 to 39 Years | 567 (5.6%) | 515 (4.6%) |
| 40 to 44 Years | 598 (5.9%) | 792 (7.1%) |
| 45 to 49 Years | 584 (5.8%) | 731 (6.5%) |
| 50 to 54 Years | 753 (7.5%) | 669 (6.0%) |
| 55 to 59 Years | 694 (6.9%) | 863 (7.7%) |
| 60 to 64 Years | 521 (5.2%) | 671 (6.0%) |
| 65 to 69 Years | 577 (5.7%) | 667 (6.0%) |
| 70 to 74 Years | 322 (3.2%) | 488 (4.4%) |
| 75 to 79 Years | 339 (3.4%) | 270 (2.4%) |
| 80 to 84 Years | 292 (2.9%) | 218 (1.9%) |
| 85 Years and over | 145 (1.4%) | 289 (2.6%) |
| Total | 10,075 (100.0%) | 11,186 (100.0%) |
Families and Households in Elmwood Park borough
Median Family Size in Elmwood Park borough
The median family size in Elmwood Park borough is 3.39 persons per family, with single female/mother families (1,347 | 25.0%) accounting for the largest median family size of 3.5 persons per family. On the other hand, single male/father families (293 | 5.4%) represent the smallest median family size with 3.13 persons per family.
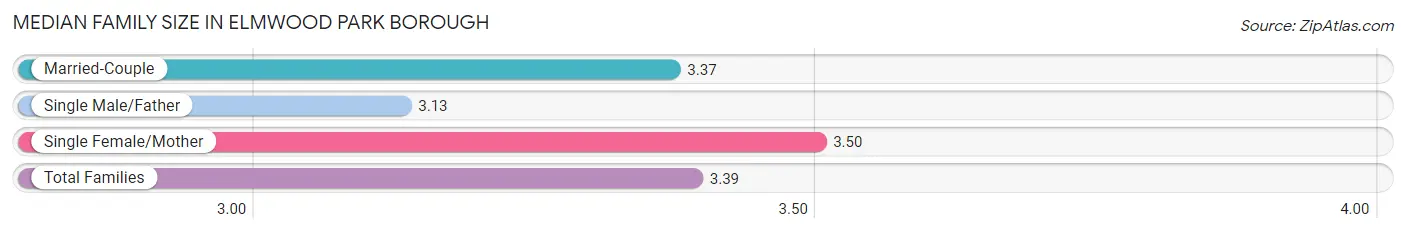
| Family Type | # Families | Family Size |
| Married-Couple | 3,750 (69.6%) | 3.37 |
| Single Male/Father | 293 (5.4%) | 3.13 |
| Single Female/Mother | 1,347 (25.0%) | 3.50 |
| Total Families | 5,390 (100.0%) | 3.39 |
Median Household Size in Elmwood Park borough
The median household size in Elmwood Park borough is 2.94 persons per household, with single female/mother households (1,347 | 18.7%) accounting for the largest median household size of 3.79 persons per household. non-family households (1,830 | 25.4%) represent the smallest median household size with 1.29 persons per household.
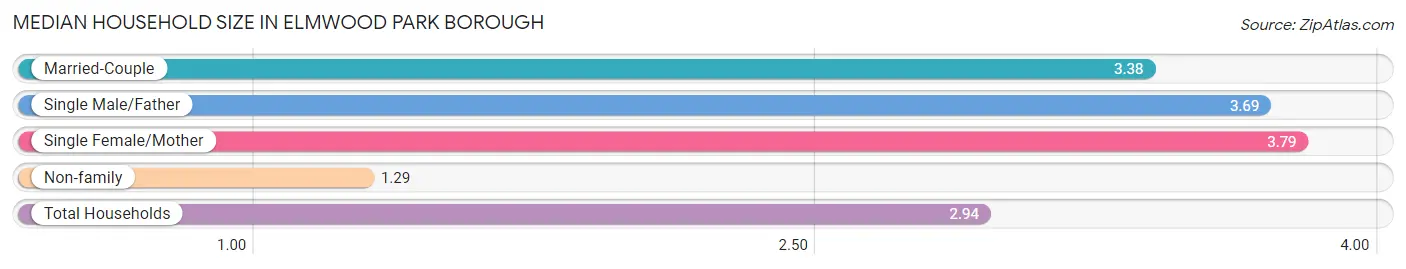
| Household Type | # Households | Household Size |
| Married-Couple | 3,750 (51.9%) | 3.38 |
| Single Male/Father | 293 (4.1%) | 3.69 |
| Single Female/Mother | 1,347 (18.7%) | 3.79 |
| Non-family | 1,830 (25.4%) | 1.29 |
| Total Households | 7,220 (100.0%) | 2.94 |
Household Size by Marriage Status in Elmwood Park borough
Out of a total of 7,220 households in Elmwood Park borough, 5,390 (74.7%) are family households, while 1,830 (25.4%) are nonfamily households. The most numerous type of family households are 2-person households, comprising 1,797, and the most common type of nonfamily households are 1-person households, comprising 1,390.
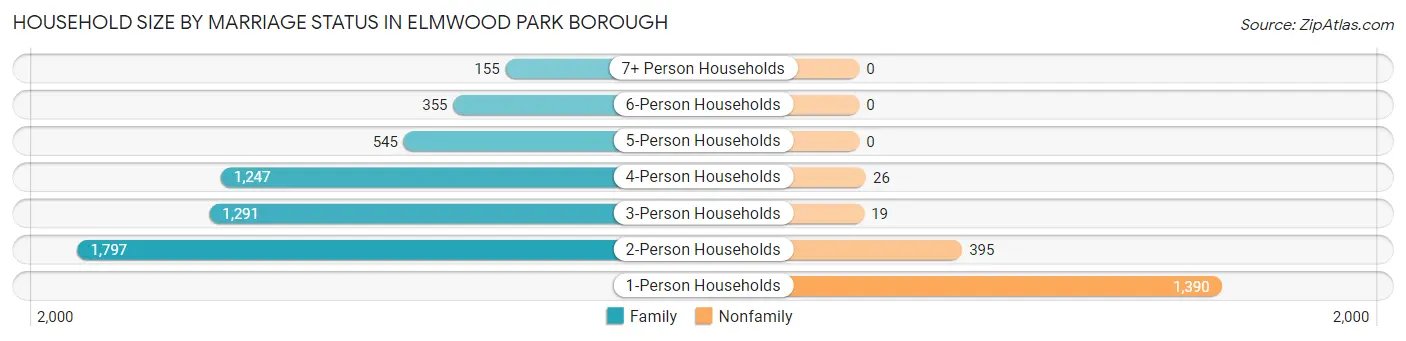
| Household Size | Family Households | Nonfamily Households |
| 1-Person Households | - | 1,390 (19.3%) |
| 2-Person Households | 1,797 (24.9%) | 395 (5.5%) |
| 3-Person Households | 1,291 (17.9%) | 19 (0.3%) |
| 4-Person Households | 1,247 (17.3%) | 26 (0.4%) |
| 5-Person Households | 545 (7.5%) | 0 (0.0%) |
| 6-Person Households | 355 (4.9%) | 0 (0.0%) |
| 7+ Person Households | 155 (2.1%) | 0 (0.0%) |
| Total | 5,390 (74.7%) | 1,830 (25.4%) |
Female Fertility in Elmwood Park borough
Fertility by Age in Elmwood Park borough
Average fertility rate in Elmwood Park borough is 82.0 births per 1,000 women. Women in the age bracket of 20 to 34 years have the highest fertility rate with 142.0 births per 1,000 women. Women in the age bracket of 20 to 34 years acount for 79.4% of all women with births.
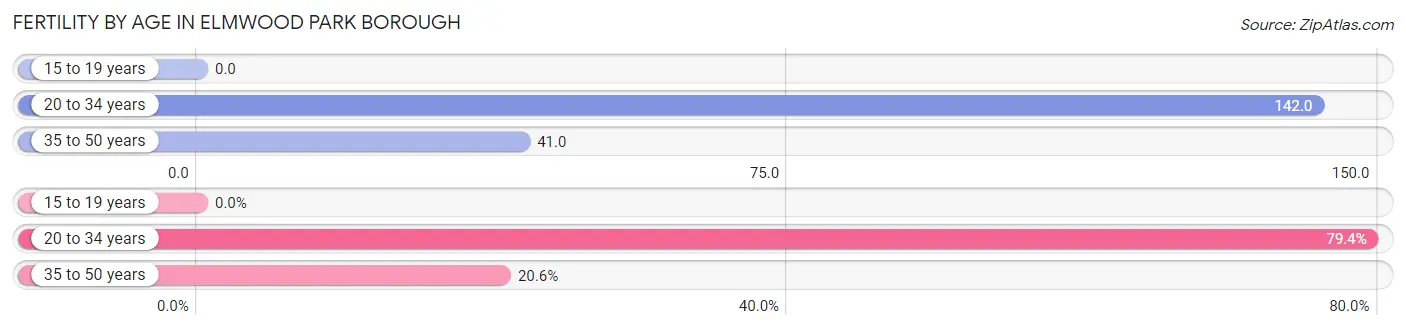
| Age Bracket | Women with Births | Births / 1,000 Women |
| 15 to 19 years | 0 (0.0%) | 0.0 |
| 20 to 34 years | 340 (79.4%) | 142.0 |
| 35 to 50 years | 88 (20.6%) | 41.0 |
| Total | 428 (100.0%) | 82.0 |
Fertility by Age by Marriage Status in Elmwood Park borough
71.3% of women with births (428) in Elmwood Park borough are married. The highest percentage of unmarried women with births falls into 20 to 34 years age bracket with 33.8% of them unmarried at the time of birth, while the lowest percentage of unmarried women with births belong to 35 to 50 years age bracket with 9.1% of them unmarried.
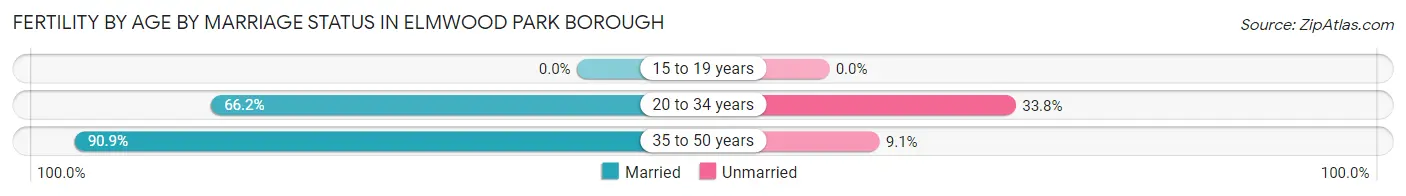
| Age Bracket | Married | Unmarried |
| 15 to 19 years | 0 (0.0%) | 0 (0.0%) |
| 20 to 34 years | 225 (66.2%) | 115 (33.8%) |
| 35 to 50 years | 80 (90.9%) | 8 (9.1%) |
| Total | 305 (71.3%) | 123 (28.7%) |
Fertility by Education in Elmwood Park borough
Average fertility rate in Elmwood Park borough is 82.0 births per 1,000 women. Women with the education attainment of graduate degree have the highest fertility rate of 310.0 births per 1,000 women, while women with the education attainment of less than high school have the lowest fertility at 48.0 births per 1,000 women. Women with the education attainment of graduate degree represent 38.6% of all women with births.
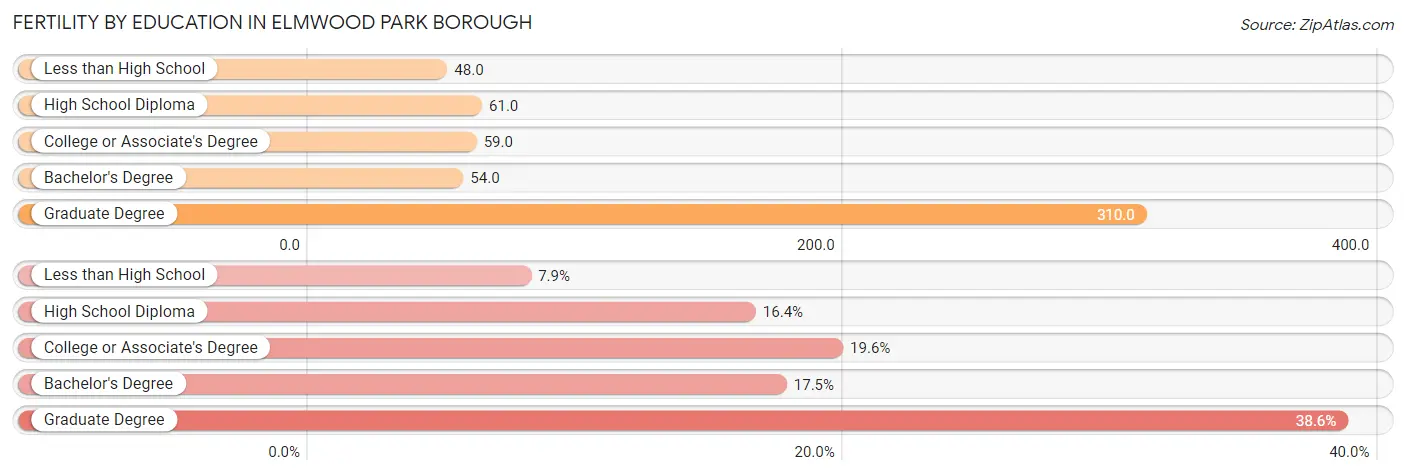
| Educational Attainment | Women with Births | Births / 1,000 Women |
| Less than High School | 34 (7.9%) | 48.0 |
| High School Diploma | 70 (16.4%) | 61.0 |
| College or Associate's Degree | 84 (19.6%) | 59.0 |
| Bachelor's Degree | 75 (17.5%) | 54.0 |
| Graduate Degree | 165 (38.6%) | 310.0 |
| Total | 428 (100.0%) | 82.0 |
Fertility by Education by Marriage Status in Elmwood Park borough
28.7% of women with births in Elmwood Park borough are unmarried. Women with the educational attainment of bachelor's degree are most likely to be married with 100.0% of them married at childbirth, while women with the educational attainment of less than high school are least likely to be married with 100.0% of them unmarried at childbirth.
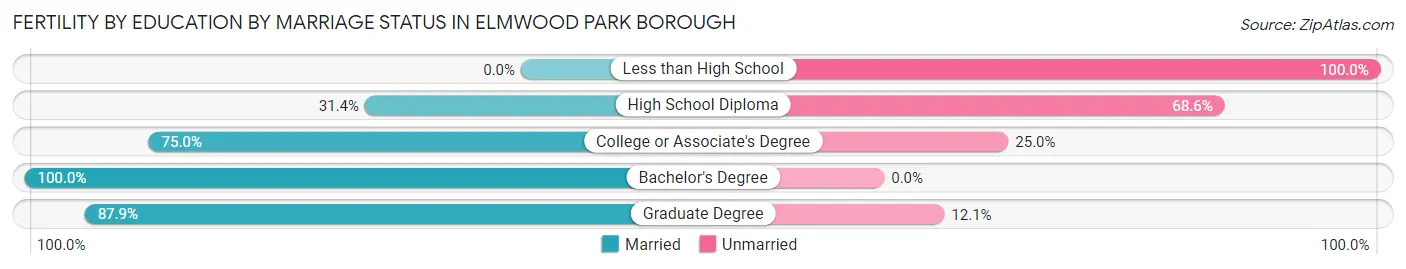
| Educational Attainment | Married | Unmarried |
| Less than High School | 0 (0.0%) | 34 (100.0%) |
| High School Diploma | 22 (31.4%) | 48 (68.6%) |
| College or Associate's Degree | 63 (75.0%) | 21 (25.0%) |
| Bachelor's Degree | 75 (100.0%) | 0 (0.0%) |
| Graduate Degree | 145 (87.9%) | 20 (12.1%) |
| Total | 305 (71.3%) | 123 (28.7%) |
Employment Characteristics in Elmwood Park borough
Employment by Class of Employer in Elmwood Park borough
Among the 10,632 employed individuals in Elmwood Park borough, private company employees (8,026 | 75.5%), local government employees (682 | 6.4%), and not-for-profit organizations (675 | 6.4%) make up the most common classes of employment.
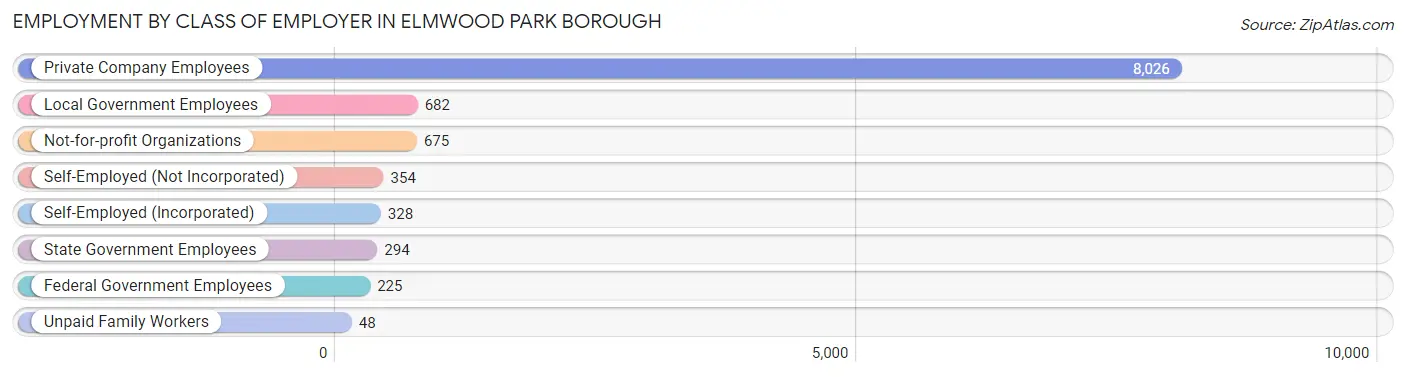
| Employer Class | # Employees | % Employees |
| Private Company Employees | 8,026 | 75.5% |
| Self-Employed (Incorporated) | 328 | 3.1% |
| Self-Employed (Not Incorporated) | 354 | 3.3% |
| Not-for-profit Organizations | 675 | 6.4% |
| Local Government Employees | 682 | 6.4% |
| State Government Employees | 294 | 2.8% |
| Federal Government Employees | 225 | 2.1% |
| Unpaid Family Workers | 48 | 0.4% |
| Total | 10,632 | 100.0% |
Employment Status by Age in Elmwood Park borough
According to the labor force statistics for Elmwood Park borough, out of the total population over 16 years of age (17,173), 67.4% or 11,575 individuals are in the labor force, with 6.6% or 764 of them unemployed. The age group with the highest labor force participation rate is 25 to 29 years, with 88.4% or 1,432 individuals in the labor force. Within the labor force, the 30 to 34 years age range has the highest percentage of unemployed individuals, with 20.8% or 274 of them being unemployed.
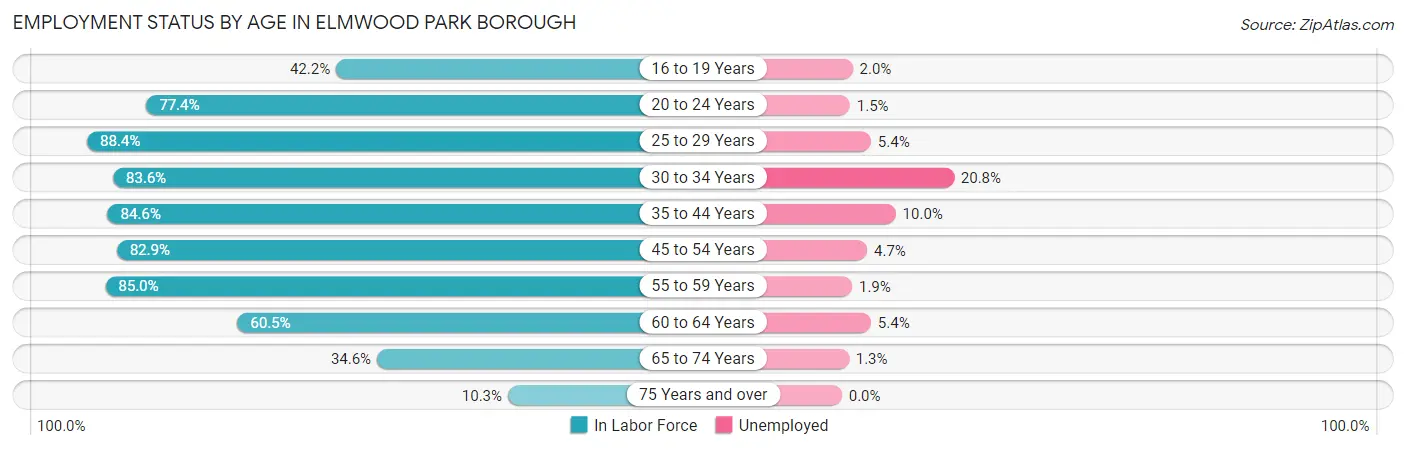
| Age Bracket | In Labor Force | Unemployed |
| 16 to 19 Years | 381 (42.2%) | 8 (2.0%) |
| 20 to 24 Years | 1,170 (77.4%) | 18 (1.5%) |
| 25 to 29 Years | 1,432 (88.4%) | 77 (5.4%) |
| 30 to 34 Years | 1,317 (83.6%) | 274 (20.8%) |
| 35 to 44 Years | 2,091 (84.6%) | 209 (10.0%) |
| 45 to 54 Years | 2,269 (82.9%) | 107 (4.7%) |
| 55 to 59 Years | 1,323 (85.0%) | 25 (1.9%) |
| 60 to 64 Years | 721 (60.5%) | 39 (5.4%) |
| 65 to 74 Years | 711 (34.6%) | 9 (1.3%) |
| 75 Years and over | 160 (10.3%) | 0 (0.0%) |
| Total | 11,575 (67.4%) | 764 (6.6%) |
Employment Status by Educational Attainment in Elmwood Park borough
According to labor force statistics for Elmwood Park borough, 82.1% of individuals (9,157) out of the total population between 25 and 64 years of age (11,153) are in the labor force, with 8.0% or 733 of them being unemployed. The group with the highest labor force participation rate are those with the educational attainment of bachelor's degree or higher, with 86.7% or 3,305 individuals in the labor force. Within the labor force, individuals with bachelor's degree or higher education have the highest percentage of unemployment, with 8.3% or 274 of them being unemployed.
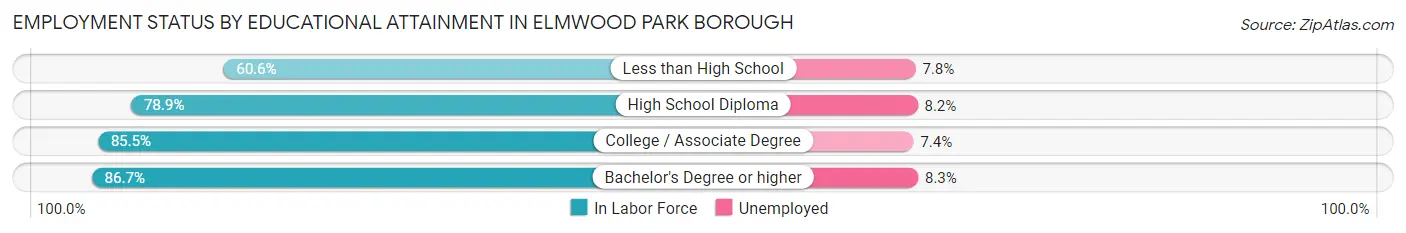
| Educational Attainment | In Labor Force | Unemployed |
| Less than High School | 486 (60.6%) | 63 (7.8%) |
| High School Diploma | 2,713 (78.9%) | 282 (8.2%) |
| College / Associate Degree | 2,650 (85.5%) | 229 (7.4%) |
| Bachelor's Degree or higher | 3,305 (86.7%) | 316 (8.3%) |
| Total | 9,157 (82.1%) | 892 (8.0%) |
Employment Occupations by Sex in Elmwood Park borough
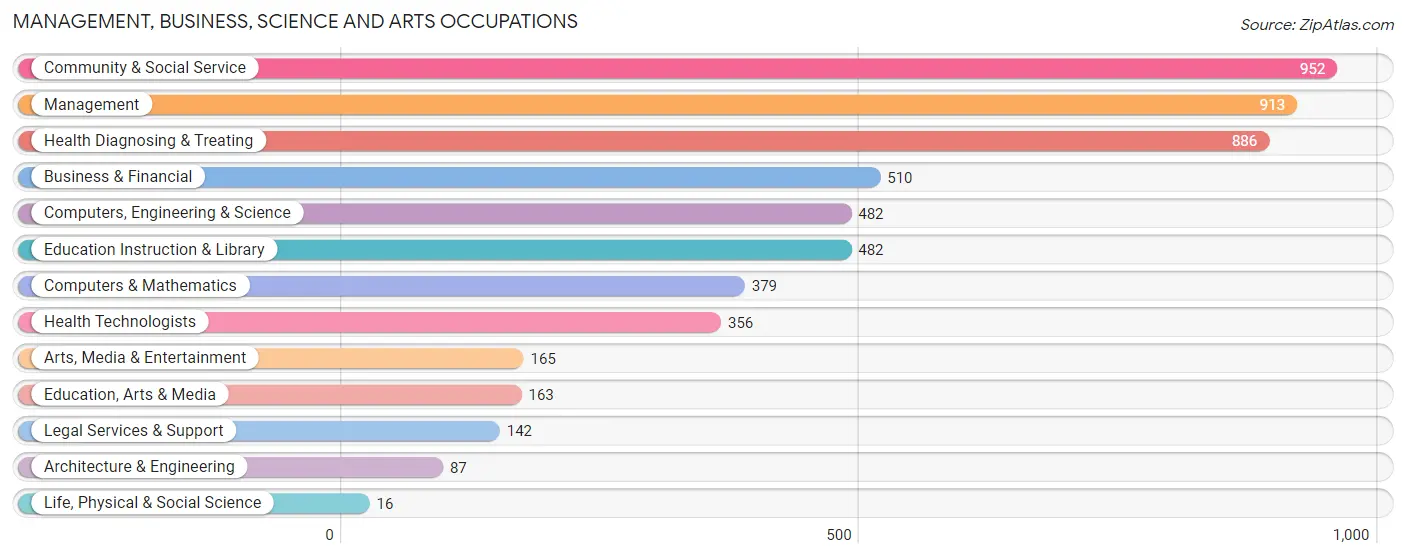
Management, Business, Science and Arts Occupations
The most common Management, Business, Science and Arts occupations in Elmwood Park borough are Community & Social Service (952 | 8.8%), Management (913 | 8.5%), Health Diagnosing & Treating (886 | 8.2%), Business & Financial (510 | 4.7%), and Computers, Engineering & Science (482 | 4.5%).
Management, Business, Science and Arts Occupations by Sex
Within the Management, Business, Science and Arts occupations in Elmwood Park borough, the most male-oriented occupations are Life, Physical & Social Science (100.0%), Arts, Media & Entertainment (92.7%), and Computers & Mathematics (90.0%), while the most female-oriented occupations are Health Technologists (90.4%), Education, Arts & Media (85.3%), and Education Instruction & Library (82.0%).
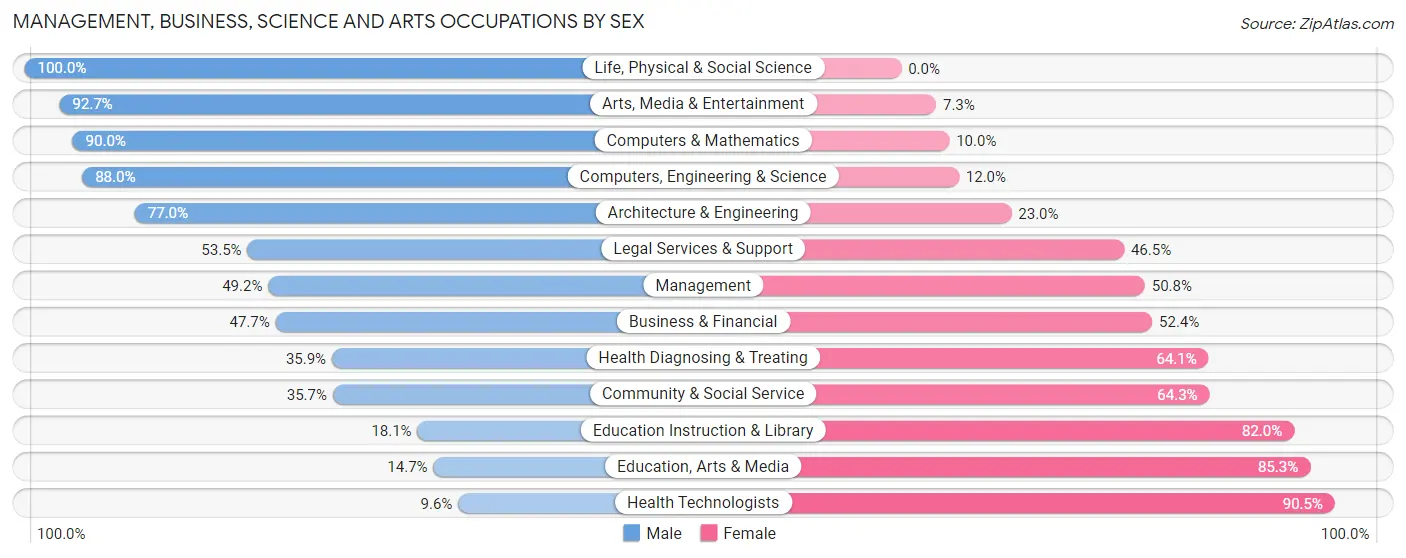
| Occupation | Male | Female |
| Management | 449 (49.2%) | 464 (50.8%) |
| Business & Financial | 243 (47.6%) | 267 (52.3%) |
| Computers, Engineering & Science | 424 (88.0%) | 58 (12.0%) |
| Computers & Mathematics | 341 (90.0%) | 38 (10.0%) |
| Architecture & Engineering | 67 (77.0%) | 20 (23.0%) |
| Life, Physical & Social Science | 16 (100.0%) | 0 (0.0%) |
| Community & Social Service | 340 (35.7%) | 612 (64.3%) |
| Education, Arts & Media | 24 (14.7%) | 139 (85.3%) |
| Legal Services & Support | 76 (53.5%) | 66 (46.5%) |
| Education Instruction & Library | 87 (18.0%) | 395 (82.0%) |
| Arts, Media & Entertainment | 153 (92.7%) | 12 (7.3%) |
| Health Diagnosing & Treating | 318 (35.9%) | 568 (64.1%) |
| Health Technologists | 34 (9.6%) | 322 (90.4%) |
| Total (Category) | 1,774 (47.4%) | 1,969 (52.6%) |
| Total (Overall) | 5,494 (51.1%) | 5,265 (48.9%) |
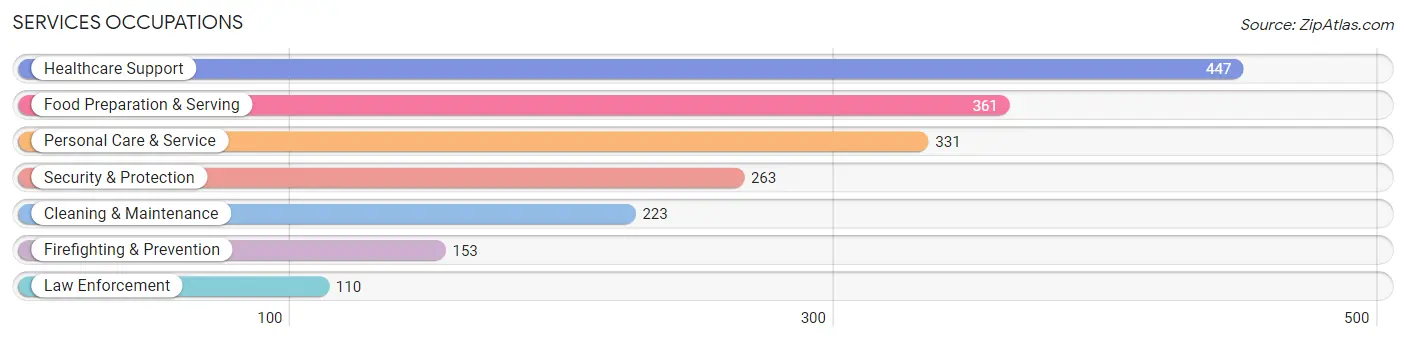
Services Occupations
The most common Services occupations in Elmwood Park borough are Healthcare Support (447 | 4.2%), Food Preparation & Serving (361 | 3.4%), Personal Care & Service (331 | 3.1%), Security & Protection (263 | 2.4%), and Cleaning & Maintenance (223 | 2.1%).
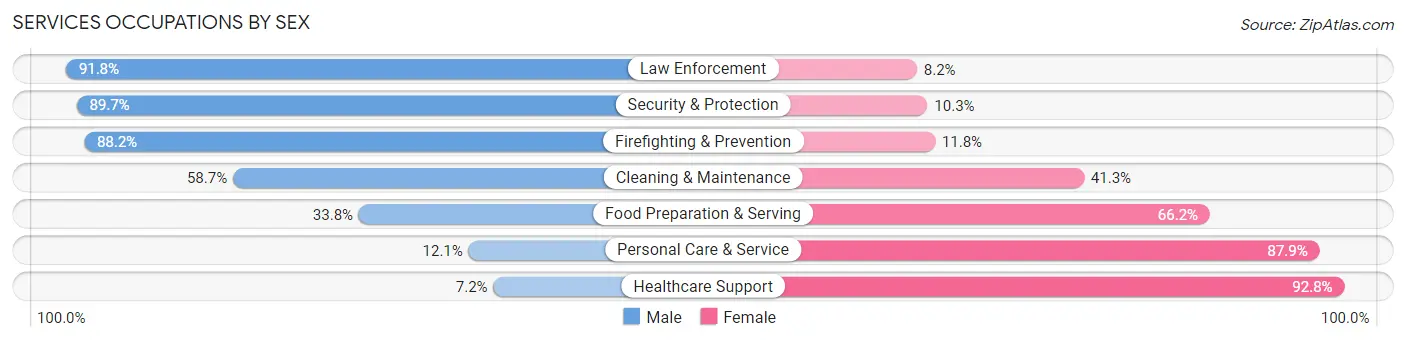
Services Occupations by Sex
Within the Services occupations in Elmwood Park borough, the most male-oriented occupations are Law Enforcement (91.8%), Security & Protection (89.7%), and Firefighting & Prevention (88.2%), while the most female-oriented occupations are Healthcare Support (92.8%), Personal Care & Service (87.9%), and Food Preparation & Serving (66.2%).
| Occupation | Male | Female |
| Healthcare Support | 32 (7.2%) | 415 (92.8%) |
| Security & Protection | 236 (89.7%) | 27 (10.3%) |
| Firefighting & Prevention | 135 (88.2%) | 18 (11.8%) |
| Law Enforcement | 101 (91.8%) | 9 (8.2%) |
| Food Preparation & Serving | 122 (33.8%) | 239 (66.2%) |
| Cleaning & Maintenance | 131 (58.7%) | 92 (41.3%) |
| Personal Care & Service | 40 (12.1%) | 291 (87.9%) |
| Total (Category) | 561 (34.5%) | 1,064 (65.5%) |
| Total (Overall) | 5,494 (51.1%) | 5,265 (48.9%) |
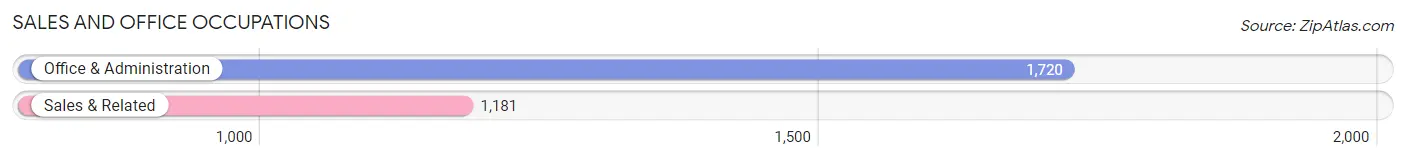
Sales and Office Occupations
The most common Sales and Office occupations in Elmwood Park borough are Office & Administration (1,720 | 16.0%), and Sales & Related (1,181 | 11.0%).
Sales and Office Occupations by Sex
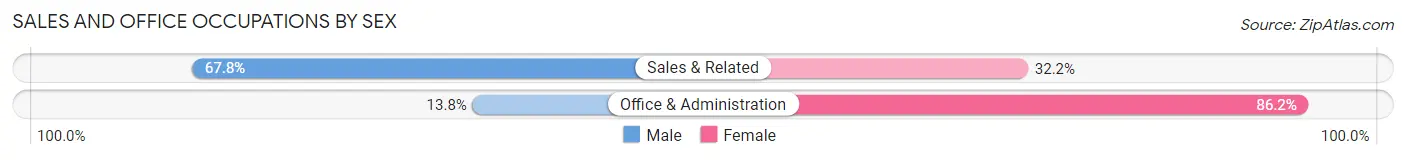
| Occupation | Male | Female |
| Sales & Related | 801 (67.8%) | 380 (32.2%) |
| Office & Administration | 238 (13.8%) | 1,482 (86.2%) |
| Total (Category) | 1,039 (35.8%) | 1,862 (64.2%) |
| Total (Overall) | 5,494 (51.1%) | 5,265 (48.9%) |
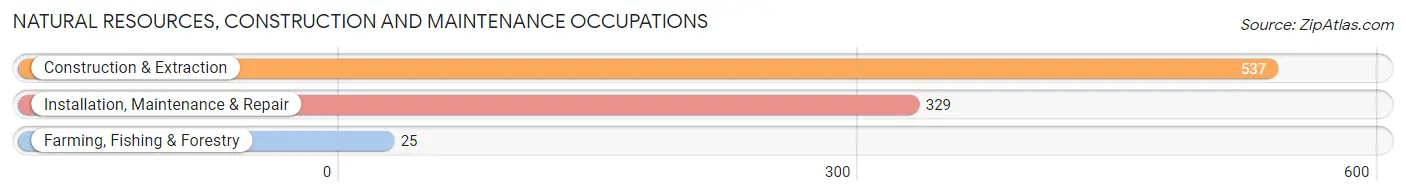
Natural Resources, Construction and Maintenance Occupations
The most common Natural Resources, Construction and Maintenance occupations in Elmwood Park borough are Construction & Extraction (537 | 5.0%), Installation, Maintenance & Repair (329 | 3.1%), and Farming, Fishing & Forestry (25 | 0.2%).
Natural Resources, Construction and Maintenance Occupations by Sex
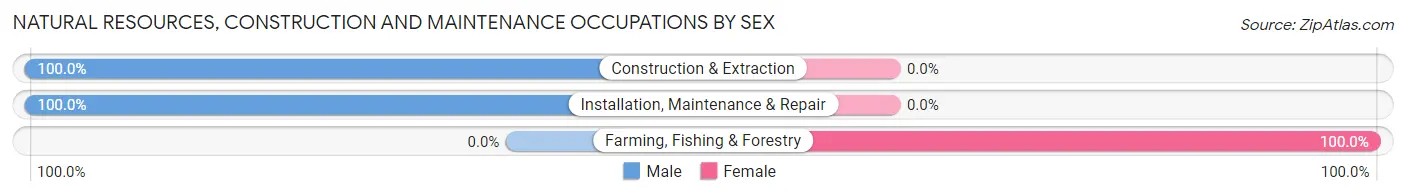
| Occupation | Male | Female |
| Farming, Fishing & Forestry | 0 (0.0%) | 25 (100.0%) |
| Construction & Extraction | 537 (100.0%) | 0 (0.0%) |
| Installation, Maintenance & Repair | 329 (100.0%) | 0 (0.0%) |
| Total (Category) | 866 (97.2%) | 25 (2.8%) |
| Total (Overall) | 5,494 (51.1%) | 5,265 (48.9%) |
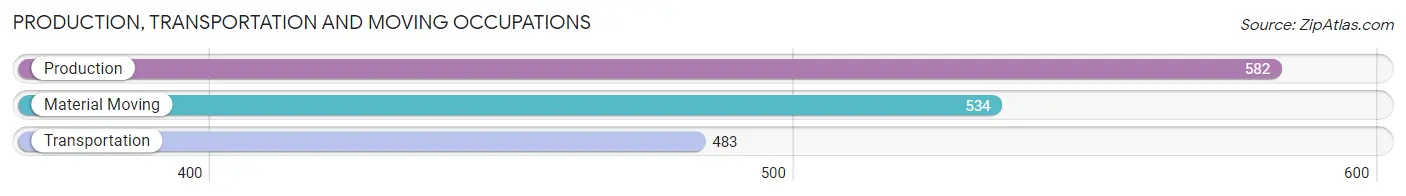
Production, Transportation and Moving Occupations
The most common Production, Transportation and Moving occupations in Elmwood Park borough are Production (582 | 5.4%), Material Moving (534 | 5.0%), and Transportation (483 | 4.5%).
Production, Transportation and Moving Occupations by Sex
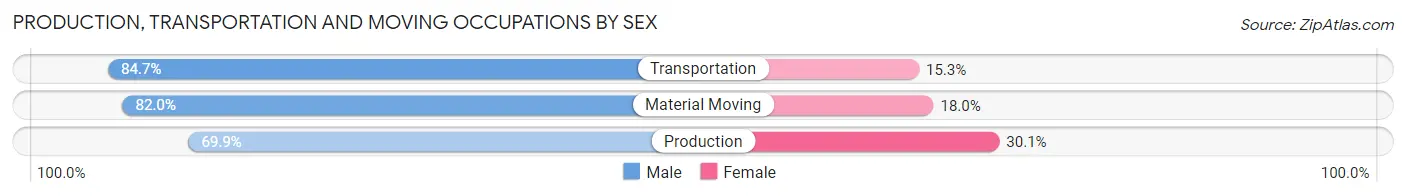
| Occupation | Male | Female |
| Production | 407 (69.9%) | 175 (30.1%) |
| Transportation | 409 (84.7%) | 74 (15.3%) |
| Material Moving | 438 (82.0%) | 96 (18.0%) |
| Total (Category) | 1,254 (78.4%) | 345 (21.6%) |
| Total (Overall) | 5,494 (51.1%) | 5,265 (48.9%) |
Employment Industries by Sex in Elmwood Park borough
Employment Industries in Elmwood Park borough
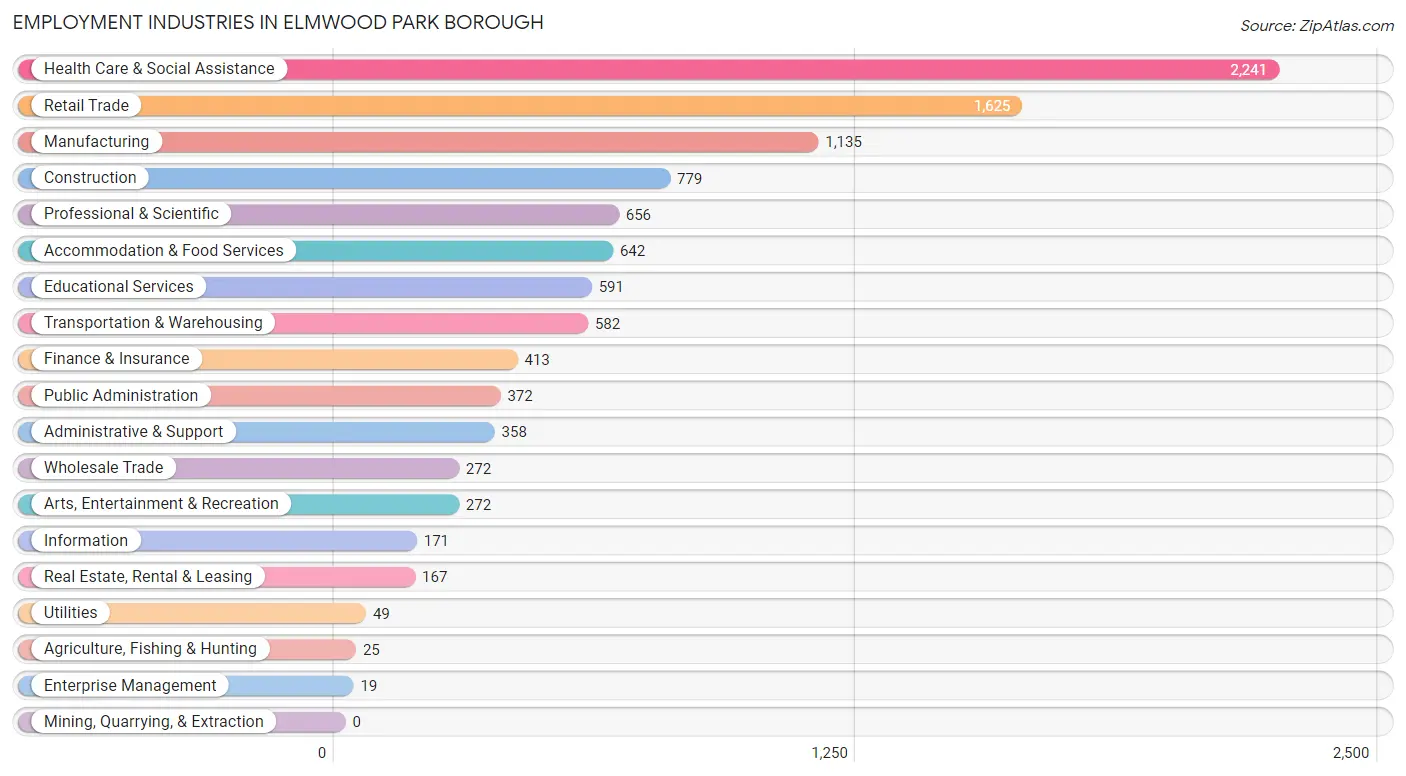
The major employment industries in Elmwood Park borough include Health Care & Social Assistance (2,241 | 20.8%), Retail Trade (1,625 | 15.1%), Manufacturing (1,135 | 10.5%), Construction (779 | 7.2%), and Professional & Scientific (656 | 6.1%).
Employment Industries by Sex in Elmwood Park borough
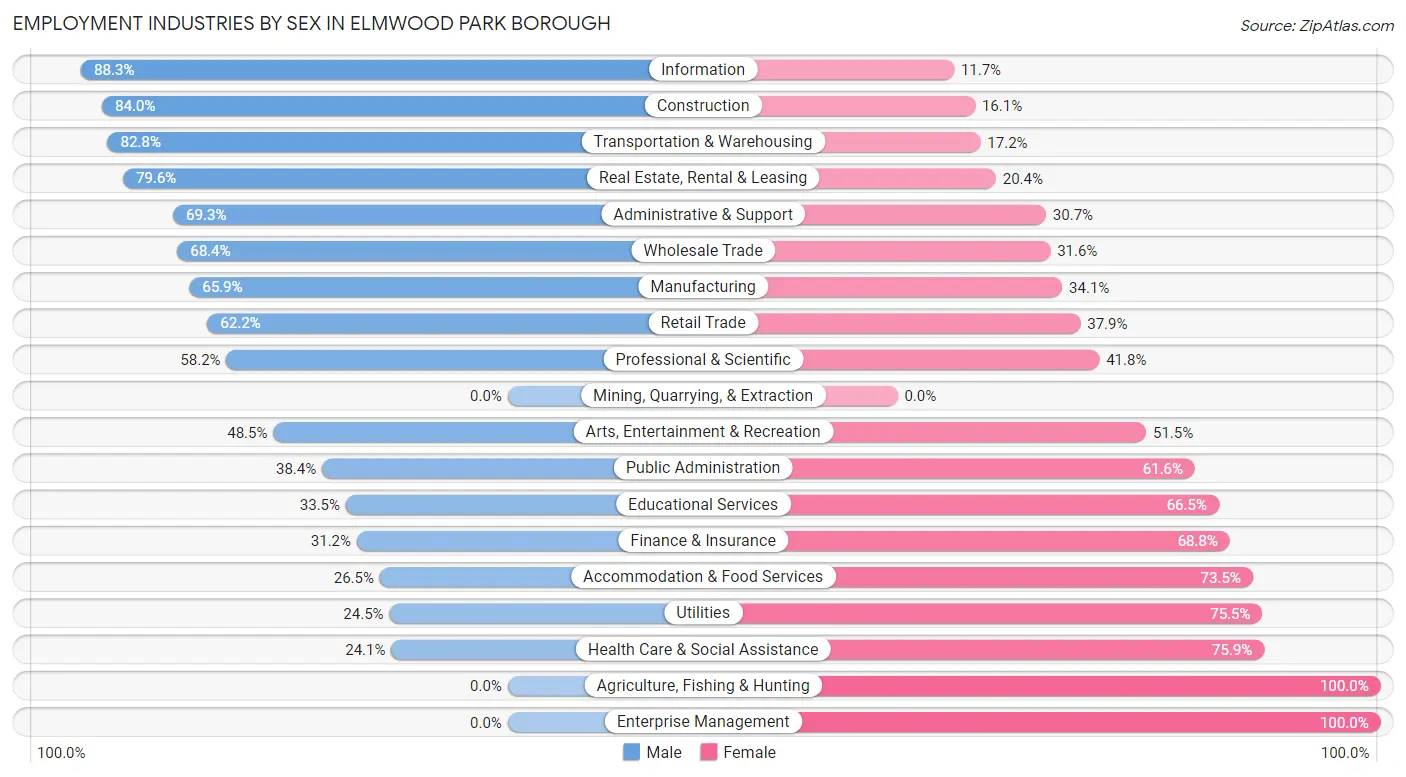
The Elmwood Park borough industries that see more men than women are Information (88.3%), Construction (84.0%), and Transportation & Warehousing (82.8%), whereas the industries that tend to have a higher number of women are Agriculture, Fishing & Hunting (100.0%), Enterprise Management (100.0%), and Health Care & Social Assistance (75.9%).
| Industry | Male | Female |
| Agriculture, Fishing & Hunting | 0 (0.0%) | 25 (100.0%) |
| Mining, Quarrying, & Extraction | 0 (0.0%) | 0 (0.0%) |
| Construction | 654 (84.0%) | 125 (16.1%) |
| Manufacturing | 748 (65.9%) | 387 (34.1%) |
| Wholesale Trade | 186 (68.4%) | 86 (31.6%) |
| Retail Trade | 1,010 (62.2%) | 615 (37.9%) |
| Transportation & Warehousing | 482 (82.8%) | 100 (17.2%) |
| Utilities | 12 (24.5%) | 37 (75.5%) |
| Information | 151 (88.3%) | 20 (11.7%) |
| Finance & Insurance | 129 (31.2%) | 284 (68.8%) |
| Real Estate, Rental & Leasing | 133 (79.6%) | 34 (20.4%) |
| Professional & Scientific | 382 (58.2%) | 274 (41.8%) |
| Enterprise Management | 0 (0.0%) | 19 (100.0%) |
| Administrative & Support | 248 (69.3%) | 110 (30.7%) |
| Educational Services | 198 (33.5%) | 393 (66.5%) |
| Health Care & Social Assistance | 540 (24.1%) | 1,701 (75.9%) |
| Arts, Entertainment & Recreation | 132 (48.5%) | 140 (51.5%) |
| Accommodation & Food Services | 170 (26.5%) | 472 (73.5%) |
| Public Administration | 143 (38.4%) | 229 (61.6%) |
| Total | 5,494 (51.1%) | 5,265 (48.9%) |
Education in Elmwood Park borough
School Enrollment in Elmwood Park borough
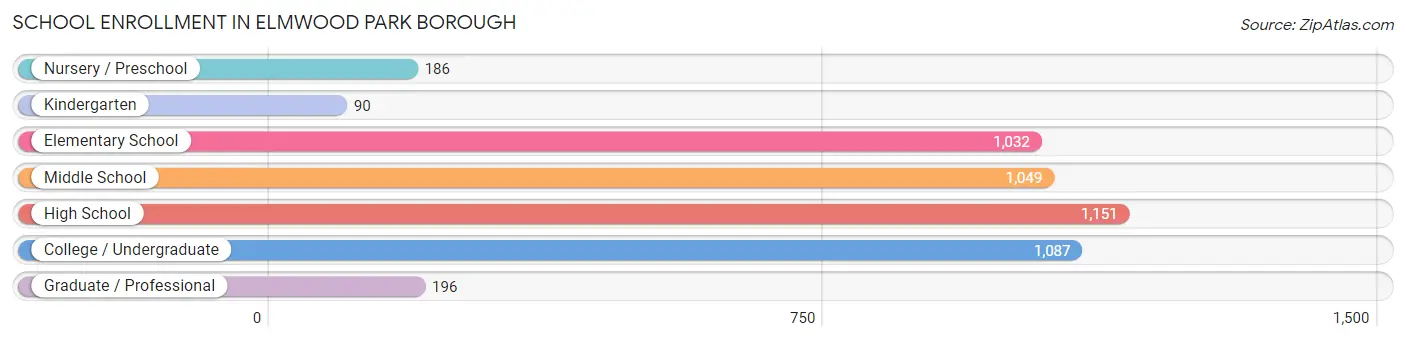
The most common levels of schooling among the 4,791 students in Elmwood Park borough are high school (1,151 | 24.0%), college / undergraduate (1,087 | 22.7%), and middle school (1,049 | 21.9%).
| School Level | # Students | % Students |
| Nursery / Preschool | 186 | 3.9% |
| Kindergarten | 90 | 1.9% |
| Elementary School | 1,032 | 21.5% |
| Middle School | 1,049 | 21.9% |
| High School | 1,151 | 24.0% |
| College / Undergraduate | 1,087 | 22.7% |
| Graduate / Professional | 196 | 4.1% |
| Total | 4,791 | 100.0% |
School Enrollment by Age by Funding Source in Elmwood Park borough
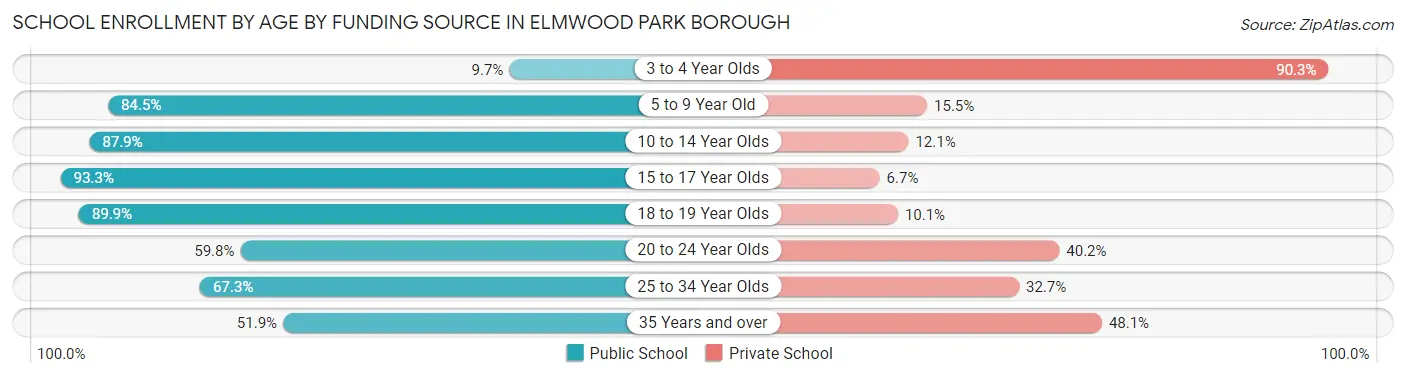
Out of a total of 4,791 students who are enrolled in schools in Elmwood Park borough, 987 (20.6%) attend a private institution, while the remaining 3,804 (79.4%) are enrolled in public schools. The age group of 3 to 4 year olds has the highest likelihood of being enrolled in private schools, with 139 (90.3% in the age bracket) enrolled. Conversely, the age group of 15 to 17 year olds has the lowest likelihood of being enrolled in a private school, with 850 (93.3% in the age bracket) attending a public institution.
| Age Bracket | Public School | Private School |
| 3 to 4 Year Olds | 15 (9.7%) | 139 (90.3%) |
| 5 to 9 Year Old | 875 (84.5%) | 161 (15.5%) |
| 10 to 14 Year Olds | 1,056 (87.9%) | 145 (12.1%) |
| 15 to 17 Year Olds | 850 (93.3%) | 61 (6.7%) |
| 18 to 19 Year Olds | 338 (89.9%) | 38 (10.1%) |
| 20 to 24 Year Olds | 405 (59.8%) | 272 (40.2%) |
| 25 to 34 Year Olds | 169 (67.3%) | 82 (32.7%) |
| 35 Years and over | 96 (51.9%) | 89 (48.1%) |
| Total | 3,804 (79.4%) | 987 (20.6%) |
Educational Attainment by Field of Study in Elmwood Park borough
Business (1,192 | 23.8%), science & technology (617 | 12.3%), education (547 | 10.9%), engineering (394 | 7.9%), and psychology (321 | 6.4%) are the most common fields of study among 5,006 individuals in Elmwood Park borough who have obtained a bachelor's degree or higher.
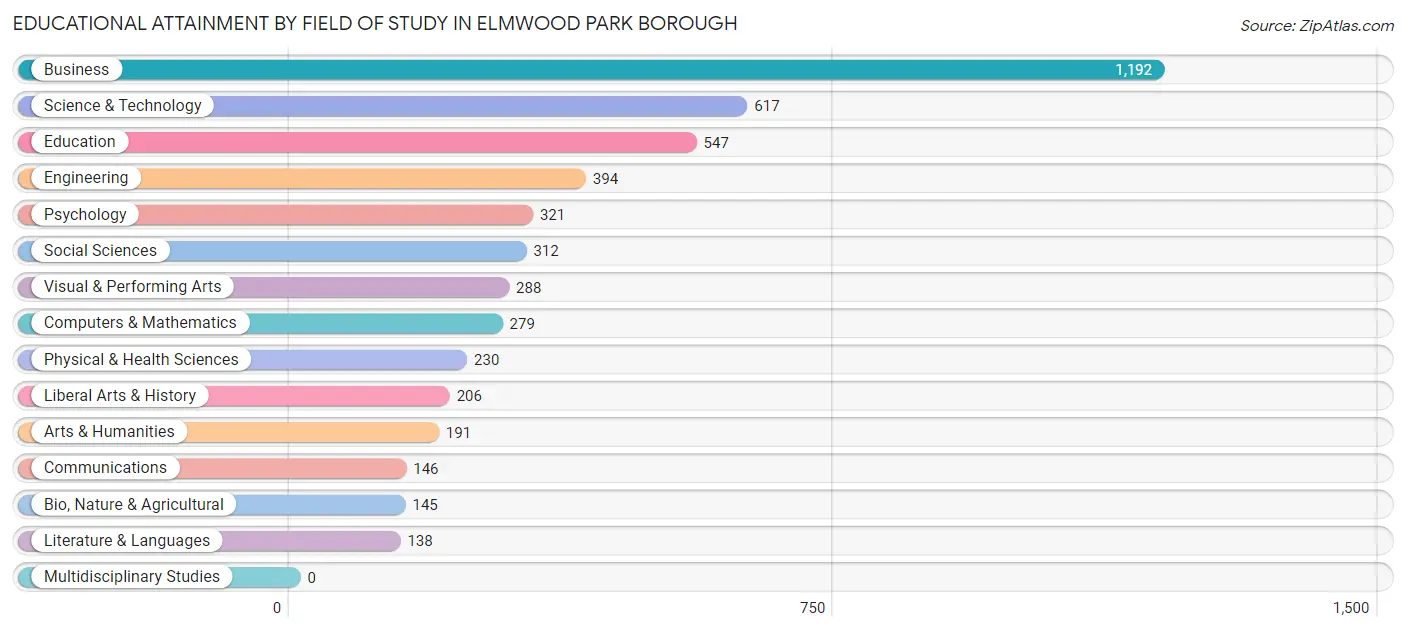
| Field of Study | # Graduates | % Graduates |
| Computers & Mathematics | 279 | 5.6% |
| Bio, Nature & Agricultural | 145 | 2.9% |
| Physical & Health Sciences | 230 | 4.6% |
| Psychology | 321 | 6.4% |
| Social Sciences | 312 | 6.2% |
| Engineering | 394 | 7.9% |
| Multidisciplinary Studies | 0 | 0.0% |
| Science & Technology | 617 | 12.3% |
| Business | 1,192 | 23.8% |
| Education | 547 | 10.9% |
| Literature & Languages | 138 | 2.8% |
| Liberal Arts & History | 206 | 4.1% |
| Visual & Performing Arts | 288 | 5.8% |
| Communications | 146 | 2.9% |
| Arts & Humanities | 191 | 3.8% |
| Total | 5,006 | 100.0% |
Transportation & Commute in Elmwood Park borough
Vehicle Availability by Sex in Elmwood Park borough
The most prevalent vehicle ownership categories in Elmwood Park borough are males with 2 vehicles (1,938, accounting for 35.1%) and females with 2 vehicles (1,690, making up 38.0%).
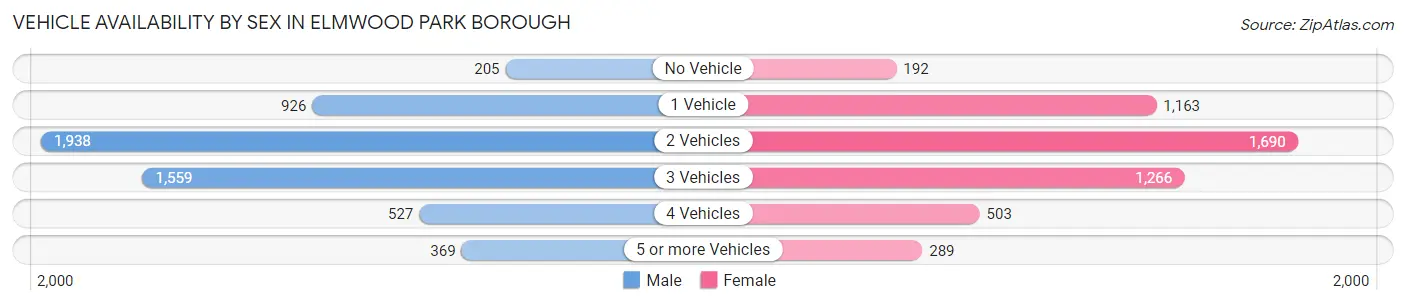
| Vehicles Available | Male | Female |
| No Vehicle | 205 (3.7%) | 192 (3.8%) |
| 1 Vehicle | 926 (16.8%) | 1,163 (22.8%) |
| 2 Vehicles | 1,938 (35.1%) | 1,690 (33.1%) |
| 3 Vehicles | 1,559 (28.2%) | 1,266 (24.8%) |
| 4 Vehicles | 527 (9.5%) | 503 (9.9%) |
| 5 or more Vehicles | 369 (6.7%) | 289 (5.7%) |
| Total | 5,524 (100.0%) | 5,103 (100.0%) |
Commute Time in Elmwood Park borough
The most frequently occuring commute durations in Elmwood Park borough are 20 to 24 minutes (1,672 commuters, 16.8%), 10 to 14 minutes (1,654 commuters, 16.6%), and 30 to 34 minutes (1,253 commuters, 12.6%).
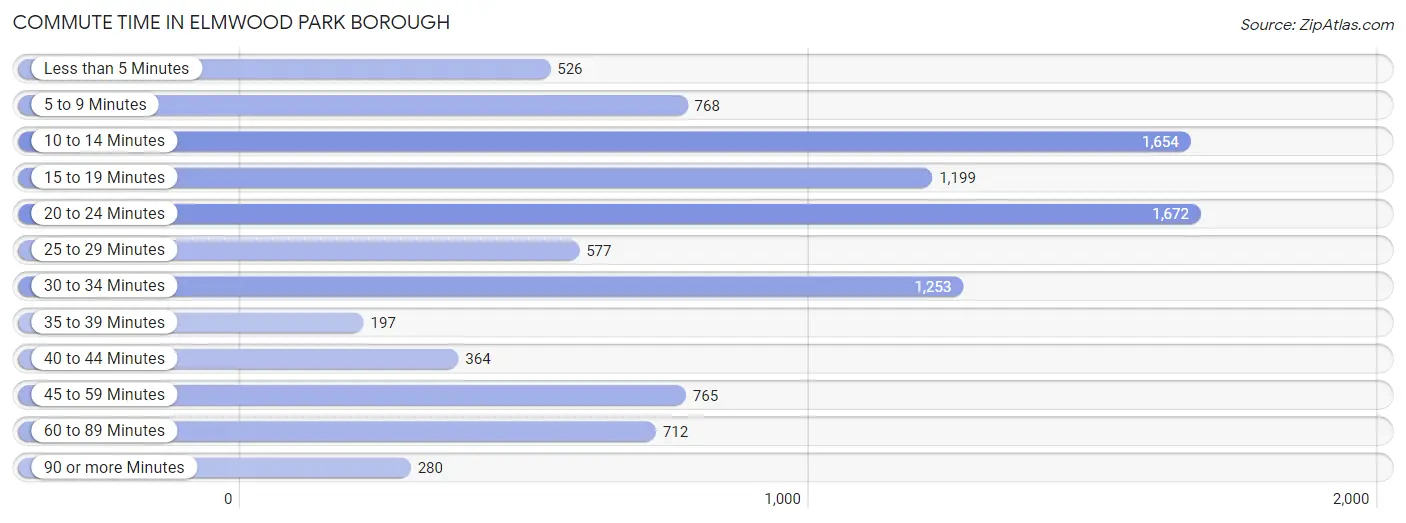
| Commute Time | # Commuters | % Commuters |
| Less than 5 Minutes | 526 | 5.3% |
| 5 to 9 Minutes | 768 | 7.7% |
| 10 to 14 Minutes | 1,654 | 16.6% |
| 15 to 19 Minutes | 1,199 | 12.0% |
| 20 to 24 Minutes | 1,672 | 16.8% |
| 25 to 29 Minutes | 577 | 5.8% |
| 30 to 34 Minutes | 1,253 | 12.6% |
| 35 to 39 Minutes | 197 | 2.0% |
| 40 to 44 Minutes | 364 | 3.6% |
| 45 to 59 Minutes | 765 | 7.7% |
| 60 to 89 Minutes | 712 | 7.1% |
| 90 or more Minutes | 280 | 2.8% |
Commute Time by Sex in Elmwood Park borough
The most common commute times in Elmwood Park borough are 20 to 24 minutes (938 commuters, 18.0%) for males and 10 to 14 minutes (944 commuters, 19.8%) for females.
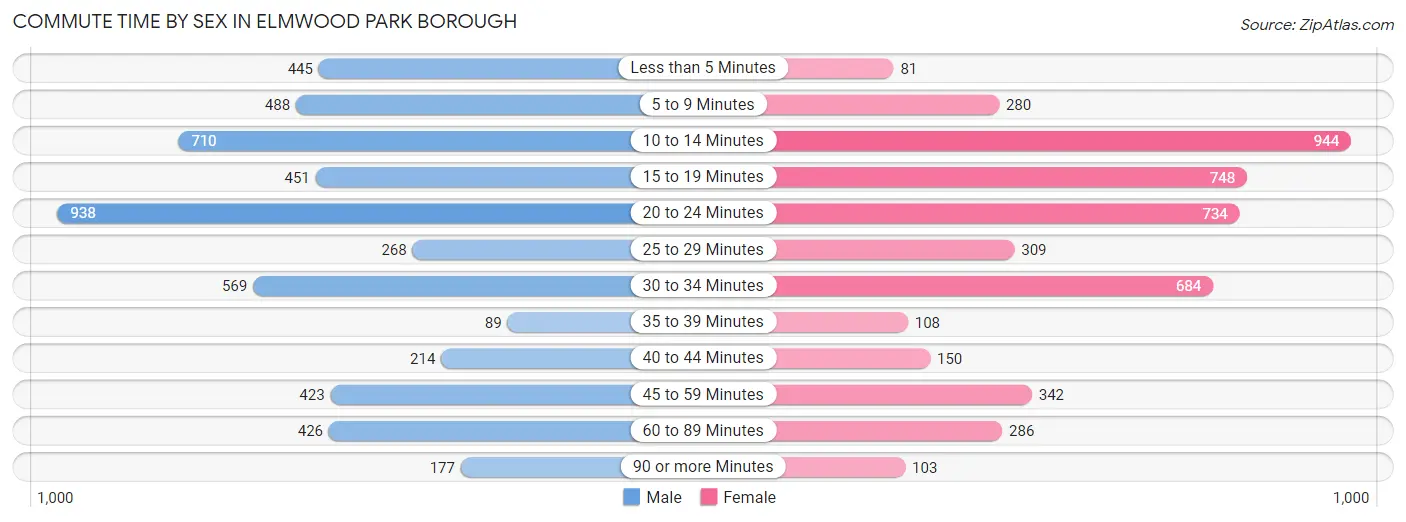
| Commute Time | Male | Female |
| Less than 5 Minutes | 445 (8.6%) | 81 (1.7%) |
| 5 to 9 Minutes | 488 (9.4%) | 280 (5.9%) |
| 10 to 14 Minutes | 710 (13.7%) | 944 (19.8%) |
| 15 to 19 Minutes | 451 (8.7%) | 748 (15.7%) |
| 20 to 24 Minutes | 938 (18.0%) | 734 (15.4%) |
| 25 to 29 Minutes | 268 (5.2%) | 309 (6.5%) |
| 30 to 34 Minutes | 569 (11.0%) | 684 (14.3%) |
| 35 to 39 Minutes | 89 (1.7%) | 108 (2.3%) |
| 40 to 44 Minutes | 214 (4.1%) | 150 (3.2%) |
| 45 to 59 Minutes | 423 (8.1%) | 342 (7.2%) |
| 60 to 89 Minutes | 426 (8.2%) | 286 (6.0%) |
| 90 or more Minutes | 177 (3.4%) | 103 (2.2%) |
Time of Departure to Work by Sex in Elmwood Park borough
The most frequent times of departure to work in Elmwood Park borough are 8:00 AM to 8:29 AM (675, 13.0%) for males and 7:30 AM to 7:59 AM (685, 14.4%) for females.
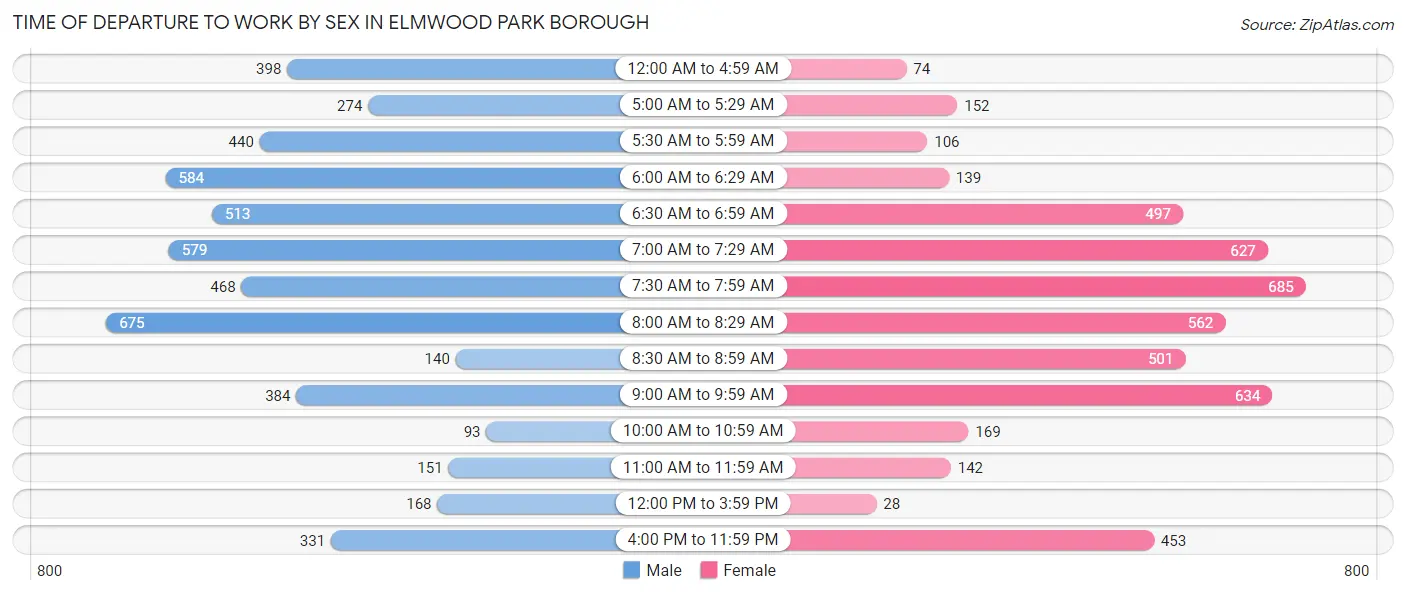
| Time of Departure | Male | Female |
| 12:00 AM to 4:59 AM | 398 (7.7%) | 74 (1.5%) |
| 5:00 AM to 5:29 AM | 274 (5.3%) | 152 (3.2%) |
| 5:30 AM to 5:59 AM | 440 (8.5%) | 106 (2.2%) |
| 6:00 AM to 6:29 AM | 584 (11.2%) | 139 (2.9%) |
| 6:30 AM to 6:59 AM | 513 (9.9%) | 497 (10.4%) |
| 7:00 AM to 7:29 AM | 579 (11.1%) | 627 (13.2%) |
| 7:30 AM to 7:59 AM | 468 (9.0%) | 685 (14.4%) |
| 8:00 AM to 8:29 AM | 675 (13.0%) | 562 (11.8%) |
| 8:30 AM to 8:59 AM | 140 (2.7%) | 501 (10.5%) |
| 9:00 AM to 9:59 AM | 384 (7.4%) | 634 (13.3%) |
| 10:00 AM to 10:59 AM | 93 (1.8%) | 169 (3.5%) |
| 11:00 AM to 11:59 AM | 151 (2.9%) | 142 (3.0%) |
| 12:00 PM to 3:59 PM | 168 (3.2%) | 28 (0.6%) |
| 4:00 PM to 11:59 PM | 331 (6.4%) | 453 (9.5%) |
| Total | 5,198 (100.0%) | 4,769 (100.0%) |
Housing Occupancy in Elmwood Park borough
Occupancy by Ownership in Elmwood Park borough
Of the total 7,220 dwellings in Elmwood Park borough, owner-occupied units account for 3,892 (53.9%), while renter-occupied units make up 3,328 (46.1%).
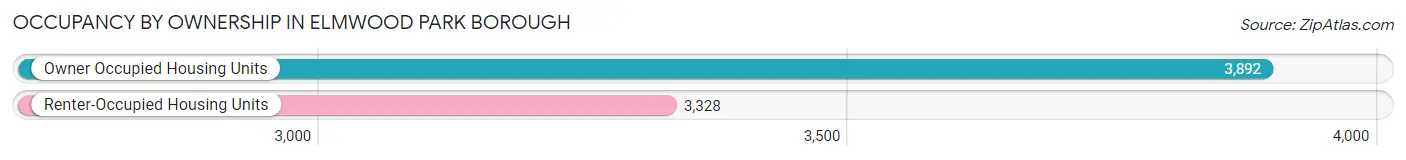
| Occupancy | # Housing Units | % Housing Units |
| Owner Occupied Housing Units | 3,892 | 53.9% |
| Renter-Occupied Housing Units | 3,328 | 46.1% |
| Total Occupied Housing Units | 7,220 | 100.0% |
Occupancy by Household Size in Elmwood Park borough
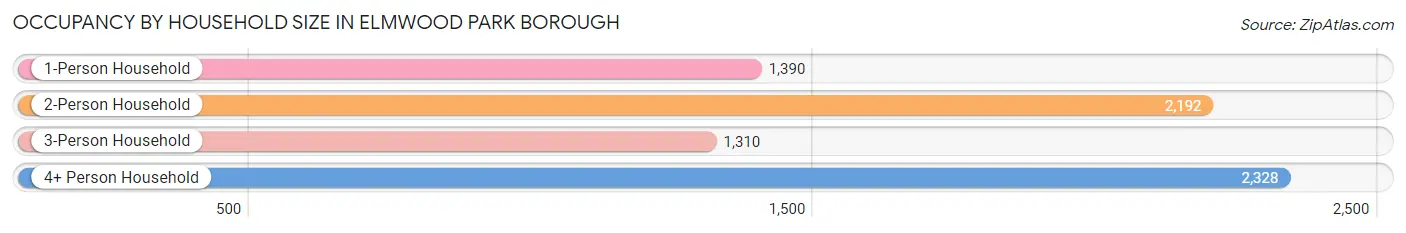
| Household Size | # Housing Units | % Housing Units |
| 1-Person Household | 1,390 | 19.3% |
| 2-Person Household | 2,192 | 30.4% |
| 3-Person Household | 1,310 | 18.1% |
| 4+ Person Household | 2,328 | 32.2% |
| Total Housing Units | 7,220 | 100.0% |
Occupancy by Ownership by Household Size in Elmwood Park borough
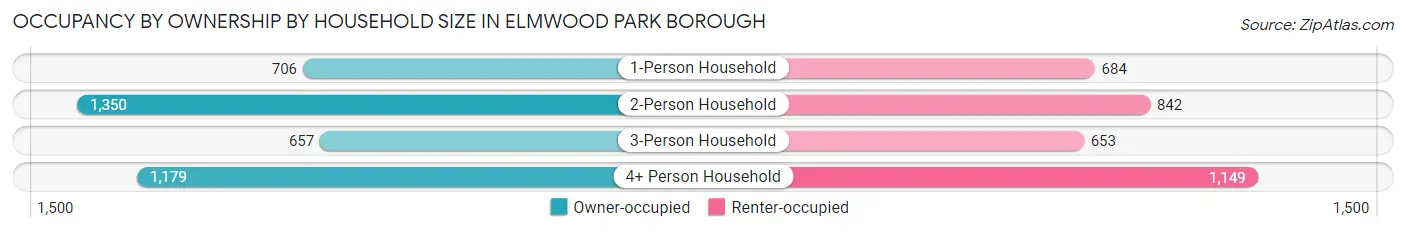
| Household Size | Owner-occupied | Renter-occupied |
| 1-Person Household | 706 (50.8%) | 684 (49.2%) |
| 2-Person Household | 1,350 (61.6%) | 842 (38.4%) |
| 3-Person Household | 657 (50.1%) | 653 (49.8%) |
| 4+ Person Household | 1,179 (50.6%) | 1,149 (49.4%) |
| Total Housing Units | 3,892 (53.9%) | 3,328 (46.1%) |
Occupancy by Educational Attainment in Elmwood Park borough
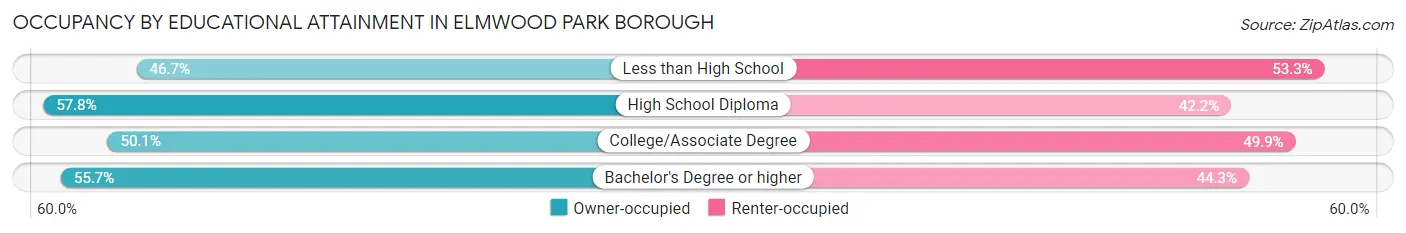
| Household Size | Owner-occupied | Renter-occupied |
| Less than High School | 345 (46.7%) | 394 (53.3%) |
| High School Diploma | 1,266 (57.8%) | 925 (42.2%) |
| College/Associate Degree | 973 (50.1%) | 968 (49.9%) |
| Bachelor's Degree or higher | 1,308 (55.7%) | 1,041 (44.3%) |
Occupancy by Age of Householder in Elmwood Park borough
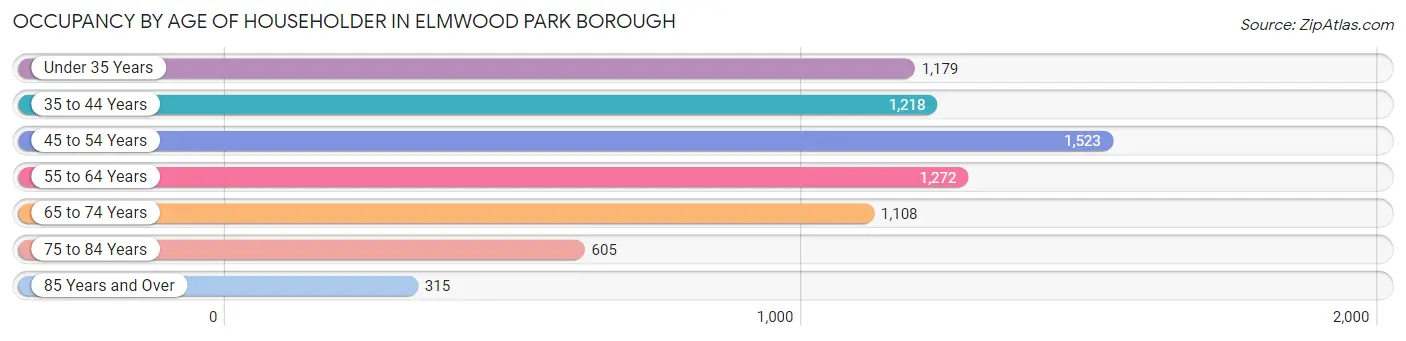
| Age Bracket | # Households | % Households |
| Under 35 Years | 1,179 | 16.3% |
| 35 to 44 Years | 1,218 | 16.9% |
| 45 to 54 Years | 1,523 | 21.1% |
| 55 to 64 Years | 1,272 | 17.6% |
| 65 to 74 Years | 1,108 | 15.3% |
| 75 to 84 Years | 605 | 8.4% |
| 85 Years and Over | 315 | 4.4% |
| Total | 7,220 | 100.0% |
Housing Finances in Elmwood Park borough
Median Income by Occupancy in Elmwood Park borough
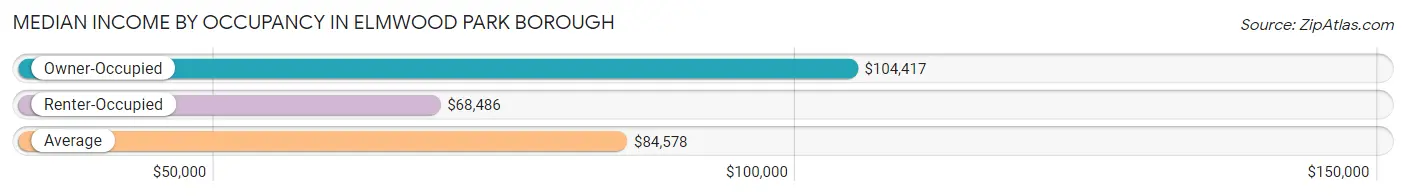
| Occupancy Type | # Households | Median Income |
| Owner-Occupied | 3,892 (53.9%) | $104,417 |
| Renter-Occupied | 3,328 (46.1%) | $68,486 |
| Average | 7,220 (100.0%) | $84,578 |
Occupancy by Householder Income Bracket in Elmwood Park borough
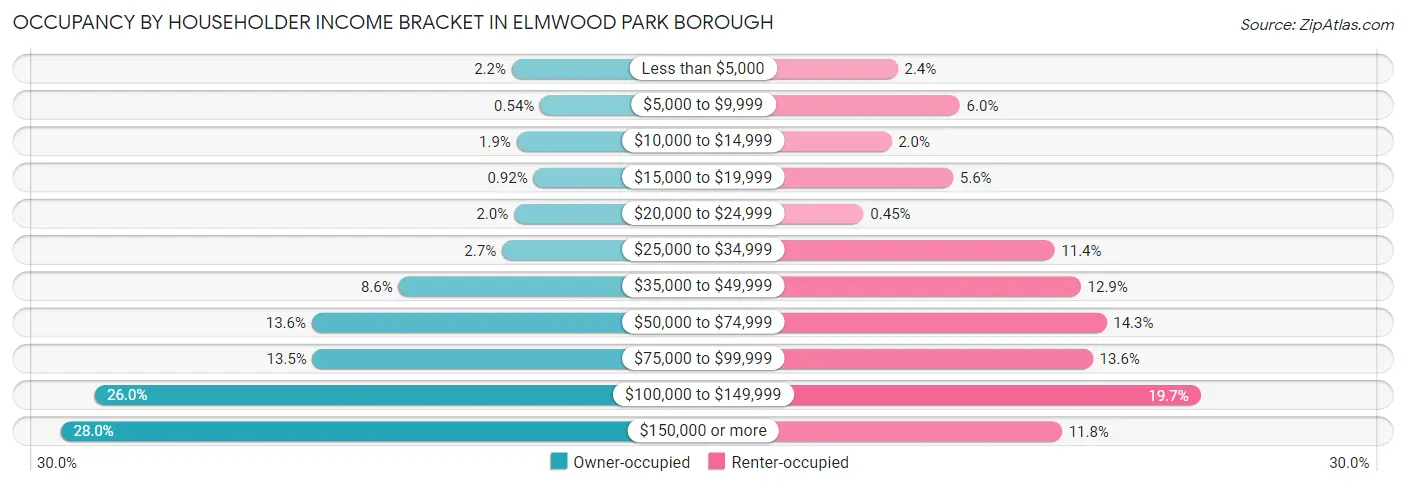
| Income Bracket | Owner-occupied | Renter-occupied |
| Less than $5,000 | 84 (2.2%) | 80 (2.4%) |
| $5,000 to $9,999 | 21 (0.5%) | 198 (5.9%) |
| $10,000 to $14,999 | 73 (1.9%) | 68 (2.0%) |
| $15,000 to $19,999 | 36 (0.9%) | 185 (5.6%) |
| $20,000 to $24,999 | 79 (2.0%) | 15 (0.4%) |
| $25,000 to $34,999 | 106 (2.7%) | 378 (11.4%) |
| $35,000 to $49,999 | 336 (8.6%) | 428 (12.9%) |
| $50,000 to $74,999 | 529 (13.6%) | 477 (14.3%) |
| $75,000 to $99,999 | 527 (13.5%) | 451 (13.6%) |
| $100,000 to $149,999 | 1,013 (26.0%) | 656 (19.7%) |
| $150,000 or more | 1,088 (28.0%) | 392 (11.8%) |
| Total | 3,892 (100.0%) | 3,328 (100.0%) |
Monthly Housing Cost Tiers in Elmwood Park borough
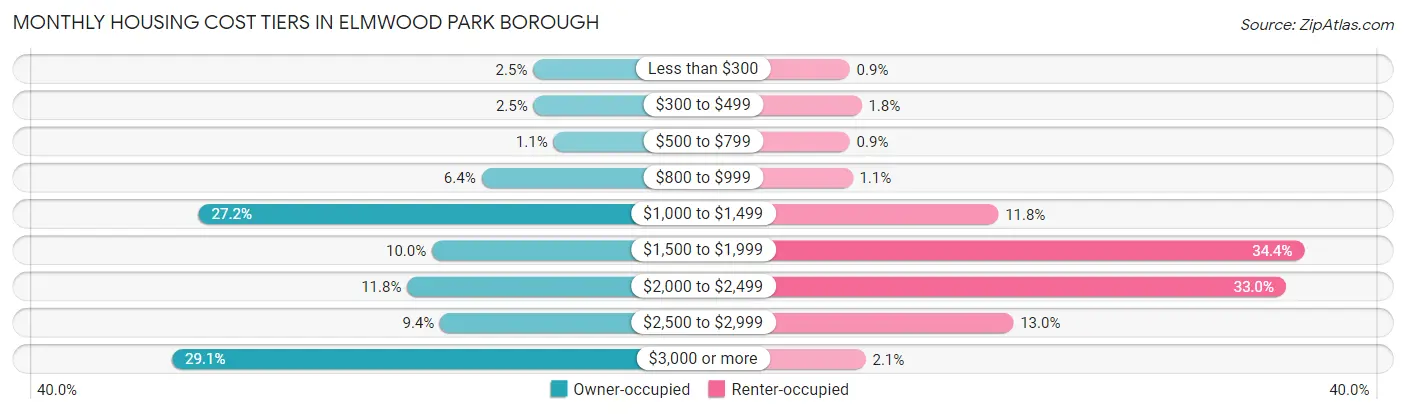
| Monthly Cost | Owner-occupied | Renter-occupied |
| Less than $300 | 99 (2.5%) | 30 (0.9%) |
| $300 to $499 | 98 (2.5%) | 59 (1.8%) |
| $500 to $799 | 41 (1.1%) | 30 (0.9%) |
| $800 to $999 | 247 (6.4%) | 37 (1.1%) |
| $1,000 to $1,499 | 1,058 (27.2%) | 394 (11.8%) |
| $1,500 to $1,999 | 389 (10.0%) | 1,144 (34.4%) |
| $2,000 to $2,499 | 460 (11.8%) | 1,099 (33.0%) |
| $2,500 to $2,999 | 366 (9.4%) | 431 (13.0%) |
| $3,000 or more | 1,134 (29.1%) | 69 (2.1%) |
| Total | 3,892 (100.0%) | 3,328 (100.0%) |
Physical Housing Characteristics in Elmwood Park borough
Housing Structures in Elmwood Park borough
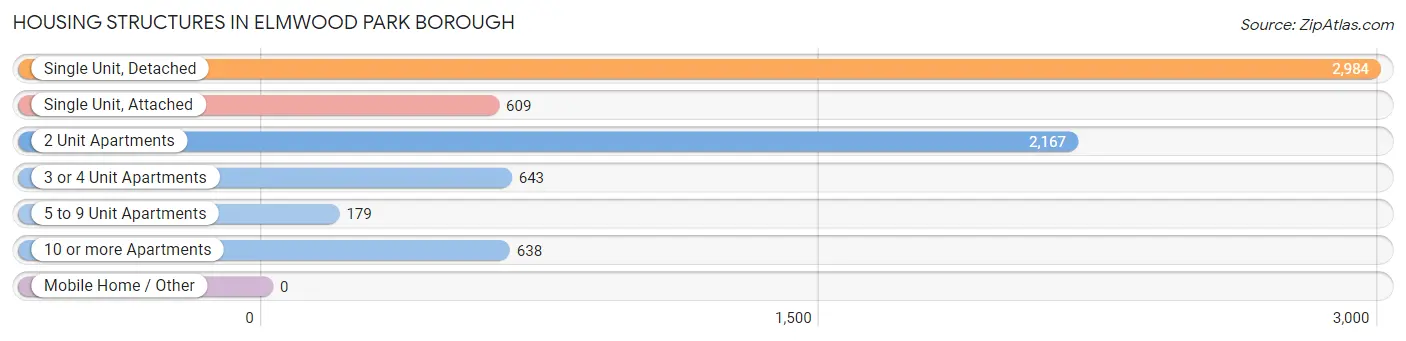
| Structure Type | # Housing Units | % Housing Units |
| Single Unit, Detached | 2,984 | 41.3% |
| Single Unit, Attached | 609 | 8.4% |
| 2 Unit Apartments | 2,167 | 30.0% |
| 3 or 4 Unit Apartments | 643 | 8.9% |
| 5 to 9 Unit Apartments | 179 | 2.5% |
| 10 or more Apartments | 638 | 8.8% |
| Mobile Home / Other | 0 | 0.0% |
| Total | 7,220 | 100.0% |
Housing Structures by Occupancy in Elmwood Park borough
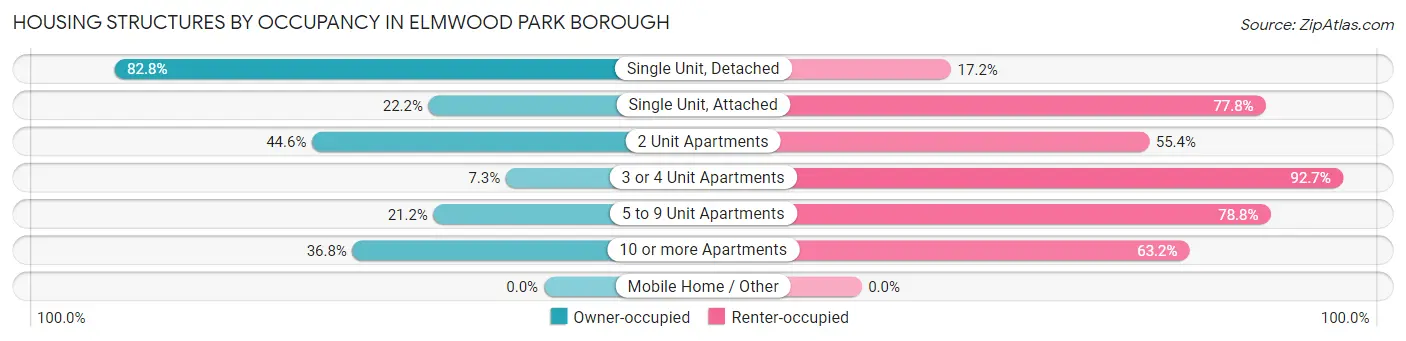
| Structure Type | Owner-occupied | Renter-occupied |
| Single Unit, Detached | 2,470 (82.8%) | 514 (17.2%) |
| Single Unit, Attached | 135 (22.2%) | 474 (77.8%) |
| 2 Unit Apartments | 967 (44.6%) | 1,200 (55.4%) |
| 3 or 4 Unit Apartments | 47 (7.3%) | 596 (92.7%) |
| 5 to 9 Unit Apartments | 38 (21.2%) | 141 (78.8%) |
| 10 or more Apartments | 235 (36.8%) | 403 (63.2%) |
| Mobile Home / Other | 0 (0.0%) | 0 (0.0%) |
| Total | 3,892 (53.9%) | 3,328 (46.1%) |
Housing Structures by Number of Rooms in Elmwood Park borough
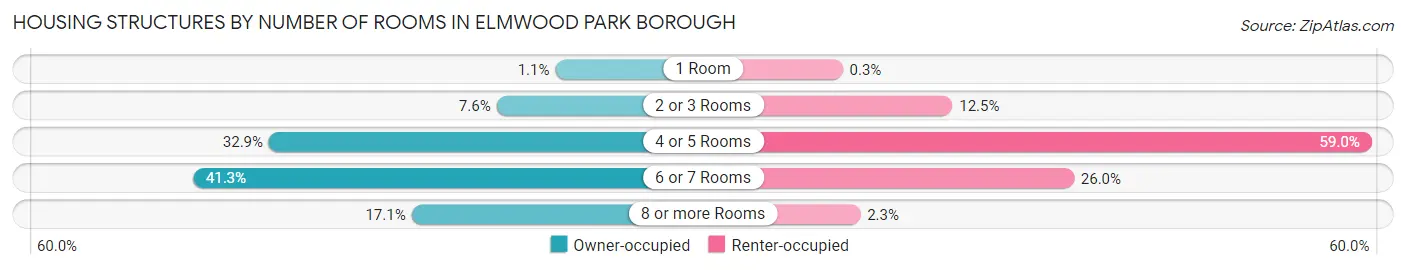
| Number of Rooms | Owner-occupied | Renter-occupied |
| 1 Room | 43 (1.1%) | 10 (0.3%) |
| 2 or 3 Rooms | 297 (7.6%) | 415 (12.5%) |
| 4 or 5 Rooms | 1,280 (32.9%) | 1,964 (59.0%) |
| 6 or 7 Rooms | 1,608 (41.3%) | 864 (26.0%) |
| 8 or more Rooms | 664 (17.1%) | 75 (2.2%) |
| Total | 3,892 (100.0%) | 3,328 (100.0%) |
Housing Structure by Heating Type in Elmwood Park borough
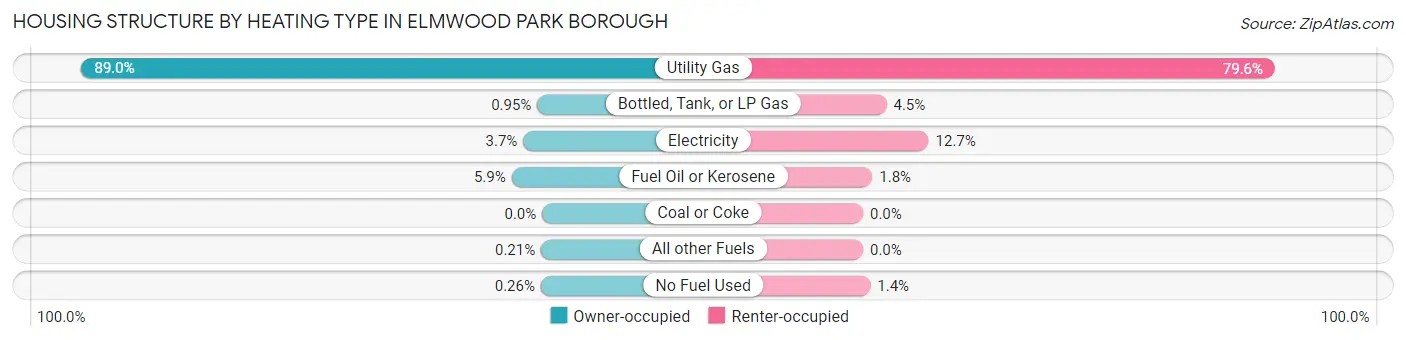
| Heating Type | Owner-occupied | Renter-occupied |
| Utility Gas | 3,465 (89.0%) | 2,648 (79.6%) |
| Bottled, Tank, or LP Gas | 37 (0.9%) | 151 (4.5%) |
| Electricity | 142 (3.6%) | 422 (12.7%) |
| Fuel Oil or Kerosene | 230 (5.9%) | 60 (1.8%) |
| Coal or Coke | 0 (0.0%) | 0 (0.0%) |
| All other Fuels | 8 (0.2%) | 0 (0.0%) |
| No Fuel Used | 10 (0.3%) | 47 (1.4%) |
| Total | 3,892 (100.0%) | 3,328 (100.0%) |
Household Vehicle Usage in Elmwood Park borough
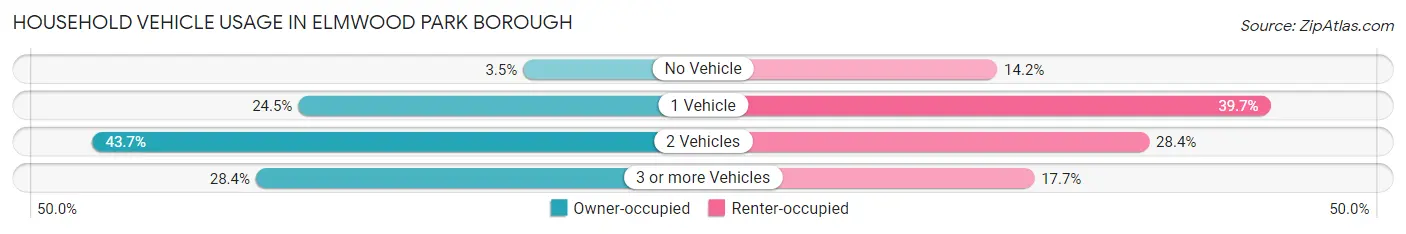
| Vehicles per Household | Owner-occupied | Renter-occupied |
| No Vehicle | 135 (3.5%) | 473 (14.2%) |
| 1 Vehicle | 952 (24.5%) | 1,322 (39.7%) |
| 2 Vehicles | 1,699 (43.6%) | 945 (28.4%) |
| 3 or more Vehicles | 1,106 (28.4%) | 588 (17.7%) |
| Total | 3,892 (100.0%) | 3,328 (100.0%) |
Real Estate & Mortgages in Elmwood Park borough
Real Estate and Mortgage Overview in Elmwood Park borough
| Characteristic | Without Mortgage | With Mortgage |
| Housing Units | 1,571 | 2,321 |
| Median Property Value | $385,100 | $454,700 |
| Median Household Income | $94,073 | $722 |
| Monthly Housing Costs | $1,158 | $1,134 |
| Real Estate Taxes | $9,449 | $16 |
Property Value by Mortgage Status in Elmwood Park borough
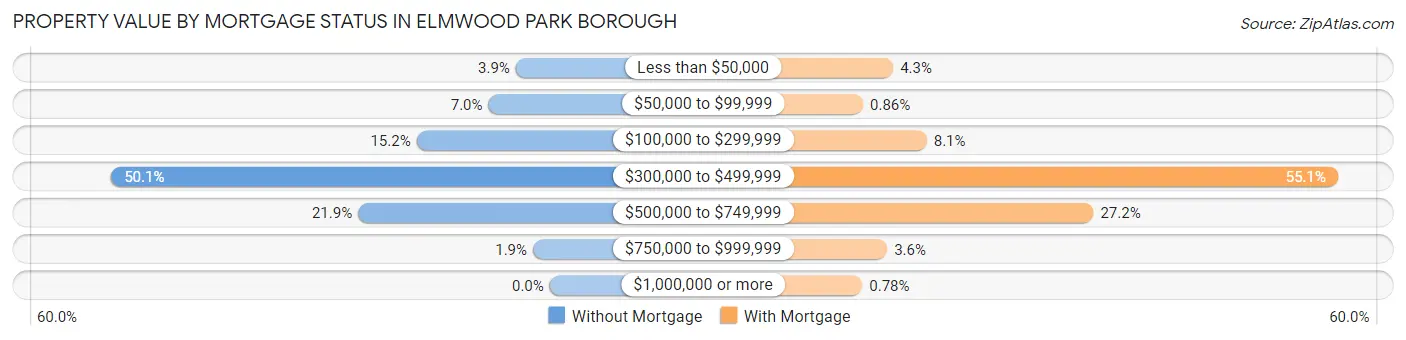
| Property Value | Without Mortgage | With Mortgage |
| Less than $50,000 | 61 (3.9%) | 100 (4.3%) |
| $50,000 to $99,999 | 110 (7.0%) | 20 (0.9%) |
| $100,000 to $299,999 | 239 (15.2%) | 189 (8.1%) |
| $300,000 to $499,999 | 787 (50.1%) | 1,279 (55.1%) |
| $500,000 to $749,999 | 344 (21.9%) | 631 (27.2%) |
| $750,000 to $999,999 | 30 (1.9%) | 84 (3.6%) |
| $1,000,000 or more | 0 (0.0%) | 18 (0.8%) |
| Total | 1,571 (100.0%) | 2,321 (100.0%) |
Household Income by Mortgage Status in Elmwood Park borough
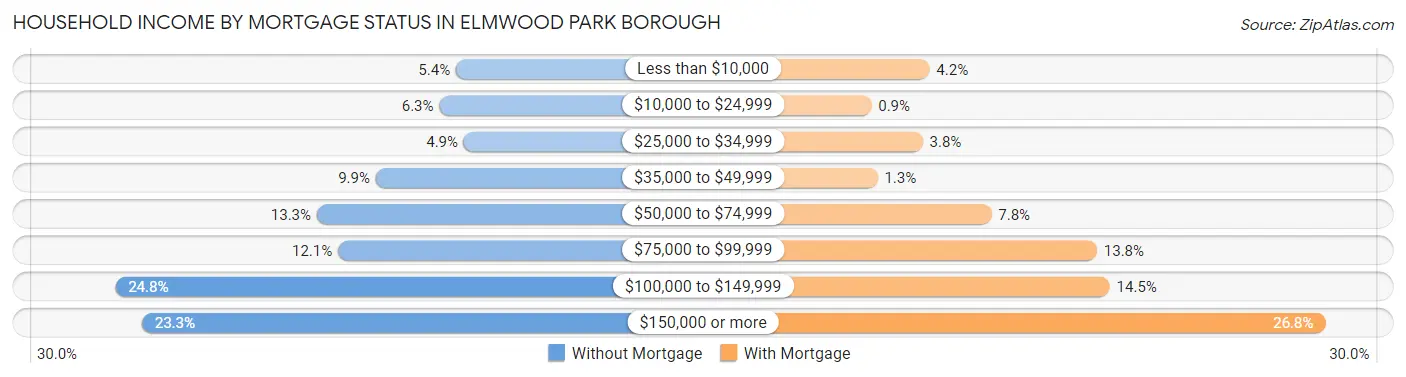
| Household Income | Without Mortgage | With Mortgage |
| Less than $10,000 | 84 (5.3%) | 98 (4.2%) |
| $10,000 to $24,999 | 99 (6.3%) | 21 (0.9%) |
| $25,000 to $34,999 | 77 (4.9%) | 89 (3.8%) |
| $35,000 to $49,999 | 156 (9.9%) | 29 (1.3%) |
| $50,000 to $74,999 | 209 (13.3%) | 180 (7.8%) |
| $75,000 to $99,999 | 190 (12.1%) | 320 (13.8%) |
| $100,000 to $149,999 | 390 (24.8%) | 337 (14.5%) |
| $150,000 or more | 366 (23.3%) | 623 (26.8%) |
| Total | 1,571 (100.0%) | 2,321 (100.0%) |
Property Value to Household Income Ratio in Elmwood Park borough
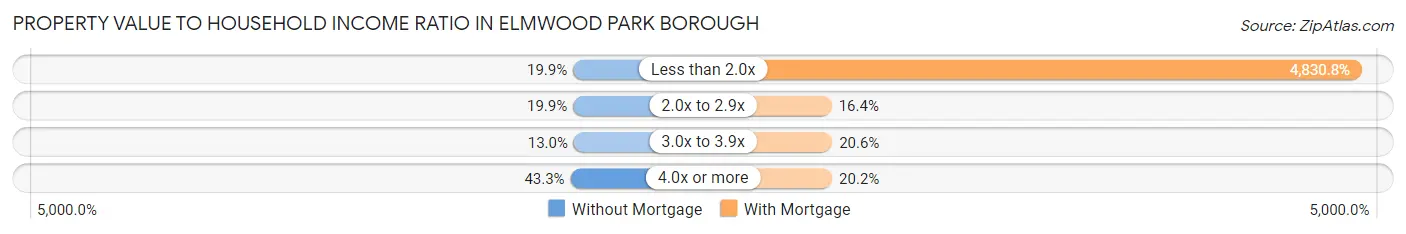
| Value-to-Income Ratio | Without Mortgage | With Mortgage |
| Less than 2.0x | 312 (19.9%) | 112,122 (4,830.8%) |
| 2.0x to 2.9x | 313 (19.9%) | 380 (16.4%) |
| 3.0x to 3.9x | 204 (13.0%) | 478 (20.6%) |
| 4.0x or more | 680 (43.3%) | 468 (20.2%) |
| Total | 1,571 (100.0%) | 2,321 (100.0%) |
Real Estate Taxes by Mortgage Status in Elmwood Park borough
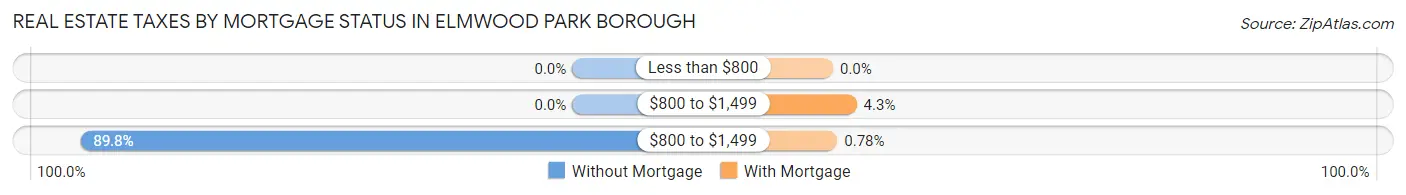
| Property Taxes | Without Mortgage | With Mortgage |
| Less than $800 | 0 (0.0%) | 0 (0.0%) |
| $800 to $1,499 | 0 (0.0%) | 100 (4.3%) |
| $800 to $1,499 | 1,411 (89.8%) | 18 (0.8%) |
| Total | 1,571 (100.0%) | 2,321 (100.0%) |
Health & Disability in Elmwood Park borough
Health Insurance Coverage by Age in Elmwood Park borough
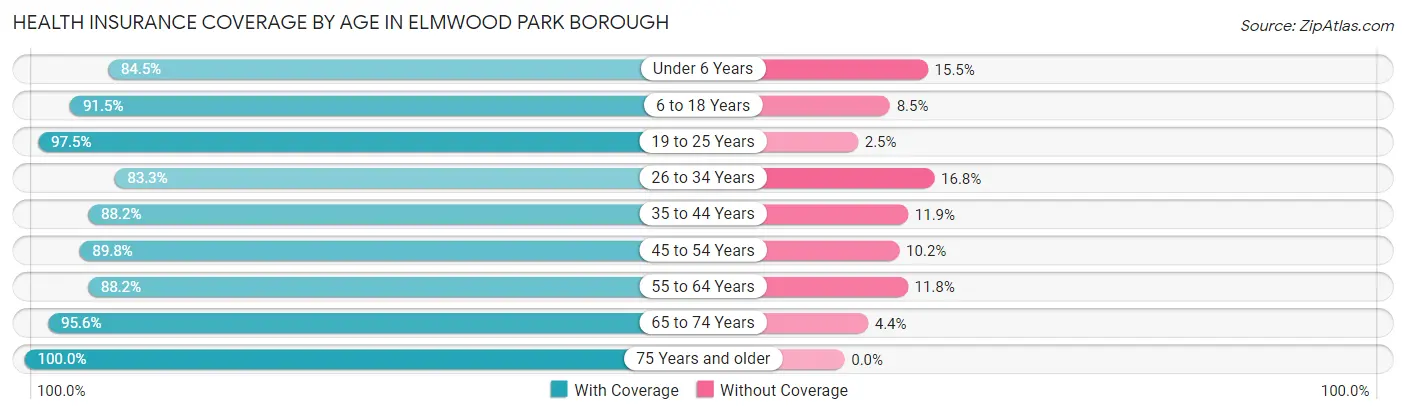
| Age Bracket | With Coverage | Without Coverage |
| Under 6 Years | 1,272 (84.5%) | 234 (15.5%) |
| 6 to 18 Years | 2,994 (91.5%) | 277 (8.5%) |
| 19 to 25 Years | 1,853 (97.5%) | 48 (2.5%) |
| 26 to 34 Years | 2,466 (83.3%) | 496 (16.8%) |
| 35 to 44 Years | 2,179 (88.1%) | 293 (11.8%) |
| 45 to 54 Years | 2,457 (89.8%) | 280 (10.2%) |
| 55 to 64 Years | 2,425 (88.2%) | 324 (11.8%) |
| 65 to 74 Years | 1,964 (95.6%) | 90 (4.4%) |
| 75 Years and older | 1,553 (100.0%) | 0 (0.0%) |
| Total | 19,163 (90.4%) | 2,042 (9.6%) |
Health Insurance Coverage by Citizenship Status in Elmwood Park borough
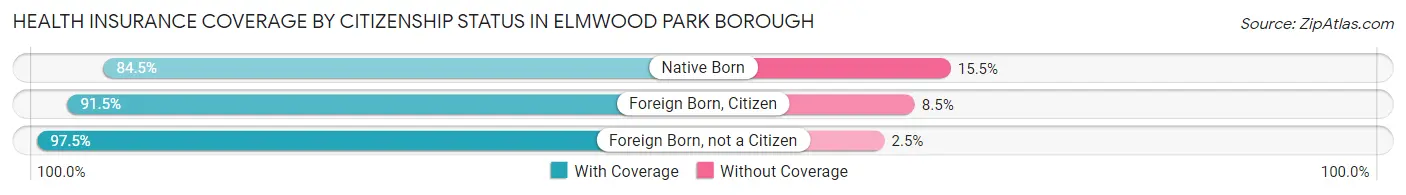
| Citizenship Status | With Coverage | Without Coverage |
| Native Born | 1,272 (84.5%) | 234 (15.5%) |
| Foreign Born, Citizen | 2,994 (91.5%) | 277 (8.5%) |
| Foreign Born, not a Citizen | 1,853 (97.5%) | 48 (2.5%) |
Health Insurance Coverage by Household Income in Elmwood Park borough
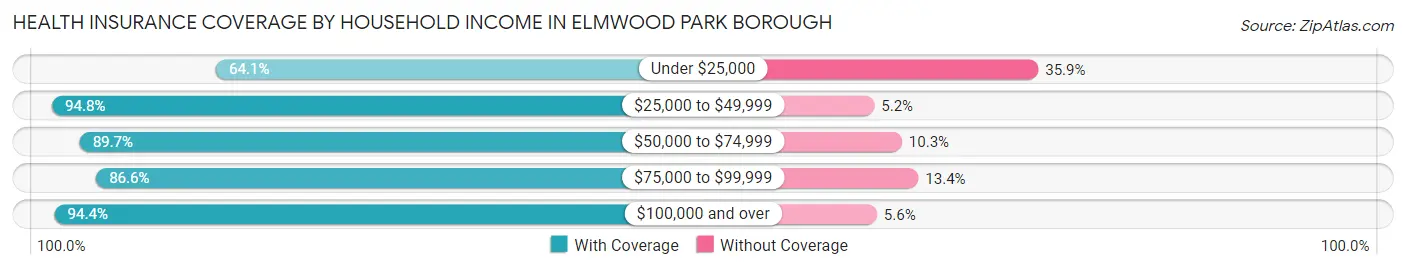
| Household Income | With Coverage | Without Coverage |
| Under $25,000 | 1,158 (64.1%) | 648 (35.9%) |
| $25,000 to $49,999 | 2,954 (94.8%) | 161 (5.2%) |
| $50,000 to $74,999 | 2,204 (89.7%) | 254 (10.3%) |
| $75,000 to $99,999 | 2,213 (86.6%) | 343 (13.4%) |
| $100,000 and over | 10,601 (94.4%) | 634 (5.6%) |
Public vs Private Health Insurance Coverage by Age in Elmwood Park borough
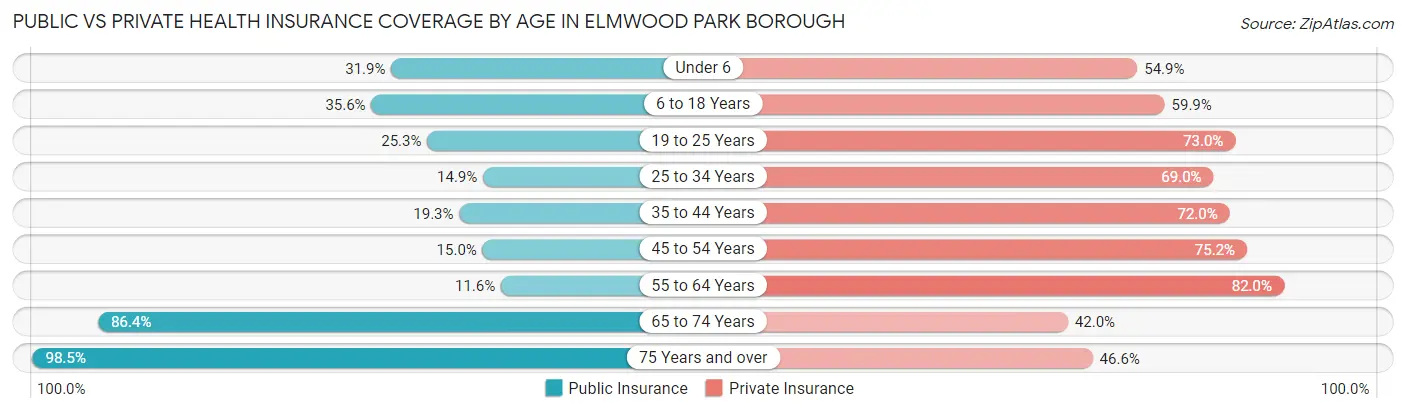
| Age Bracket | Public Insurance | Private Insurance |
| Under 6 | 481 (31.9%) | 826 (54.8%) |
| 6 to 18 Years | 1,165 (35.6%) | 1,960 (59.9%) |
| 19 to 25 Years | 480 (25.3%) | 1,388 (73.0%) |
| 25 to 34 Years | 441 (14.9%) | 2,043 (69.0%) |
| 35 to 44 Years | 477 (19.3%) | 1,779 (72.0%) |
| 45 to 54 Years | 410 (15.0%) | 2,058 (75.2%) |
| 55 to 64 Years | 318 (11.6%) | 2,255 (82.0%) |
| 65 to 74 Years | 1,774 (86.4%) | 862 (42.0%) |
| 75 Years and over | 1,530 (98.5%) | 723 (46.6%) |
| Total | 7,076 (33.4%) | 13,894 (65.5%) |
Disability Status by Sex by Age in Elmwood Park borough
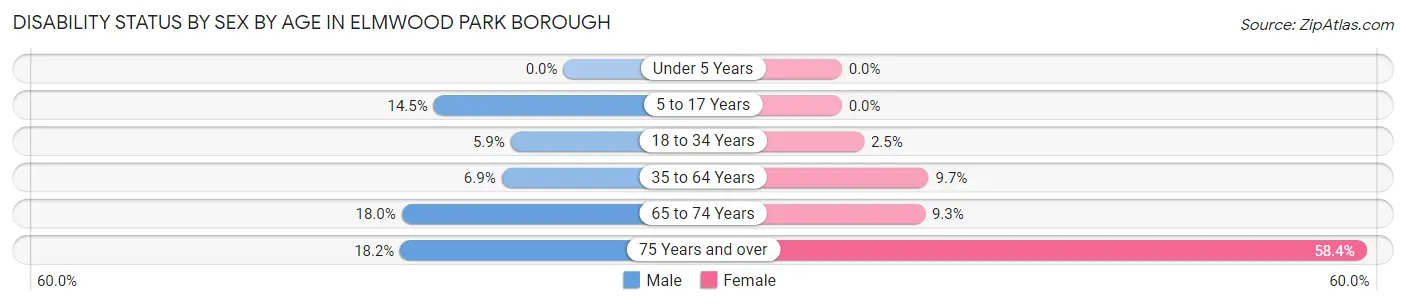
| Age Bracket | Male | Female |
| Under 5 Years | 0 (0.0%) | 0 (0.0%) |
| 5 to 17 Years | 242 (14.5%) | 0 (0.0%) |
| 18 to 34 Years | 142 (5.9%) | 66 (2.5%) |
| 35 to 64 Years | 256 (6.9%) | 410 (9.7%) |
| 65 to 74 Years | 162 (18.0%) | 107 (9.3%) |
| 75 Years and over | 141 (18.2%) | 454 (58.4%) |
Disability Class by Sex by Age in Elmwood Park borough
Disability Class: Hearing Difficulty
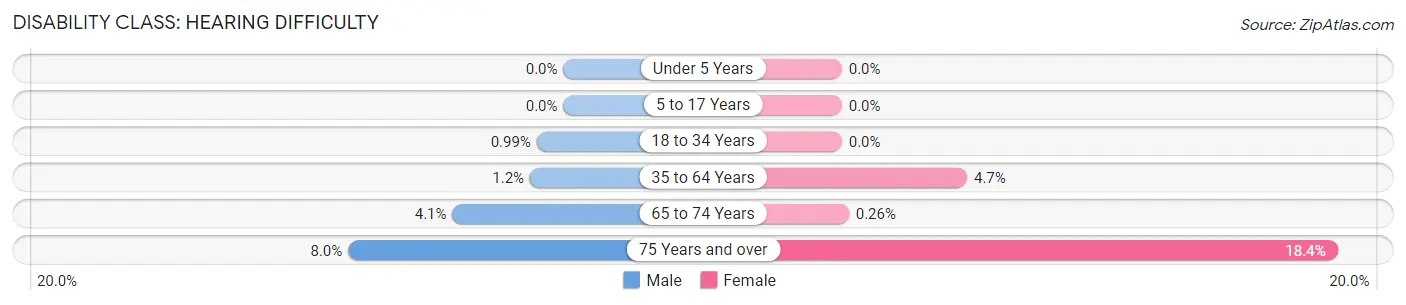
| Age Bracket | Male | Female |
| Under 5 Years | 0 (0.0%) | 0 (0.0%) |
| 5 to 17 Years | 0 (0.0%) | 0 (0.0%) |
| 18 to 34 Years | 24 (1.0%) | 0 (0.0%) |
| 35 to 64 Years | 46 (1.2%) | 197 (4.6%) |
| 65 to 74 Years | 37 (4.1%) | 3 (0.3%) |
| 75 Years and over | 62 (8.0%) | 143 (18.4%) |
Disability Class: Vision Difficulty
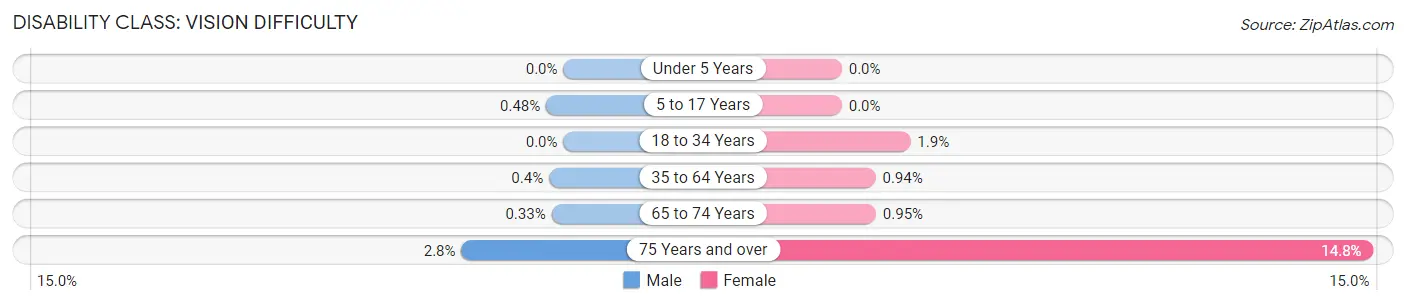
| Age Bracket | Male | Female |
| Under 5 Years | 0 (0.0%) | 0 (0.0%) |
| 5 to 17 Years | 8 (0.5%) | 0 (0.0%) |
| 18 to 34 Years | 0 (0.0%) | 51 (1.9%) |
| 35 to 64 Years | 15 (0.4%) | 40 (0.9%) |
| 65 to 74 Years | 3 (0.3%) | 11 (0.9%) |
| 75 Years and over | 22 (2.8%) | 115 (14.8%) |
Disability Class: Cognitive Difficulty
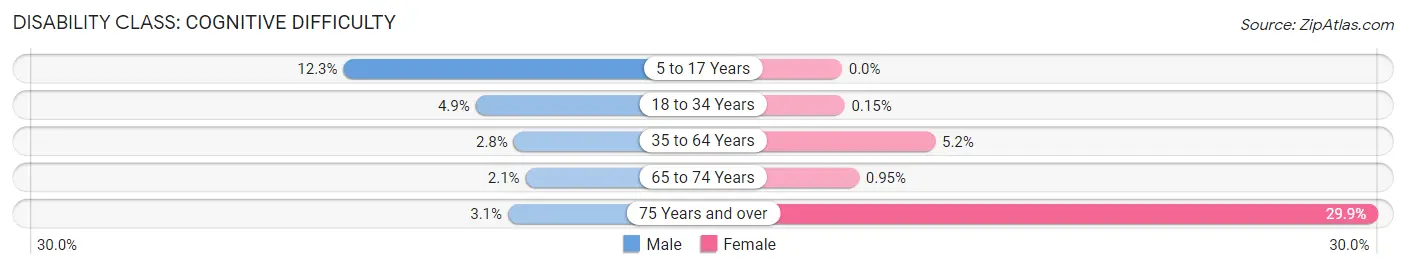
| Age Bracket | Male | Female |
| 5 to 17 Years | 205 (12.2%) | 0 (0.0%) |
| 18 to 34 Years | 118 (4.9%) | 4 (0.2%) |
| 35 to 64 Years | 103 (2.8%) | 220 (5.2%) |
| 65 to 74 Years | 19 (2.1%) | 11 (0.9%) |
| 75 Years and over | 24 (3.1%) | 232 (29.9%) |
Disability Class: Ambulatory Difficulty
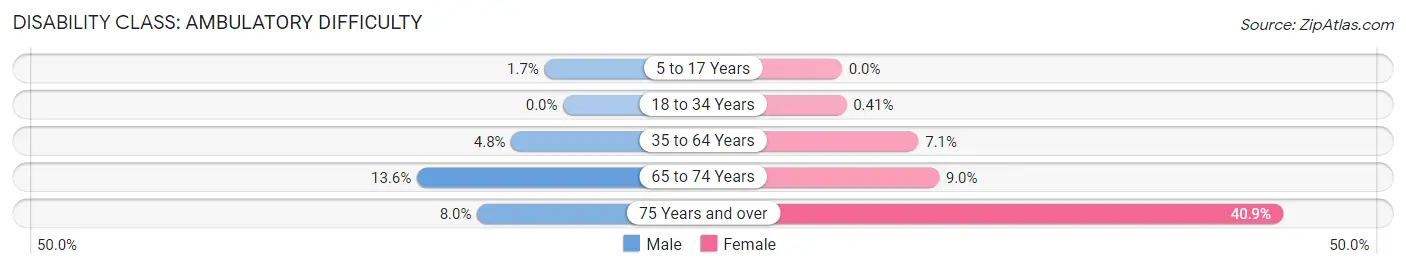
| Age Bracket | Male | Female |
| 5 to 17 Years | 29 (1.7%) | 0 (0.0%) |
| 18 to 34 Years | 0 (0.0%) | 11 (0.4%) |
| 35 to 64 Years | 179 (4.8%) | 301 (7.1%) |
| 65 to 74 Years | 122 (13.6%) | 104 (9.0%) |
| 75 Years and over | 62 (8.0%) | 318 (40.9%) |
Disability Class: Self-Care Difficulty
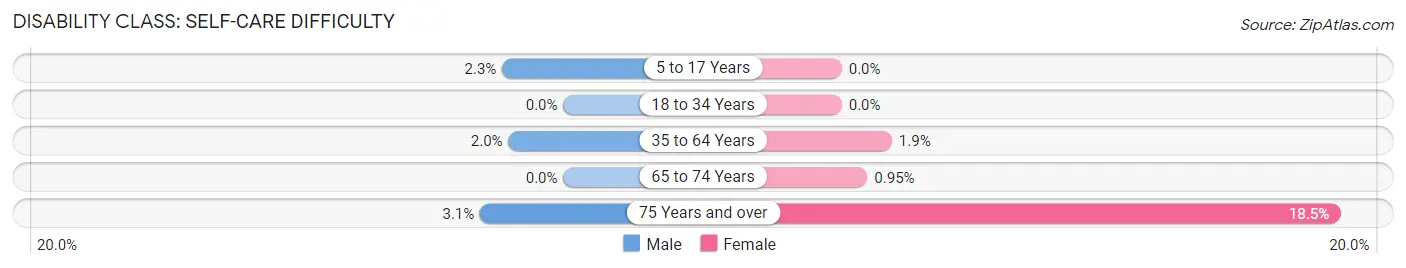
| Age Bracket | Male | Female |
| 5 to 17 Years | 38 (2.3%) | 0 (0.0%) |
| 18 to 34 Years | 0 (0.0%) | 0 (0.0%) |
| 35 to 64 Years | 76 (2.0%) | 79 (1.9%) |
| 65 to 74 Years | 0 (0.0%) | 11 (0.9%) |
| 75 Years and over | 24 (3.1%) | 144 (18.5%) |
Technology Access in Elmwood Park borough
Computing Device Access in Elmwood Park borough
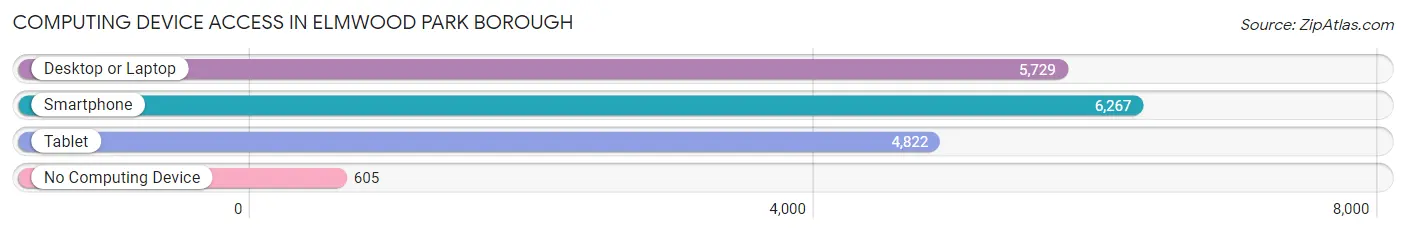
| Device Type | # Households | % Households |
| Desktop or Laptop | 5,729 | 79.3% |
| Smartphone | 6,267 | 86.8% |
| Tablet | 4,822 | 66.8% |
| No Computing Device | 605 | 8.4% |
| Total | 7,220 | 100.0% |
Internet Access in Elmwood Park borough
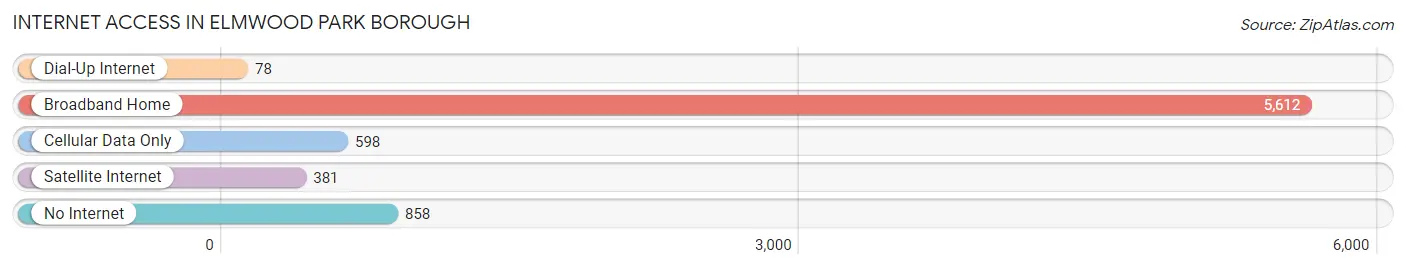
| Internet Type | # Households | % Households |
| Dial-Up Internet | 78 | 1.1% |
| Broadband Home | 5,612 | 77.7% |
| Cellular Data Only | 598 | 8.3% |
| Satellite Internet | 381 | 5.3% |
| No Internet | 858 | 11.9% |
| Total | 7,220 | 100.0% |
Elmwood Park borough Summary
Elmwood Park Borough is a small borough located in Bergen County, New Jersey. It is situated in the northeastern part of the state, just west of the Hudson River and north of the city of Newark. The borough is bordered by the towns of Fair Lawn, Garfield, Saddle Brook, and Wallington. The population of Elmwood Park was 19,403 as of the 2010 census.
History
The area that is now Elmwood Park was originally inhabited by the Lenni Lenape Native Americans. The first European settlers arrived in the area in the late 17th century. The area was part of Saddle River Township until 1894, when it was incorporated as the Borough of Elmwood Park. The borough was named after the elm trees that lined the streets of the town.
Geography
Elmwood Park is located at 40°53'N 74°07'W (40.88, -74.12). According to the United States Census Bureau, the borough has a total area of 2.2 square miles (5.7 km2), all of which is land.
Economy
The economy of Elmwood Park is largely based on retail and services. The borough is home to several shopping centers, including the Elmwood Park Shopping Center, the Elmwood Park Plaza, and the Elmwood Park Mall. The borough also has a number of restaurants, bars, and other businesses.
Demographics
As of the 2010 census, there were 19,403 people, 7,845 households, and 5,072 families residing in the borough. The population density was 8,717.3 people per square mile (3,370.2/km2). There were 8,245 housing units at an average density of 3,717.3 per square mile (1,437.2/km2). The racial makeup of the borough was 79.2% White, 4.2% African American, 0.2% Native American, 9.2% Asian, 0.1% Pacific Islander, 4.7% from other races, and 2.5% from two or more races. Hispanic or Latino of any race were 18.2% of the population.
There were 7,845 households, out of which 28.2% had children under the age of 18 living with them, 47.2% were married couples living together, 12.7% had a female householder with no husband present, and 34.7% were non-families. 29.2% of all households were made up of individuals, and 11.7% had someone living alone who was 65 years of age or older. The average household size was 2.46 and the average family size was 3.08.
In the borough, the population was spread out, with 21.2% under the age of 18, 8.2% from 18 to 24, 30.2% from 25 to 44, 24.2% from 45 to 64, and 16.2% who were 65 years of age or older. The median age was 38 years. For every 100 females, there were 93.2 males. For every 100 females age 18 and over, there were 90.2 males.
The median income for a household in the borough was $50,945, and the median income for a family was $60,945. Males had a median income of $41,945 versus $32,945 for females. The per capita income for the borough was $25,945. About 5.2% of families and 7.2% of the population were below the poverty line, including 9.2% of those under age 18 and 6.2% of those age 65 or over.
Common Questions
What is Per Capita Income in Elmwood Park borough?
Per Capita income in Elmwood Park borough is $36,519.
What is the Median Family Income in Elmwood Park borough?
Median Family Income in Elmwood Park borough is $96,818.
What is the Median Household income in Elmwood Park borough?
Median Household Income in Elmwood Park borough is $84,578.
What is Income or Wage Gap in Elmwood Park borough?
Income or Wage Gap in Elmwood Park borough is 23.6%.
Women in Elmwood Park borough earn 76.4 cents for every dollar earned by a man.
What is Family Income Deficit in Elmwood Park borough?
Family Income Deficit in Elmwood Park borough is $14,494.
Families that are below poverty line in Elmwood Park borough earn $14,494 less on average than the poverty threshold level.
What is Inequality or Gini Index in Elmwood Park borough?
Inequality or Gini Index in Elmwood Park borough is 0.42.
What is the Total Population of Elmwood Park borough?
Total Population of Elmwood Park borough is 21,261.
What is the Total Male Population of Elmwood Park borough?
Total Male Population of Elmwood Park borough is 10,075.
What is the Total Female Population of Elmwood Park borough?
Total Female Population of Elmwood Park borough is 11,186.
What is the Ratio of Males per 100 Females in Elmwood Park borough?
There are 90.07 Males per 100 Females in Elmwood Park borough.
What is the Ratio of Females per 100 Males in Elmwood Park borough?
There are 111.03 Females per 100 Males in Elmwood Park borough.
What is the Median Population Age in Elmwood Park borough?
Median Population Age in Elmwood Park borough is 39.1 Years.
What is the Average Family Size in Elmwood Park borough
Average Family Size in Elmwood Park borough is 3.4 People.
What is the Average Household Size in Elmwood Park borough
Average Household Size in Elmwood Park borough is 2.9 People.
How Large is the Labor Force in Elmwood Park borough?
There are 11,575 People in the Labor Forcein in Elmwood Park borough.
What is the Percentage of People in the Labor Force in Elmwood Park borough?
67.4% of People are in the Labor Force in Elmwood Park borough.
What is the Unemployment Rate in Elmwood Park borough?
Unemployment Rate in Elmwood Park borough is 6.6%.